Policies to Harness the Power of Natural Resources
Policies to Harness the Power of Natural Resources
Policies to Harness the Power of Natural Resources

Create successful ePaper yourself
Turn your PDF publications into a flip-book with our unique Google optimized e-Paper software.
Beyond <strong>the</strong> Curse<br />
<strong>Policies</strong> <strong>to</strong> <strong>Harness</strong> <strong>the</strong> <strong>Power</strong><br />
<strong>of</strong> <strong>Natural</strong> <strong>Resources</strong><br />
EDITORS<br />
Rabah Arezki, Thorvaldur Gylfason,<br />
and Amadou Sy<br />
I N T E R N A T I O N A L M O N E T A R Y F U N D<br />
©International Monetary Fund. Not for Redistribution
Cataloging-in-Publication Data<br />
© 2011 International Monetary Fund<br />
Beyond <strong>the</strong> curse : policies <strong>to</strong> harness <strong>the</strong> power <strong>of</strong> natural resources / edi<strong>to</strong>rs, Rabah<br />
Arezki, Thorvaldur Gylfason, and Amadou Sy. – Washing<strong>to</strong>n, DC : International<br />
Monetary Fund, 2011.<br />
p. ; cm.<br />
This book is based on a high level seminar on natural resource, finance and<br />
development, IMF Institute and Central Bank <strong>of</strong> Algeria, Algiers, November, 4-5, 2010.<br />
Includes bibliographical references.<br />
ISBN 978-1-61635-145-8<br />
1. <strong>Natural</strong> resources. 2. Resource curse. 3. Fiscal policy. 4. Monetary policy.<br />
5. Foreign exchange rates. 6. Diversification in industry. 7. Economic development.<br />
8. Primary commodities. 9. Prices. 10. Exports. 11. Finance. 12. Financial institutions.<br />
13. Sovereign wealth funds. I. Arezki, Rabah. II. Gylfason, Thorvaldur, 1951-.<br />
III. Sy, Amadou N. R. IV. International Monetary Fund.<br />
HC85.B49 2011<br />
Disclaimer: The views expressed in this book are those <strong>of</strong> <strong>the</strong> authors and should not be<br />
reported as or attributed <strong>to</strong> <strong>the</strong> International Monetary Fund, its Executive Board, or <strong>the</strong><br />
governments <strong>of</strong> any <strong>of</strong> its member countries.<br />
Please send orders <strong>to</strong>:<br />
International Monetary Fund, Publication Services<br />
P.O. Box 92780, Washing<strong>to</strong>n, DC 20090, U.S.A.<br />
Tel: (202) 623-7430 Fax: (202) 623-7201<br />
Email: publications@imf.org<br />
Internet: www.imfbooks<strong>to</strong>re.org<br />
Cover design: Lai Oy Louie, IMF Multimedia Services Division<br />
©International Monetary Fund. Not for Redistribution
Contents<br />
Foreword vii<br />
Acknowledgments ix<br />
Abbreviations and Acronyms xi<br />
1<br />
Part I<br />
2<br />
3<br />
Part II<br />
4<br />
Overview ............................................................................................................................1<br />
Leslie Lipschitz<br />
COMMODITY MARKETS<br />
AND THE MACROECONOMY .......................................................5<br />
<strong>Natural</strong> Resource Endowment: A Mixed Blessing? .............................................7<br />
Thorvaldur Gylfason<br />
Introduction ...........................................................................................................................................................................................................7<br />
Policy Issues in <strong>Natural</strong>-Resource-Rich Countries .......................................................................................................................11<br />
Norway and O<strong>the</strong>r Success S<strong>to</strong>ries ......................................................................................................................................................20<br />
From Anecdotes <strong>to</strong> Empirical Testing .................................................................................................................................................26<br />
Conclusion ...........................................................................................................................................................................................................31<br />
References ............................................................................................................................................................................................................33<br />
Primary Commodities: His<strong>to</strong>rical Perspectives and Prospects ...................35<br />
Marian Radetzki<br />
Primary Commodities in <strong>the</strong> Economic Development Process .........................................................................................35<br />
Falling Transport Costs and Globalizing Markets .........................................................................................................................39<br />
The Entry and Exit <strong>of</strong> <strong>the</strong> State in <strong>the</strong> Commodity Sec<strong>to</strong>r in <strong>the</strong> 20th Century ......................................................42<br />
Real Prices: Falling Long-Run Trends and Short-Run Instability .........................................................................................45<br />
Policy Implications for Commodity-Exporting Nations ...........................................................................................................48<br />
References ............................................................................................................................................................................................................50<br />
ECONOMIC DIVERSIFICATION<br />
AND THE ROLE OF FINANCE ....................................................53<br />
Economic Diversification in Resource-Rich Countries ...................................55<br />
Alan Gelb<br />
Introduction ........................................................................................................................................................................................................55<br />
Why Diversify? ....................................................................................................................................................................................................59<br />
The Resource Curse: A Diversification Perspective .....................................................................................................................62<br />
The Examples <strong>of</strong> Malaysia, Indonesia, Chile, and Dubai ..........................................................................................................69<br />
Some Common Fac<strong>to</strong>rs in Success ......................................................................................................................................................74<br />
Conclusions .........................................................................................................................................................................................................76<br />
References ............................................................................................................................................................................................................78<br />
©International Monetary Fund. Not for Redistribution<br />
iii
iv Contents<br />
5<br />
6<br />
Part III<br />
7<br />
8<br />
9<br />
Finance and Oil: Is There a Resource Curse? ......................................................81<br />
Thorsten Beck<br />
Introduction ........................................................................................................................................................................................................81<br />
Finance and Growth: Is There a <strong>Natural</strong> Resource Discount? ..............................................................................................85<br />
Finance and <strong>Natural</strong> <strong>Resources</strong>—Is There a Resource Curse?.............................................................................................90<br />
Banks in Resource-Based Economies ..................................................................................................................................................95<br />
Access <strong>to</strong> Finance in Resource-Based Economies ......................................................................................................................98<br />
Summary and Policy Implications......................................................................................................................................................103<br />
References .........................................................................................................................................................................................................104<br />
The Economics <strong>of</strong> Sovereign Wealth Funds:<br />
Lessons from Norway ...............................................................................................107<br />
Thomas Ekeli and Amadou N.R. Sy<br />
Introduction .....................................................................................................................................................................................................107<br />
The Economics <strong>of</strong> Sovereign Wealth Funds.................................................................................................................................108<br />
The (Long) Road <strong>to</strong> a Sovereign Wealth Fund............................................................................................................................109<br />
Sovereign Wealth Management..........................................................................................................................................................111<br />
Conclusions and Policy Implications ................................................................................................................................................114<br />
References .........................................................................................................................................................................................................115<br />
FISCAL POLICY .............................................................................117<br />
Primary Commodity Price Series: Lessons for Policymakers<br />
in Resource-Rich Countries ....................................................................................119<br />
Kaddour Hadri<br />
Introduction .....................................................................................................................................................................................................119<br />
Empirical Evidence .......................................................................................................................................................................................122<br />
What Can Policymakers Do <strong>to</strong> Counter These Three Challenges? ................................................................................127<br />
Summary ............................................................................................................................................................................................................129<br />
References .........................................................................................................................................................................................................129<br />
Sustainable Fiscal Policy for Mineral-Based Economies ..............................131<br />
Kirk Hamil<strong>to</strong>n and Eduardo Ley<br />
Introduction .....................................................................................................................................................................................................131<br />
Measuring Economic Performance ...................................................................................................................................................132<br />
Achieving Economic and Fiscal Sustainability ...........................................................................................................................135<br />
Conclusions and Policy Implications ................................................................................................................................................144<br />
Appendix ............................................................................................................................................................................................................145<br />
References .........................................................................................................................................................................................................147<br />
Fiscal Policy In Commodity-Exporting Countries:<br />
Stability and Growth ................................................................................................149<br />
Rabah Arezki<br />
Introduction .....................................................................................................................................................................................................149<br />
Data .......................................................................................................................................................................................................................152<br />
Estimation Strategy and Main Results .............................................................................................................................................153<br />
Conclusion ........................................................................................................................................................................................................160<br />
References .........................................................................................................................................................................................................161<br />
©International Monetary Fund. Not for Redistribution
Part IV<br />
10<br />
11<br />
12<br />
Part V<br />
13<br />
Contents v<br />
EXCHANGE RATES AND FINANCIAL STABILITY ..............165<br />
How Can Commodity Exporters Make Fiscal<br />
and Monetary Policy Less Procyclical? ..............................................................167<br />
Jeffrey Frankel<br />
The Problem <strong>of</strong> Procyclicality ................................................................................................................................................................167<br />
Proposal <strong>to</strong> Make Fiscal Policy More Countercyclical: Emulate Chile’s Structural<br />
Budget Rule Institutions ...........................................................................................................................................................................173<br />
Proposal <strong>to</strong> Make Monetary Policy More Countercyclical: Product Price Targeting ..........................................179<br />
Summary ............................................................................................................................................................................................................187<br />
References .........................................................................................................................................................................................................189<br />
<strong>Natural</strong> <strong>Resources</strong> Management and Financial Stability:<br />
Evidence from Algeria..............................................................................................193<br />
Mohammed Laksaci<br />
Introduction .....................................................................................................................................................................................................193<br />
External Shocks and Financial Instability .......................................................................................................................................194<br />
Adoption <strong>of</strong> Prudent Macroeconomic Management for Increased <strong>Resources</strong> ....................................................196<br />
Financing for <strong>the</strong> Economy in a Context <strong>of</strong> Prudent Resource Management ......................................................197<br />
Streng<strong>the</strong>ning <strong>the</strong> Framework for Financial Stability: Outlook for <strong>the</strong><br />
Macroprudential Approach ....................................................................................................................................................................200<br />
Copper, The Real Exchange Rate and Macroeconomic Fluctuations<br />
in Chile ...........................................................................................................................203<br />
José De Gregorio and Felipe Labbé<br />
Introduction .....................................................................................................................................................................................................203<br />
Copper in <strong>the</strong> Chilean Economy .........................................................................................................................................................205<br />
Fiscal Policy and Copper ..........................................................................................................................................................................209<br />
Economic Fluctuations and <strong>the</strong> Copper Cycle ..........................................................................................................................213<br />
Terms-<strong>of</strong>-Trade Shocks, Real Exchange Rate, and Long-Run Dynamics ....................................................................218<br />
Macroeconomic Fluctuations and Real Exchange Rate Volatility ..................................................................................223<br />
Simulation <strong>of</strong> a Copper Price Shock Using a DSGE Model .................................................................................................227<br />
Concluding Remarks...................................................................................................................................................................................229<br />
References .........................................................................................................................................................................................................230<br />
Appendix A .......................................................................................................................................................................................................232<br />
Appendix B .......................................................................................................................................................................................................233<br />
GOVERNANCE AND INSTITUTIONAL ASPECTS ..............235<br />
The Political Economy <strong>of</strong> Reform in Resource-Rich Countries .................237<br />
Ragnar Torvik<br />
Introduction .....................................................................................................................................................................................................237<br />
How Do Countries Reform When They Receive Resource Rents? .................................................................................238<br />
How Should Countries Reform When They Receive Resource Rents? ........................................................................239<br />
Which Reforms? .............................................................................................................................................................................................244<br />
The Design <strong>of</strong> Petroleum Funds and Political Incentives ....................................................................................................246<br />
Conclusion ........................................................................................................................................................................................................254<br />
References .........................................................................................................................................................................................................254<br />
©International Monetary Fund. Not for Redistribution
vi Contents<br />
14<br />
Terms <strong>of</strong> Trade and Growth <strong>of</strong> Resource Economies:<br />
Contrasting Evidence from Two African Countries .......................................257<br />
Augustin Kwasi Fosu and Anthony Owusu Gyapong<br />
Introduction .....................................................................................................................................................................................................257<br />
Theoretical Discussion ...............................................................................................................................................................................259<br />
Empirical Model .............................................................................................................................................................................................264<br />
Some Lessons and Concluding Observations............................................................................................................................268<br />
References .........................................................................................................................................................................................................272<br />
©International Monetary Fund. Not for Redistribution
Foreword<br />
The global economy is going through dramatic changes, with major implications<br />
for <strong>the</strong> demand for natural resources. Over <strong>the</strong> coming years, emerging economies<br />
will increasingly drive global growth. Many countries will take steps <strong>to</strong> adapt<br />
<strong>to</strong> climate change. And <strong>the</strong>re will be fur<strong>the</strong>r technological advances in extractive<br />
industries. Such changes will clearly impact <strong>the</strong> demand for natural resources.<br />
A perennial challenge for commodity exporters has been how <strong>to</strong> manage <strong>the</strong><br />
impact <strong>of</strong> volatile commodity prices on macroeconomic and financial stability.<br />
Even though commodity prices have stabilized somewhat since <strong>the</strong> Great<br />
Recession, volatility is sure <strong>to</strong> return—and is already back in agricultural commodity<br />
markets. This underscores <strong>the</strong> importance <strong>of</strong> having <strong>the</strong> right macroeconomic<br />
policies <strong>to</strong> manage this volatility. Financial <strong>to</strong>ols, including hedging strategies,<br />
clearly matter <strong>to</strong>o.<br />
Ano<strong>the</strong>r challenge is how <strong>to</strong> increase competitiveness. <strong>Natural</strong>-resource-rich<br />
countries run a risk <strong>of</strong> contracting “Dutch disease”—<strong>the</strong> phenomenon <strong>of</strong> large<br />
commodity exports leading <strong>to</strong> an appreciation <strong>of</strong> <strong>the</strong> real exchange rate, which in<br />
turn slows productivity growth in o<strong>the</strong>r sec<strong>to</strong>rs <strong>of</strong> <strong>the</strong> economy. This weakens<br />
competitiveness and holds back economic diversification—leaving <strong>the</strong> economy<br />
overly dependent on <strong>the</strong> natural resource sec<strong>to</strong>r.<br />
But perhaps <strong>the</strong> most fundamental challenge is how <strong>to</strong> ensure that natural<br />
resource wealth is used wisely and shared fairly across society. <strong>Natural</strong>-resourcerich<br />
countries have been blessed with tremendous natural wealth. And yet in<br />
many <strong>of</strong> <strong>the</strong>m, unemployment is high—especially among <strong>the</strong> young—and millions<br />
remain in poverty. It seems only right that <strong>the</strong>se countries’ natural riches<br />
should be used <strong>to</strong> tackle constraints on growth and development, <strong>to</strong> create <strong>the</strong><br />
decent jobs needed <strong>to</strong> raise living standards.<br />
Much greater investment in physical, human, and institutional capital is<br />
clearly needed <strong>to</strong> boost productivity and raise competitiveness. This should be<br />
supported by structural reforms that tackle constraints on entrepreneurship and<br />
that improve <strong>the</strong> business climate.<br />
At <strong>the</strong> same time, spending should be at a measured pace. This will safeguard<br />
macroeconomic stability, which includes maintaining <strong>the</strong> real exchange rate at a<br />
fair level. It will also allow future generations <strong>to</strong> benefit from <strong>the</strong> revenues earned<br />
from exhaustible natural resources <strong>to</strong>day.<br />
Strong institutions will play a critical role in ensuring that well-designed policies<br />
are indeed effective. Strong fiscal institutions help prevent excess spending in<br />
times <strong>of</strong> plenty—thus leaving enough resources for times <strong>of</strong> want. And strong<br />
financial institutions help manage <strong>the</strong> impact <strong>of</strong> spikes in capital inflows on <strong>the</strong><br />
broader economy. Sound management <strong>of</strong> foreign exchange reserves is a critical<br />
complement in this regard.<br />
©International Monetary Fund. Not for Redistribution<br />
vii
viii Foreword<br />
Unfortunately, strong institutions have been missing in many resource-rich<br />
economies. As a result, economic performance in many countries with abundant<br />
natural resources has been quite poor; and even where economies have grown,<br />
unemployment, inequality, and <strong>the</strong> resulting tensions have <strong>of</strong>ten undermined<br />
social progress. Partly as a result, <strong>the</strong> blessing <strong>of</strong> resource riches has <strong>to</strong>o <strong>of</strong>ten<br />
turned in<strong>to</strong> <strong>the</strong> curse <strong>of</strong> conflict.<br />
A strong commitment <strong>to</strong> good governance lies at <strong>the</strong> heart <strong>of</strong> responsible<br />
management <strong>of</strong> natural resource wealth. Good governance helps ensure that commodity<br />
revenues can benefit all in society. This is why institutions with a high<br />
level <strong>of</strong> accountability are so important. The experiences <strong>of</strong> countries like<br />
Botswana, Chile, and Indonesia show <strong>the</strong> important role that strong, independent,<br />
and accountable institutions can play in resource-rich countries. I also<br />
firmly believe that a vigorous civil society is critical for achieving—and maintaining—a<br />
high standard <strong>of</strong> accountability.<br />
Transparency is an important first step in ensuring accountability—and an<br />
issue that <strong>the</strong> IMF is helping <strong>to</strong> promote. To support our members’ efforts in this<br />
area, <strong>the</strong> IMF developed <strong>the</strong> Guide on Resource Revenue Transparency and <strong>the</strong><br />
Code <strong>of</strong> Good Practices on Fiscal Transparency. The IMF also provides technical<br />
assistance and training <strong>to</strong> its members, drawing on its deep experience <strong>of</strong> working<br />
on <strong>the</strong>se issues all over <strong>the</strong> world.<br />
The IMF remains committed <strong>to</strong> working with all its members, resource-rich<br />
and resource-poor, <strong>to</strong> tackle <strong>the</strong> policy challenges <strong>of</strong> this new global economy. It<br />
is my hope that publications like this one—alongside, <strong>of</strong> course, our close bilateral<br />
relations with our members—will contribute <strong>to</strong> supporting a strong and<br />
stable global recovery, <strong>to</strong> <strong>the</strong> benefit <strong>of</strong> all nations <strong>of</strong> <strong>the</strong> world.<br />
Christine Lagarde<br />
Managing Direc<strong>to</strong>r<br />
International Monetary Fund<br />
©International Monetary Fund. Not for Redistribution
Acknowledgments<br />
This book is <strong>the</strong> culmination <strong>of</strong> <strong>the</strong> efforts <strong>of</strong> many policymakers, academics, and<br />
World Bank and IMF staff. Their coming <strong>to</strong>ge<strong>the</strong>r during <strong>the</strong> high-level seminar<br />
organized by <strong>the</strong> Bank <strong>of</strong> Algeria and <strong>the</strong> IMF Institute in Algiers on November 4<br />
<strong>to</strong> 5, 2010, has been instrumental in fostering <strong>the</strong> understanding <strong>of</strong> how countries<br />
can manage <strong>the</strong> challenges <strong>of</strong> natural resource wealth so as <strong>to</strong> reap <strong>the</strong> benefits<br />
while avoiding <strong>the</strong> pitfalls.<br />
This book would not have been possible without <strong>the</strong> support and encouragement<br />
<strong>of</strong> Leslie Lipschitz, direc<strong>to</strong>r <strong>of</strong> <strong>the</strong> IMF Institute and Mohammed Laksaci,<br />
Governor <strong>of</strong> <strong>the</strong> Bank <strong>of</strong> Algeria. We are grateful <strong>to</strong> Joanne Blake <strong>of</strong> <strong>the</strong> IMF’s<br />
External Relations Department for coordinating <strong>the</strong> production <strong>of</strong> <strong>the</strong> book.<br />
Last, but not least, we would like <strong>to</strong> thank a large number <strong>of</strong> colleagues at <strong>the</strong><br />
IMF and staff at <strong>the</strong> Bank <strong>of</strong> Algeria for <strong>the</strong>ir support.<br />
Rabah Arezki, Thorvaldur Gylfason, and Amadou Sy<br />
©International Monetary Fund. Not for Redistribution<br />
ix
This page intentionally left blank<br />
©International Monetary Fund. Not for Redistribution
Abbreviations and Acronyms<br />
aNNI adjusted net national income<br />
CPI Consumer Price Index<br />
FDI foreign direct investment<br />
GCC Gulf Cooperation Council<br />
GNI gross national income<br />
IT information technology<br />
LNG liquid natural gas<br />
NRF natural resource fund<br />
OECD Organisation for Economic Co-operation and Development<br />
OPEC Organization <strong>of</strong> <strong>the</strong> Petroleum Exporting Countries<br />
PPP purchasing power parity<br />
PPT product price targeting<br />
R&D research and development<br />
RER real exchange rate<br />
SNA System <strong>of</strong> National Accounts<br />
SWF sovereign wealth fund<br />
UNCTAD United Nations Conference on Trade and Development<br />
UNDP United Nations Development Programme<br />
©International Monetary Fund. Not for Redistribution<br />
xi
This page intentionally left blank<br />
©International Monetary Fund. Not for Redistribution
Overview<br />
LESLIE LIPSCHITZ<br />
CHAPTER 1<br />
This book is based on a high-level seminar that <strong>to</strong>ok place in Algiers on November<br />
4th and 5th, 2010, under <strong>the</strong> title, “<strong>Natural</strong> <strong>Resources</strong>, Finance, and Development:<br />
Confronting Old and New Challenges.” The seminar, organized by <strong>the</strong> Central<br />
Bank <strong>of</strong> Algeria and <strong>the</strong> IMF Institute, was aimed chiefly at policymakers in sub-<br />
Saharan Africa, and brought <strong>to</strong>ge<strong>the</strong>r a number <strong>of</strong> ministers, central bank governors,<br />
o<strong>the</strong>r senior policymakers, and well-known academics.<br />
Countries that have an abundance <strong>of</strong> natural resources—and this includes<br />
many countries in sub-Saharan Africa—<strong>of</strong>ten show a record <strong>of</strong> relatively poor<br />
economic performance compared with non-resource-rich countries. The consensus<br />
in both academic and policy circles is that <strong>the</strong> presence <strong>of</strong> abundant natural<br />
resources poses a number <strong>of</strong> potential challenges <strong>to</strong> <strong>the</strong>se countries. Six <strong>of</strong> <strong>the</strong>m<br />
can be readily identified: (i) a loss <strong>of</strong> competitiveness in potentially dynamic, nonnatural<br />
resource sec<strong>to</strong>rs, (ii) a consequent narrowing <strong>of</strong> <strong>the</strong> production base, (iii)<br />
excessive reliance on commodities for both government revenues and export earnings,<br />
(iv) high vulnerability <strong>to</strong> fluctuations in commodity prices, (v) macroeconomic<br />
and financial volatility, and (vi) rent-seeking behavior that can undermine<br />
governance and exacerbate <strong>the</strong> difficulty <strong>of</strong> building robust, growth-enabling<br />
institutions. The seminar focused on how <strong>to</strong> manage <strong>the</strong>se challenges so as <strong>to</strong> reap<br />
<strong>the</strong> benefits <strong>of</strong> resource wealth while avoiding <strong>the</strong> pitfalls.<br />
Starting from a diagnosis <strong>of</strong> <strong>the</strong> wide range <strong>of</strong> challenges <strong>to</strong> macroeconomic<br />
management and financial policies that resource-rich countries face, <strong>the</strong> seminar<br />
sought <strong>to</strong> propose solutions that are context-specific, drawn from <strong>the</strong> most successful<br />
experiences, and capable <strong>of</strong> being implemented in Africa. Discussed at <strong>the</strong><br />
seminar, <strong>the</strong>refore, were fiscal, monetary and exchange rate policies; savings policies;<br />
institutional arrangements <strong>to</strong> safeguard economies against volatility; economic<br />
diversification; and institution building.<br />
Leslie Lipschitz is direc<strong>to</strong>r <strong>of</strong> <strong>the</strong> IMF Institute. He can be contacted at LLipschitz@imf.org.<br />
©International Monetary Fund. Not for Redistribution<br />
1
2 Overview<br />
THE BROAD PERSPECTIVE<br />
The consensus among both speakers and participants at <strong>the</strong> seminar was that<br />
government revenues derived from natural resource extraction should be used<br />
conservatively in order <strong>to</strong> avoid excessive real appreciation and <strong>to</strong> safeguard intergenerational<br />
equity. Preserving intergenerational equity requires saving and<br />
investing a large part <strong>of</strong> <strong>the</strong> proceeds <strong>to</strong> benefit future generations. At <strong>the</strong> same<br />
time, when investing <strong>the</strong>se proceeds, it is not easy <strong>to</strong> make <strong>the</strong> choice between<br />
investing in external financial assets and investing in domestic physical and<br />
human capital (including infrastructure). A deliberate and measured pace <strong>of</strong><br />
domestic spending, carefully focused on absorptive capacity, can limit real appreciation<br />
and attenuate <strong>the</strong> negative consequences <strong>to</strong> <strong>the</strong> economy’s tradable sec<strong>to</strong>r.<br />
Moreover, his<strong>to</strong>ry is replete with examples <strong>of</strong> large government spending programs<br />
that have been inefficient and wasteful.<br />
Knowledgeable senior <strong>of</strong>ficials at <strong>the</strong> seminar from Norway, Chile, Botswana,<br />
and Mexico outlined <strong>the</strong> his<strong>to</strong>ry <strong>of</strong> how <strong>the</strong>ir governments addressed <strong>the</strong> problems<br />
posed by <strong>the</strong> existence <strong>of</strong> natural resources. Their measures included conducting<br />
countercyclical fiscal policies and setting up institutions that limit<br />
rent-seeking behavior.<br />
While seminar participants were cautious about spending policies, <strong>the</strong>y recognized<br />
that populations in low-income countries have high expectations regarding<br />
higher public spending. Large resource windfalls <strong>of</strong>ten trigger political pressures<br />
<strong>to</strong> enlarge government spending, in particular in countries with vulnerable populations.<br />
Managing those expectations is an important task in all resource-rich<br />
countries, and particularly in those with recently discovered resources.<br />
MANAGEMENT OF THE EXTRACTION<br />
All countries with significant natural resources, especially those whose resources<br />
are recently discovered, must choose between putting <strong>the</strong> extraction activity in <strong>the</strong><br />
hands <strong>of</strong> multinational companies or keeping it in <strong>the</strong> hands <strong>of</strong> state-owned<br />
companies. The weight <strong>of</strong> country experiences worldwide tilts <strong>the</strong> balance in<br />
favor <strong>of</strong> leaving <strong>the</strong> extraction as much as possible <strong>to</strong> <strong>the</strong> private sec<strong>to</strong>r, provided<br />
that (i) <strong>the</strong> companies are selected on a competitive basis, and (ii) <strong>the</strong> government<br />
has <strong>the</strong> capacity <strong>to</strong> ensure that contract negotiations lead <strong>to</strong> a balanced deal where<br />
<strong>the</strong> short- and medium-term objectives <strong>of</strong> both parties are reconciled. Indeed,<br />
such an “optimal contract” would ensure that <strong>the</strong> inherent time-inconsistency<br />
problem is addressed. In o<strong>the</strong>r words, governments in resource-rich countries<br />
should credibly commit not <strong>to</strong> expropriate for <strong>the</strong>mselves foreign investments<br />
after <strong>the</strong>y have been sunk in exploration and extraction. In this discussion, many<br />
countries around <strong>the</strong> table recognized <strong>the</strong>ir lack <strong>of</strong> capacity <strong>to</strong> negotiate such<br />
contracts and expressed a need for independent international advice and assistance<br />
in this crucial area.<br />
©International Monetary Fund. Not for Redistribution
FISCAL POLICY<br />
Lipschitz 3<br />
Taxes on rents are relatively efficient and less dis<strong>to</strong>rting. Therefore, higher levels<br />
<strong>of</strong> taxation in <strong>the</strong> natural resource sec<strong>to</strong>r make sense and facilitate lower taxes in<br />
o<strong>the</strong>r sec<strong>to</strong>rs. However, this usually leads <strong>to</strong> a structure <strong>of</strong> government revenues<br />
that is dependent on commodity prices and earnings and so can be highly volatile.<br />
There is <strong>the</strong>refore a need <strong>to</strong> establish medium-term spending plans, <strong>to</strong> decouple<br />
current spending from volatile government revenues, and <strong>to</strong> enact a strategy for<br />
countercyclical fiscal policy (especially because capital flows that also respond <strong>to</strong><br />
current account strength, and thus commodity prices, can exacerbate cyclicality).<br />
Fiscal institutions have proven <strong>to</strong> be instrumental in achieving such decoupling<br />
between spending programs and revenues. For countries that cannot establish<br />
institutional arrangements capable <strong>of</strong> credibly committing <strong>to</strong> countercyclical fiscal<br />
policies, <strong>the</strong> use <strong>of</strong> financial instruments—such as <strong>the</strong> Asian puts used <strong>to</strong> hedge<br />
government oil revenues in Mexico—are an effective second-best policy option.<br />
MONETARY POLICY AND EXCHANGE RATE<br />
Chile’s floating exchange rate coupled with an inflation-targeting regime has<br />
proved remarkably successful in recent years at sheltering <strong>the</strong> economy from<br />
external shocks. Many African countries are fearful <strong>of</strong> embarking on a fully flexible<br />
exchange rate regime, however. This is not <strong>the</strong> so-called “fear <strong>of</strong> floating” in<br />
<strong>the</strong> conventional sense—when a degree <strong>of</strong> fixity leads <strong>to</strong> foreign exchange liabilities<br />
that constitute a balance-sheet disincentive <strong>to</strong> floating—but simply a<br />
reluctance <strong>to</strong> embark on major institutional change based on a belief that <strong>the</strong><br />
supportive institutional structure will take time <strong>to</strong> prepare. It is clear that a more<br />
gradualist path <strong>to</strong> exchange-rate flexibility with inflation targeting will be pursued<br />
in many countries, with all <strong>the</strong> transitional difficulties that this will entail. In fact,<br />
<strong>the</strong> experience <strong>of</strong> Ghana, which adopted inflation targeting with limited<br />
exchange-rate flexibility in 2002–03, clearly illustrates this point.<br />
The seminar stimulated much discussion about how <strong>to</strong> sterilize current<br />
account inflows (at times <strong>of</strong> high commodity prices) and <strong>the</strong> capital inflows that<br />
are correlated with <strong>the</strong>se windfalls. Because <strong>the</strong>ir equilibrium domestic interest<br />
rates are almost always higher than those in advanced countries, in resource-rich<br />
countries <strong>the</strong> costs <strong>of</strong> sterilization can be significant and can create tensions<br />
between <strong>the</strong> fiscal authorities and <strong>the</strong> central bank. As <strong>the</strong> case <strong>of</strong> Botswana makes<br />
clear, however, ins<strong>of</strong>ar as periods <strong>of</strong> high commodity prices are also periods <strong>of</strong><br />
large government surpluses held at <strong>the</strong> central bank, a properly managed countercyclical<br />
fiscal policy will provide a degree <strong>of</strong> au<strong>to</strong>matic sterilization.<br />
ECONOMIC DIVERSIFICATION<br />
Experiences with industrial policy around <strong>the</strong> world suggest that it is not a<br />
straightforward matter <strong>to</strong> design an appropriate incentive structure <strong>to</strong> help lay <strong>the</strong><br />
©International Monetary Fund. Not for Redistribution
4 Overview<br />
groundwork for economic diversification in resource-rich countries. Seminar<br />
participants recognized that some government intervention is unavoidable but<br />
also stressed that such policies should be tailored <strong>to</strong> <strong>the</strong> context <strong>of</strong> each economy.<br />
It was also recognized that <strong>to</strong>o-active industrial policies would open <strong>the</strong> door <strong>to</strong><br />
corruption and thus risk undermining <strong>the</strong> broader institutional framework.<br />
From <strong>the</strong> discussions certain things emerged that are clearly undesirable, such<br />
as commodity rents that are distributed through very high government salaries,<br />
which would have a detrimental effect on private sec<strong>to</strong>r development. On <strong>the</strong><br />
o<strong>the</strong>r hand, low, predictable, and non-dis<strong>to</strong>rting tax rates on entrepreneurial<br />
activity could help foster diversification. Similarly, <strong>the</strong> use <strong>of</strong> commodity proceeds<br />
<strong>to</strong> establish a supportive physical and social infrastructure could raise returns and<br />
encourage private investment in o<strong>the</strong>r sec<strong>to</strong>rs.<br />
INSTITUTIONAL ASPECTS<br />
The existence <strong>of</strong> natural resources tends <strong>to</strong> dis<strong>to</strong>rt <strong>the</strong> allocation <strong>of</strong> talent.<br />
Especially in countries with weak institutions, talent tends <strong>to</strong> shift out <strong>of</strong> private<br />
entrepreneurial activity and in<strong>to</strong> more lucrative rent-seeking areas, with harmful<br />
implications for sustainable growth. Participants in <strong>the</strong> seminar spent a good deal<br />
<strong>of</strong> time focusing on how institutions should be designed <strong>to</strong> guard against such<br />
developments. For example, strong and reliable property rights can foster financial<br />
sec<strong>to</strong>r development, allowing <strong>the</strong> financial system <strong>to</strong> play a more active and<br />
significant role in mediating resources <strong>to</strong> help build small- and medium-size<br />
enterprises in <strong>the</strong> non-resource-rich sec<strong>to</strong>rs <strong>of</strong> <strong>the</strong> economy. More generally,<br />
checks and balances and greater transparency in managing natural resource revenues<br />
can help counteract <strong>the</strong> misallocation <strong>of</strong> talent in<strong>to</strong> unproductive activities.<br />
However, it was acknowledged that <strong>the</strong> problem was less difficult in countries<br />
with mature industrial economies than in those that were least developed when<br />
mineral resources were discovered. This, if anything, merely underscored <strong>the</strong><br />
importance <strong>of</strong> a careful approach <strong>to</strong> institution building.<br />
©International Monetary Fund. Not for Redistribution
Commodity Markets<br />
and <strong>the</strong> Macroeconomy<br />
PART I<br />
©International Monetary Fund. Not for Redistribution
This page intentionally left blank<br />
©International Monetary Fund. Not for Redistribution
<strong>Natural</strong> Resource Endowment:<br />
A Mixed Blessing?<br />
THORVALDUR GYLFASON<br />
INTRODUCTION<br />
CHAPTER 2<br />
Economic geography is no longer what it used <strong>to</strong> be. For a long time, economic<br />
geographers studied raw materials and <strong>the</strong>ir distribution around <strong>the</strong> world and<br />
assigned crucial roles <strong>to</strong> natural resource wealth and raw materials, <strong>the</strong>ir ownership,<br />
and trade routes. Ownership <strong>of</strong> those important resources tended <strong>to</strong> be<br />
equated with economic and political strength. The European powers’ scramble<br />
for Africa that began in 1881—this was when France occupied Tunis with<br />
Germany’s consent—was mainly a scramble for <strong>the</strong> great continent’s resources.<br />
The slave trade from <strong>the</strong> mid-15th century onward can be viewed <strong>the</strong> same way.<br />
It wasn’t long before it became clear that natural resources do not always confer<br />
widely shared benefits on <strong>the</strong> people from whose terri<strong>to</strong>ry <strong>the</strong>y are extracted.<br />
Even after <strong>the</strong> end <strong>of</strong> colonial rule in Africa and elsewhere, many resource-abundant<br />
countries—Congo is a case in point—remained in dire straits. Countries<br />
that discovered <strong>the</strong>ir natural resources after independence, such as Nigeria, also<br />
did not make rapid economic progress for reasons that seem <strong>to</strong> be related in part<br />
<strong>to</strong> poor management <strong>of</strong> <strong>the</strong>ir natural resources. In <strong>the</strong> same vein, Russia’s former<br />
president and now Prime Minister Vladimir Putin has said, “Our country is rich,<br />
but our people are poor.” Even so, some natural-resource-rich countries have<br />
made impressive progress. Botswana, Chile, and Mauritius will be singled out in<br />
what follows. Meanwhile, several resource-poor countries have managed <strong>to</strong><br />
become rich, including Hong Kong, Japan, and Singapore.<br />
In <strong>the</strong> light <strong>of</strong> experience, <strong>the</strong> new economic geography puts relatively less<br />
emphasis on natural resources by recognizing several distinct sources <strong>of</strong> wealth,<br />
especially <strong>the</strong> accumulation <strong>of</strong> human and social capital. By social capital is<br />
meant <strong>the</strong> quality <strong>of</strong> formal and informal institutions, including governance,<br />
Thorvaldur Gylfason is pr<strong>of</strong>essor <strong>of</strong> Economics at <strong>the</strong> University <strong>of</strong> Iceland. This chapter is based on<br />
<strong>the</strong> author’s presentation at a high-level seminar, “<strong>Natural</strong> <strong>Resources</strong>, Finance, and Development:<br />
Confronting Old and New Challenges,” organized by <strong>the</strong> Central Bank <strong>of</strong> Algeria and <strong>the</strong> IMF<br />
Institute, which <strong>to</strong>ok place in Algiers, on November 4 and 5, 2010. The author can be contacted at<br />
gylfason@hi.is.<br />
©International Monetary Fund. Not for Redistribution<br />
7
8 <strong>Natural</strong> Resource Endowment: A Mixed Blessing?<br />
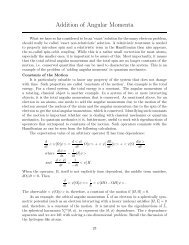
Figure 2.1<br />
Share <strong>of</strong> natural capital in <strong>to</strong>tal tangible capital<br />
Share <strong>of</strong> <strong>Natural</strong> Capital over Total Tangible Capital (in percent)<br />
Less than 15<br />
15 <strong>to</strong> 30<br />
30 <strong>to</strong> 50<br />
50 <strong>to</strong> 65<br />
65 <strong>to</strong> 80<br />
More than 80<br />
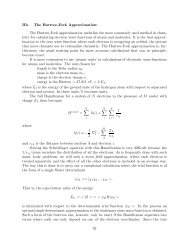
Figure 2.2<br />
Share <strong>of</strong> natural capital in <strong>to</strong>tal capital<br />
Share <strong>of</strong> <strong>Natural</strong> Capital over Total Capital (in percent)<br />
Less than 6<br />
6 –12<br />
12–18<br />
18–24<br />
24–36<br />
Over 36<br />
transparency, and trust. There are many kinds <strong>of</strong> man-made capital and, accordingly,<br />
many separate sources <strong>of</strong> economic growth that <strong>the</strong> people and <strong>the</strong>ir governments<br />
can bring under <strong>the</strong>ir control.<br />
In <strong>the</strong> world as a whole, natural capital, including cropland, pastureland, subsoil<br />
assets, timber resources, nontimber forest resources, and protected areas,<br />
constituted a small part <strong>of</strong> <strong>to</strong>tal national wealth in 2005, or just six percent<br />
(World Bank, 2010b). If intangible capital—that is, human and social capital—is<br />
left out <strong>of</strong> <strong>the</strong> computation, natural capital constituted 26 percent <strong>of</strong> <strong>to</strong>tal tangible<br />
capital around <strong>the</strong> world that year. Tangible capital comprises produced<br />
capital, urban land, natural capital, and net foreign assets. By contrast, sub-<br />
Saharan Africa’s natural capital amounts <strong>to</strong> 28 percent <strong>of</strong> <strong>the</strong> region’s <strong>to</strong>tal wealth<br />
and 70 percent <strong>of</strong> its <strong>to</strong>tal tangible capital (Figures 2.1 and 2.2). In <strong>the</strong> Middle<br />
East, <strong>the</strong> numbers are 34 percent and 58 percent, respectively.<br />
©International Monetary Fund. Not for Redistribution
Gylfason 9<br />
In his memoirs, Lee Kuan Yew, <strong>the</strong> founding fa<strong>the</strong>r <strong>of</strong> Singapore (and prime<br />
minister from 1959 <strong>to</strong> 1991), described his thinking as follows:<br />
I thought <strong>the</strong>n that wealth depended mainly on <strong>the</strong> possession <strong>of</strong> terri<strong>to</strong>ry and<br />
natural resources, whe<strong>the</strong>r fertile land ..., or valuable minerals, or oil and gas.<br />
It was only after I had been in <strong>of</strong>fice for some years that I recognized ... that <strong>the</strong><br />
decisive fac<strong>to</strong>rs were <strong>the</strong> people, <strong>the</strong>ir natural abilities, education and training.<br />
(Lee Kuan Yew, 1998)<br />
Earlier, in 1966, Prime Minister Lee had this <strong>to</strong> say in a speech at <strong>the</strong><br />
Delegates’ Conference <strong>of</strong> <strong>the</strong> National Trade Union Congress in Singapore:<br />
In <strong>the</strong> last 20 or more years since <strong>the</strong> end <strong>of</strong> <strong>the</strong> Second World War, we have<br />
seen how <strong>the</strong> human fac<strong>to</strong>r has been one <strong>of</strong> <strong>the</strong> most potent fac<strong>to</strong>rs for economic<br />
growth and national recovery as against <strong>the</strong> natural geographic and<br />
mineral resources <strong>of</strong> a given society. Two nations, Germany and Japan, were<br />
both beaten down <strong>to</strong> <strong>the</strong>ir knees. Both lost large tracks <strong>of</strong> terri<strong>to</strong>ry … Both<br />
found <strong>the</strong>ir smaller remaining terri<strong>to</strong>ries crammed with refugees ... And, in<br />
both cases, <strong>the</strong>y were able <strong>to</strong> recover through an ability <strong>to</strong> mobilize <strong>the</strong>ir human<br />
resources. First, <strong>the</strong>re was <strong>the</strong> basic willingness <strong>of</strong> <strong>the</strong> worker <strong>to</strong> work and pay<br />
for what he wants; and second, high standards <strong>of</strong> technical expertise and<br />
American markets and investments. But <strong>the</strong> latter were not decisive. The decisive<br />
fac<strong>to</strong>r was <strong>the</strong> human resources at <strong>the</strong>ir disposal. And Germany and Japan<br />
have emerged with a strength <strong>to</strong> be reckoned with in Europe and in Asia. (Lee<br />
Kuan Yew, 1966, pp. 3–4)<br />
Recent <strong>the</strong>ory suggests that <strong>the</strong> interaction <strong>of</strong> several sources <strong>of</strong> economic<br />
growth and development is important <strong>to</strong> growth. For example, <strong>the</strong> conversion <strong>of</strong><br />
natural capital <strong>to</strong> human and social capital <strong>to</strong> boost growth requires, or is at least<br />
helped by, good institutions and governance. For ano<strong>the</strong>r example, investments<br />
in human capital and social capital tend <strong>to</strong> go hand in hand and reinforce one<br />
ano<strong>the</strong>r. Here two types <strong>of</strong> classification can be helpful.<br />
First, growth can be extensive, driven forward by <strong>the</strong> accumulation <strong>of</strong> capital,<br />
or it can be intensive, springing from more efficient use <strong>of</strong> existing capital and<br />
o<strong>the</strong>r resources. Among <strong>the</strong> numerous alternative ways <strong>to</strong> promote economic and<br />
social efficiency, one <strong>of</strong> <strong>the</strong> most effective is <strong>to</strong> accumulate human capital through<br />
education, on-<strong>the</strong>-job training, and health care. There are many o<strong>the</strong>r ways <strong>to</strong><br />
increase efficiency and economic growth as well. For instance, free trade can<br />
empower individuals, firms, and countries <strong>to</strong> break out <strong>of</strong> <strong>the</strong> confines <strong>of</strong> production<br />
frontiers that, under autarky, would entail lower standards <strong>of</strong> life. O<strong>the</strong>r<br />
examples abound, as <strong>the</strong> burgeoning economic growth literature <strong>of</strong> recent years has<br />
made clear. Moreover, it has come <strong>to</strong> be widely recognized that <strong>the</strong> quality <strong>of</strong> institutions<br />
and good governance can help generate sustained growth and so can various<br />
o<strong>the</strong>r fac<strong>to</strong>rs that are closely related <strong>to</strong> economic organization, institutions, and<br />
policy (Fischer and Sahay, 2000; Campos and Coricelli, 2002; and Acemoglu and<br />
Johnson, 2005). Generally, <strong>the</strong> determinants <strong>of</strong> growth are closely related and<br />
influence growth <strong>to</strong>ge<strong>the</strong>r as well as separately. In growth <strong>the</strong>ory, everything<br />
depends on everything else.<br />
©International Monetary Fund. Not for Redistribution
10 <strong>Natural</strong> Resource Endowment: A Mixed Blessing?<br />
A second classification distinguishes among several different types <strong>of</strong> capital<br />
that, like plants, are capable <strong>of</strong> growth at different rates:<br />
(i) Saving and investment <strong>to</strong> build up real capital—physical infrastructure,<br />
roads and bridges, fac<strong>to</strong>ries, machinery, equipment, and such;<br />
(ii) Education, training, health care, and social security <strong>to</strong> build up human<br />
capital, a better and more productive work force;<br />
(iii) Exports and imports <strong>of</strong> goods, services, and capital <strong>to</strong> build up foreign<br />
capital, serving among o<strong>the</strong>r purpose <strong>to</strong> supplement domestic capital;<br />
(iv) Democracy, freedom, equality, and honesty—that is, absence <strong>of</strong> corruption—<strong>to</strong><br />
build up social capital, <strong>to</strong> streng<strong>the</strong>n <strong>the</strong> social fabric, <strong>the</strong> glue that<br />
helps hold <strong>the</strong> economic system <strong>to</strong>ge<strong>the</strong>r and keep it in good running order;<br />
(v) Economic stability with low inflation <strong>to</strong> build up financial capital, or<br />
liquidity, which lubricates <strong>the</strong> wheels <strong>of</strong> <strong>the</strong> economic system and helps<br />
keep it running smoothly; and<br />
(vi) Manufacturing and service industries that permit diversification <strong>of</strong> <strong>the</strong><br />
national economy away from excessive reliance on low-skill-intensive primary<br />
production, including agriculture, based on natural capital.<br />
Most would accept that <strong>the</strong> six items on that list—real capital, human capital,<br />
foreign capital, social capital, financial capital, and natural capital—are desirable<br />
and helpful in <strong>the</strong>mselves, and most would also agree on <strong>the</strong> desirability <strong>of</strong> diversification<br />
in economic activity. How <strong>the</strong>se goals can be attained is ano<strong>the</strong>r matter,<br />
however. The above list could be extended, but let us ra<strong>the</strong>r notice a couple <strong>of</strong><br />
things about this short list.<br />
First, capital appears in many different guises, some tangible, some not, but in<br />
all its guises it needs <strong>to</strong> be built up gradually through painstaking investments at<br />
<strong>the</strong> expense <strong>of</strong> current consumption. A strong capital base requires a lot <strong>of</strong> good<br />
and durable investments in different areas. Second, natural capital differs from<br />
<strong>the</strong> o<strong>the</strong>r kinds <strong>of</strong> capital on <strong>the</strong> list in that it may be a good idea (for reasons <strong>to</strong><br />
be discussed below) <strong>to</strong> be on guard against excessive reliance on this particular<br />
kind <strong>of</strong> capital. Here it is important <strong>to</strong> distinguish clearly between natural<br />
resource abundance and natural resource dependence. By abundance is meant <strong>the</strong><br />
amount <strong>of</strong> natural capital that a country has at its disposal: mineral deposits, oil<br />
fields, forests, farm land, and <strong>the</strong> like. By dependence is meant <strong>the</strong> extent <strong>to</strong><br />
which <strong>the</strong> nation in question depends on <strong>the</strong>se natural resources for its livelihood.<br />
Some countries with abundant natural resources, such as Australia, Canada, and<br />
<strong>the</strong> United States, outgrew those resources and are no longer especially dependent<br />
on <strong>the</strong>m. O<strong>the</strong>r resource-abundant countries, such as <strong>the</strong> members <strong>of</strong> <strong>the</strong><br />
Organization <strong>of</strong> Petroleum Exporting Countries (OPEC), do depend on <strong>the</strong>ir<br />
resources, some <strong>of</strong> <strong>the</strong>m for practically all that <strong>the</strong>y have. Still o<strong>the</strong>r countries,<br />
such as Chad and Mali, have few resources and yet depend on those few for <strong>the</strong><br />
bulk <strong>of</strong> <strong>the</strong>ir export earnings, because <strong>the</strong>y have little else <strong>to</strong> <strong>of</strong>fer for sale abroad.<br />
Yet o<strong>the</strong>rs, such as Jordan and Panama, have few resources but do not depend in<br />
any important manner on <strong>the</strong> little <strong>the</strong>y have. The idea that diversification away<br />
©International Monetary Fund. Not for Redistribution
Gylfason 11<br />
from natural resources may be good for long-run growth centers on dependence<br />
ra<strong>the</strong>r than abundance, even if <strong>the</strong> distinction may is sometimes hard <strong>to</strong> make in<br />
practice. It is quite conceivable that excessive dependence on a few natural<br />
resources may hurt economic growth, even if an abundance <strong>of</strong> natural resources,<br />
if well managed, may also be good for growth. By contrast, no country has ever<br />
suffered from excessive reliance on human capital built up through education.<br />
The rest <strong>of</strong> <strong>the</strong> chapter is organized as follows. First, we consider <strong>the</strong> implications<br />
<strong>of</strong> natural resources for <strong>the</strong> conduct <strong>of</strong> economic policies and <strong>the</strong> role and<br />
design <strong>of</strong> institutions in resource-rich countries. Second, we briefly review <strong>the</strong><br />
experience <strong>of</strong> a dozen resource-rich countries, highlighting <strong>the</strong> successes <strong>of</strong> those<br />
that have done well, with special emphasis on Norway, <strong>the</strong> world’s third largest<br />
oil exporter. Third and last, we turn from s<strong>to</strong>ry-telling <strong>to</strong> statistical analysis by<br />
<strong>of</strong>fering a quick glance at some <strong>of</strong> <strong>the</strong> empirical cross-country evidence that can<br />
be brought <strong>to</strong> bear on <strong>the</strong> relationship between natural resources, economic<br />
growth, and some <strong>of</strong> <strong>the</strong> main determinants <strong>of</strong> growth.<br />
POLICY ISSUES IN NATURAL-RESOURCE-RICH<br />
COUNTRIES<br />
This section addresses <strong>the</strong> three main areas for which <strong>the</strong> management <strong>of</strong> natural<br />
resources in resource-rich countries raises important issues: (i) fiscal policy,<br />
(ii) monetary, financial, and exchange-rate policy, with emphasis on <strong>the</strong> important<br />
role <strong>of</strong> institutions and governance, and (iii) <strong>the</strong> need for diversification away<br />
from excessive dependence on a few resources as well as away from narrowly based<br />
power elites. We begin with taxes.<br />
Fiscal Issues<br />
“Taxes are what we pay for a civilized society,” said <strong>the</strong> American justice Oliver<br />
Wendell Holmes. In general, however, taxes dis<strong>to</strong>rt economic behavior. Therefore,<br />
it makes a substantial difference in economic terms how public revenue is raised<br />
<strong>to</strong> finance society’s collective needs in addition <strong>to</strong> <strong>the</strong> efficiency with which <strong>the</strong><br />
revenue is spent. The overall objective <strong>of</strong> tax policy ought <strong>to</strong> be <strong>the</strong> collection <strong>of</strong><br />
enough revenue at <strong>the</strong> cost <strong>of</strong> <strong>the</strong> smallest dis<strong>to</strong>rtion possible. The worst possible<br />
way <strong>to</strong> collect revenue is <strong>to</strong> resort <strong>to</strong> <strong>the</strong> inflation tax, probably <strong>the</strong> least efficient<br />
and most harmful and dis<strong>to</strong>rting <strong>of</strong> all methods <strong>of</strong> taxation. Most o<strong>the</strong>r taxes have<br />
side effects that discourage households and firms from doing desirable things.<br />
Import tariffs impede foreign trade and <strong>the</strong>reby also economic efficiency and<br />
growth. Income taxes discourage work and market production. Sales taxes fall<br />
disproportionately on low-income households that spend most <strong>of</strong> <strong>the</strong>ir income<br />
on necessities and have little <strong>to</strong> save. <strong>Natural</strong>-resource-rich countries can <strong>to</strong> some<br />
extent avoid <strong>the</strong>se problems because <strong>the</strong>y possess a tax base that <strong>of</strong>fers <strong>the</strong>m an<br />
opportunity <strong>to</strong> ga<strong>the</strong>r public revenue at a minimal cost <strong>to</strong> efficiency through<br />
dis<strong>to</strong>rtions. This is because <strong>the</strong> resources will stay put—<strong>the</strong>y are <strong>the</strong>re and cannot<br />
move. This argument is akin <strong>to</strong> <strong>the</strong> old s<strong>to</strong>ry that land taxes are more efficient<br />
©International Monetary Fund. Not for Redistribution
12 <strong>Natural</strong> Resource Endowment: A Mixed Blessing?<br />
than taxes on movable fac<strong>to</strong>rs <strong>of</strong> production. But <strong>the</strong>re is a difference—a big one.<br />
<strong>Natural</strong> resources belong <strong>to</strong> <strong>the</strong> people.<br />
As a matter <strong>of</strong> near-universal principle, a people’s right <strong>to</strong> its natural resources<br />
is a human right proclaimed in primary documents <strong>of</strong> international law and<br />
enshrined in many national constitutions (Wenar, 2008). Thus, Article 1 <strong>of</strong> <strong>the</strong><br />
International Covenant on Civil and Political Rights states:<br />
All people may, for <strong>the</strong>ir own ends, freely dispose <strong>of</strong> <strong>the</strong>ir natural wealth and<br />
resources….<br />
The first article <strong>of</strong> <strong>the</strong> International Covenant on Economic, Social and<br />
Cultural Rights is identical. Except in <strong>the</strong> United States, where rights <strong>to</strong> oil<br />
resources were legally transferred <strong>to</strong> private companies, natural resources are as a<br />
rule common property resources. This means that, by law, <strong>the</strong> resource rents<br />
accrue in large part <strong>to</strong> <strong>the</strong> government. Hence, no taxation is really needed except<br />
as a formality. In any case, <strong>the</strong> word “tax” would be inappropriate. Here “fee” is a<br />
more fitting word because fees are typically levied in exchange for providing specific<br />
services such as a permission <strong>to</strong> utilize a common property resource.<br />
Therefore, resource taxes should ra<strong>the</strong>r be referred <strong>to</strong> as fees or resource depletion<br />
charges (Gylfason and Weitzman, 2003). In any event, it is important <strong>to</strong> use <strong>the</strong><br />
proceeds from resource fees ei<strong>the</strong>r <strong>to</strong> finance socially productive expenditures or<br />
<strong>to</strong> reduce o<strong>the</strong>r less efficient sources <strong>of</strong> revenue <strong>to</strong> keep <strong>the</strong> overall tax burden<br />
manageable. Good fiscal governance requires careful attention <strong>to</strong> allocative and<br />
technical efficiency on both sides <strong>of</strong> <strong>the</strong> fiscal equation, that is, on both public<br />
expenditures and <strong>the</strong> revenue mobilization needed <strong>to</strong> finance those expenditures.<br />
The legal aspect <strong>of</strong> natural resources as human rights has ano<strong>the</strong>r important<br />
implication. The accrual <strong>of</strong> natural resource rents <strong>to</strong> <strong>the</strong> government presupposes<br />
representative democracy and, hence, as a matter <strong>of</strong> international law, <strong>the</strong> legitimacy<br />
<strong>of</strong> <strong>the</strong> government’s right <strong>to</strong> dispose <strong>of</strong> <strong>the</strong> resource rents on behalf <strong>of</strong> <strong>the</strong><br />
people. This principle is, for instance, acknowledged in <strong>the</strong> Permanent<br />
Constitution <strong>of</strong> <strong>the</strong> State <strong>of</strong> Qatar, Article 1, which states: “Its political system is<br />
democratic.” Fur<strong>the</strong>r, Article 29 states: “<strong>Natural</strong> wealth and its resources are <strong>the</strong><br />
property <strong>of</strong> <strong>the</strong> State; and <strong>the</strong> State shall preserve and exploit <strong>the</strong> same in <strong>the</strong> best<br />
manner in accordance with <strong>the</strong> provisions <strong>of</strong> <strong>the</strong> law.” For ano<strong>the</strong>r example, <strong>the</strong><br />
Iraqi constitution <strong>of</strong> 2005 proclaims in Article 108 that “Oil and gas are <strong>the</strong><br />
property <strong>of</strong> <strong>the</strong> Iraqi people in all <strong>the</strong> regions and provinces.” Again, by international<br />
law, this proclamation presupposes political diversification through representative<br />
democracy. In <strong>the</strong> same spirit, <strong>the</strong> preamble <strong>to</strong> <strong>the</strong> Algerian Constitution<br />
refers <strong>to</strong> <strong>the</strong> “recovery <strong>of</strong> <strong>the</strong> national resources and <strong>the</strong> building <strong>of</strong> a State exclusively<br />
for <strong>the</strong> benefit <strong>of</strong> <strong>the</strong> people.”<br />
Fish is not oil, but Iceland’s fisheries policy sheds light on <strong>the</strong>se issues. Iceland’s<br />
system <strong>of</strong> catch quotas, in operation since 1984, shares <strong>the</strong> main features <strong>of</strong> <strong>the</strong><br />
European Union’s Common Fisheries Policy in that <strong>the</strong> fisheries minister sets<br />
annual quotas for each species and allocates <strong>the</strong>m free <strong>of</strong> charge <strong>to</strong> boat owners<br />
based on <strong>the</strong>ir catches in 1981-83. The boat owners can <strong>the</strong>n ei<strong>the</strong>r fill <strong>the</strong>ir<br />
quotas at sea or sell <strong>the</strong>m, as many have done, <strong>the</strong>reby reducing <strong>the</strong> amount <strong>of</strong><br />
©International Monetary Fund. Not for Redistribution
Gylfason 13<br />
capital tied up in <strong>the</strong> fishing industry and pocketing <strong>the</strong> rents. As a matter <strong>of</strong> fact,<br />
<strong>the</strong> law stipulating gratis allocation <strong>of</strong> <strong>the</strong> quotas <strong>to</strong> <strong>the</strong> boat owners was drafted<br />
at <strong>the</strong> <strong>of</strong>fices <strong>of</strong> The Federation <strong>of</strong> Icelandic Fishing Vessel Owners. Free trade in<br />
quotas enhances efficiency by facilitating a transfer <strong>of</strong> quotas at <strong>the</strong> market price<br />
from less efficient firms <strong>to</strong> more efficient ones.<br />
But <strong>to</strong> be fair and fully efficient, free trade in quotas presupposes that <strong>the</strong><br />
initial allocation was fair and efficient, that is, that <strong>the</strong> quotas were sold at fair<br />
market value by <strong>the</strong>ir rightful owner, in this case <strong>the</strong> state on behalf <strong>of</strong> <strong>the</strong><br />
Icelandic people, <strong>to</strong> whom Iceland’s fish resources belong by law as well as by<br />
<strong>the</strong> International Covenant on Civil and Political Rights as mentioned before. 1<br />
The macroeconomic significance <strong>of</strong> <strong>the</strong> fishing rents in Iceland is extremely substantial.<br />
By auctioning <strong>of</strong>f <strong>the</strong> quotas from <strong>the</strong> outset, ra<strong>the</strong>r than giving <strong>the</strong>m<br />
away for free and thus prolonging huge overcapacity and inefficiency in <strong>the</strong> fishing<br />
industry, <strong>the</strong> government could have generated enough revenue <strong>to</strong> finance <strong>the</strong><br />
abolition <strong>of</strong> <strong>the</strong> personal income tax in Iceland. 2 This opportunity <strong>to</strong> replace inefficient<br />
income taxation by dis<strong>to</strong>rtion-free fishing fees was missed. Alfred Pigou<br />
would also have been disappointed. Fishing fees are an example <strong>of</strong> a Pigovian tax<br />
or fee, by which is meant a levy on a market activity that generates negative externalities.<br />
Ano<strong>the</strong>r example <strong>of</strong> a Pigovian levy is <strong>the</strong> “taxation” <strong>of</strong> oil and gas,<br />
whe<strong>the</strong>r at <strong>the</strong> source or at <strong>the</strong> pump. What oil and fish have in common is <strong>the</strong><br />
tendency <strong>to</strong>ward excess that is characteristic <strong>of</strong> <strong>the</strong> use <strong>of</strong> common property<br />
resources: <strong>the</strong>re is <strong>to</strong>o much fishing going on, <strong>the</strong>reby endangering fish s<strong>to</strong>cks<br />
around <strong>the</strong> world, and we drive <strong>to</strong>o much, <strong>the</strong>reby producing congestion that<br />
imposes delays on o<strong>the</strong>r travelers.<br />
Iceland’s failure <strong>to</strong> make <strong>the</strong> boat owners pay for <strong>the</strong> quotas had consequences.<br />
It created with <strong>the</strong> stroke <strong>of</strong> a pen a wealthy class <strong>of</strong> individuals who went on <strong>to</strong><br />
become major players in <strong>the</strong> political arena able <strong>to</strong> make sure that <strong>the</strong>ir privileges<br />
would not be revoked by new legislation. The s<strong>to</strong>ries are legend. The latest move<br />
by this new elite was <strong>to</strong> buy <strong>the</strong> country’s second largest newspaper and install as<br />
edi<strong>to</strong>r <strong>the</strong> discredited central bank governor, <strong>the</strong> person who presided over<br />
Iceland’s fateful banking crash <strong>of</strong> 2008. That crash wiped out financial assets<br />
equivalent <strong>to</strong> seven times <strong>the</strong> country’s GDP, a unique event in <strong>the</strong> financial his<strong>to</strong>ry<br />
<strong>of</strong> <strong>the</strong> world.<br />
The failure <strong>to</strong> sell fishing quotas or auction <strong>the</strong>m <strong>of</strong>f ra<strong>the</strong>r than hand <strong>the</strong>m<br />
out for free can be viewed as part <strong>of</strong> <strong>the</strong> lead-up <strong>to</strong> Iceland’s more recent banking<br />
fiasco. For how would politicians who got away with handing out for free hugely<br />
valuable catch quotas go about privatizing state banks? Would <strong>the</strong>y apply <strong>the</strong><br />
same method again? They did. They sold two <strong>of</strong> <strong>the</strong> three largest banks in Iceland<br />
1<br />
In 2007, <strong>the</strong> United Nations Committee on Human Rights declared that <strong>the</strong> Icelandic quota system<br />
constitutes a violation <strong>of</strong> human rights and instructed <strong>the</strong> Icelandic government <strong>to</strong> rectify <strong>the</strong> fisheries<br />
management system by removing <strong>the</strong> discrimina<strong>to</strong>ry element from <strong>the</strong> system. See International<br />
covenant on civil and political rights, CCPR/C/91/D/1306/2004, 14 December 2007.<br />
2<br />
The natural resource rent from <strong>the</strong> fisheries has been estimated <strong>to</strong> amount in long-run equilibrium<br />
<strong>to</strong> about five percent <strong>of</strong> Iceland’s GDP.<br />
©International Monetary Fund. Not for Redistribution
14 <strong>Natural</strong> Resource Endowment: A Mixed Blessing?<br />
at a modest price <strong>to</strong> political cronies, who <strong>the</strong>n ran <strong>the</strong>m in<strong>to</strong> <strong>the</strong> ground within<br />
six short years. The government has since set up a Special Investigation Commission,<br />
which has directed a number <strong>of</strong> cases involving <strong>the</strong> banks <strong>to</strong> <strong>the</strong> Special<br />
Prosecu<strong>to</strong>r’s Office set up specifically <strong>to</strong> investigate possible violations <strong>of</strong> <strong>the</strong> law<br />
by <strong>the</strong> banks and o<strong>the</strong>rs.<br />
Fiscal stabilization is ano<strong>the</strong>r essential consideration. Because <strong>the</strong>ir prices tend<br />
<strong>to</strong> be volatile, abundant natural resources tend <strong>to</strong> go hand in hand with fluctuations<br />
in export revenues. Such volatility calls for fiscal stabilization. This problem<br />
raises <strong>the</strong> classic question <strong>of</strong> rules versus discretion. Discretionary stabilization<br />
measures aimed at building up foreign exchange reserves and fiscal revenues when<br />
commodity prices are high and using up reserves and revenues when prices are<br />
low can be criticized on <strong>the</strong> grounds that <strong>the</strong>y tend <strong>to</strong> kick in <strong>to</strong>o late and thus<br />
<strong>to</strong> become counterproductive, exacerbating <strong>the</strong> volatility <strong>of</strong> earnings. Fiscal rules,<br />
on <strong>the</strong> o<strong>the</strong>r hand, can be faulted for being <strong>to</strong>o mechanical and insensitive <strong>to</strong><br />
circumstances. This is a classic dilemma <strong>to</strong> which a one-size-fits-all solution does<br />
not exist.<br />
Chile applies a fiscal rule by which <strong>the</strong> government can run a deficit larger<br />
than <strong>the</strong> target <strong>of</strong> zero, or one percent surplus relative <strong>to</strong> GDP, ins<strong>of</strong>ar as GDP<br />
falls short <strong>of</strong> potential or <strong>the</strong> price <strong>of</strong> copper is below its medium-term (10-year)<br />
equilibrium level (Frankel, 2010). The aim <strong>of</strong> <strong>the</strong> scheme is <strong>to</strong> shield producers—and<br />
<strong>the</strong> national economy—from price fluctuations. This makes <strong>the</strong> scheme<br />
subject <strong>to</strong> similar reservations as price stabilization funds and, more generally,<br />
rules-based stabilization policies. The scheme has both pros and cons. A novel<br />
aspect <strong>of</strong> <strong>the</strong> Chilean scheme is that two panels <strong>of</strong> experts determine <strong>the</strong> output<br />
gap and <strong>the</strong> medium-term equilibrium price <strong>of</strong> copper <strong>to</strong> reduce <strong>the</strong> risk <strong>of</strong> shortsighted<br />
political interference.<br />
In Iceland it has likewise been suggested, among o<strong>the</strong>r proposals <strong>to</strong> allow <strong>the</strong><br />
resource rent <strong>to</strong> accrue <strong>to</strong> its rightful owner, that an Open Market Fisheries<br />
Committee be set up and vested with a broad mandate and broad powers. Such<br />
a committee would set market-based fishing fees <strong>to</strong> maximize <strong>the</strong> long-run pr<strong>of</strong>itability<br />
<strong>of</strong> fisheries for <strong>the</strong> benefit <strong>of</strong> <strong>the</strong> sole national owner (Gylfason and<br />
Weitzman, 2003). The idea is that setting values for fisheries management instruments,<br />
including fees, is <strong>to</strong>o important a task <strong>to</strong> be left in <strong>the</strong> hands <strong>of</strong> a politically<br />
appointed minister, no matter how capable or well intentioned <strong>the</strong> currently<br />
appointed individual happens <strong>to</strong> be. The fisheries authorities should be above<br />
even <strong>the</strong> hint <strong>of</strong> suspicion <strong>of</strong> manipulation. There needs <strong>to</strong> be a clear and specific<br />
management and accountability structure, formalized in <strong>the</strong> national interest<br />
by <strong>the</strong> reform legislation. This is <strong>the</strong> idea behind independent yet accountable<br />
central banks, <strong>of</strong> course, and also behind independent judiciaries and supervisory<br />
authorities. The idea is applicable across a broad range <strong>of</strong> natural resources.<br />
Monetary Policy, Finance, and Exchange Rates<br />
Several monetary policy issues arise in connection with natural resource management.<br />
Perhaps <strong>the</strong> most important one has <strong>to</strong> do with Dutch disease, so named<br />
©International Monetary Fund. Not for Redistribution
Figure 2.3<br />
How oil exports crowd out non-oil exports<br />
Real exchange rate<br />
C<br />
A<br />
B<br />
Foreign exchange<br />
Imports<br />
Exports with oil<br />
Exports without oil<br />
Gylfason 15<br />
for triggering fears <strong>of</strong> de-industrialization in <strong>the</strong> Ne<strong>the</strong>rlands following <strong>the</strong> appreciation<br />
<strong>of</strong> <strong>the</strong> Dutch guilder after <strong>the</strong> discovery <strong>of</strong> natural gas deposits in <strong>the</strong><br />
North Sea around 1960 (Figure 2.3). In fact, <strong>the</strong> Dutch got over <strong>the</strong> ailment<br />
fairly quickly and have seen <strong>the</strong>ir exports and imports rise rapidly relative <strong>to</strong> GDP.<br />
As it turned out, gas exports did not crowd out o<strong>the</strong>r exports. So, <strong>the</strong> “Dutch”<br />
part <strong>of</strong> <strong>the</strong> term proved <strong>to</strong> be a misnomer. How about <strong>the</strong> “disease” part? This<br />
remains a matter <strong>of</strong> some controversy.<br />
Some observers view <strong>the</strong> dislocations due <strong>to</strong> high currency values simply as a<br />
matter <strong>of</strong> one sec<strong>to</strong>r’s benefiting at <strong>the</strong> expense <strong>of</strong> o<strong>the</strong>rs, without seeing any<br />
macroeconomic or social damage done. O<strong>the</strong>rs view Dutch disease as just that,<br />
a disease, pointing <strong>to</strong> <strong>the</strong> potentially harmful consequences <strong>to</strong> economic growth<br />
and diversification <strong>of</strong> <strong>the</strong> resulting reallocation <strong>of</strong> resources. These reallocations<br />
move resources from high-tech, high-skill-intensive service industries <strong>to</strong> low-tech,<br />
low-skill-intensive primary production. Clearly, an overvalued currency hurts<br />
exports and import-competing industries. This is one <strong>of</strong> <strong>the</strong> most robust empirical<br />
relationships in international economics. The reverse <strong>of</strong> this phenomenon has<br />
been on display for some time in China, where undervaluation <strong>of</strong> <strong>the</strong> renminbi<br />
continues <strong>to</strong> boost Chinese exports and import-competing industries, much <strong>to</strong><br />
<strong>the</strong> consternation <strong>of</strong> some <strong>of</strong> China’s trading partners. The point is a simple one:<br />
if overvaluation hurts trade and growth, as has been known for a long time, <strong>the</strong>n<br />
undervaluation must likewise help trade and growth (Eichengreen, 2008).<br />
Norway’s <strong>to</strong>tal exports have been stagnant in proportion <strong>to</strong> GDP since before<br />
its oil discoveries around 1970. This means that oil exports <strong>the</strong>re have crowded<br />
out non-oil exports one-for-one relative <strong>to</strong> GDP. Norway has no high-tech companies<br />
that could compare, for example, with Sweden’s LM Ericsson, Finland’s<br />
Nokia, or Denmark’s Bang and Olufsen. Yet ano<strong>the</strong>r sign <strong>of</strong> a tendency <strong>to</strong>ward<br />
Dutch disease, albeit a weak tendency, might be Norway’s unwillingness, almost<br />
unique in Europe, <strong>to</strong> join <strong>the</strong> European Union. This lack <strong>of</strong> interest is based in<br />
part on <strong>the</strong> popular belief that Norway’s oil wealth has reduced <strong>the</strong> country’s need<br />
for <strong>the</strong> benefits <strong>of</strong> European Union membership. Even so, Norway has proved<br />
©International Monetary Fund. Not for Redistribution
16 <strong>Natural</strong> Resource Endowment: A Mixed Blessing?<br />
very good at keeping inflation down <strong>to</strong> resist overvaluation <strong>of</strong> its currency.<br />
Sustained price stability requires good monetary governance through independent<br />
yet accountable central banks. Likewise, <strong>the</strong> development <strong>of</strong> a healthy financial sec<strong>to</strong>r<br />
requires good monetary governance, including credibility and transparency. A<br />
lack <strong>of</strong> transparency seems <strong>to</strong> have played a role in <strong>the</strong> financial crisis that began in<br />
<strong>the</strong> United States in 2007.<br />
The volatility <strong>of</strong> commodity prices poses challenges not only for fiscal policy<br />
but also for monetary policy by leading <strong>to</strong> volatility in exchange rates, export<br />
earnings, output, and employment. Experience shows that volatility can be detrimental<br />
<strong>to</strong> investment and growth (Aghion and Banerjee, 2005). Exchange rate<br />
volatility is no exception. This is one reason why natural-resource-rich countries<br />
are prone <strong>to</strong> sluggish investment and slow growth. With this in mind, as well as<br />
<strong>the</strong> resounding success <strong>of</strong> <strong>the</strong> euro since its launch in 1999, more and more countries<br />
in Africa and elsewhere around <strong>the</strong> world have plans <strong>to</strong> pool <strong>the</strong>ir currencies<br />
<strong>to</strong> foster economic stability and growth. This is <strong>the</strong> surest way, albeit not a riskfree<br />
way, <strong>to</strong> use monetary policy <strong>to</strong> avoid overvaluation and excessive currency<br />
volatility. To paraphrase Wins<strong>to</strong>n Churchill’s comment about democracy: <strong>the</strong> best<br />
way <strong>to</strong> preserve <strong>the</strong> integrity <strong>of</strong> <strong>the</strong> national currency is <strong>to</strong> abolish it—or, more<br />
precisely, share it with o<strong>the</strong>rs.<br />
The build-up <strong>of</strong> natural resource funds such as Algeria’s Fund for <strong>the</strong> Regulation<br />
<strong>of</strong> Receipts and o<strong>the</strong>r sovereign wealth funds raises a number <strong>of</strong> issues. With petroleum<br />
and natural gas providing Algeria with almost two-thirds <strong>of</strong> government<br />
income, more than a third <strong>of</strong> GDP, and 95 percent <strong>of</strong> export earnings, <strong>the</strong> stabilization<br />
fund was set up in 2000 <strong>to</strong> insulate <strong>the</strong> Algerian economy from volatility<br />
in gas and oil commodity prices.<br />
Several o<strong>the</strong>r countries have a similar set-up. And <strong>the</strong>y all have a choice<br />
between regarding <strong>the</strong> fund as part <strong>of</strong> <strong>the</strong> government’s fiscal chest available for<br />
current use and using it as a reserve for <strong>the</strong> future subject <strong>to</strong> strict rules about its<br />
planned disposal. After a few years <strong>of</strong> experimenting, Norway decided <strong>to</strong> place<br />
itself firmly at <strong>the</strong> future-use end <strong>of</strong> <strong>the</strong> spectrum, having in recent years invested<br />
virtually all its oil revenues in foreign securities and set <strong>the</strong>m aside in a pension<br />
fund. Low- and middle-income countries have more pressing current needs and,<br />
for that reason, may find <strong>the</strong> Norwegian method impractical. Even so, <strong>the</strong>y could<br />
benefit from trying <strong>to</strong> de-politicize <strong>the</strong> use <strong>of</strong> natural resource revenues by<br />
vesting <strong>the</strong>ir disposal in an independent authority set up along <strong>the</strong> lines <strong>of</strong> independent<br />
yet accountable central banks, judiciaries, and supervisory authorities.<br />
Understandably, easy revenues from natural resources are especially tempting in<br />
<strong>the</strong> eyes <strong>of</strong> politicians in urgent need <strong>of</strong> public support. Therefore, prudence calls<br />
for firewalls <strong>to</strong> be erected between sovereign wealth funds and <strong>the</strong> heat <strong>of</strong> <strong>the</strong><br />
day-<strong>to</strong>-day political process. This is a question <strong>of</strong> checks and balances, <strong>of</strong> finding<br />
ways <strong>to</strong> reduce <strong>the</strong> risk <strong>of</strong> natural resource revenues being misspent or even squandered<br />
for short-term political gain.<br />
The underlying issue here is <strong>the</strong> risk <strong>of</strong> rent seeking, especially in conjunction<br />
with ill-defined property rights, imperfect or missing markets, and lax legal<br />
structures. The problem with rent seeking, apart from <strong>the</strong> injustices it tends <strong>to</strong><br />
©International Monetary Fund. Not for Redistribution
Gylfason 17<br />
produce, is that it tends also <strong>to</strong> divert productive efforts and resources away from<br />
more socially fruitful economic activity. Without adequate checks and balances,<br />
even full-fledged democracies can suffer from this problem, as <strong>the</strong> aforementioned<br />
s<strong>to</strong>ry <strong>of</strong> Iceland’s fisheries policy demonstrates. Less democratic countries<br />
appear <strong>to</strong> be even more prone <strong>to</strong> this risk. This is why important international<br />
initiatives have recently been taken <strong>to</strong> encourage increased transparency in <strong>the</strong> use<br />
<strong>of</strong> natural resource revenues. The Extractive Industries Transparency Initiative<br />
aims <strong>to</strong> set a global standard for transparency in oil, gas, and mining. 3 The<br />
<strong>Natural</strong> Resource Charter lays out “a set <strong>of</strong> principles for governments and societies<br />
on how <strong>to</strong> best manage <strong>the</strong> opportunities created by natural resources for<br />
development.” 4 The Revenue Watch Institute promotes <strong>the</strong> responsible management<br />
<strong>of</strong> oil, gas, and mineral resources for <strong>the</strong> public good. 5 Put bluntly, open<br />
access <strong>to</strong> o<strong>the</strong>r people’s money tends <strong>to</strong> breed carelessness as well as a false sense<br />
<strong>of</strong> security that may lead <strong>to</strong> <strong>the</strong> sentiment that anything goes, resulting in <strong>the</strong><br />
neglect <strong>of</strong> many <strong>of</strong> <strong>the</strong> things that make countries grow, including education and<br />
institutions. This is <strong>the</strong> sense in which, if it is not well managed, natural capital<br />
may tend <strong>to</strong> crowd out o<strong>the</strong>r types <strong>of</strong> capital.<br />
The question <strong>of</strong> o<strong>the</strong>r people’s money raises yet ano<strong>the</strong>r legal issue. The managers<br />
<strong>of</strong> sovereign wealth funds are not necessarily free <strong>to</strong> manage <strong>the</strong> funds<br />
entirely as <strong>the</strong>y see fit if <strong>the</strong>ir guidelines and rules do not fully comply with international<br />
or local laws. Because <strong>the</strong> legal issues raised by Leif Wenar (2008) are<br />
new <strong>to</strong> most economists and policymakers, it is not clear that <strong>the</strong>se guidelines and<br />
rules were always designed <strong>to</strong> be waterpro<strong>of</strong>. To illustrate <strong>the</strong> point, Wenar tells<br />
<strong>the</strong> s<strong>to</strong>ry <strong>of</strong> Equa<strong>to</strong>rial Guinea, where <strong>the</strong> oil export boom after 1990 has produced<br />
immense but highly concentrated private wealth amid public squalor, even<br />
though <strong>the</strong> oil wealth belongs <strong>to</strong> <strong>the</strong> people by Article 1 <strong>of</strong> <strong>the</strong> International<br />
Covenant on Civil and Political Rights, which Equa<strong>to</strong>rial Guinea has signed.<br />
Ano<strong>the</strong>r example may be instructive: that <strong>of</strong> Iceland, where boat owners used<br />
<strong>the</strong>ir fishing quotas as collateral for <strong>the</strong>ir private debts which, for some <strong>of</strong> <strong>the</strong>m,<br />
proved crushing. 6 This meant that, in some cases, <strong>the</strong> quotas wound up in <strong>the</strong><br />
hands <strong>of</strong> <strong>the</strong> foreign credi<strong>to</strong>rs <strong>of</strong> <strong>the</strong> boat owners’ banks, even though Icelandic<br />
law clearly states that foreign owners <strong>of</strong> Icelandic catch quotas cannot hold on<strong>to</strong><br />
<strong>the</strong>m and must return <strong>the</strong>m <strong>to</strong> Icelandic hands within a year. It is unclear whe<strong>the</strong>r<br />
<strong>the</strong> foreign credi<strong>to</strong>rs were aware <strong>of</strong> this legal stipulation when <strong>the</strong>y extended <strong>the</strong>ir<br />
loans, via Icelandic banks, <strong>to</strong> <strong>the</strong> fishing firms in question with <strong>the</strong> quotas as collateral.<br />
Besides, <strong>the</strong> rightful original owner <strong>of</strong> <strong>the</strong> quotas, <strong>the</strong> Icelandic people,<br />
was never paid. This legal aspect <strong>of</strong> Iceland’s ongoing financial crisis remains<br />
unresolved. There may be lessons here for o<strong>the</strong>r nations.<br />
3<br />
See http://eiti.org/.<br />
4See http://www.naturalresourcecharter.org/.<br />
5<br />
See http://www.revenuewatch.org/about-rwi.<br />
6<br />
The overall debts <strong>of</strong> Iceland’s fishing firms were at <strong>the</strong> end <strong>of</strong> 2008 equivalent <strong>to</strong> about four times<br />
<strong>the</strong>ir annual earnings.<br />
©International Monetary Fund. Not for Redistribution
18 <strong>Natural</strong> Resource Endowment: A Mixed Blessing?<br />
Double Diversification<br />
Economic diversification encourages growth by attracting new economic activity<br />
that avoids excessive reliance on primary production in agriculture or a few natural-resource-based<br />
industries, thus facilitating <strong>the</strong> transfer <strong>of</strong> labor from lowpaying<br />
jobs in low-skill-intensive farming or mining <strong>to</strong> more lucrative jobs in<br />
more high-skill-intensive occupations. Political diversification encourages growth<br />
in a similar way by redistributing political power from narrowly based ruling elites<br />
<strong>to</strong> <strong>the</strong> people, thus in many cases replacing with democracy and pluralism an<br />
extended monopoly <strong>of</strong> sometimes ill-gotten power. The essence <strong>of</strong> <strong>the</strong> argument<br />
is <strong>the</strong> same in both cases: diversity pays.<br />
Modern mixed economies need a broad base <strong>of</strong> manufacturing, trade, and<br />
services <strong>to</strong> be able <strong>to</strong> <strong>of</strong>fer <strong>the</strong> people a steadily improving standard <strong>of</strong> life.<br />
Therefore, <strong>the</strong>y need <strong>to</strong> find ways <strong>of</strong> diversifying <strong>the</strong>ir economic activity away<br />
from once-dominant agriculture, which tends <strong>to</strong> perpetuate poverty, and similarly<br />
away from <strong>to</strong>o much dependence on a few natural resources, which tends <strong>to</strong> stifle<br />
or delay <strong>the</strong> development <strong>of</strong> modern manufacturing and services. To function<br />
well, national economies also need broad political participation and a broad base<br />
<strong>of</strong> power in order <strong>to</strong> be able <strong>to</strong> <strong>of</strong>fer <strong>the</strong> citizenry an efficient and fair way <strong>of</strong><br />
exercising its political will and civil rights through free assembly and free elections.<br />
Without political democracy, bad governments last <strong>to</strong>o long and do <strong>to</strong>o<br />
much damage. The need for diversification is especially urgent in resource-rich<br />
countries, because <strong>the</strong>y <strong>of</strong>ten face a double jeopardy: natural resource wealth that<br />
is concentrated in <strong>the</strong> hands <strong>of</strong> relatively small groups that seek <strong>to</strong> preserve <strong>the</strong>ir<br />
own privileges by standing in <strong>the</strong> way <strong>of</strong> both economic and political diversification,<br />
which would disperse <strong>the</strong>ir power and wealth. Rent seekers typically resist<br />
reforms—economic diversification as well as democracy—that would redistribute<br />
<strong>the</strong> rents <strong>to</strong> <strong>the</strong>ir rightful owners (Auty, 2001; Ross, 2001).<br />
While diversification is a widely shared goal, it is not obvious how it can be<br />
achieved. Never<strong>the</strong>less, some guidelines can be <strong>of</strong>fered.<br />
First, avoiding overvaluation <strong>of</strong> <strong>the</strong> currency is important, because an overvalued<br />
currency punishes export industries specializing in manufacturing and services<br />
and also punishes import-competing industries. It takes strong discipline <strong>to</strong> resist<br />
<strong>the</strong> temptation <strong>to</strong> allow <strong>the</strong> currency <strong>to</strong> appreciate above its appropriate level,<br />
because politically popular benefits from cheap foreign exchange accrue <strong>to</strong> both<br />
households and firms that depend on imported inputs. We have here yet ano<strong>the</strong>r<br />
reason why independent but accountable central banks, immune by law from<br />
political pressures, are so important. Monetary policy is now widely considered <strong>to</strong><br />
be <strong>to</strong>o important <strong>to</strong> be left <strong>to</strong> impatient politicians, which is why central banks in<br />
many countries have been granted greater independence from political authorities<br />
so <strong>the</strong>y can pursue as <strong>the</strong>y see fit <strong>the</strong> monetary policy objectives—almost invariably,<br />
low inflation—laid down by <strong>the</strong> government.<br />
The same argument can be applied at least <strong>to</strong> <strong>the</strong> stabilization function <strong>of</strong> fiscal<br />
policy as well as <strong>to</strong> those aspects <strong>of</strong> fiscal policy that have <strong>to</strong> do with <strong>the</strong> disposal<br />
<strong>of</strong> natural resource rents, as mentioned before. Of course, it cannot be<br />
©International Monetary Fund. Not for Redistribution
Gylfason 19<br />
applied <strong>to</strong> fiscal policy across <strong>the</strong> board, because government expenditure and<br />
revenue decisions are inherently political, and in a democracy <strong>the</strong>y cannot, and<br />
must not, be separated from <strong>the</strong> political process. O<strong>the</strong>r institutions, such as<br />
supervisory authorities that moni<strong>to</strong>r banks and financial markets and, where such<br />
<strong>of</strong>fices exist, moni<strong>to</strong>r <strong>the</strong> management <strong>of</strong> natural resource rents, also need protection<br />
through statu<strong>to</strong>ry independence from political authorities. Good governance<br />
requires institutional design that assures effective checks and balances, and it<br />
requires transparency as a prerequisite as well.<br />
Second, consider transparency. Sweden takes transparency seriously, even in its<br />
constitution, which consists <strong>of</strong> four fundamental laws, including <strong>the</strong> Freedom <strong>of</strong><br />
<strong>the</strong> Press Act and <strong>the</strong> Fundamental Law on Freedom <strong>of</strong> Expression. Transparency<br />
needs <strong>to</strong> go hand in hand with accountability and with confidentiality, where<br />
appropriate, including protection for whistle blowers. In this regard, <strong>the</strong><br />
Extractive Industries Transparency Initiative, The Revenue Watch Institute, and<br />
<strong>the</strong> <strong>Natural</strong> Resource Charter have a potentially helpful contribution <strong>to</strong> make,<br />
like Transparency International. Those international efforts deserve <strong>to</strong> be supplemented<br />
by civil society in individual countries, especially in countries that<br />
are prone <strong>to</strong> <strong>the</strong> problems that <strong>of</strong>ten accompany an abundance <strong>of</strong> natural<br />
resources.<br />
Third, more and better education at all levels <strong>of</strong> schooling is conducive <strong>to</strong><br />
diversification, because a good education attracts workers <strong>to</strong> well-paying jobs in<br />
services and manufacturing. Education and diversification go hand in hand.<br />
In sub-Saharan Africa, <strong>the</strong> share <strong>of</strong> services in GDP went up from 46 percent in<br />
1965 <strong>to</strong> 54 percent in 2008, while in North Africa and <strong>the</strong> Middle East <strong>the</strong> services<br />
share contracted from 48 percent <strong>to</strong> 46 percent. By comparison, <strong>the</strong> highincome<br />
countries saw <strong>the</strong> share <strong>of</strong> services in GDP expand from 55 percent in<br />
1970 <strong>to</strong> 73 percent in 2007 (World Bank, 2010b). The new industrial state has<br />
become <strong>the</strong> new services state.<br />
How much government involvement is necessary for diversification? The<br />
government plays a key role in education at all levels. Increased school enrollment<br />
at <strong>the</strong> secondary level as well as at colleges and universities would help, besides<br />
being desirable in its own right. For graduates <strong>to</strong> be able <strong>to</strong> find jobs, <strong>the</strong> government<br />
must also see <strong>to</strong> it that <strong>the</strong> exchange rate <strong>of</strong> <strong>the</strong> currency is compatible with<br />
pr<strong>of</strong>itable manufacturing and services exports. O<strong>the</strong>rwise, young people will not<br />
be motivated <strong>to</strong> educate <strong>the</strong>mselves (Pritchett, 2006). Fur<strong>the</strong>rmore, <strong>the</strong> government<br />
needs <strong>to</strong> foster a business-friendly climate that makes it easy <strong>to</strong> set up new<br />
firms. The World Bank’s annual “Ease <strong>of</strong> Doing Business” ranking is instructive<br />
in this regard. 7 The index reflects how easy (or difficult) it is <strong>to</strong> start a business,<br />
deal with construction permits, employ workers, register property, get credit,<br />
protect inves<strong>to</strong>rs, pay taxes, trade across borders, enforce contracts, and close a<br />
business. In <strong>the</strong> current ranking (2010), Singapore is ranked first out <strong>of</strong> 183<br />
countries, followed by New Zealand, Hong Kong SAR, and China. Those three<br />
7 http://www.doingbusiness.org/Rankings.<br />
©International Monetary Fund. Not for Redistribution
20 <strong>Natural</strong> Resource Endowment: A Mixed Blessing?<br />
are followed by <strong>the</strong> United States and <strong>the</strong> United Kingdom in fourth and fifth<br />
place. The <strong>to</strong>p oil producers on <strong>the</strong> list are Norway, in tenth place, and Saudi<br />
Arabia, in thirteenth place.<br />
Does industrial policy have a role <strong>to</strong> play in promoting diversification? Dani<br />
Rodrik (2004) reviews <strong>the</strong> pros and cons. First, while it is <strong>of</strong>ten claimed that<br />
governments cannot pick winners, <strong>the</strong> inability <strong>to</strong> pick winners needs <strong>to</strong> be<br />
weighed against <strong>the</strong> ability <strong>to</strong> cut losses once mistakes have been made. Second,<br />
it has been said that developing countries lack <strong>the</strong> competent civil service needed<br />
<strong>to</strong> make industrial policy work, but most countries do have or can build pockets<br />
<strong>of</strong> bureaucratic excellence. Third, while industrial policy interventions are prone <strong>to</strong><br />
political capture and corruption, this risk is not confined <strong>to</strong> industrial policy but<br />
is present in o<strong>the</strong>r spheres <strong>of</strong> public policy as well, including privatization. Fourth,<br />
different observers read <strong>the</strong> empirical evidence differently. Some claim that <strong>the</strong>re is<br />
little evidence that industrial policy has worked in <strong>the</strong> past, except in South Korea,<br />
while o<strong>the</strong>rs, including Rodrik (2004), recount several success s<strong>to</strong>ries in Latin<br />
America and elsewhere in <strong>the</strong> developing world. In Chile, for instance, <strong>the</strong> government<br />
encouraged a transfer <strong>of</strong> resources from mining, forestry, fishing, and agriculture<br />
<strong>to</strong> aluminum smelting, salmon farming, and wine production.<br />
Fifth, some hold <strong>the</strong> view that support for research and development as well<br />
as intellectual protection would be more effective than industrial policy, while<br />
o<strong>the</strong>rs believe, on Pigovian grounds, that <strong>the</strong> government needs <strong>to</strong> support entrepreneurship<br />
in new activities with high social returns and low private returns.<br />
Sixth, some claim that international rules no longer leave much scope for industrial<br />
policy interventions, while o<strong>the</strong>rs see plenty <strong>of</strong> scope.<br />
In general, it seems <strong>to</strong> be a good idea <strong>to</strong> encourage new industries in line with<br />
<strong>the</strong> country’s comparative advantages and its available expertise in public administration<br />
and <strong>to</strong> follow <strong>the</strong> market ra<strong>the</strong>r than try <strong>to</strong> take <strong>the</strong> lead. Even so, <strong>the</strong>re<br />
are no easy solutions. Rodrik (2004, p. 3) advocates “strategic collaboration<br />
between <strong>the</strong> private sec<strong>to</strong>r and <strong>the</strong> government with <strong>the</strong> aim <strong>of</strong> uncovering where<br />
<strong>the</strong> most significant obstacles <strong>to</strong> restructuring lie and what type <strong>of</strong> interventions<br />
are most likely <strong>to</strong> remove <strong>the</strong>m.” Policy experiments need <strong>to</strong> be based on general<br />
principles and, at <strong>the</strong> same time, <strong>to</strong> be tailored <strong>to</strong> local circumstances. There is no<br />
such thing as a one-size-fits-all industrial policy, and <strong>the</strong>re never was.<br />
NORWAY AND OTHER SUCCESS STORIES<br />
Norway and Oil<br />
Norway always had its natural resources, <strong>of</strong> course. But it was only with <strong>the</strong><br />
advent <strong>of</strong> educated labor that it became possible for <strong>the</strong> Norwegians <strong>to</strong> harness<br />
those resources on a significant scale. Human capital accumulation was <strong>the</strong> primary<br />
force behind <strong>the</strong> economic transformation <strong>of</strong> Norway. <strong>Natural</strong> capital was<br />
secondary. The World Bank attributes 62 percent <strong>of</strong> Norway’s national wealth <strong>to</strong><br />
intangible capital, including human capital, 21 percent <strong>to</strong> produced capital and<br />
urban land, and 13 percent <strong>to</strong> natural capital; <strong>the</strong> remaining four percent share is<br />
©International Monetary Fund. Not for Redistribution
Gylfason 21<br />
attributed <strong>to</strong> net foreign assets (World Bank, 2010a). Today, earnings from oil constitute<br />
a quarter <strong>of</strong> Norway’s GDP and investment, a third <strong>of</strong> its budget revenues,<br />
and half <strong>of</strong> its export earnings. Norway’s Petroleum Fund, established in 1990 and<br />
now named Government Pension Fund <strong>to</strong> reflect its intended use, will before long<br />
amount <strong>to</strong> US$100,000 per person, or almost two times Norway’s per capita GDP<br />
adjusted for purchasing power parity. It is invested entirely in foreign securities,<br />
currently 60 percent in equities and 40 percent in fixed-income securities.<br />
Norway’s fiscal policy and <strong>the</strong> management <strong>of</strong> its oil wealth have played an<br />
important role in stabilizing <strong>the</strong> local economy. Before, a variable but declining<br />
proportion <strong>of</strong> each year’s net oil-tax revenue was transferred <strong>to</strong> <strong>the</strong> government<br />
budget, essentially <strong>to</strong> cover <strong>the</strong> non-oil budget deficit. However, as <strong>the</strong> relative<br />
importance <strong>of</strong> <strong>the</strong> petroleum sec<strong>to</strong>r declines, <strong>the</strong> share <strong>of</strong> petroleum revenues<br />
directed <strong>to</strong> covering budget deficits will naturally tend <strong>to</strong> rise. Even so, <strong>the</strong><br />
domestic economy has been largely shielded from <strong>the</strong> influx <strong>of</strong> oil money, <strong>the</strong>reby<br />
avoiding overheating and keeping <strong>the</strong> value <strong>of</strong> <strong>the</strong> Norwegian krone from rising.<br />
This deliberate strategy averted, or at least limited, <strong>the</strong> damage <strong>to</strong> non-oil exports<br />
and import-competing industries that would have resulted from a more marked<br />
appreciation <strong>of</strong> <strong>the</strong> krone in real terms. Low inflation in Norway reflects <strong>the</strong><br />
government’s disciplined fiscal and monetary policy stance and, in particular, its<br />
resistance <strong>to</strong> <strong>the</strong> temptation <strong>to</strong> channel <strong>the</strong> country’s oil wealth <strong>to</strong> current uses on<br />
a large scale, even in <strong>the</strong> face <strong>of</strong> loud calls for using more <strong>of</strong> <strong>the</strong> oil revenue <strong>to</strong><br />
address domestic social needs ra<strong>the</strong>r than continue <strong>to</strong> build up <strong>the</strong> Government<br />
Pension Fund.<br />
Norway’s sensible approach <strong>to</strong> oil wealth management deserves <strong>the</strong> attention<br />
it has received from o<strong>the</strong>r resource-rich countries around <strong>the</strong> world. Norway’s<br />
approach has five key features:<br />
(i) From <strong>the</strong> beginning, before <strong>the</strong> first drop <strong>of</strong> oil emerged, <strong>the</strong> oil and gas<br />
reserves within Norwegian jurisdiction were defined by law as common<br />
property resources, <strong>the</strong>reby clearly establishing <strong>the</strong> legal rights <strong>of</strong> <strong>the</strong><br />
Norwegian people <strong>to</strong> <strong>the</strong> resource rents;<br />
(ii) On this legal basis, <strong>the</strong> government has absorbed about 80 percent <strong>of</strong> <strong>the</strong><br />
resource rent over <strong>the</strong> years, having learned <strong>the</strong> hard way, in <strong>the</strong> 1970s, <strong>to</strong><br />
use a relatively small portion <strong>of</strong> <strong>the</strong> <strong>to</strong>tal <strong>to</strong> meet current fiscal needs; since<br />
<strong>the</strong>n it has been setting most <strong>of</strong> its oil revenue aside in <strong>the</strong> Government<br />
Pension Fund;<br />
(iii) Fur<strong>the</strong>r <strong>to</strong> <strong>the</strong> preventive legislation passed at <strong>the</strong> outset, <strong>the</strong> government<br />
laid down economic as well as ethical principles (“commandments”) <strong>to</strong><br />
guide <strong>the</strong> use and exploitation <strong>of</strong> <strong>the</strong> oil and gas for <strong>the</strong> benefit <strong>of</strong> current<br />
and future generations <strong>of</strong> Norwegians;<br />
(iv) The traditional main political parties have from <strong>the</strong> beginning shared an<br />
understanding <strong>of</strong> <strong>the</strong> need <strong>to</strong> shield <strong>the</strong> national economy from an excessive<br />
influx <strong>of</strong> oil money <strong>to</strong> avoid overheating and waste, though this is a<br />
view not shared by <strong>the</strong> Progress Party (established 1973); and<br />
©International Monetary Fund. Not for Redistribution
22 <strong>Natural</strong> Resource Endowment: A Mixed Blessing?<br />
(v) The central bank (Norges Bank), which with <strong>the</strong> adoption <strong>of</strong> inflation<br />
targeting in 2001 began moving <strong>to</strong>ward increased independence from <strong>the</strong><br />
government, manages <strong>the</strong> Government Pension Fund on behalf <strong>of</strong> <strong>the</strong> Ministry<br />
<strong>of</strong> Finance, maintaining a distance between politicians; <strong>the</strong> fund has grown <strong>to</strong><br />
around US$450 billion (US$94,000 per person in Norway in 2009).<br />
By Norwegian law and in keeping with <strong>the</strong> International Covenant on Civil and<br />
Political Rights, <strong>the</strong> oil wealth belongs <strong>to</strong> <strong>the</strong> state. The petroleum industry<br />
extracts oil and gas on public land, albeit <strong>of</strong>fshore. In principle, all <strong>the</strong> rent from<br />
oil and gas should accrue <strong>to</strong> <strong>the</strong> Norwegian people through <strong>the</strong>ir government.<br />
The state’s title <strong>to</strong> <strong>the</strong>se resources constitutes <strong>the</strong> legal basis for government regulation<br />
<strong>of</strong> <strong>the</strong> petroleum sec<strong>to</strong>r as well as for its taxation. Exploration and production<br />
licenses are awarded for a small fee <strong>to</strong> domestic and foreign oil companies<br />
alike. The Norwegian government expropriates <strong>the</strong> oil and gas rent through taxes<br />
and fees as well as direct involvement in <strong>the</strong> development <strong>of</strong> <strong>the</strong> resources ra<strong>the</strong>r<br />
than through sales or auctioning <strong>of</strong> exploration and production rights.<br />
For all <strong>the</strong>se reasons, Norway was able <strong>to</strong> avoid <strong>the</strong> rent seeking and related<br />
problems that have afflicted o<strong>the</strong>r oil exporting countries, particularly Iran,<br />
Libya, Mexico, Nigeria, Russia, Saudi Arabia, Sudan, and Venezuela, among<br />
o<strong>the</strong>rs. Figure 2.4 shows how Norway and Saudi Arabia grew apart after <strong>the</strong> mid-<br />
1980s, a point when <strong>the</strong> two countries had a similar per capita GDP. Economic<br />
indica<strong>to</strong>rs do not do full justice, however, <strong>to</strong> <strong>the</strong> impressive progress made by<br />
Algeria and Saudi Arabia where, since 1960, life expectancy has increased by no<br />
less than 25 years and 27 years, respectively, compared with an increase <strong>of</strong> seven<br />
years in Norway. All things considered, what sets Norway apart is that Norway<br />
was a well-functioning, full-fledged democracy long before its oil discoveries.<br />
Democrats are less likely than dicta<strong>to</strong>rs <strong>to</strong> try <strong>to</strong> grab resources <strong>to</strong> consolidate<br />
<strong>the</strong>ir political power (Mehlum, Moene, and Torvik, 2006). In several o<strong>the</strong>r countries,<br />
point resources such as oil and minerals have proved particularly “loot-able,”<br />
though not in Botswana, <strong>to</strong> which we now turn.<br />
Botswana, Chile, and Mauritius<br />
At its independence in 1966, Botswana started out with 12 kilometers <strong>of</strong> paved<br />
roads, 22 college graduates, and 100 secondary-school graduates (Acemoglu,<br />
Johnson, and Robinson, 2003). Diamonds were discovered <strong>the</strong> following year,<br />
in 1967, and now provide tax revenue equivalent <strong>to</strong> a third <strong>of</strong> GDP. Botswana<br />
has managed its diamond mining quite well and used <strong>the</strong> rents <strong>to</strong> support<br />
rapid growth that has made Botswana <strong>the</strong> most prosperous country in mainland<br />
Africa, having surpassed South Africa a few years ago in terms <strong>of</strong> per capita gross<br />
national income adjusted for purchasing power parity (World Bank, 2010b). In<br />
Botswana, gross secondary-school enrolment rose from 19 percent <strong>of</strong> each cohort<br />
in 1980 <strong>to</strong> 80 percent in 2006, as compared with an increase from 50 percent <strong>to</strong><br />
89 percent in Mauritius over <strong>the</strong> same period. Between 1980 and 2007, Botswana<br />
increased its public expenditure on education from 6 percent <strong>of</strong> GDP <strong>to</strong> 8 percent,<br />
as compared with 4 percent in Mauritius.<br />
©International Monetary Fund. Not for Redistribution
Figure 2.4<br />
Norway and oil<br />
45000<br />
40000<br />
35000<br />
25000<br />
20000<br />
15000<br />
10000<br />
5000<br />
0<br />
1960<br />
Algeria<br />
Norway<br />
Saudi Arabia<br />
1964<br />
1968<br />
1972<br />
1976<br />
1980<br />
1984<br />
1988<br />
1992<br />
1996<br />
2000<br />
2004<br />
2008<br />
Algeria<br />
Norway<br />
Saudi Arabia<br />
1964<br />
1968<br />
1972<br />
1976<br />
1980<br />
1984<br />
1988<br />
1992<br />
1996<br />
2000<br />
2004<br />
Real Per Capita GDP Democracy<br />
Gylfason 23<br />
Unlike Sierra Leone’s alluvial diamonds, which are easy <strong>to</strong> mine by shovel and<br />
pan and easy <strong>to</strong> loot, Botswana’s kimberlite diamonds lie deep in <strong>the</strong> ground and<br />
can only be mined with large hydraulic shovels and o<strong>the</strong>r sophisticated equipment<br />
and, <strong>the</strong>refore, are not very loot-able (Olsson, 2006; Boschini, Pettersson,<br />
and Roine, 2007). This difference probably helped Botswana succeed while Sierra<br />
Leone failed, and so, most likely, did South African involvement—that <strong>of</strong> De<br />
Beers, in particular—in <strong>the</strong> Botswanian diamond industry. True, with a Gini<br />
coefficient <strong>of</strong> 60 according <strong>to</strong> <strong>the</strong> UNDP, 8 Botswana has one <strong>of</strong> <strong>the</strong> world’s least<br />
equal distributions <strong>of</strong> income and a correspondingly high poverty rate. Even so,<br />
by and large Botswana has enjoyed remarkable economic success accompanied by<br />
political stability and a steady advance <strong>of</strong> democracy (Figure 2.5).<br />
With low inflation, albeit slightly higher (at 10 percent per year on average<br />
from 1966 <strong>to</strong> 2008) than in sub-Saharan Africa as a whole, good policies no<br />
doubt contributed <strong>to</strong> this outcome. So did good institutions. The corruption<br />
perceptions index <strong>of</strong> Transparency International for 2009 ranks Botswana higher<br />
than all o<strong>the</strong>r African countries, assigning it 37th place in a group <strong>of</strong> 180 countries.<br />
9 The Ibrahim Index <strong>of</strong> African governance for 2010 puts Botswana in third<br />
place out <strong>of</strong> 53, just behind Mauritius and <strong>the</strong> Seychelles. 10 The World Bank’s<br />
“Ease <strong>of</strong> Doing Business” index for 2010 has Botswana in 45th place out <strong>of</strong> 183,<br />
behind Mauritius (17th) and South Africa (34th) and ahead <strong>of</strong> all o<strong>the</strong>r African<br />
countries as well as, for example, Chile (49th) and Peru (56th). Tragically, due <strong>to</strong><br />
<strong>the</strong> HIV/AIDS epidemic, Botswana’s remarkable economic achievements have<br />
8 See http://hdrstats.undp.org/indica<strong>to</strong>rs/147.html.<br />
9 See http://www.transparency.org/policy_research/surveys_indices/cpi/2009/cpi_2009_table.<br />
10 See http://www.moibrahimfoundation.org/en/section/<strong>the</strong>-ibrahim-index.<br />
©International Monetary Fund. Not for Redistribution<br />
12<br />
10<br />
8<br />
6<br />
4<br />
2<br />
0<br />
-2<br />
-4<br />
-6<br />
-8<br />
-10<br />
-12<br />
1960<br />
2008
24 <strong>Natural</strong> Resource Endowment: A Mixed Blessing?<br />
Figure 2.5<br />
Botswana and diamonds<br />
5000<br />
4500<br />
4000<br />
3500<br />
3000<br />
2500<br />
2000<br />
1500<br />
1000<br />
500<br />
0<br />
1960<br />
Botswana<br />
Congo, Dem. Rep.<br />
Sierra Leone<br />
1964<br />
1968<br />
1972<br />
1976<br />
1980<br />
1984<br />
1988<br />
1992<br />
1996<br />
2000<br />
2004<br />
2008<br />
1964<br />
1968<br />
1972<br />
1976<br />
1980<br />
1984<br />
1988<br />
1992<br />
1996<br />
2000<br />
2004<br />
2008<br />
Real Per Capita GDP Democracy<br />
been accompanied by only a modest increase in life expectancy since 1960 <strong>of</strong> four<br />
years, as compared with longer lives by 14 years in Sierra Leone and six years in<br />
<strong>the</strong> Democratic Republic <strong>of</strong> Congo (Figure 2.5).<br />
Unlike Botswana, Mauritius made a deliberate and successful effort <strong>to</strong> reduce<br />
its reliance on its main export commodity, sugar. This was done through good<br />
policies and good institutions, emphasizing education and foreign trade through<br />
diplomacy and o<strong>the</strong>r means. The share <strong>of</strong> manufactures in merchandise exports<br />
increased from 2 percent in 1970 <strong>to</strong> 57 percent in 2008. Even so, sugarcane remains<br />
<strong>the</strong> dominant crop, generating 25 percent <strong>of</strong> export earnings. Since <strong>the</strong> mid-1970s,<br />
<strong>to</strong>tal exports have hovered around 50 percent <strong>to</strong> 60 percent <strong>of</strong> GDP, as in Botswana.<br />
These are high ratios by both African and international standards, even for small<br />
countries with populations below two million. Between 1977 and 2008, inflation was<br />
kept below 9 percent per year on average. During <strong>the</strong> same period, investment in<br />
Mauritius amounted <strong>to</strong> 26 percent <strong>of</strong> GDP against 32 percent in Botswana. Life<br />
expectancy at birth in Mauritius has increased by 13 years since 1960. As Figure 2.6<br />
shows, two o<strong>the</strong>r sugar exporters, Fiji and Costa Rica, have likewise added <strong>to</strong> <strong>the</strong>ir<br />
average life expectancies, by 13 percent and 17 percent, respectively.<br />
Thus, like Botswana, Mauritius did many things right. Beyond <strong>the</strong> usual suspected<br />
determinants <strong>of</strong> growth that Mauritius got right, including education,<br />
exports, and investment, Frankel (2010) suggests that <strong>the</strong> cosmopolitan nature<br />
and origin <strong>of</strong> <strong>the</strong> population <strong>of</strong> Mauritius contributed <strong>to</strong> <strong>the</strong> island’s successful,<br />
harmonious, and democratic development by creating a balance between ethnic<br />
groups, as in Singapore, Hong Kong SAR, and Dubai. Frankel points out that<br />
<strong>the</strong> three African countries with <strong>the</strong> highest governance rankings (Mauritius,<br />
Seychelles, and Cape Verde) are all small islands that had no indigenous population,<br />
suggesting that it helps that everyone “came from somewhere else” as in <strong>the</strong><br />
United States (except, <strong>of</strong> course, for <strong>the</strong> Native Americans).<br />
10<br />
8<br />
6<br />
4<br />
2<br />
0<br />
1960<br />
-2<br />
-4<br />
-6<br />
-8<br />
Botswana<br />
Sierra Leone<br />
©International Monetary Fund. Not for Redistribution
Figure 2.6<br />
Mauritius and sugar<br />
6000<br />
5000<br />
4000<br />
3000<br />
2000<br />
1960<br />
1964<br />
1968<br />
1972<br />
1976<br />
1980<br />
1984<br />
1988<br />
1992<br />
1996<br />
2000<br />
2004<br />
2008<br />
1000<br />
7000<br />
6000<br />
5000<br />
4000<br />
3000<br />
2000<br />
1000<br />
0<br />
0<br />
Costa Rica<br />
Fiji<br />
Mauritius<br />
Figure 2.7<br />
Chile and copper<br />
Costa Rica<br />
1960<br />
1964<br />
1968<br />
1972<br />
1976<br />
1980<br />
1984<br />
1988<br />
1992<br />
1996<br />
2000<br />
2004<br />
2008<br />
Gylfason 25<br />
Figure 2.7 shows <strong>the</strong> development <strong>of</strong> real per capita GDP and democracy in<br />
Chile, Peru, and Zambia. Zambia has failed <strong>to</strong> grow despite its considerable copper<br />
deposits, but all <strong>the</strong> same it has made commendable albeit uneven progress<br />
on <strong>the</strong> democracy front. The rapid growth <strong>of</strong> Chile and Peru has gone hand in<br />
hand with much leng<strong>the</strong>ned life spans, by 22 years and 26 years, respectively,<br />
while life expectancy at birth in Zambia has s<strong>to</strong>od still at 45 years since 1960.<br />
Since its return <strong>to</strong> democracy in 1988, Chile has made rapid progress and become<br />
a full-fledged democracy and member <strong>of</strong> <strong>the</strong> OECD, tripling its real per capita<br />
GDP since <strong>the</strong> 1980s. Chile has opened up <strong>to</strong> trade: exports <strong>of</strong> goods and services<br />
increased from 13 percent <strong>of</strong> GDP in 1960 <strong>to</strong> 45 percent in 2008. By contrast,<br />
Fiji<br />
Mauritius<br />
Real Per Capita GDP Democracy<br />
Chile<br />
Peru<br />
Zambia<br />
1960<br />
1964<br />
1968<br />
1972<br />
1976<br />
1980<br />
1984<br />
1988<br />
1992<br />
1996<br />
2000<br />
2004<br />
2008<br />
12<br />
10<br />
8<br />
6<br />
4<br />
2<br />
0<br />
-2<br />
-4<br />
-6<br />
12<br />
10<br />
8<br />
6<br />
4<br />
2<br />
0<br />
-2<br />
-4<br />
-6<br />
-8<br />
-10<br />
Chile<br />
Peru<br />
Zambia<br />
1960<br />
1964<br />
1968<br />
1972<br />
1976<br />
1980<br />
1984<br />
1988<br />
1992<br />
1996<br />
2000<br />
2004<br />
2008<br />
Real Per Capita GDP Democracy<br />
©International Monetary Fund. Not for Redistribution
26 <strong>Natural</strong> Resource Endowment: A Mixed Blessing?<br />
Zambia, also a major copper exporter, saw its exports plunge from 60 percent <strong>of</strong><br />
GDP at independence in 1964 <strong>to</strong> 37 percent in 2008. Even so, manufactures<br />
accounted for only 12 percent <strong>of</strong> Chile’s <strong>to</strong>tal merchandise exports in 2008, compared<br />
with 16 percent <strong>of</strong> exports in Peru, <strong>to</strong> name ano<strong>the</strong>r major copper exporter,<br />
and 7 percent in Zambia. Chile now sends 84 percent <strong>of</strong> its young people <strong>to</strong><br />
secondary school, compared with 98 percent in Peru and 52 percent in Zambia.<br />
Inflation is a thing <strong>of</strong> <strong>the</strong> past in Chile, while Zambia has grappled with doubledigit<br />
inflation or worse most <strong>of</strong> <strong>the</strong> time since independence. Chile <strong>the</strong>refore fits<br />
in<strong>to</strong> this general pattern: exports, education, investment, and price stability are<br />
good for growth, especially when encouraged by good governance, including<br />
democracy.<br />
FROM ANECDOTES TO EMPIRICAL TESTING<br />
The time has now come <strong>to</strong> turn from s<strong>to</strong>ry-telling <strong>to</strong> statistical analysis. This section<br />
presents a series <strong>of</strong> growth regression estimates for 164 countries during<br />
1960–2000. 11 The strategy will be <strong>to</strong> regress <strong>the</strong> rate <strong>of</strong> growth <strong>of</strong> per-capita<br />
GDP during this 40-year period on <strong>the</strong> share <strong>of</strong> natural capital in <strong>to</strong>tal wealth,<br />
defined as in Figure 2.2, and <strong>the</strong>n <strong>to</strong> add <strong>to</strong> <strong>the</strong> regression model o<strong>the</strong>r potential<br />
determinants <strong>of</strong> growth representing aspects <strong>of</strong> o<strong>the</strong>r types <strong>of</strong> capital in order<br />
<strong>to</strong> assess <strong>the</strong> robustness <strong>of</strong> <strong>the</strong> initial result—that is, <strong>to</strong> see if natural capital<br />
survives <strong>the</strong> introduction <strong>of</strong> additional explana<strong>to</strong>ry variables that are commonly<br />
used in empirical growth research. As we add more independent<br />
variables, <strong>the</strong> number <strong>of</strong> observations drops gradually from 164 <strong>to</strong> 90 due <strong>to</strong><br />
missing data. No outliers will be excluded. The estimation method is ordinary<br />
least squares (OLS). However, <strong>the</strong> final benchmark model will also be estimated<br />
as a system by <strong>the</strong> seemingly unrelated regression (SUR) method <strong>to</strong> demonstrate<br />
that <strong>the</strong> SUR results are essentially <strong>the</strong> same as <strong>the</strong> OLS results. This may<br />
suggest that, as an empirical matter, <strong>the</strong> endogeneity <strong>of</strong> several <strong>of</strong> <strong>the</strong> explana<strong>to</strong>ry<br />
variables in <strong>the</strong> growth equations is not, quantitatively speaking, a serious<br />
problem in this estimation exercise.<br />
Growth across Countries<br />
Table 2.1 presents <strong>the</strong> resulting sequence <strong>of</strong> regressions. An interpretation <strong>of</strong> <strong>the</strong><br />
size and economic significance <strong>of</strong> <strong>the</strong> coefficients will be <strong>of</strong>fered at <strong>the</strong> end <strong>of</strong> <strong>the</strong><br />
journey. Model 1 describes a statistically significant inverse relationship between<br />
per capita growth and <strong>the</strong> logarithm <strong>of</strong> initial income (i.e., in 1960). This relationship<br />
reflects conditional convergence—<strong>the</strong> idea that rich countries grow less<br />
rapidly than poor ones because <strong>the</strong> rich have already exploited more <strong>of</strong> <strong>the</strong> growth<br />
opportunities available <strong>to</strong> <strong>the</strong>m, for instance by sending more young people <strong>to</strong><br />
school. Initial income is defined as purchasing-power-parity-adjusted per capita<br />
GNI in 2000 divided by an appropriate growth fac<strong>to</strong>r <strong>to</strong> ensure consistency<br />
11 This section draws on Gylfason, 2008.<br />
©International Monetary Fund. Not for Redistribution
Gylfason 27<br />
TABLE 2.1<br />
Regression results on natural capital and economic growth<br />
Model Model Model Model Model Model Model Model<br />
1 2 3 4 5 6 7 8<br />
Initial income -0.738 -0.491 -0.955 -1.066 -1.237 -1.603 -1.702 -1.702<br />
(5.2) (3.1) (5.3) (5.2) (7.0) (7.8) (8.5) (8.9)<br />
<strong>Natural</strong> capital share -0.043 -0.059 -0.045 -0.043 -0.032 -0.025 -0.025<br />
(5.3) (7.1) (4.7) (5.3) (4.0) (3.1) (3.3)<br />
<strong>Natural</strong> capital per person 0.096 0.084 0.062 0.046 0.041 0.041<br />
(4.5) (3.7) (3.3) (2.5) (2.3) (2.4)<br />
Democracy 0.071 0.073 0.073 0.054 0.054<br />
(2.2) (2.7) (2.7) (2.0) (2.1)<br />
Investment rate (log) 2.921 1.723 1.341 1.341<br />
(6.8) (3.2) (2.5) (2.6)<br />
Secondary-school enrolment<br />
0.940 0.556 0.556<br />
(log)<br />
(4.0) (2.1) (2.2)<br />
Fertility -0.402 -0.402<br />
(2.8) (3.0)<br />
Countries 164 125 124 113 113 90 90 90<br />
Adjusted R2 0.14 0.18 0.29 0.27 0.48 0.55 0.58 0.58<br />
Estimation method OLS OLS OLS OLS OLS OLS OLS SUR<br />
Note: The dependent variable is <strong>the</strong> average rate <strong>of</strong> growth <strong>of</strong> per capita GDP 1960–2000. t-values are shown<br />
within paren<strong>the</strong>ses.<br />
between our income measures in 1960 and 2000 and our measures <strong>of</strong> economic<br />
growth between those years. The coefficient on initial income is significantly<br />
negative, as expected.<br />
In Model 2, we add <strong>to</strong> <strong>the</strong> regression <strong>the</strong> World Bank’s measure <strong>of</strong> <strong>the</strong> natural<br />
capital share in <strong>to</strong>tal wealth in <strong>the</strong> year 2000 (recall Figure 2.2), our proxy for<br />
natural resource dependence. An increase in <strong>the</strong> natural capital share reduces<br />
growth for given initial income. When natural capital per person, our proxy for<br />
natural resource abundance, is added <strong>to</strong> <strong>the</strong> regression in Model 3, we see that<br />
natural resource dependence continues <strong>to</strong> hurt growth as hypo<strong>the</strong>sized, even<br />
if natural resource abundance has a positive effect on growth. Next, in Model 4,<br />
we add democracy as a proxy for one important aspect <strong>of</strong> social capital <strong>to</strong> <strong>the</strong><br />
regression. The democracy variable is taken from <strong>the</strong> Polity IV Project at <strong>the</strong><br />
University <strong>of</strong> Maryland (Marshall and Jaggers, 2001). The democracy variable<br />
is defined as <strong>the</strong> difference between an index <strong>of</strong> democracy, which runs from<br />
zero in hard-core dicta<strong>to</strong>rships <strong>to</strong> 10 in full-fledged democracies, and an index<br />
<strong>of</strong> au<strong>to</strong>cracy, which similarly runs from 0 in democracies <strong>to</strong> 10 in dicta<strong>to</strong>rships.<br />
Each <strong>of</strong> <strong>the</strong> two index components reflects various aspects <strong>of</strong> democratic rights<br />
and freedoms and is an average over <strong>the</strong> years 1960–2000. The composite<br />
democracy index used here spans <strong>the</strong> range from –10 <strong>to</strong> 10 (this is <strong>the</strong> polity2<br />
index in <strong>the</strong> Polity IV database). The democracy index is significantly correlated<br />
with <strong>the</strong> Ibrahim Index <strong>of</strong> African governance. The correlation between <strong>the</strong><br />
average values <strong>of</strong> <strong>the</strong> two indices for 53 African countries during 2000–08 is<br />
0.41. Model 4 suggests that democracy is good for growth. All <strong>the</strong> preceding<br />
variables survive.<br />
©International Monetary Fund. Not for Redistribution
28 <strong>Natural</strong> Resource Endowment: A Mixed Blessing?<br />
Model 5 shows that <strong>the</strong> log <strong>of</strong> <strong>the</strong> share <strong>of</strong> gross domestic investment in GDP<br />
makes a significant contribution <strong>to</strong> growth as expected. The logarithmic formulation<br />
is intended <strong>to</strong> capture decreasing returns <strong>to</strong> investment. In Model 6, we see<br />
how <strong>the</strong> log <strong>of</strong> <strong>the</strong> secondary-school enrolment rate, like investment, stimulates<br />
growth without displacing any <strong>of</strong> <strong>the</strong> variables inherited from <strong>the</strong> preceding<br />
models.<br />
At last, in Model 7, we enter fertility (measured by <strong>the</strong> number <strong>of</strong> births per<br />
woman) in<strong>to</strong> <strong>the</strong> regression <strong>to</strong> see if it matters for growth. Its influence is suggested<br />
by <strong>the</strong> neoclassical growth model as well as by <strong>the</strong> idea that reduced fertility<br />
can be regarded as an alternative form <strong>of</strong> investment in human capital by<br />
making it possible for most parents <strong>to</strong> send relatively more <strong>of</strong> <strong>the</strong>ir children <strong>to</strong><br />
school when <strong>the</strong>y have small families than when <strong>the</strong>y have large ones. We see<br />
that increased fertility reduces economic growth as expected, without reducing<br />
<strong>the</strong> statistical significance <strong>of</strong> <strong>the</strong> explana<strong>to</strong>ry variables already included in <strong>the</strong><br />
regression.<br />
The bot<strong>to</strong>m row <strong>of</strong> Table 2.1 shows how <strong>the</strong> adjusted R 2 rises gradually as<br />
more explana<strong>to</strong>ry variables are added <strong>to</strong> <strong>the</strong> growth regression and ultimately<br />
reaches 0.58, indicating that Model 7 explains well over half <strong>of</strong> <strong>the</strong> cross-country<br />
variation in <strong>the</strong> long-run rate <strong>of</strong> growth <strong>of</strong> per capita output. 12 Clearly, Model 7<br />
does not tell <strong>the</strong> whole s<strong>to</strong>ry <strong>of</strong> <strong>the</strong> determinants <strong>of</strong> growth; no model does that.<br />
For example, despite broad agreement among economists on <strong>the</strong>oretical grounds<br />
that foreign trade is good for growth, indica<strong>to</strong>rs <strong>of</strong> openness <strong>to</strong> trade <strong>of</strong>ten fail <strong>to</strong><br />
register as significant sources <strong>of</strong> growth in econometric work. When <strong>to</strong>o many<br />
explana<strong>to</strong>ry variables are in a single growth equation, <strong>the</strong>y tend <strong>to</strong> get in each<br />
o<strong>the</strong>r’s way. Presumably, this happens when two or more explana<strong>to</strong>ry variables<br />
compete <strong>to</strong> explain <strong>the</strong> same source <strong>of</strong> efficiency gains.<br />
When an interaction term involving <strong>the</strong> multiple <strong>of</strong> <strong>the</strong> natural capital share<br />
and <strong>the</strong> democracy variable is added <strong>to</strong> Model 7 in <strong>the</strong> spirit <strong>of</strong> Mehlum,<br />
Moene, and Torvik (2006) and Collier and Hoeffler (2009), we find that <strong>the</strong><br />
positive effect <strong>of</strong> democracy on growth is smaller (and in a few extreme cases<br />
turns negative) in countries with a high share <strong>of</strong> natural capital in national<br />
wealth (not shown). This result suggests that increased dependence on natural<br />
resources undermines <strong>the</strong> growth gains from democracy. Collier and Hoeffler<br />
(2009) find <strong>the</strong> same. They report that large resource rents tend <strong>to</strong> undermine<br />
checks and balances, <strong>the</strong>reby unleashing patronage politics and undercutting<br />
<strong>the</strong> benefits that o<strong>the</strong>rwise would flow from democracy, including elec<strong>to</strong>ral<br />
competition, <strong>to</strong> growth. In <strong>the</strong>ir results, this mechanism outweighs <strong>the</strong> channel<br />
through which democracy effectively restrains rent seekers, thus making a larger<br />
contribution <strong>to</strong> growth in resource-rich countries than elsewhere. These findings<br />
suggest that resource-rich economies need particularly strong checks and<br />
balances <strong>to</strong> contain <strong>the</strong> potential damage from rent seeking. The regression<br />
12 2<br />
The drop in <strong>the</strong> adjusted R when democracy is added <strong>to</strong> <strong>the</strong> regression in Model 4 stems from <strong>the</strong><br />
decrease in <strong>the</strong> number <strong>of</strong> observations.<br />
©International Monetary Fund. Not for Redistribution
Gylfason 29<br />
result above implies that <strong>the</strong> negative effect <strong>of</strong> natural resource dependence on<br />
growth is significantly more negative in democracies than under authoritarian<br />
regimes (not shown). The result suggests that <strong>the</strong> checks and balances that<br />
Collier and Hoeffler (2009) call for are not yet in place in many countries.<br />
From this point <strong>of</strong> view, our empirical findings on <strong>the</strong> interaction between<br />
natural resource dependence and democracy accord also with those <strong>of</strong> Mehlum,<br />
Moene, and Torvik (2006) who report that good institutions deflate <strong>the</strong> damaging<br />
effects <strong>of</strong> resource dependence on growth.<br />
The results in Model 7 can be questioned on <strong>the</strong> reasonable grounds that<br />
several <strong>of</strong> <strong>the</strong> explana<strong>to</strong>ry variables are likely <strong>the</strong>mselves <strong>to</strong> be endogenous. In<br />
particular, it is reasonable <strong>to</strong> think <strong>of</strong> democracy, investment, education, and<br />
fertility as endogenous economic variables that depend, among o<strong>the</strong>r things, on<br />
initial income, <strong>the</strong> sole clearly exogenous variable in <strong>the</strong> model. For simplicity,<br />
we will view <strong>the</strong> two natural capital variables as exogenous as well. Ra<strong>the</strong>r than<br />
look for virtually impossible-<strong>to</strong>-find instruments with <strong>the</strong> requisite properties<br />
<strong>to</strong> address <strong>the</strong> potential endogeneity problem at hand, we apply <strong>the</strong> SUR<br />
method. By this method, democracy, investment, education, and fertility are<br />
first separately regressed on initial output and <strong>the</strong> two natural capital variables.<br />
By design, <strong>the</strong> predicted values from those regressions are <strong>the</strong>mselves exogenous.<br />
When those predicted values are used instead <strong>of</strong> <strong>the</strong> corresponding<br />
original values in <strong>the</strong> growth regression, all <strong>the</strong> explana<strong>to</strong>ry variables in that<br />
regression are exogenous. The effects <strong>of</strong> natural resource dependence on growth<br />
via democracy, investment, education, and fertility are present in <strong>the</strong> growth<br />
equation. Even if <strong>the</strong> direct effect <strong>of</strong> natural resource dependence on growth<br />
were found <strong>to</strong> be insignificant, <strong>the</strong>re would still be room for natural resource<br />
dependence <strong>to</strong> move growth through <strong>the</strong> four dependent variables <strong>of</strong> <strong>the</strong> auxiliary<br />
equations.<br />
The results <strong>of</strong> estimating our growth model as part <strong>of</strong> this five-equation system<br />
are presented in Model 8 in Table 2.1. They are virtually <strong>the</strong> same as in Model 7.<br />
Provided we accept that <strong>the</strong> two natural capital variables are approximately exogenous<br />
for our purposes and that <strong>the</strong> system is correctly specified, <strong>the</strong> similarity<br />
between <strong>the</strong> results from Models 7 and 8 seems <strong>to</strong> suggest that endogeneity, at<br />
least that part <strong>of</strong> it that stems from democracy, investment, education, and fertility,<br />
does not severely contaminate <strong>the</strong> results in Model 7. 13<br />
The results from Model 7 accord reasonably well with a number <strong>of</strong> recent<br />
empirical growth studies. In Model 7, <strong>the</strong> coefficient on initial income suggests<br />
a conditional convergence speed <strong>of</strong> almost two percent per year. This is not far<br />
13 The auxiliary equations for democracy, investment, education, and fertility (not presented) show<br />
a significantly positive effect <strong>of</strong> initial income on democracy and education, an insignificant effect on<br />
investment, and a significantly negative effect on fertility, all as expected. They also show a significantly<br />
negative effect <strong>of</strong> natural resource dependence on democracy, investment, and education and<br />
a significantly positive effect on fertility. At last, <strong>the</strong>y show a significantly positive effect <strong>of</strong> natural<br />
capital abundance on democracy and investment, an insignificant effect on education, and a significantly<br />
negative effect on fertility.<br />
©International Monetary Fund. Not for Redistribution
30 <strong>Natural</strong> Resource Endowment: A Mixed Blessing?<br />
below <strong>the</strong> two percent <strong>to</strong> three percent range typically reported in econometric<br />
growth research. The coefficient on <strong>the</strong> natural resource dependence variable suggests<br />
that an increase in <strong>the</strong> share <strong>of</strong> natural capital in <strong>to</strong>tal wealth by 20 percentage<br />
points reduces per capita growth by half a percentage point, even if natural<br />
resource abundance may at <strong>the</strong> same time be good for growth. This effect is<br />
broadly in line with several recent studies, beginning with Sachs and Warner<br />
(1995), that have reported an adverse effect <strong>of</strong> natural resource dependence on<br />
growth, based on various measures <strong>of</strong> <strong>the</strong> natural resource intensity variable. 14<br />
The coefficient on <strong>the</strong> natural resource abundance variable is discussed in <strong>the</strong> next<br />
subsection. The coefficient on <strong>the</strong> investment rate suggests that an increase in<br />
investment by 37 percent (e.g., from 18 percent <strong>of</strong> GDP <strong>to</strong> 25 percent) increases<br />
annual per capita growth by half a percentage point, a strong but fairly typical<br />
result in those growth studies that report a statistically significant effect <strong>of</strong> investment<br />
on growth (ra<strong>the</strong>r than leaving investment out on <strong>the</strong> grounds that it is an<br />
endogenous variable like growth). The coefficient on <strong>the</strong> education variable in<br />
Model 7 means that an increase in secondary-school enrolment by 90 percent<br />
(e.g., from 25 percent <strong>to</strong> 48 percent) increases per capita growth by half a percentage<br />
point. A reduction in fertility from 4.25 births per woman <strong>to</strong> 3.0 births per<br />
woman also increases annual per capita growth by half a percentage point. This<br />
suggests a significant population drag on growth or, alternatively, an additional<br />
channel through which <strong>the</strong> build-up <strong>of</strong> human capital aids growth.<br />
Net Effects <strong>of</strong> <strong>Natural</strong> Capital<br />
We have seen that natural capital influences economic growth in two ways. An<br />
increase in <strong>the</strong> share <strong>of</strong> natural capital in <strong>to</strong>tal wealth reduces economic growth,<br />
while an increase in natural capital per person stimulates growth. Because natural<br />
capital per person equals, by definition, <strong>the</strong> multiple <strong>of</strong> <strong>the</strong> share <strong>of</strong> natural capital<br />
in <strong>to</strong>tal wealth and wealth per person, Model 7 in Table 2.1 suggests that <strong>the</strong> <strong>to</strong>tal<br />
effect <strong>of</strong> an increase in <strong>the</strong> natural capital share on economic growth is –0.025 plus<br />
0.041 times wealth per person (in hundreds <strong>of</strong> thousands <strong>of</strong> U.S. dollars).<br />
Therefore, <strong>the</strong> <strong>to</strong>tal effect <strong>of</strong> an increase in <strong>the</strong> natural capital share on growth<br />
declines with wealth per person but remains negative as long as <strong>to</strong>tal per capita<br />
wealth is below US$61,000 (= 0.025/0.041×10 5 ). For comparison, <strong>the</strong> median<br />
<strong>to</strong>tal per capita wealth in our sample is US$35,000. In <strong>the</strong> sample, 106 countries<br />
have <strong>to</strong>tal wealth below US$61,000 and 58 countries have more than that. This<br />
means that an increase in <strong>the</strong> natural capital share tends <strong>to</strong> reduce growth in developing<br />
countries, but may well increase growth in industrial countries. Hence, <strong>the</strong><br />
net effect <strong>of</strong> an increase in <strong>the</strong> natural capital share on growth is negative in twothirds<br />
<strong>of</strong> <strong>the</strong> countries in <strong>the</strong> sample. These results can be supplemented by tracing<br />
<strong>the</strong> additional effects <strong>of</strong> increased natural capital on real capital via blunted incentives<br />
<strong>to</strong> save and invest; on human capital through neglect <strong>of</strong> education; on social<br />
capital via rent seeking, civil and political oppression, corruption, and so forth; on<br />
14 For a contrary view, see Lederman and Maloney, 2008.<br />
©International Monetary Fund. Not for Redistribution
TABLE 2.2<br />
Decomposition <strong>of</strong> per capita growth (in percent)<br />
Per capita growth 2.42 1.00<br />
<strong>Natural</strong> capital share (19.0) 0.47 0.19<br />
Democracy (6.4) 0.35 0.14<br />
Investment (log, 0.29) 0.39 0.16<br />
Secondary-school enrolment (log, 0.86) 0.48 0.20<br />
Fertility (1.8) 0.73 0.30<br />
Gylfason 31<br />
Note: The table shows <strong>the</strong> contributions <strong>to</strong> per capita growth per year <strong>of</strong> a decrease in <strong>the</strong> natural capital<br />
share and fertility and an increase in democracy, investment, and school life expectancy by one standard<br />
deviation for each variable. In <strong>the</strong> last column, <strong>the</strong> growth rate in <strong>the</strong> <strong>to</strong>p row is normalized <strong>to</strong> one.<br />
Standard deviations are shown within paren<strong>the</strong>ses.<br />
financial capital through failure <strong>to</strong> develop institutions; and on foreign capital<br />
through protectionism along <strong>the</strong> lines discussed in <strong>the</strong> next section.<br />
Relative Importance <strong>of</strong> Different Sources <strong>of</strong> Growth<br />
What do <strong>the</strong> results reported here suggest about <strong>the</strong> relative importance <strong>of</strong> <strong>the</strong><br />
different determinants <strong>of</strong> growth included in Model 7? To see this, consider a<br />
country whose growth performance is correctly described by Model 7 in Table 2.1<br />
and where five <strong>of</strong> <strong>the</strong> determinants <strong>of</strong> growth listed—natural capital share,<br />
democracy, investment, education, and fertility—move in a growth-friendly<br />
direction by one standard deviation each (shown within paren<strong>the</strong>ses after each<br />
variable), while initial income and natural capital per person remain unchanged.<br />
Table 2.2 shows that such a change would increase <strong>the</strong> country’s per capita<br />
growth by 2.42 percentage points and, moreover, disentangles <strong>the</strong> individual<br />
contributions <strong>of</strong> <strong>the</strong> five separate determinants <strong>of</strong> growth <strong>to</strong> this outcome. For<br />
comparison, <strong>the</strong> median per capita growth rate in our sample from 1960 <strong>to</strong> 2000<br />
was 1.5 percent per year. The last column normalizes <strong>the</strong> preceding column by<br />
assuming instead that each variable changes by 41 percent <strong>of</strong> a standard deviation<br />
such that per capita growth increases by one percentage point. Strikingly, <strong>the</strong><br />
human capital variables—education and fertility—account for half <strong>of</strong> <strong>the</strong> increase<br />
in growth by one percentage point, with investment in real capital, natural<br />
resource dependence, and democracy accounting for <strong>the</strong> remaining half.<br />
Accounting for roughly a fifth <strong>of</strong> <strong>the</strong> <strong>to</strong>tal effect, <strong>the</strong> natural capital share makes<br />
an economically as well as statistically significant contribution <strong>to</strong> economic growth<br />
for <strong>the</strong> given natural capital per person. Investment and democracy also make a<br />
difference <strong>to</strong> growth, each accounting for roughly a sixth <strong>of</strong> <strong>the</strong> <strong>to</strong>tal effect. In this<br />
exercise, none <strong>of</strong> <strong>the</strong>se variables can be counted out. They all make a difference.<br />
CONCLUSION<br />
The list <strong>of</strong> countries that have failed <strong>to</strong> use <strong>the</strong>ir abundant natural resources <strong>to</strong> foster<br />
rapid economic and social progress is a long one. Before we conclude, consider<br />
Nigeria, which has not been mentioned thus far in this chapter except in passing.<br />
©International Monetary Fund. Not for Redistribution
32 <strong>Natural</strong> Resource Endowment: A Mixed Blessing?<br />
Nigeria’s per capita GDP grew more than twice as fast in its first decade after<br />
independence, 1960–1970, as it did subsequently, despite <strong>the</strong> colossal export<br />
revenue boom <strong>of</strong> <strong>the</strong> 1970s and beyond. Per capita growth in Nigeria has averaged<br />
1.1 percent per year since 1960. Life expectancy since independence has<br />
increased by 10 weeks a year, on average, for a <strong>to</strong>tal <strong>of</strong> ten more years <strong>of</strong> life for<br />
<strong>the</strong> average Nigerian from independence compared with 25 more years in Algeria,<br />
for example. This is not much <strong>to</strong> show for all <strong>of</strong> Nigeria’s oil proceeds. Gross<br />
mismanagement <strong>of</strong> <strong>the</strong> oil rent appears <strong>to</strong> be at <strong>the</strong> root <strong>of</strong> Nigeria’s problems,<br />
and Nigeria is not alone.<br />
To get Nigeria growing again, it has been suggested that oil revenues must be<br />
transferred from public hands <strong>to</strong> <strong>the</strong> private sec<strong>to</strong>r (Sala-i-Martin and Subramanian,<br />
2003). But <strong>the</strong> private sec<strong>to</strong>r is far from infallible <strong>to</strong>o, as events since 2007 in<br />
world financial markets, including in Nigeria, have demonstrated once again.<br />
Consider this analogy: If judges prove corrupt, <strong>the</strong> solution is not <strong>to</strong> privatize <strong>the</strong><br />
judicial system. Ra<strong>the</strong>r, <strong>the</strong> solution must be <strong>to</strong> replace <strong>the</strong> failed judges and<br />
reform <strong>the</strong> system by legal or constitutional means aimed at securing <strong>the</strong> integrity<br />
<strong>of</strong> <strong>the</strong> courts.<br />
Never<strong>the</strong>less, if <strong>the</strong> privatization route is taken in Nigeria, it matters <strong>to</strong> whom<br />
in <strong>the</strong> private sec<strong>to</strong>r <strong>the</strong> oil rent is transferred. If <strong>the</strong> rent is divided evenly among<br />
<strong>the</strong> adult population, as in Alaska, <strong>the</strong> allocation could be deemed fair if not<br />
necessarily efficient. If, on <strong>the</strong> o<strong>the</strong>r hand, <strong>the</strong> resource rent is granted <strong>to</strong> select<br />
interested parties, as in Iceland where fishing quotas are handed free <strong>of</strong> charge <strong>to</strong><br />
boat owners, <strong>the</strong> allocation fails <strong>the</strong> fairness test as well as <strong>the</strong> efficiency test.<br />
In this spirit, ra<strong>the</strong>r than dwell on failure, this chapter has highlighted some<br />
key features <strong>of</strong> some <strong>of</strong> <strong>the</strong> most successful natural-resource-rich countries, especially<br />
Norway and also, briefly, Botswana, Chile, and Mauritius. Empowered by<br />
vivacious trade, strong emphasis on education, good policies, and good governance,<br />
<strong>the</strong>se countries have been able <strong>to</strong> harness <strong>the</strong>ir resource rents for <strong>the</strong> benefit<br />
<strong>of</strong> <strong>the</strong>ir people, <strong>the</strong> rightful owners <strong>of</strong> <strong>the</strong> resources according <strong>to</strong> local laws as<br />
well as <strong>the</strong> International Covenant on Civil and Political Rights. Privatization was<br />
not part <strong>of</strong> <strong>the</strong> solution.<br />
The United States remains <strong>the</strong> sole country that transferred its oil wealth <strong>to</strong><br />
private companies, though it did so long ago and quite legitimately within its<br />
democratic system <strong>of</strong> government. By contrast, <strong>the</strong> Norwegian government in its<br />
role as guardian <strong>of</strong> <strong>the</strong> people has kept a tight grip on <strong>the</strong> country’s oil wealth<br />
while at <strong>the</strong> same time setting up a governance structure intended <strong>to</strong> safeguard its<br />
Oil Fund, now its Pension Fund, from political interference. Clearly, African<br />
countries, with <strong>the</strong>ir pressing economic and social needs, cannot be expected <strong>to</strong><br />
show <strong>the</strong> same patience as <strong>the</strong> Norwegians. Africa is in a hurry.<br />
Even so, African countries have it within <strong>the</strong>ir grasp <strong>to</strong> build up governance<br />
structures designed <strong>to</strong> separate <strong>the</strong> management <strong>of</strong> <strong>the</strong>ir resource wealth from<br />
short-term political pressures. Any country with an independent judiciary or<br />
an independent central bank or both knows, from experience, how <strong>to</strong> set up<br />
institutions <strong>to</strong> immunize from <strong>the</strong> vicissitudes <strong>of</strong> <strong>the</strong> political process those<br />
public policy spheres deemed <strong>to</strong>o important <strong>to</strong> be left in <strong>the</strong> hands <strong>of</strong> politicians.<br />
©International Monetary Fund. Not for Redistribution
Gylfason 33<br />
But even if this task can be satisfac<strong>to</strong>rily accomplished, it will remain desirable<br />
and necessary <strong>to</strong> tailor fiscal, monetary, and exchange-rate policies and institutions<br />
in resource-rich countries <strong>to</strong> <strong>the</strong>ir special circumstances, not least <strong>to</strong><br />
increase as far as possible <strong>the</strong> efficiency <strong>of</strong> revenue collection and <strong>to</strong> uproot <strong>the</strong><br />
scourge <strong>of</strong> overvaluation.<br />
REFERENCES<br />
Acemoglu, D., and S. Johnson, 2005, “Unbundling Institutions,” Journal <strong>of</strong> Political Economy,<br />
Vol. 113, No. 5 (Oc<strong>to</strong>ber), pp. 949–95.<br />
Acemoglu, D., S. Johnson, and J.A. Robinson, 2003, “An African Success S<strong>to</strong>ry: Botswana,” in<br />
In Search <strong>of</strong> Prosperity: Analytical Narratives <strong>of</strong> Economic Growth, ed. by Dani Rodrik<br />
(Prince<strong>to</strong>n and Oxford: Prince<strong>to</strong>n University Press).<br />
Aghion, P., and A. Banerjee, 2005, Volatility and Growth (Oxford and New York: Oxford<br />
University Press).<br />
Auty, R.M., 2001, “The Political Economy <strong>of</strong> Resource-Driven Growth,” European Economic<br />
Review Vol. 45 (May), pp. 839–46.<br />
Boschini, A.D., J. Pettersson, and J. Roine, 2007, “Resource Curse or Not: A Question <strong>of</strong><br />
Appropriability,” Scandinavian Journal <strong>of</strong> Economics, Vol. 109, No. 3 (September), pp. 593–<br />
617.<br />
Campos, N.F., and F. Coricelli, 2002, “Growth in Transition: What We Know, What We Don’t,<br />
and What We Should,” Journal <strong>of</strong> Economic Literature, Vol. 40, No. 3 (September),<br />
pp. 793–836.<br />
Collier, P., and A. Hoeffler, 2009, “Testing <strong>the</strong> Neocon Agenda: Democracy in Resource-Rich<br />
Societies,” European Economic Review, Vol. 53, No. 3, pp. 293–308.<br />
Eichengreen, B., 2008, “The Real Exchange Rate and Economic Growth,” Commission on<br />
Growth and Development Working Paper No. 4 (Washing<strong>to</strong>n: World Bank).<br />
Fischer, S., and R. Sahay, 2000, “The Transition Economies after Ten Years,” International<br />
Monetary Fund Working Paper No. WP/00/30 (Washing<strong>to</strong>n: International Monetary Fund).<br />
Frankel, J., 2010, “Mauritius: African Success S<strong>to</strong>ry,” Harvard Kennedy School Working Paper<br />
No. RWP10-036, September.<br />
Gylfason, T., 2008, “Development and Growth in Mineral-Rich Countries,” paper prepared for<br />
a United Nations Research Institute for Social Development (NRISD) workshop, “Social<br />
Policy in Mineral-Rich Countries,” Palais des Nations, Geneva, April 24–25.<br />
Gylfason, T., and M. Weitzman, 2003, “Icelandic Fisheries Management: Fees vs. Quotas,”<br />
CEPR Discussion Paper No. 3849 (London: Centre for Economic Policy Research), March.<br />
Lederman, D., and W.F. Maloney, 2008, “In Search <strong>of</strong> <strong>the</strong> Missing Resource Curse,” Economía,<br />
Vol. 9, No. 1 (Fall), pp. 1–56.<br />
Lee Kuan Yew, 1998, The Singapore S<strong>to</strong>ry: Memoirs <strong>of</strong> Lee Kuan Yew (Singapore: Singapore Press<br />
Holdings).<br />
———, 1966, Speech by Prime Minister Lee Kuan Yew at <strong>the</strong> Delegates’ Conference <strong>of</strong> <strong>the</strong><br />
National Trade Union Congress, Trade Union House, Shen<strong>to</strong>n Way, Singapore, Oc<strong>to</strong>ber 2,<br />
1966 (Transcript). Available at http://stars.nhb.gov.sg/stars/tmp/lky19661002.pdf.<br />
Marshall, M.G., and K. Jaggers, 2001,“Polity IV Project: Political Regime Characteristics and<br />
Transitions, 1800-2000,” http://www.cidcm.umd.edu./inscr/polity/.<br />
Mehlum, H., K. Moene, and R. Torvik, 2006, “Cursed by <strong>Resources</strong> or Institutions?” World<br />
Economy, August, pp. 1117–31.<br />
Olsson, O., 2006, “Diamonds Are a Rebel’s Best Friend,” World Economy, Vol. 29, No. 8<br />
(August), pp. 1133–50.<br />
Prit chett, L., 2006, “Does Learning <strong>to</strong> Add Up Add Up? The Returns <strong>to</strong> Schooling in Aggregate<br />
Data,” in Handbook <strong>of</strong> <strong>the</strong> Economics <strong>of</strong> Education, ed. by E.A. Hanushek and F. Welch<br />
(London: North-Holland).<br />
©International Monetary Fund. Not for Redistribution
34 <strong>Natural</strong> Resource Endowment: A Mixed Blessing?<br />
Rodrik, D., 2004, “Industrial Policy for <strong>the</strong> Twenty-First Century,” CEPR Discussion Paper No.<br />
4767 (London: Centre for Economic Policy Research), November.<br />
Ross, M., 2001, “Does Oil Hinder Democracy?” World Politics, Vol. 53 (April), pp. 325–61.<br />
Sachs, J.D., and A.M. Warner, 1995 (revised 1997, 1999), “<strong>Natural</strong> Resource Abundance and<br />
Economic Growth,” NBER Working Paper No. 5398 (Cambridge, Mass.: National Bureau<br />
<strong>of</strong> Economic Research).<br />
Sala-i-Martin, X., and A. Subramanian, 2003, “Addressing <strong>the</strong> <strong>Natural</strong> Resource Curse: An<br />
Illustration from Nigeria,” International Monetary Fund Working Paper No. 03/139<br />
(Washing<strong>to</strong>n: International Monetary Fund), July.<br />
Wenar, L., 2008, “Property Rights and <strong>the</strong> Resource Curse,” Philosophy and Public Affairs,<br />
Vol. 36, No. 1 (Winter), pp. 1–32.<br />
World Bank, 2010a, The Wealth <strong>of</strong> Nations (Washing<strong>to</strong>n).<br />
———, 2010b, World Development Indica<strong>to</strong>rs (Washing<strong>to</strong>n).<br />
©International Monetary Fund. Not for Redistribution
Primary Commodities:<br />
His<strong>to</strong>rical Perspectives and<br />
Prospects<br />
MARIAN RADETZKI<br />
CHAPTER 3<br />
This chapter is intended <strong>to</strong> provide a his<strong>to</strong>rical framework for <strong>the</strong> analysis <strong>of</strong><br />
national commodity export dependence. It is organized in<strong>to</strong> four sections,<br />
each treating one <strong>of</strong> four <strong>the</strong>mes. The first section reviews <strong>the</strong> significance <strong>of</strong><br />
primary commodities in <strong>the</strong> overall economy at different stages <strong>of</strong> economic<br />
development. The second section tracks <strong>the</strong> long-run decline in bulk transport<br />
costs and explores <strong>the</strong> implications <strong>of</strong> this for <strong>the</strong> establishment <strong>of</strong> markets<br />
with a global reach. The third section considers <strong>the</strong> 50-year wave <strong>of</strong> deep<br />
public intervention and control, in both commodity production and trade, in<br />
<strong>the</strong> middle <strong>of</strong> <strong>the</strong> 20th century. The fourth section reviews commodity prices,<br />
both long-run trends and short-run instability. The final section <strong>of</strong> <strong>the</strong> chapter<br />
summarizes <strong>the</strong> his<strong>to</strong>rical findings and looks forward in an attempt <strong>to</strong><br />
provide some insights relevant <strong>to</strong> nations heavily dependent on commodity<br />
exports.<br />
PRIMARY COMMODITIES IN THE ECONOMIC<br />
DEVELOPMENT PROCESS<br />
The significance <strong>of</strong> <strong>the</strong> primary commodity sec<strong>to</strong>r in a national economy generally<br />
declines in <strong>the</strong> process <strong>of</strong> economic development. While long his<strong>to</strong>rical series<br />
<strong>to</strong> vindicate this statement are hard <strong>to</strong> come by, research by Simon Kuznets<br />
(1966) is illuminating. Kuznets presents <strong>the</strong> following assessments <strong>of</strong> <strong>the</strong> shares<br />
<strong>of</strong> agriculture and mining in GDP in selected countries over extended periods<br />
(<strong>the</strong> year dates are approximate). The contraction in <strong>the</strong> primary share emerges<br />
starkly from his figures:<br />
Marian Radetzki is pr<strong>of</strong>essor <strong>of</strong> economics at Luleå University <strong>of</strong> Technology, Luleå, Sweden. This<br />
chapter is based on <strong>the</strong> author’s presentation at “<strong>Natural</strong> <strong>Resources</strong>, Finance, and Development:<br />
Confronting Old and New Challenges,” a high-level seminar organized by <strong>the</strong> Central Bank <strong>of</strong> Algeria<br />
and <strong>the</strong> IMF Institute, which <strong>to</strong>ok place in Algiers, on November 4 and 5, 2010. The author can be<br />
contacted at marian@radetzki.biz.<br />
©International Monetary Fund. Not for Redistribution<br />
35
36 Primary Commodities: His<strong>to</strong>rical Perspectives and Prospects<br />
Australia 1860: 36% 1940: 26%<br />
Italy 1860: 55% 1950: 26%<br />
United Kingdom 1905: 41% 1950: 13%<br />
United States 1870: 22% 1960: 5%<br />
Data on a more systematic basis do not become available until <strong>the</strong> late 1930s,<br />
and Table 3.1 presents time series for selected countries where <strong>the</strong>se series are<br />
reasonably complete. Here <strong>to</strong>o, <strong>the</strong> primary share exhibits a dramatic decline as<br />
<strong>the</strong> economies develop over time. The table additionally demonstrates far lower<br />
primary shares at each point in time for <strong>the</strong> richer countries, compared with <strong>the</strong><br />
poorer ones. The latter cross-section observation is confirmed by a broader sample<br />
<strong>of</strong> nations shown in Figure 3.1. There is a strong reverse correlation between<br />
<strong>the</strong> level <strong>of</strong> economic development and <strong>the</strong> share <strong>of</strong> <strong>the</strong> primary sec<strong>to</strong>r in <strong>the</strong><br />
economy.<br />
A closer look reveals that at early development stages agriculture predominates<br />
in <strong>the</strong> primary sec<strong>to</strong>r. In Kuznets’ assessments, for instance, <strong>the</strong> agricultural<br />
sec<strong>to</strong>r exceeded four-fifths <strong>of</strong> <strong>the</strong> <strong>to</strong>tal for <strong>the</strong> initial year, except for<br />
Australia, where it was just above 60 percent. Because <strong>of</strong> its dominance, agriculture<br />
also accounts for most <strong>of</strong> <strong>the</strong> recorded contraction <strong>of</strong> <strong>the</strong> primary share<br />
over time. The decline in <strong>the</strong> much smaller initial share accounted for by mining<br />
is less accentuated. In some cases (e.g., Italy, United States), that share<br />
appears <strong>to</strong> have remained relatively stable through <strong>the</strong> economic development<br />
process (Kuznets, 1966).<br />
Exceptions <strong>to</strong> <strong>the</strong> observed regularity require mention. Norway is an outstanding<br />
example, a country whose primary share has shown no decline over<br />
time, as shown in Table 3.1 (where <strong>the</strong> elevated oil and gas prices in 2006<br />
undoubtedly contributed <strong>to</strong> <strong>the</strong> extreme value recorded in that year). Norway<br />
also represents an outlier position in Figure 3.1, combining a very high<br />
income level with an equally high primary-sec<strong>to</strong>r share. The traditional<br />
importance <strong>of</strong> fishing in Norway’s economy explains <strong>the</strong> heavy weight <strong>of</strong> <strong>the</strong><br />
TABLE 3.1<br />
Share <strong>of</strong> agriculture and mining in GDP (percent), time series, 1938–2006<br />
1938 1955 1975 1995 Latest<br />
Argentina 25 19 15 8 15 (2005)<br />
Canada 19 14 10 7 8 (2003)<br />
India – 45 40 31 21 (2005)<br />
Italy 28 25 9 3 3 (2006)<br />
Japan 23 24 7 2 2 (2005)<br />
Norway 15 16 12 16 30 (2006)<br />
South Korea – 46 27 7 4 (2006)<br />
Thailand 48 46 34 14 13 (2005)<br />
Turkey 48 43 29 17 11 (2006)<br />
United States<br />
Source: UN (annual).<br />
11 7 8 3 3 (2005)<br />
©International Monetary Fund. Not for Redistribution
Figure 3.1<br />
Share <strong>of</strong> primary sec<strong>to</strong>r in GDP, 2004<br />
70%<br />
60%<br />
50%<br />
40%<br />
30%<br />
20%<br />
10%<br />
0%<br />
0 10000 20000 30000 40000 50000<br />
GDP/capita, U.S. dollars at market rates<br />
60000<br />
Source: United Nations, Statistics Division, National Accounts Main Aggregates<br />
Database (updated), http://unstats.un.org/unsd/snaama/dnllist.asp.<br />
Note: The graph represents 38 countries selected <strong>to</strong> assure a wide spread in<br />
per capita GDP. Primary sec<strong>to</strong>r is defined as agriculture, hunting, forestry, fishing,<br />
mining, and utilities.<br />
Radetzki 37<br />
primary sec<strong>to</strong>r until <strong>the</strong> 1960s. The subsequent development <strong>of</strong> <strong>of</strong>fshore oil<br />
and gas has made Norway exceedingly rich, while expanding <strong>the</strong> primary<br />
share even more.<br />
Even after taking account <strong>of</strong> existing exceptions, <strong>the</strong> data show clearly that <strong>the</strong><br />
dominant pattern is a decline in <strong>the</strong> primary share <strong>of</strong> <strong>the</strong> economy as nations<br />
develop. In rich market economies, <strong>the</strong> primary sec<strong>to</strong>r seldom exceeds 5 percent<br />
<strong>of</strong> GDP. Even in sparsely populated Australia and Canada, with abundant expor<strong>to</strong>riented<br />
agriculture and a rich mineral endowment, <strong>the</strong> primary sec<strong>to</strong>r contributes<br />
less than 10 percent <strong>of</strong> overall national value added.<br />
The finding that <strong>the</strong> primary sec<strong>to</strong>r exhibits declining importance as economies<br />
develop is not particularly surprising. Simply expressed, and abstracting<br />
from <strong>the</strong> possibilities <strong>of</strong>fered by foreign trade, a key element in <strong>the</strong> economic<br />
development process is rising productivity that permits satisfying <strong>the</strong> need for<br />
raw materials with ever smaller fac<strong>to</strong>r inputs. Labor and capital can <strong>the</strong>n be<br />
switched <strong>to</strong> <strong>the</strong> secondary sec<strong>to</strong>r, that is, <strong>the</strong> production <strong>of</strong> manufactures whose<br />
sophistication typically increases over time. As <strong>the</strong> demand for manufactures<br />
<strong>to</strong>o is eventually saturated, <strong>the</strong> fac<strong>to</strong>rs <strong>of</strong> production can migrate again, this<br />
time <strong>to</strong> <strong>the</strong> service sec<strong>to</strong>r. The overall economy expands, but <strong>the</strong> secondary and<br />
tertiary sec<strong>to</strong>rs more than <strong>the</strong> primary one, leaving <strong>the</strong> latter with a declining<br />
share <strong>of</strong> <strong>the</strong> <strong>to</strong>tal. The income elasticity <strong>of</strong> primary commodities is clearly less<br />
than 1.<br />
With this perspective, <strong>the</strong> path <strong>of</strong> economic development can be seen as a<br />
process <strong>of</strong> dematerialization. Since all physical inputs originate in <strong>the</strong> primary<br />
sec<strong>to</strong>r, and since this sec<strong>to</strong>r accounts for a shrinking share <strong>of</strong> <strong>the</strong> <strong>to</strong>tal, it follows<br />
that each dollar’s addition <strong>to</strong> GDP will carry a material weight that declines<br />
over time. Table 3.2 illustrates what is involved. It presents <strong>the</strong> value in U.S.<br />
dollars (2000) per kilogram <strong>of</strong> a set <strong>of</strong> goods and services, listed in an ascending<br />
order. The higher <strong>the</strong> value, <strong>the</strong> less primary material inputs will be needed per<br />
dollar value represented by <strong>the</strong> items. The essence <strong>of</strong> economic development is<br />
©International Monetary Fund. Not for Redistribution
38 Primary Commodities: His<strong>to</strong>rical Perspectives and Prospects<br />
TABLE 3.2<br />
Value <strong>of</strong> selected goods, in U.S. dollars per kilogram, at 2000 prices<br />
Iron ore 0.02<br />
Steam coal 0.03<br />
Wheat 0.12<br />
Crude oil 0.21<br />
Standard steel 0.25<br />
Newsprint 0.40<br />
Super tanker 2<br />
Mo<strong>to</strong>r car 15<br />
Dish washer 25<br />
TV set 60<br />
Submarine 100<br />
Large passenger aircraft 600<br />
Lap<strong>to</strong>p computer 1,000<br />
Mobile telephone 2,000<br />
Jet fighter 6,000<br />
Windows 2000 S<strong>of</strong>tware, CD-Rom 20,000<br />
Telecom satellite 40,000<br />
Banking service<br />
Source: Radetzki, 2001.<br />
almost ∞<br />
<strong>to</strong> move <strong>the</strong> center <strong>of</strong> <strong>the</strong> economy’s gravity down <strong>the</strong> list, <strong>to</strong>ward goods with ever<br />
higher value per kilogram. In consequence, as countries grow richer, <strong>the</strong> need for<br />
raw-material inputs will grow more slowly than <strong>the</strong> overall economy. Materials<br />
savings will be fur<strong>the</strong>r boosted by technological progress which is typically weight<br />
reducing. The need for primary materials inputs tends <strong>to</strong> stagnate with economic<br />
development, and in some prosperous nations it has started <strong>to</strong> shrink in absolute<br />
terms as <strong>the</strong>ir economies have grown even richer. In any case, global economic<br />
growth has exceeded <strong>the</strong> demand growth for virtually all raw materials.<br />
Most <strong>of</strong> <strong>the</strong> global consumption growth in <strong>the</strong> present century has occurred<br />
in emerging economies, with an exceptional position taken by China, on account<br />
<strong>of</strong> that country’s size and <strong>the</strong> pace <strong>of</strong> its economic expansion. In 2009, China<br />
accounted for 12.5 percent <strong>of</strong> world GDP (measured in purchasing-power-parityadjusted<br />
terms; IMF, 2010), but its share <strong>of</strong> global oil consumption growth in this<br />
century was 50 percent (BP, annual). In <strong>the</strong> case <strong>of</strong> copper, <strong>the</strong> growth <strong>of</strong> China’s<br />
usage between 2000 and 2008 remarkably corresponded <strong>to</strong> 113 percent <strong>of</strong> global<br />
expansion (Cochilco, 2009), implying a 12 percent shrinkage in <strong>the</strong> rest <strong>of</strong> <strong>the</strong><br />
world. An even more spectacular case occurred in <strong>the</strong> iron ore trade, where China’s<br />
import growth between 2000 and 2009 (560 million metric <strong>to</strong>ns) corresponded <strong>to</strong><br />
125 percent <strong>of</strong> global import growth (450 million metric <strong>to</strong>ns; UNCTAD, 2010).<br />
Therefore, excluding China, world iron imports declined by 20 percent.<br />
It is easy <strong>to</strong> become complacent about <strong>the</strong> role and importance <strong>of</strong> <strong>the</strong> primary<br />
sec<strong>to</strong>r when its share <strong>of</strong> <strong>the</strong> economic activity settles at no more than a<br />
few percentage points, as is <strong>the</strong> case in many prosperous nations. Complacency<br />
may continue so long as commodity markets function smoothly and existing<br />
needs can be satisfied without serious hurdles. Complacency may also be<br />
©International Monetary Fund. Not for Redistribution
Radetzki 39<br />
encouraged by <strong>the</strong> fact that sophisticated modern economies have become masters<br />
<strong>of</strong> substitutability, permitting <strong>the</strong>m <strong>to</strong> do without a particular material. But<br />
<strong>the</strong> ability <strong>to</strong> substitute will be <strong>of</strong> no help against a general constraint on <strong>the</strong><br />
supply <strong>of</strong> raw materials in <strong>the</strong> aggregate, for it is overwhelmingly clear that not<br />
even <strong>the</strong> most modern economy can function without assured raw materials<br />
availability. The population will die if food supplies fail. The manufacturing<br />
sec<strong>to</strong>r is critically dependent on raw materials inputs, even if <strong>the</strong> volumes<br />
needed have shrunk impressively compared with <strong>the</strong> value <strong>of</strong> manufactured<br />
output. The service sec<strong>to</strong>r may require quite insignificant inputs <strong>of</strong> raw materials,<br />
but it clearly cannot function if <strong>the</strong>se supplies fail. The classic Paley Report<br />
puts it quite succinctly:<br />
The Materials Problem now demands that we give new and deep consideration<br />
<strong>to</strong> <strong>the</strong> fundamental upon which all employment, all daily activity, eventually<br />
rests: <strong>the</strong> contents <strong>of</strong> <strong>the</strong> earth and its physical environment. (Paley, 1952)<br />
Primary commodities are indispensable, just like an ordinarily inconspicuous<br />
glass <strong>of</strong> water that acquires an immense value in <strong>the</strong> desert. This is easily forgotten,<br />
given <strong>the</strong> economic insignificance <strong>of</strong> raw materials in “normal” times when<br />
<strong>the</strong>ir availability is taken for granted.<br />
FALLING TRANSPORT COSTS AND<br />
GLOBALIZING MARKETS<br />
Prior <strong>to</strong> <strong>the</strong> mid-19th century, freight rates on long hauls were prohibitively high,<br />
except for goods with very elevated unit prices. In consequence, global commodity<br />
trade at <strong>the</strong> time was small in volume and consisted mainly <strong>of</strong> highly valued<br />
luxuries like c<strong>of</strong>fee, cocoa, spices, and precious or semiprecious metals, imported<br />
predominantly <strong>to</strong> industrializing Europe (Landes, 1980). The main subsequent<br />
changes in transport technology and transport costs for bulk materials, it seems,<br />
occurred in two spurts. The first <strong>to</strong>ok place in <strong>the</strong> latter half <strong>of</strong> <strong>the</strong> 19th century;<br />
<strong>the</strong> second began in <strong>the</strong> 1950s and came <strong>to</strong> fruition in <strong>the</strong> 1970s. Each involved<br />
<strong>the</strong> globalization <strong>of</strong> numerous additional markets for commodities which until<br />
<strong>the</strong>n had a limited geographical reach. Globalization involves not only trade flows<br />
across oceans and between continents, but also, importantly, a convergence <strong>of</strong><br />
prices across regional markets.<br />
In <strong>the</strong> latter half <strong>of</strong> <strong>the</strong> 19th century, <strong>the</strong> application <strong>of</strong> steam power <strong>to</strong> transport<br />
revolutionized <strong>the</strong> economics <strong>of</strong> moving goods on land and across oceans.<br />
A large amount <strong>of</strong> raw materials produced at increasing distances from <strong>the</strong> coast<br />
in overseas terri<strong>to</strong>ries became economically accessible <strong>to</strong> <strong>the</strong> world’s industrial<br />
centers as overland transport by oxen, horses, and camels was switched <strong>to</strong> railways<br />
and as metal steamships replaced wooden sailing vessels. This becomes<br />
dramatically evident in Paul Bairoch’s (1965) numbers for <strong>the</strong> cost <strong>of</strong> shipping<br />
cot<strong>to</strong>n and wheat from New York <strong>to</strong> Liverpool in constant (1910–14) dollars<br />
per <strong>to</strong>n:<br />
©International Monetary Fund. Not for Redistribution
40 Primary Commodities: His<strong>to</strong>rical Perspectives and Prospects<br />
1825: 55.1 1857: 15.7 1880: 8.6 1910: 3.5<br />
Shipping costs are akin <strong>to</strong> tariff barriers. Little trade will typically take place<br />
when <strong>the</strong> transport charges account for a dominant share <strong>of</strong> delivered price. Trade<br />
will be encouraged as this share declines.<br />
The evolution <strong>of</strong> cereal imports in<strong>to</strong> Western Europe vividly illustrates <strong>the</strong><br />
impact that declining costs <strong>of</strong> transport had on <strong>the</strong> widening <strong>of</strong> production<br />
sources. Odessa’s short-run glory as a leading European port in <strong>the</strong> mid-1800s<br />
was based on a boom in <strong>the</strong> shipping <strong>of</strong> Russian and Ukrainian rye and wheat <strong>to</strong><br />
Western Europe. Much <strong>of</strong> this trade was lost in <strong>the</strong> 1870s, first because <strong>of</strong> a flood<br />
<strong>of</strong> steam-shipped American wheat after <strong>the</strong> end <strong>of</strong> <strong>the</strong> Civil War in <strong>the</strong> United<br />
States, and <strong>the</strong>n because <strong>of</strong> <strong>the</strong> extension <strong>of</strong> Russian railways, which <strong>to</strong>ok over <strong>the</strong><br />
transport <strong>of</strong> remaining Russian cereals exports. 1 At <strong>the</strong> same time, new rail connections<br />
from <strong>the</strong> prairies around Chicago <strong>to</strong> New York made <strong>the</strong> U.S. cereals<br />
even more competitive in Europe. The bulk transport revolution continued during<br />
<strong>the</strong> following decades. Between 1880 and 1910, <strong>the</strong> cost <strong>of</strong> transatlantic<br />
shipping declined from 18 percent <strong>to</strong> 8 percent <strong>of</strong> <strong>the</strong> price <strong>of</strong> wheat in <strong>the</strong><br />
United States (Bairoch, 1965).<br />
The 1880s also saw <strong>the</strong> introduction <strong>of</strong> refrigerated ships, permitting <strong>the</strong> longdistance<br />
transport <strong>of</strong> meat and fruit. The globalization <strong>of</strong> <strong>the</strong> markets for many<br />
food products speeded up European industrialization by assuring cheaper food<br />
supplies <strong>to</strong> <strong>the</strong> growing numbers <strong>of</strong> urban industrial workers. But it also involved<br />
painful adjustments for European farmers, who lost out <strong>to</strong> overseas supplies in<br />
many food products and agricultural raw materials like cot<strong>to</strong>n and wool. The<br />
impact was pr<strong>of</strong>ound: In <strong>the</strong> 1850s, two-thirds <strong>of</strong> British bread consumption was<br />
based on domestic cereals; by <strong>the</strong> 1880s that proportion had shrunk <strong>to</strong> 20 percent<br />
(Dillard, 1967).<br />
The second spurt in transport technology was far more specific, and significantly,<br />
it was triggered by <strong>the</strong> Suez crisis in <strong>the</strong> mid-1950s. The shipping industry’s<br />
response <strong>to</strong> <strong>the</strong> canal closure was <strong>to</strong> opt for huge specialized bulk carriers,<br />
along with <strong>the</strong>ir concomitant loading and unloading facilities in <strong>the</strong> harbors, <strong>to</strong><br />
permit economic transport <strong>of</strong> low-value products like iron ore, steam coal, bauxite<br />
and oil across vastly extended distances. The impact <strong>of</strong> <strong>the</strong> effort began <strong>to</strong> be<br />
felt only in <strong>the</strong> 1970s. The result was a fur<strong>the</strong>r dramatic decline in <strong>the</strong> cost <strong>of</strong><br />
shipping, particularly accentuated for <strong>the</strong> truly extended, transoceanic transport<br />
routes.<br />
Between 1960 and 1988, <strong>the</strong> average size <strong>of</strong> a bulk carrier fleet ship had more<br />
than doubled. In 1960, virtually all internationally traded iron ore and coal was<br />
shipped in vessels <strong>of</strong> less than 40,000 deadweight <strong>to</strong>ns, but this proportion had<br />
declined <strong>to</strong> 10 percent or less by 1988. Vessels in excess <strong>of</strong> 100,000 deadweight<br />
<strong>to</strong>ns did not exist in 1960, but by 1988 <strong>the</strong>y accounted for 70 percent <strong>of</strong> iron ore<br />
shipments and 40 percent <strong>of</strong> coal shipments (Lundgren, 1996). These tendencies<br />
1 The Economist, December 16, 2004.<br />
©International Monetary Fund. Not for Redistribution
Radetzki 41<br />
have been fur<strong>the</strong>r accentuated, and in <strong>the</strong> current century vessels in excess <strong>of</strong><br />
200,000 deadweight <strong>to</strong>ns completely dominate additions <strong>to</strong> <strong>the</strong> bulk carrier<br />
fleet. 2<br />
The economic impact <strong>of</strong> <strong>the</strong> new bulk transport technology was very substantial,<br />
and especially so for <strong>the</strong> mining industries. Many <strong>of</strong> Europe’s miners faced<br />
problems akin <strong>to</strong> those experienced by its farmers 120 years earlier. Freight rates<br />
for getting Brazilian iron ore <strong>to</strong> Europe declined from $24 per <strong>to</strong>n in 1960 <strong>to</strong> $7<br />
in <strong>the</strong> early 1990s. At <strong>the</strong> same time, <strong>the</strong> costs for much shorter shipping distances,<br />
such as iron ore from Narvik in Norway <strong>to</strong> Germany were reduced from<br />
$8 <strong>to</strong> $4 per <strong>to</strong>n. The shipping cost advantage <strong>of</strong> <strong>the</strong> geographic protection<br />
afforded <strong>to</strong> <strong>the</strong> Swedish supplies shipped through Narvik thus shrank from $16<br />
<strong>to</strong> only $3 (Lundgren, 1996). The shipping freight rate for coal, measured as a<br />
proportion <strong>of</strong> <strong>the</strong> <strong>to</strong>tal price for U.S. coal in Western Europe, fell from more than<br />
30 percent <strong>to</strong> less than 15 percent during this 30-year period. The consequence<br />
was a fast evolution <strong>of</strong> global markets for <strong>the</strong>se low-cost products. Long-distance<br />
maritime iron ore trade rose from 23 percent <strong>of</strong> world production in 1960 <strong>to</strong> 36<br />
percent in 1990 (Lundgren, 1996) and <strong>the</strong>n <strong>to</strong> 56 percent in 2009 (UNCTAD,<br />
2010). In 1960, transoceanic trade in coal accounted for 2 percent <strong>of</strong> global output<br />
(Lundgren, 1996) but by 2007 that share had risen <strong>to</strong> 14 percent (IEA,<br />
2009).<br />
The market for natural gas is <strong>the</strong> most recent <strong>to</strong> be subjected <strong>to</strong> <strong>the</strong> forces <strong>of</strong><br />
globalization. Gas is an extremely bulky product (prices in <strong>the</strong> range <strong>of</strong> $0.1–<br />
$0.2/m 3 ) with transport costs constituting a very high proportion <strong>of</strong> delivered<br />
price. Until at least <strong>the</strong> 1980s, transport by pipe was <strong>the</strong> dominant delivery mode.<br />
The lowest-cost gas sources had a limited geographical reach, because <strong>the</strong> transport<br />
cost was proportional <strong>to</strong> distance. Three regional markets developed around<br />
<strong>the</strong> main consumption centers, specifically (i) North America; (ii) Europe<br />
(including Russia), both predominantly supplied by pipe from internal sources;<br />
and (iii) Japan, Korea, and Taiwan, supplied exclusively by liquid natural gas<br />
(LNG) 3 from Australia, Indonesia, and Malaysia. Each <strong>of</strong> <strong>the</strong> three markets was,<br />
by and large, isolated from <strong>the</strong> o<strong>the</strong>rs, with prices evolving along separate levels<br />
and patterns. Until <strong>the</strong> mid-1990s, <strong>the</strong> East Asian market recorded prices that<br />
were twice <strong>the</strong> level in <strong>the</strong> United States and 50 percent higher than in Europe<br />
(BP, 2010) primarily because <strong>of</strong> <strong>the</strong> high cost <strong>of</strong> liquefaction and shipping. Since<br />
<strong>the</strong>n, however, prices have been equalized in <strong>the</strong> three markets due <strong>to</strong> a combination<br />
<strong>of</strong> rising prices <strong>of</strong> piped supply and substantial cost reductions in <strong>the</strong> LNG<br />
production and transport technology. Both developments have stimulated a very<br />
fast growth <strong>of</strong> additional LNG sources, providing an extended web <strong>of</strong> long distance<br />
supply routes, in effect establishing a truly global market for natural gas. In<br />
1989, 15 percent <strong>of</strong> global natural gas production was traded internationally, and<br />
2<br />
Private communication in 2010 with Lennart Nilsson, Institute <strong>of</strong> Shipping Analysis, Göteborg,<br />
Sweden.<br />
3 3 Approximately 1.4 m <strong>of</strong> natural gas equals 1 kg <strong>of</strong> LNG, with prices in <strong>the</strong> range <strong>of</strong> US$0.2-0.4/kg.<br />
The substantial compression makes LNG economically transportable by ship.<br />
©International Monetary Fund. Not for Redistribution
42 Primary Commodities: His<strong>to</strong>rical Perspectives and Prospects<br />
<strong>the</strong> LNG share accounted for 22 percent (65 billion cubic meters) <strong>of</strong> <strong>the</strong> traded<br />
<strong>to</strong>tal (BP, 1990). By 2009, <strong>the</strong> traded share had risen <strong>to</strong> 37 percent (243 billion<br />
cubic meters), with one fifth <strong>of</strong> <strong>to</strong>tal trade as LNG (BP, 2010).<br />
The successive technological revolutions gradually reduced <strong>the</strong> transport<br />
costs <strong>of</strong> bulk commodities by a <strong>to</strong>tal <strong>of</strong> almost 90 percent between <strong>the</strong> 1870s<br />
and 1990s (Lundgren, 1996). The more recent Internet revolution, by facilitating<br />
communications, has suppressed <strong>the</strong> cost <strong>of</strong> long-distance trade even more.<br />
This, in turn, has increased <strong>the</strong> number <strong>of</strong> globally traded primary commodities,<br />
from selected high-priced luxuries before 1850 <strong>to</strong> encompass virtually all<br />
products with perceptible values by 2005. Even waste—for example, metal<br />
scrap, rejects from forestry and agriculture, and packaging material after use—<br />
valued as sources <strong>of</strong> energy extraction or for recycling, is increasingly subject <strong>to</strong><br />
international trade. Chinese s<strong>to</strong>ne for garden decoration is being successfully<br />
marketed in Europe.<br />
An important repercussion <strong>of</strong> <strong>the</strong> globalization <strong>of</strong> primary commodity markets<br />
has been a growing dependence on imported supply <strong>of</strong> <strong>the</strong> world’s manufacturing<br />
centers, initially Europe, <strong>the</strong>n Japan and <strong>the</strong> United States, and most<br />
recently China.<br />
THE ENTRY AND EXIT OF THE STATE IN THE<br />
COMMODITY SECTOR IN THE 20TH CENTURY<br />
There was a 50-year wave <strong>of</strong> far-reaching public and political intervention in<br />
primary commodity markets, beginning in <strong>the</strong> early 1930s. Since <strong>the</strong> late 1970s,<br />
however, <strong>the</strong> governments have been abdicating wholesale from <strong>the</strong>ir commanding<br />
positions in <strong>the</strong> primary commodity world.<br />
I see four major and two subordinate fac<strong>to</strong>rs explaining <strong>the</strong> deep public interventionism<br />
in global commodity production and trade. (i) The Great Depression <strong>of</strong><br />
<strong>the</strong> 1930s led <strong>to</strong> a price collapse for many primary materials, so deep that it<br />
prompted public intervention <strong>to</strong> rescue farmers and miners. (ii) The Second World<br />
War created havoc in many supply lines, motivating government entry <strong>to</strong> res<strong>to</strong>re<br />
order. (iii) The breakup <strong>of</strong> colonial empires established many newly independent<br />
economies dominated by raw materials, whose governments thought it imperative<br />
<strong>to</strong> expand control, especially in minerals and energy where ownership had traditionally<br />
rested in foreign hands. (iv) The second and third quarters <strong>of</strong> <strong>the</strong> 20th century<br />
were ideologically flavored by strong beliefs in <strong>the</strong> need for collective action <strong>to</strong> come<br />
<strong>to</strong> grips with <strong>the</strong> serious fallacies <strong>of</strong> <strong>the</strong> market system (Skidelsky, 1996).<br />
The two subordinate fac<strong>to</strong>rs are (v) <strong>the</strong> economic ascendancy <strong>of</strong> <strong>the</strong> Soviet<br />
Union and its interventions in international commodity trade; and (vi) <strong>the</strong> concerns<br />
raised by <strong>the</strong> emergent import dependence <strong>of</strong> <strong>the</strong> United States for many strategic<br />
raw materials. Sometimes, one fac<strong>to</strong>r was enough <strong>to</strong> launch public action,<br />
but quite <strong>of</strong>ten, several <strong>of</strong> <strong>the</strong>se fac<strong>to</strong>rs reinforced one ano<strong>the</strong>r in triggering it.<br />
In <strong>the</strong> 1930s depression, falling prices prompted joint action by <strong>the</strong> governments<br />
<strong>of</strong> Canada and <strong>the</strong> United States in <strong>the</strong> wheat markets <strong>to</strong> cut export supply<br />
©International Monetary Fund. Not for Redistribution
Radetzki 43<br />
and save farmers from fur<strong>the</strong>r price falls. Similarly, Cuba collaborated with Java<br />
in launching export quotas in sugar. The colonial administrations <strong>of</strong> Malaya and<br />
Ceylon instituted export restrictions on rubber, but this scheme met resistance<br />
from consuming interests in <strong>the</strong> United States and was soon abandoned (Rowe,<br />
1965).<br />
In <strong>the</strong> 1945–65 period, with <strong>the</strong> scarcities and price spikes <strong>of</strong> <strong>the</strong> Second<br />
World War and <strong>the</strong> Korean conflict still fresh memories, commodity agreements<br />
were launched by governments, <strong>to</strong> keep prices within bands acceptable <strong>to</strong> both<br />
exporters and importers. Export controls and buffer s<strong>to</strong>cks were <strong>the</strong> instruments<br />
used. The markets for sugar, wheat, c<strong>of</strong>fee, tin, and many o<strong>the</strong>r commodities were<br />
subjected <strong>to</strong> such controls, but eventually <strong>the</strong>y all disintegrated, primarily because<br />
<strong>the</strong>y did not live up <strong>to</strong> <strong>the</strong> anticipated expectations (Radetzki, 1970).<br />
The decade after <strong>the</strong> Second World War involved a painful experience for <strong>the</strong><br />
United States, as <strong>the</strong> country became dependent on imports <strong>of</strong> a widening group<br />
<strong>of</strong> commodities <strong>of</strong> critical importance in both war and peace (Paley, 1952). This<br />
prompted <strong>the</strong> government <strong>to</strong> build strategic inven<strong>to</strong>ries, sometimes <strong>of</strong> very significant<br />
size. The extent <strong>to</strong> which <strong>the</strong>se inven<strong>to</strong>ries assured stable supplies <strong>to</strong> <strong>the</strong><br />
United States is unclear, but <strong>the</strong>ir acquisition and subsequent disposal created<br />
serious instability in <strong>the</strong> commodity markets (Cooper and Lawrence, 1975;<br />
International Tin Council, annual and monthly).<br />
The early 1970s also witnessed commodity price and export controls in several<br />
countries, designed <strong>to</strong> assure supplies at low prices <strong>to</strong> domestic users. In <strong>the</strong><br />
United States, price ceilings combined with export restrictions on many commodities<br />
were instituted for that purpose (Cooper and Lawrence, 1975). The<br />
gasoline queues in <strong>the</strong> United States in 1974 were a direct consequence <strong>of</strong> <strong>the</strong><br />
gasoline price caps. The Canadian government implemented severe constraints<br />
on uranium exports in <strong>the</strong> mid-1970s, purportedly <strong>to</strong> ensure that national needs<br />
were met (Radetzki, 1981).<br />
Foreign aid became common after numerous nations in Africa and Asia gained<br />
independence in <strong>the</strong> 1950s and 1960s, and several commodity agreements were<br />
extended by adding elements <strong>of</strong> foreign assistance. One such extension involved<br />
guarantees by <strong>the</strong> importing member countries <strong>to</strong> buy predetermined quantities<br />
at above-market prices. Ano<strong>the</strong>r was “food aid,” which might have improved<br />
nutritional standards but at <strong>the</strong> same time made life harder for third world farmers<br />
(Radetzki, 1970). Sometimes, self-interest ra<strong>the</strong>r than altruism motivated <strong>the</strong><br />
assistance measures, as in <strong>the</strong> c<strong>of</strong>fee agreement which guaranteed Latin American<br />
producers more than <strong>the</strong> market price with <strong>the</strong> virtually explicit motive <strong>of</strong> preventing<br />
<strong>the</strong> spread <strong>of</strong> non-capitalist political systems (Commodity Research<br />
Bureau, 1964; Rowe, 1965).<br />
The Soviet Union was similarly active. It signed a number <strong>of</strong> bilateral agreements,<br />
in a few cases involving <strong>the</strong> entire commodity export <strong>of</strong> individual<br />
developing countries for many years, in exchange for its manufactures. These<br />
agreements were regularly biased in favor <strong>of</strong> <strong>the</strong> exporting nation, with an<br />
implicit aim <strong>to</strong> gain political influence. Sometimes it did not work so well for <strong>the</strong><br />
“beneficiaries,” as when <strong>the</strong> Soviet Union resold large quantities <strong>of</strong> Cuban sugar<br />
©International Monetary Fund. Not for Redistribution
44 Primary Commodities: His<strong>to</strong>rical Perspectives and Prospects<br />
and Indian cloth in Western Europe, suppressing prices for <strong>the</strong> exporters’ sales<br />
outside <strong>the</strong> “agreement” (Radetzki, 1970).<br />
Despite <strong>the</strong> courtship <strong>of</strong> developing countries by commodity importers, in <strong>the</strong><br />
1960s and 1970s <strong>the</strong>re was a massive wave <strong>of</strong> nationalizations <strong>of</strong> foreign-owned<br />
positions, primarily in <strong>the</strong> minerals and energy fields. Compensation was meager<br />
in <strong>the</strong>se takeovers. The United States and <strong>the</strong> United Kingdom lost <strong>the</strong> most in<br />
<strong>the</strong> process, being <strong>the</strong> largest foreign direct inves<strong>to</strong>rs in <strong>the</strong>se sec<strong>to</strong>rs. The Soviet<br />
Union and Japan did not suffer much, since <strong>the</strong>ir ownership holdings were insignificant.<br />
The resultant state enterprises in minerals and energy brought in yet<br />
ano<strong>the</strong>r <strong>to</strong>ol for public intervention in primary commodities.<br />
Governments started <strong>to</strong> retreat from commodities control in <strong>the</strong> 1980s.<br />
Disappointment about <strong>the</strong> results <strong>of</strong> public interference became common. State<br />
entrepreneurship had not delivered as anticipated. A shift in beliefs also played a<br />
crucial role. Confidence in market solutions was boosted by <strong>the</strong> ideological revolution<br />
launched by Margaret Thatcher and Ronald Reagan. “Political failure”<br />
replaced “market failure” as <strong>the</strong> main problem <strong>to</strong> handle.<br />
Far-reaching consequences have since followed from <strong>the</strong> public retreat.<br />
International commodity agreements in which governments meddle for whatever<br />
objective have completely lost <strong>the</strong>ir appeal. Instead, hedging on widely<br />
extended futures markets is used for <strong>the</strong> purpose <strong>of</strong> price stabilization. Publicly<br />
controlled strategic s<strong>to</strong>cks in <strong>the</strong> present century are limited <strong>to</strong> petroleum, and<br />
at less than 5 percent <strong>of</strong> global annual consumption (IEA, Oil Market Report),<br />
<strong>the</strong>y represent a trifle compared with <strong>the</strong> ambitious schemes <strong>of</strong> earlier decades.<br />
Government price controls have not been considered ei<strong>the</strong>r, despite threefold<br />
price increases for materials like copper, iron ore, and oil between 2002 and<br />
2008. The market is seen as an adequate instrument for establishing <strong>the</strong> value<br />
<strong>of</strong> transactions between exporters and importers. No queues have been seen at<br />
<strong>the</strong> petrol stations or at <strong>the</strong> strategic metal warehouses in <strong>the</strong> rich world <strong>of</strong> late.<br />
Attempts in China, India, Indonesia, and o<strong>the</strong>r emerging countries <strong>to</strong> shield<br />
<strong>the</strong>ir consumers from <strong>the</strong> oil price rises in 2004–08 did result in queues in some<br />
cases, but <strong>the</strong>se attempts have proved unbearably costly <strong>to</strong> public budgets and<br />
are being dismantled (IEA, Oil Market Report). A wholesale privatization<br />
occurred in <strong>the</strong> non-fuel mineral sec<strong>to</strong>r, but in contrast, state ownership continues<br />
unabated in <strong>the</strong> oil industries <strong>of</strong> <strong>the</strong> developing countries, perhaps<br />
because <strong>of</strong> laxer performance requirements stemming from <strong>the</strong> OPEC cartel’s<br />
continuing maintenance <strong>of</strong> monopolistic prices.<br />
Governments’ abdication from involvement in primary commodity markets<br />
has been quite impressive, though it is far from complete. The most important<br />
exception relates <strong>to</strong> <strong>the</strong> rich world’s agricultural policies which continue <strong>to</strong> seriously<br />
dis<strong>to</strong>rt <strong>the</strong> markets for a number <strong>of</strong> food products. In <strong>the</strong> middle <strong>of</strong> <strong>the</strong> past<br />
decade, farm subsidies represented 34 percent <strong>of</strong> <strong>the</strong> value <strong>of</strong> overall farm receipts<br />
in <strong>the</strong> European Union and 58 percent in Japan. 4 For some products, subsidies<br />
4 The Economist, July 1, 2006.<br />
©International Monetary Fund. Not for Redistribution
Radetzki 45<br />
exceeded 100 percent. OPEC represents <strong>the</strong> o<strong>the</strong>r important remnant <strong>of</strong> public<br />
involvement in international commodity markets. The cartel’s member governments<br />
have remained <strong>the</strong> dominant owners <strong>of</strong> <strong>the</strong> oil industry, and <strong>the</strong> stateowned<br />
oil enterprises worldwide control close <strong>to</strong> 90 percent <strong>of</strong> <strong>the</strong> world’s<br />
conventional oil resources. 5 The same governments keep a tight rein on policy, in<br />
terms <strong>of</strong> output and prices, as well as on <strong>the</strong> volume and direction <strong>of</strong> oil investments.<br />
They appoint <strong>the</strong> corporate managements, <strong>of</strong>ten on political merit, and<br />
<strong>the</strong>y also control <strong>the</strong> financial resources available <strong>to</strong> <strong>the</strong>ir oil industries.<br />
Despite <strong>the</strong>se exceptions <strong>to</strong> public abdication in <strong>the</strong> primary commodity sec<strong>to</strong>rs,<br />
it is clear that <strong>the</strong> era <strong>of</strong> state interventionism is far past its peak, and that<br />
market forces concurrently play a greatly expanded role in international commodity<br />
markets.<br />
Never<strong>the</strong>less, events in Bolivia, Russia, and Venezuela since <strong>the</strong> middle <strong>of</strong> <strong>the</strong><br />
last decade suggest that <strong>the</strong> temptation <strong>to</strong> maintain state control and <strong>to</strong> undertake<br />
fur<strong>the</strong>r nationalizations in oil and gas remains strong, especially when prices and<br />
pr<strong>of</strong>its are high. Fears have been voiced that <strong>the</strong> recently ascending popularity <strong>of</strong><br />
state control in some places may be a harbinger <strong>of</strong> a new wave <strong>of</strong> public intervention<br />
in <strong>the</strong> resource industries, coming after a 30-year withdrawal.<br />
REAL PRICES: FALLING LONG-RUN TRENDS AND<br />
SHORT-RUN INSTABILITY<br />
Long-Run Price Trends<br />
There are two well-argued and opposed lines <strong>of</strong> thought about <strong>the</strong> future direction<br />
<strong>of</strong> <strong>the</strong> trend in long-run real commodity prices. The first, mainly <strong>the</strong>oretical tradition,<br />
asserts that commodity prices will be rising. It derives its roots from classical<br />
economists Adam Smith and David Ricardo and is elegantly syn<strong>the</strong>sized in this<br />
passage from John Stuart Mill:<br />
The tendency, <strong>the</strong>n, being <strong>to</strong> a perpetual increase <strong>of</strong> <strong>the</strong> productive power <strong>of</strong><br />
labour in manufactures. while in agriculture and mining <strong>the</strong>re is a conflict<br />
between two tendencies, <strong>the</strong> one <strong>to</strong>wards an increase <strong>of</strong> productive power, <strong>the</strong><br />
o<strong>the</strong>r <strong>to</strong>wards a diminution <strong>of</strong> it, <strong>the</strong> cost <strong>of</strong> production being lessened by every<br />
improvement in <strong>the</strong> process, and augmented by every addition <strong>to</strong> population:<br />
it follows that <strong>the</strong> exchange value <strong>of</strong> manufactured articles, compared with <strong>the</strong><br />
products <strong>of</strong> agriculture and <strong>of</strong> mines, have, as population and industry advance,<br />
a certain and decided tendency <strong>to</strong> fall. (Mill, 1848, Book IV, Chapter 2)<br />
The notion <strong>of</strong> raw materials prices rising due <strong>to</strong> increasing pressures caused by<br />
land and mineral scarcities remained out <strong>of</strong> vogue for a long period during <strong>the</strong><br />
20th century because it was contradicted by many empirical observations. Since<br />
<strong>the</strong> early 1970s, however, it has attracted a temporary but intensive concern following<br />
<strong>the</strong> publication <strong>of</strong> Club <strong>of</strong> Rome reports about an impending general<br />
5 The Economist, July 1, 2010.<br />
©International Monetary Fund. Not for Redistribution
46 Primary Commodities: His<strong>to</strong>rical Perspectives and Prospects<br />
depletion <strong>of</strong> resources, and <strong>the</strong>n again during <strong>the</strong> commodity boom early in <strong>the</strong><br />
present century, when fears <strong>of</strong> rising scarcity resurfaced in <strong>the</strong> proclamations <strong>of</strong><br />
impending “peak oil” and similar production peaks for many o<strong>the</strong>r natural<br />
resources (Radetzki, forthcoming).<br />
The second tradition is founded on empirical observations, and asserts a falling<br />
trend in real commodity prices. It was originally developed by Hans Singer<br />
(1950) and Raul Prebisch (1962) who argued that <strong>the</strong>re is an asymmetry in<br />
<strong>the</strong> response <strong>of</strong> prices <strong>to</strong> productivity gains between commodities and manufactures.<br />
The markets for <strong>the</strong> former are highly competitive, so any productivity<br />
improvement leads <strong>to</strong> a price decline. The monopolistic organization <strong>of</strong><br />
<strong>the</strong> labor and capital employed in manufactures production, in contrast,<br />
enables <strong>the</strong> fac<strong>to</strong>rs <strong>of</strong> production <strong>to</strong> reap <strong>the</strong> benefit <strong>of</strong> productivity gains in<br />
<strong>the</strong> form <strong>of</strong> higher income. The Prebisch–Singer explanation <strong>of</strong> falling commodity<br />
price trends aroused an extended debate. Its critics have remained<br />
unconvinced, even though <strong>the</strong> performance <strong>of</strong> OPEC appears <strong>to</strong> support <strong>the</strong><br />
Prebisch–Singer view.<br />
There are several o<strong>the</strong>r, less controversial reasons that could explain a long-run<br />
decline in real commodity prices. First, as noted, <strong>the</strong> income elasticity <strong>of</strong> demand<br />
for most commodities is low, so <strong>the</strong> slower growth <strong>of</strong> commodity demand as<br />
income expands would tend <strong>to</strong> result in a weaker commodity price development.<br />
In fact, Singer himself used this argument in support <strong>of</strong> his <strong>the</strong>ory. The second<br />
reason is that transport costs ordinarily constitute a higher proportion <strong>of</strong> <strong>the</strong><br />
delivered price <strong>of</strong> commodities than <strong>of</strong> manufactures. The secular fall in transport<br />
costs should <strong>the</strong>refore have resulted in a stronger decline in CIF commodity price<br />
quotations. Third, and probably most important, <strong>the</strong> manufactures price index in<br />
real terms is tricky <strong>to</strong> construct and interpret because <strong>of</strong> <strong>the</strong> continuous shifts in<br />
its product composition and in <strong>the</strong> quality improvements over time <strong>of</strong> individual<br />
manufactures (Svedberg and Til<strong>to</strong>n, 2006).<br />
Many empirical attempts at establishing <strong>the</strong> long-run commodity price trends<br />
in constant money have been undertaken. Among <strong>the</strong> more recent attempts are<br />
those by Cashin and McDermott (2002), Cudding<strong>to</strong>n, Ludema, and Jayasuriya<br />
(2007), Grilli and Yang (1988), Hadass and Williamson (2003) and Harvey and<br />
o<strong>the</strong>rs (2010), and <strong>the</strong>y have yielded very varied results. Depending on <strong>the</strong> end<br />
points <strong>of</strong> <strong>the</strong> series, <strong>the</strong> countries whose trade is covered, <strong>the</strong> defla<strong>to</strong>r used, and<br />
<strong>the</strong> commodities included, <strong>the</strong> outcomes <strong>of</strong> <strong>the</strong>se investigations have typically<br />
ranged between stagnant and substantially declining developments, apparently<br />
adding more support <strong>to</strong> <strong>the</strong> Prebisch–Singer <strong>the</strong>sis than <strong>to</strong> <strong>the</strong> one formulated by<br />
<strong>the</strong> classical economists. There seems <strong>to</strong> be some tendency for real raw material<br />
prices <strong>to</strong> fall in <strong>the</strong> long run.<br />
Short-Run Instability and Commodity Booms<br />
An important feature <strong>of</strong> commodity prices is <strong>the</strong>ir rapid, unexpected, and <strong>of</strong>ten<br />
large movements (Cashin and McDermott, 2002). This is a well known and <strong>of</strong>t<br />
repeated statement, as is <strong>the</strong> observation that <strong>the</strong> prices <strong>of</strong> manufactures tend <strong>to</strong> be<br />
©International Monetary Fund. Not for Redistribution
Radetzki 47<br />
more stable. Illustrations <strong>of</strong> violent commodity price gyrations, up as well as down,<br />
over relatively short time spans are easy <strong>to</strong> produce, even when <strong>the</strong> major commodity<br />
boom periods are excluded.<br />
It is equally easy <strong>to</strong> point <strong>to</strong> <strong>the</strong> main reasons for <strong>the</strong> sharp commodity price<br />
instability. The price elasticity <strong>of</strong> demand for raw materials is usually quite low,<br />
given that <strong>the</strong> cost <strong>of</strong> such materials typically constitutes a small proportion <strong>of</strong> <strong>the</strong><br />
finished product price. Fur<strong>the</strong>rmore, a given increase in demand for finished<br />
products will regularly result in a more accentuated increase in <strong>the</strong> demand for<br />
<strong>the</strong> raw materials employed, as <strong>the</strong> desired inven<strong>to</strong>ries are augmented from <strong>the</strong><br />
finished product marketing stage back through <strong>the</strong> entire production chain.<br />
Fluctuations in supply also contributed <strong>to</strong> price instability. Wea<strong>the</strong>r is an<br />
important cause <strong>of</strong> supply variations in agricultural crops, even though geographical<br />
diversification <strong>of</strong> production in recent decades has reduced <strong>the</strong> importance<br />
<strong>of</strong> this fac<strong>to</strong>r (IMF, 2006). Mineral supply can be caused <strong>to</strong> shrink due <strong>to</strong><br />
strikes or technical accidents, though such failures would have <strong>to</strong> be widespread<br />
<strong>to</strong> significantly dent <strong>the</strong> global <strong>to</strong>tal. The price elasticity <strong>of</strong> supply would also be<br />
quite low, at least when capacity is fully utilized, which is normally <strong>the</strong> case in<br />
competitive markets. Therefore, with <strong>the</strong> exception <strong>of</strong> annual crops, it takes an<br />
extended period <strong>of</strong> time <strong>to</strong> add <strong>to</strong> supply capacity, and in <strong>the</strong> meantime even<br />
small variations in demand will result in sharp changes in price.<br />
The above, <strong>the</strong>n, are <strong>the</strong> main explanations for <strong>the</strong> short-run price instability<br />
observed in most primary commodity markets. Such instability is believed <strong>to</strong><br />
cause serious macroeconomic problems <strong>to</strong> countries that are heavily dependent<br />
on <strong>the</strong> exports <strong>of</strong> one or a few commodities.<br />
Commodity booms are characterized for <strong>the</strong> purpose <strong>of</strong> <strong>the</strong> present analysis<br />
as sharp simultaneous increases in <strong>the</strong> real price <strong>of</strong> a broad group <strong>of</strong> commodities.<br />
Using this definition, it is possible <strong>to</strong> detect three such booms in <strong>the</strong> period<br />
since <strong>the</strong> Second World War, beginning in 1950, 1973, and 2003, respectively<br />
(Radetzki, 2006). They were all triggered by demand shocks caused by unusually<br />
fast macroeconomic expansion. In all three cases, commodity producers<br />
were unable <strong>to</strong> satisfy <strong>the</strong> speedy demand growth, and prices exploded <strong>to</strong> a level<br />
far above <strong>the</strong> long-run equilibrium, defined as <strong>the</strong> <strong>to</strong>tal cost <strong>of</strong> new marginal<br />
supply.<br />
The first two commodity booms collapsed in 1952 and 1974, less than two<br />
years after <strong>the</strong>y emerged, in response <strong>to</strong> pr<strong>of</strong>ound global recessions and an ensuing<br />
shrinkage in commodity demand. The progress <strong>of</strong> <strong>the</strong> third boom, which<br />
began in 2003, has had a much more complex character (Radetzki, 2006). First,<br />
<strong>the</strong> price increases from <strong>the</strong> beginning <strong>of</strong> <strong>the</strong> boom period until <strong>the</strong> peak was<br />
reached were stronger than during <strong>the</strong> two predecessors. Second, <strong>the</strong> durability <strong>of</strong><br />
this boom was far more extended. In 2007, four years after prices had started <strong>to</strong><br />
rise, <strong>the</strong> high price levels persevered, with no recession in sight. When <strong>the</strong> most<br />
pr<strong>of</strong>ound global economic contraction since <strong>the</strong> 1930s depression eventually<br />
arrived in <strong>the</strong> second half <strong>of</strong> 2008, a sharp commodity price correction did indeed<br />
occur, but it was <strong>of</strong> a surprisingly short duration. By <strong>the</strong> end <strong>of</strong> 2009, commodity<br />
prices were very high again, having recovered a major share <strong>of</strong> <strong>the</strong> preceding year’s<br />
©International Monetary Fund. Not for Redistribution
48 Primary Commodities: His<strong>to</strong>rical Perspectives and Prospects<br />
decline. 6 The explanation <strong>to</strong> <strong>the</strong> surprising commodity price recovery in <strong>the</strong><br />
midst <strong>of</strong> continuing economic gloom is that <strong>the</strong> major emerging economies<br />
which have accounted for virtually all commodity demand growth in <strong>the</strong> most<br />
recent decade, were little affected by <strong>the</strong> global recession. By 2009 <strong>the</strong>se nations<br />
had already resumed <strong>the</strong>ir very fast economic expansion and <strong>the</strong>ir commodity<br />
demand growth accelerated again.<br />
Claims have been made that <strong>the</strong> slack monetary policy and inflows <strong>of</strong> speculative<br />
capital in<strong>to</strong> commodity markets in recent years have fur<strong>the</strong>r boosted commodity<br />
prices during <strong>the</strong> third boom (e.g., Caballero and o<strong>the</strong>rs, 2008), but in<br />
my view <strong>the</strong>se claims are not credible. A financial impact on spot commodity<br />
prices requires that commodity inven<strong>to</strong>ries expand, and <strong>the</strong>re is no convincing<br />
evidence <strong>of</strong> such expansion in <strong>the</strong> course <strong>of</strong> <strong>the</strong> current boom. On <strong>the</strong> contrary,<br />
in a recent study Irwin and Sanders (2010) assert that s<strong>to</strong>cks were declining, not<br />
rising, in most commodity markets between 2006 and 2008, <strong>the</strong> period comprising<br />
<strong>the</strong> sharpest commodity price increases.<br />
Commodity price levels in <strong>the</strong> second half <strong>of</strong> 2010 continue far above <strong>the</strong>ir<br />
long run equilibrium (Citigroup Global Markets, 2010; UBS Investment<br />
Research, 2010), as demonstrated by <strong>the</strong> very high pr<strong>of</strong>its generated by producers.<br />
A substantial decline can be anticipated if global demand were <strong>to</strong> shrink, for<br />
whatever reason. Price declines will occur even in <strong>the</strong> absence <strong>of</strong> demand contraction,<br />
once investments in expanded commodity production capacity become<br />
productive. Capacity expansion, however, is proving <strong>to</strong> be surprisingly time consuming<br />
(Radetzki and o<strong>the</strong>rs, 2008).<br />
POLICY IMPLICATIONS FOR COMMODITY-EXPORTING<br />
NATIONS<br />
Several policy implications for nations heavily dependent on commodity exports<br />
follow from <strong>the</strong> above his<strong>to</strong>rical overviews. As is revealed by o<strong>the</strong>r chapters in <strong>the</strong><br />
present volume, many o<strong>the</strong>r policy recommendations can be formulated for <strong>the</strong><br />
commodity-exporting nations. What follows here is a partial set based exclusively<br />
on <strong>the</strong> deliberations in <strong>the</strong> present chapter.<br />
All else being equal, <strong>the</strong> declining global significance <strong>of</strong> commodities in<br />
terms <strong>of</strong> <strong>the</strong>ir volume in <strong>the</strong> world economy implies that demand will expand<br />
at slower rates than economic growth. This could be seen as a disadvantage for<br />
commodity exporters in <strong>the</strong> aggregate, but not necessarily for individual<br />
suitably positioned exporting nations, whose foreign sales could grow by additional<br />
market shares.<br />
Most <strong>of</strong> <strong>the</strong> future demand growth is likely <strong>to</strong> occur in emerging economies,<br />
with China fur<strong>the</strong>r enhancing its already important position as a commodity<br />
consumer. This suggests a redirection <strong>of</strong> any marketing efforts aimed at<br />
6<br />
See IMF’s Commodity Price Statistics on <strong>the</strong> Web at http://www.imf.org/external/np/res/commod/<br />
index.asp.<br />
©International Monetary Fund. Not for Redistribution
Radetzki 49<br />
enhancing export sales from <strong>the</strong> rich, mature countries, where demand stagnates<br />
or declines, <strong>to</strong>ward <strong>the</strong> emerging nations group.<br />
A careful watch is warranted <strong>to</strong> detect any tendencies <strong>to</strong>ward a macroeconomic<br />
slowdown in China, <strong>to</strong> permit early adjustments <strong>to</strong> <strong>the</strong> dire consequences <strong>of</strong><br />
deteriorating Chinese economic performance for <strong>the</strong> evolution <strong>of</strong> commodity<br />
demand and commodity prices.<br />
The revolutions in transport costs make it increasingly futile <strong>to</strong> rely on any<br />
advantage based on geography. Suppliers are increasingly facing a truly global<br />
market in which <strong>the</strong>y have <strong>to</strong> compete with output from virtually any corner <strong>of</strong><br />
<strong>the</strong> world. This is a challenge but also an opportunity: Importing nations will<br />
take less account <strong>of</strong> <strong>the</strong> geography <strong>of</strong> <strong>the</strong>ir supply sources and more account <strong>of</strong><br />
<strong>the</strong>ir reliability. Suppliers could gain entry <strong>to</strong> new markets, with distance constituting<br />
ever less deterrence, if <strong>the</strong>y could assure <strong>the</strong> conditions sought by <strong>the</strong><br />
importers.<br />
There are valuable insights <strong>to</strong> be gained from <strong>the</strong> 50-year experience <strong>of</strong> public<br />
interference in <strong>the</strong> primary commodity sec<strong>to</strong>r. The fact that governments abdicated<br />
in disappointment from most <strong>of</strong> <strong>the</strong>ir involvements is a consideration <strong>to</strong><br />
keep in mind when future policies are formulated. Price stabilization is clearly<br />
better handled through <strong>the</strong> futures markets than with <strong>the</strong> help <strong>of</strong> government<br />
interference. Maintenance <strong>of</strong> prices above long-run equilibrium with <strong>the</strong> help <strong>of</strong><br />
public regulation commonly ends in a loss <strong>of</strong> demand with painful consequences<br />
<strong>to</strong> <strong>the</strong> suppliers. Producer market control <strong>to</strong> extract monopolistic prices is usually<br />
unstable, and <strong>the</strong> perseverance <strong>of</strong> <strong>the</strong> OPEC cartel is an exception <strong>to</strong> <strong>the</strong> rule, one<br />
made possible by <strong>the</strong> extremely uneven distribution <strong>of</strong> oil resources in <strong>the</strong><br />
ground. Resource rents are regularly extracted better through a coherent fiscal<br />
system than through public ownership, given that <strong>the</strong> inefficiencies <strong>of</strong> state enterprise<br />
result in serious rent dissipation.<br />
Dependence on exports with falling long-run price trends is obviously inferior<br />
<strong>to</strong> reliance on a bundle <strong>of</strong> export goods with more encouraging price prospects,<br />
but pr<strong>of</strong>itability and social benefit <strong>to</strong> <strong>the</strong> exporting country can never<strong>the</strong>less<br />
prevail if progress in technology assures a decline in costs parallel <strong>to</strong> <strong>the</strong> price<br />
developments.<br />
Projections are usually formulated by assigning an excessive weight <strong>to</strong> current<br />
conditions, and here a warning is in order. When considering future prospects for<br />
<strong>the</strong>ir economies, commodity exporters are well advised <strong>to</strong> be conscious that prices<br />
in <strong>the</strong> second half <strong>of</strong> 2010 were still under <strong>the</strong> influence <strong>of</strong> <strong>the</strong> most powerful<br />
commodity boom since <strong>the</strong> Second World War, and <strong>the</strong>y have far <strong>to</strong> fall if <strong>the</strong>y<br />
are <strong>to</strong> attain <strong>the</strong>ir long run equilibrium levels.<br />
The discussions in this chapter have revealed that <strong>the</strong> one-sidedness <strong>of</strong> <strong>the</strong> commodity-dependent<br />
economies involves numerous problems and risks, including slow<br />
growth in demand, falling long-run price trends, and short-run instability. But <strong>the</strong><br />
analyses clearly have not established a general and unambiguous case for diversification.<br />
After all, commodity dependence is normally <strong>the</strong> result <strong>of</strong> a competitive advantage<br />
that yields above-normal returns <strong>to</strong> <strong>the</strong> commodity sec<strong>to</strong>r. These yields may well<br />
be more than adequate <strong>to</strong> compensate for <strong>the</strong> disadvantages. On <strong>the</strong> o<strong>the</strong>r hand,<br />
©International Monetary Fund. Not for Redistribution
50 Primary Commodities: His<strong>to</strong>rical Perspectives and Prospects<br />
part <strong>of</strong> <strong>the</strong> resource rents contained in <strong>the</strong> above-normal returns will be forgone<br />
if forceful measures <strong>to</strong> diversify are undertaken.<br />
Commodity dependence does not constitute a general trap in<strong>to</strong> technical or<br />
o<strong>the</strong>r backwardness. Contrary <strong>to</strong> frequent perceptions, commodity production<br />
<strong>of</strong>ten requires as much advanced technology and human skill as manufacturing.<br />
Modern agriculture and mining make heavy use <strong>of</strong> microbiology, electronics, and<br />
<strong>the</strong> highly qualified labor that goes with <strong>the</strong>se techniques.<br />
Large and pr<strong>of</strong>itable primary commodity production, both agricultural and<br />
mineral, holds a prominent place in <strong>the</strong> economies <strong>of</strong> prosperous nations like<br />
Australia, Canada, Norway, Sweden, and <strong>the</strong> United States, with long periods <strong>of</strong><br />
fast growth behind <strong>the</strong>m. Commodity production in <strong>the</strong>se countries would be<br />
even greater if <strong>the</strong> resource base permitted it. The markets or governments would<br />
force a contraction <strong>of</strong> <strong>the</strong> raw materials industries if <strong>the</strong>y were unpr<strong>of</strong>itable or<br />
o<strong>the</strong>rwise socially undesirable.<br />
I conclude, <strong>the</strong>refore, that a heavy concentration on commodity production<br />
in a national economy is not detrimental per se. Diversification out <strong>of</strong> a commodity<br />
sec<strong>to</strong>r that has lost its competitive advantage and superior pr<strong>of</strong>itability is<br />
certainly warranted. But it is much harder <strong>to</strong> find tenable arguments for recommending<br />
that, say, Ivory Coast or Venezuela, both heavily dependent on <strong>the</strong><br />
exports <strong>of</strong> a few raw materials, should reduce <strong>the</strong>ir commodity reliance by a<br />
greater emphasis on manufacturing.<br />
REFERENCES<br />
Bairoch, P., 1965, “La baisse des couts des transports et le développement économique”, Révue<br />
de l’Institut de Sociologie, No. 2, Université libre de Bruxelles.<br />
BP, BP Statistical Review <strong>of</strong> World Energy (London; various issues).<br />
Caballero R. J., E. Fahri, and P. O. Gourinchas, 2008, “Financial Crash, Commodity Prices and<br />
Global Imbalances,” Brookings Papers on Economic Activity, Fall (Washing<strong>to</strong>n: Brookings<br />
Institution), September.<br />
Cashin, P., and C. J. McDermott, 2002, “The Long-Run Behavior <strong>of</strong> Commodity Prices: Small<br />
Trends and Big Variability,” IMF Staff Papers, Vol. 49, No. 2 (Washing<strong>to</strong>n: International<br />
Monetary Fund).<br />
Citigroup Global Markets, 2010, Bulks are Back (Commodities Strategy, February 2) (New<br />
York).<br />
Cochilco, 2009, Yearbook: Copper and O<strong>the</strong>r Mineral Statistics 1989-2008 (Santiago: Comision<br />
del Cobre).<br />
Commodity Research Bureau, 1964, Commodity Yearbook (New York).<br />
Cooper, R. N., and R. Z. Lawrence, 1975, “The 1972–75 Commodity Boom,” Brookings<br />
Papers on Economic Activity No. 3 (Washing<strong>to</strong>n: Brookings Institution).<br />
Cudding<strong>to</strong>n, J., R. Ludema, and S. Jayasuriya, 2007, “Prebisch-Singer Redux,” in <strong>Natural</strong><br />
<strong>Resources</strong>: Nei<strong>the</strong>r Curse Nor Destiny, ed. by D. Lederman and W.F. Maloney. (Palo Al<strong>to</strong>,<br />
California: Stanford University Press).<br />
Dillard, D., 1967, Economic Development <strong>of</strong> <strong>the</strong> North Atlantic Community (Englewood Cliffs,<br />
New Jersey: Prentice Hall).<br />
Grilli, E. R. and M. C. Yang, 1988, “Primary Commodity Prices, Manufactured Goods Prices<br />
and <strong>the</strong> Terms <strong>of</strong> Trade <strong>of</strong> Developing Countries: What <strong>the</strong> Long Run Shows,” World Bank<br />
Economic Review, January.<br />
©International Monetary Fund. Not for Redistribution
Radetzki 51<br />
Hadass, Y., and J. Williamson, 2003, “Terms <strong>of</strong> Trade Shocks and Economic Performance 1870-<br />
1940: Prebisch and Singer Revisited,” Economic Development and Cultural Change, Vol. 51,<br />
No. 3, pp. 629–56.<br />
Harvey, D., N. Kellard, J. Madsen, and M. Wohar, 2010, “The Prebisch-Singer Hypo<strong>the</strong>sis:<br />
Four Centuries <strong>of</strong> Evidence,” Review <strong>of</strong> Economics and Statistics, Vol. 92, No. 2 (May),<br />
pp. 367–77.<br />
International Energy Agency (IEA), Oil Market Report (Paris).<br />
IEA, 2009, World Energy Outlook 2009 (Paris: International Energy Agency).<br />
IMF, 2006, World Economic Outlook, Chapter 5 (Washing<strong>to</strong>n, DC: International Monetary<br />
Fund), September.<br />
———, 2010, World Economic Outlook (Washing<strong>to</strong>n, DC: International Monetary Fund),<br />
April.<br />
International Tin Council, 1964, Statistical Yearbook.<br />
International Tin Council (monthly), Monthly Statistical Bulletin.<br />
Irwin, S., and D. Sanders, 2010, “Speculation and Financial Fund Activity,” Report issued by<br />
<strong>the</strong> OECD Working Party on Agricultural <strong>Policies</strong> and Markets (Paris: OECD), April 27.<br />
Kuznets, S., 1966, Modern Economic Growth, Rate, Structure and Spread (London: Yale<br />
University Press).<br />
Landes, D.S., 1980, “The Great Drain and Industrialization: Commodity Flows from Periphery<br />
<strong>to</strong> Center in His<strong>to</strong>rical Perspective,” in Economic Growth and <strong>Resources</strong>, Vol. 2, Trends and<br />
Fac<strong>to</strong>rs, ed. by R. C. O. Mat<strong>the</strong>ws (London: Macmillan).<br />
Lundgren N.-G., 1996, “Bulk Trade and Maritime Transport Costs: The Evolution <strong>of</strong> Global<br />
Markets,” <strong>Resources</strong> Policy, Vol. 22, Nos. 1 and 2.<br />
Mill, J. S., 1848, Principles <strong>of</strong> Political Economy, Vol. II (London: John W. Parker).<br />
Paley, W. S., 1952, <strong>Resources</strong> for Freedom: The President’s Materials Policy Commission (summary<br />
<strong>of</strong> volume 1) (Washing<strong>to</strong>n).<br />
Prebish, R., 1962, “The Economic Development <strong>of</strong> Latin America and Its Principal Problems,”<br />
Economic Bulletin for Latin America, pp. 1–22.<br />
Radetzki, M., 1970, International Commodity Market Arrangement (London: C. Hurst).<br />
———, 1981, Uranium: A Strategic Source <strong>of</strong> Energy (London: Croom Helm).<br />
———, 2001, The Green Myth—Economic Growth and <strong>the</strong> Quality <strong>of</strong> <strong>the</strong> Environment (Essex,<br />
UK: Multi-science Publishing Co.).<br />
———, 2006, “The Ana<strong>to</strong>my <strong>of</strong> Three Commodity Booms,” <strong>Resources</strong> Policy, Vol. 31,<br />
September.<br />
———, forthcoming, “Peak Oil and O<strong>the</strong>r Threatening Peaks – Chimeras Without Substance,”<br />
Energy Policy.<br />
Radetzki, M., R. Eggert, G. Lagos, M. Lima, and J. Til<strong>to</strong>n, 2008, “The Boom in Mineral<br />
Markets: How Long Might It Last?” <strong>Resources</strong> Policy, Vol. 33, September.<br />
Rowe, J. W. F., 1965, Primary Commodities in International Trade (Cambridge, UK: Cambridge<br />
University Press).<br />
Singer, H., 1950, “The Distribution <strong>of</strong> Gains between Investing and Borrowing Countries,”<br />
American Economic Review, Vol. 40, No. 2, May, pp. 473–85.<br />
Skidelsky, R., 1996, The Road from Serfdom: Economic and Political Consequences <strong>of</strong> <strong>the</strong> End <strong>of</strong><br />
Communism (London: Allen & Lane).<br />
Svedberg, P., and J. Til<strong>to</strong>n, 2006, “The Real, Real Price <strong>of</strong> Non-Renewable <strong>Resources</strong>: Copper<br />
1870–2000,” World Development, Vol. 34, No 3.<br />
UBS Investment Research, 2010, Commodity Price Review, February.<br />
United Nations (UN), (annual), Statistical Yearbook (New York).<br />
UN Commission on Trade and Development (UNCTAD), 2010, Iron Ore Market 2009–2011 (Geneva).<br />
©International Monetary Fund. Not for Redistribution
This page intentionally left blank<br />
©International Monetary Fund. Not for Redistribution
PART II<br />
Economic Diversification<br />
and <strong>the</strong> Role <strong>of</strong> Finance<br />
©International Monetary Fund. Not for Redistribution
This page intentionally left blank<br />
©International Monetary Fund. Not for Redistribution
Economic Diversification<br />
in Resource-Rich Countries<br />
ALAN GELB<br />
INTRODUCTION<br />
CHAPTER 4<br />
Developing countries as a whole have been remarkably successful in diversifying<br />
<strong>the</strong>ir economies and <strong>the</strong>ir export structures. This process <strong>of</strong> diversification has<br />
taken many forms. The most prominent change has been <strong>the</strong> shift <strong>to</strong>ward industry.<br />
In <strong>the</strong> 1960s, some 80 percent <strong>of</strong> developing country exports were primary<br />
commodities; <strong>to</strong>day, almost 80 percent are industrial products. This massive<br />
transformation in export structure has been associated with <strong>the</strong> rise <strong>of</strong> major<br />
industrial power-houses, China most prominently, but also countries such as<br />
Korea, India, Brazil, Malaysia, Vietnam, Indonesia, and Mexico. Most <strong>of</strong> <strong>the</strong>se<br />
new industrial powers were previously primary-based economies. Today <strong>the</strong>y are<br />
deeply integrated in<strong>to</strong> global production networks across a wide range <strong>of</strong> sec<strong>to</strong>rs,<br />
participating in rapidly growing South–South trade, and in most cases rapidly<br />
upgrading <strong>the</strong> sophistication <strong>of</strong> <strong>the</strong>ir export mix.<br />
O<strong>the</strong>r countries have not moved as far <strong>to</strong>wards “footloose” manufactures but<br />
have taken advantage <strong>of</strong> <strong>the</strong> potential for upgrading <strong>the</strong>ir resource-based sec<strong>to</strong>rs.<br />
For example, between 1975 and 2004 Latin America’s share <strong>of</strong> global markets in<br />
metals expanded by 175 percent. During this time its share <strong>of</strong> global ores and<br />
unwrought metals doubled, but its share <strong>of</strong> worked products increased eightfold<br />
(Sinnott, Nash, and de la Torre, 2010). Still o<strong>the</strong>r countries have moved away<br />
from traditional simple primary exports and <strong>to</strong>ward more complex, yet still primary-based,<br />
products and services. The simple primary sec<strong>to</strong>rs include horticulture,<br />
floriculture, and fresh fish, sec<strong>to</strong>rs with formidable demands for efficient<br />
logistics services and requiring <strong>the</strong> ability <strong>to</strong> comply with sanitary and phy<strong>to</strong>sanitary<br />
standards. Some services, such as <strong>to</strong>urism based on game, beaches, and<br />
o<strong>the</strong>r natural attractions, can also be considered as resource-based; <strong>the</strong>se also have<br />
Alan Gelb is senior fellow at <strong>the</strong> Center for Global Development. This chapter is based on <strong>the</strong><br />
author’s presentation at “<strong>Natural</strong> <strong>Resources</strong>, Finance, and Development: Confronting Old and New<br />
Challenges,” a high-level seminar organized by <strong>the</strong> Central Bank <strong>of</strong> Algeria and <strong>the</strong> IMF Institute,<br />
which <strong>to</strong>ok place in Algiers, on November 4 and 5, 2010. The author can be contacted at agelb@<br />
cgdev.org.<br />
©International Monetary Fund. Not for Redistribution<br />
55
56 Economic Diversifi cation in Resource-Rich Countries<br />
high logistical and technical requirements. Tourism has for some years been <strong>the</strong><br />
fastest-growing export for sub-Saharan Africa—it now represents <strong>the</strong> equivalent<br />
<strong>of</strong> over 10 percent <strong>of</strong> merchandise exports. Much <strong>of</strong> this is resource-based.<br />
Information technology (IT)-related service exports have also been growing,<br />
although <strong>the</strong>se are not resource-based. 1<br />
Sub-Saharan Africa has remained heavily dependent on primary sec<strong>to</strong>rs. While<br />
about 20 percent <strong>of</strong> <strong>the</strong> region’s exports are classified as industrial, most <strong>of</strong> <strong>the</strong>m<br />
are modestly processed primary products. Barely one quarter <strong>of</strong> <strong>the</strong> region’s industrial<br />
exports are true manufactures, and <strong>the</strong> two major categories, au<strong>to</strong>motive<br />
products from South Africa and clothing exports from low-income countries, are<br />
both supported by special incentive programs (IMF, 2007; Gelb, 2011). As a first<br />
approximation, sub-Saharan Africa is not competitive in any sec<strong>to</strong>rs that are not<br />
based on natural resources.<br />
This chapter considers <strong>the</strong> issue <strong>of</strong> diversification from a particular perspective—countries<br />
with a very strong comparative advantage in a specific natural<br />
resource, especially minerals. Mineral-dominant exporters have particular features<br />
and face distinct challenges relative <strong>to</strong> countries with a balanced endowment <strong>of</strong><br />
resources. Production linkages with <strong>the</strong> rest <strong>of</strong> <strong>the</strong> economy are relatively limited.<br />
<strong>Natural</strong> rent is highly concentrated and largely realized in <strong>the</strong> form <strong>of</strong> fiscal revenues.<br />
With some exceptions, notably for artisanal mining, direct employment<br />
creation in <strong>the</strong> mineral sec<strong>to</strong>r is <strong>of</strong>ten modest.<br />
These tendencies hold <strong>to</strong> a greater or lesser degree for different minerals and<br />
particular economies, but <strong>the</strong>y are particularly marked for oil. Hydrocarbon-rich<br />
countries represent an extreme within <strong>the</strong> range <strong>of</strong> mineral exporters and deserve<br />
special attention. About 35 countries are dependent on hydrocarbons, and new<br />
producers, like Ghana and Uganda, are coming on- stream. Within sub-Saharan<br />
Africa, oil exporters constitute one-third <strong>of</strong> <strong>the</strong> population and land area.<br />
Globally, ano<strong>the</strong>r 12 countries, many <strong>of</strong> <strong>the</strong>m also in sub-Saharan Africa, are<br />
dependent on hard minerals, including copper (Mongolia, Chile, Zambia) and<br />
diamonds (Botswana, Sierra Leone).<br />
Such mineral exporters tend <strong>to</strong> be heavily dependent on <strong>the</strong>ir dominant sec<strong>to</strong>r.<br />
Bornhorst, Gupta, and Thorn<strong>to</strong>n (2008) examine 30 oil exporters over <strong>the</strong> period<br />
1992–2005, a time when oil prices were mostly moderate or low in his<strong>to</strong>rical<br />
context. They estimate that revenues from hydrocarbons represented on average<br />
16 percent <strong>of</strong> GDP or 49 percent <strong>of</strong> <strong>to</strong>tal fiscal revenue. For some regions, <strong>the</strong><br />
averages were higher: For 14 Middle East exporters, <strong>the</strong>y were 20 percent and 57<br />
percent, respectively. But GDP includes both <strong>the</strong> hydrocarbon sec<strong>to</strong>r and a range<br />
<strong>of</strong> o<strong>the</strong>r production activities that depend, directly or indirectly, on <strong>the</strong> oil sec<strong>to</strong>r,<br />
and many “non-oil” taxes (including import duties and corporate taxes) are <strong>the</strong>mselves<br />
dependent on activities and flows that depend on <strong>the</strong> domestic spending<br />
1 Tourism based on cultural heritage can also be considered as resource-based <strong>to</strong> <strong>the</strong> extent that sites<br />
are non-replicable and hence a part <strong>of</strong> <strong>the</strong> resource base <strong>of</strong> <strong>the</strong> nation. For discussion <strong>of</strong> <strong>the</strong> relationship<br />
between <strong>to</strong>urism, heritage sites (which increasingly include natural sites) and development see<br />
Arezki, Cherif, and Piotrowski (2009).<br />
©International Monetary Fund. Not for Redistribution
Gelb 57<br />
and export revenue made possible by <strong>the</strong> oil sec<strong>to</strong>r. The true dependence <strong>of</strong> <strong>the</strong>se<br />
economies on oil is <strong>the</strong>refore far larger than it appears.<br />
“Sowing <strong>the</strong> oil” <strong>to</strong> diversify <strong>the</strong> economy has been a long-standing goal for<br />
many mineral exporters. However, few have managed <strong>to</strong> break free <strong>of</strong> dependence<br />
on <strong>the</strong>ir dominant resource. The objective <strong>of</strong> this chapter is <strong>to</strong> look at this problem<br />
through <strong>the</strong> lens <strong>of</strong> mineral (and especially oil) exporters and focus on some<br />
<strong>of</strong> <strong>the</strong> policy issues such countries face.<br />
The first question is, Why diversify in <strong>the</strong> first place? Why try <strong>to</strong> move away<br />
from a sec<strong>to</strong>r with very strong comparative advantage? As discussed in <strong>the</strong> next<br />
section, <strong>the</strong> motive may simply reflect <strong>the</strong> proposition, which is supported by<br />
evidence, that export diversification is associated with higher long-run growth.<br />
However, resource exporters differ from one ano<strong>the</strong>r in many respects, including<br />
population, labor force and skills, location, levels <strong>of</strong> income, reserves, and <strong>the</strong><br />
potential for o<strong>the</strong>r resource-based activities. These differences will shape diversification<br />
priorities and policies. For example, productive employment is a major<br />
goal in many exporters, including in <strong>the</strong> Middle East, but <strong>the</strong>re is a striking difference<br />
between <strong>the</strong> six oil-rich labor-importing countries <strong>of</strong> <strong>the</strong> Gulf Cooperation<br />
Council (GCC) and <strong>the</strong> o<strong>the</strong>r oil-rich but labor-abundant countries. Some <strong>of</strong> <strong>the</strong><br />
former have extremely large oil reserves and immense mineral riches per capita.<br />
Since <strong>the</strong>y are chronic importers <strong>of</strong> labor <strong>the</strong>ir main motivation <strong>to</strong> diversify cannot<br />
be employment for nationals in <strong>the</strong> usual sense, but <strong>the</strong>y may see a need <strong>to</strong><br />
diversify assets and income for strategic reasons in <strong>the</strong> very long run. 2 One outcome<br />
has been <strong>the</strong> Dubai model <strong>of</strong> development. Dubai, which is discussed fur<strong>the</strong>r<br />
below, is very distinctive, but it does <strong>of</strong>fer some positive and negative lessons<br />
for o<strong>the</strong>r countries considering a push for diversification. The rest <strong>of</strong> this chapter<br />
considers <strong>the</strong> more normal cases <strong>of</strong> low- and middle-income countries that each<br />
have a substantial population, large development needs, and a dominant resource<br />
sec<strong>to</strong>r.<br />
The third section summarizes research on <strong>the</strong> relationship between resources<br />
and rapid growth and development, viewing this from <strong>the</strong> perspective <strong>of</strong> diversification.<br />
There is still much debate on how resource wealth, or resource dependence,<br />
relates <strong>to</strong> long-term growth. The question is complicated because measures<br />
<strong>of</strong> both resource dependence and resource abundance are at least partly endogenous<br />
<strong>to</strong> growth and income level. The emerging consensus is that resource wealth<br />
itself is not necessarily bad. Indeed, <strong>the</strong> commonsense proposition that it is a<br />
good finds considerable support, including from examples like Australia, Canada,<br />
and <strong>the</strong> United States, which have transitioned from resource-based countries <strong>to</strong><br />
high-income diversified economies. Yet <strong>the</strong>re is a good deal <strong>of</strong> evidence that diversification<br />
<strong>of</strong> <strong>the</strong> export bundle is associated with higher long-run growth and that<br />
countries that get ”locked in” <strong>to</strong> dependence on a limited range <strong>of</strong> products do<br />
less well in <strong>the</strong> long run. Moreover, “Dutch disease,” defined as a syndrome <strong>of</strong><br />
2 At US$70 per barrel, Abu Dhabi’s known oil reserves represent over US$16 million per citizen.<br />
Saudi Arabia is an exception among <strong>the</strong> GCC countries, as it has a considerable and rapidly growing<br />
population.<br />
©International Monetary Fund. Not for Redistribution
58 Economic Diversifi cation in Resource-Rich Countries<br />
fac<strong>to</strong>rs that cause countries <strong>to</strong> lose ra<strong>the</strong>r than <strong>to</strong> benefit from resource wealth, is<br />
real for some countries even if it is not inevitable.<br />
One <strong>of</strong> <strong>the</strong> main conclusions <strong>of</strong> <strong>the</strong> section is that many <strong>of</strong> <strong>the</strong> policy and<br />
institutional fac<strong>to</strong>rs that enable countries <strong>to</strong> manage resource wealth well are<br />
equally important for <strong>the</strong>ir ability <strong>to</strong> diversify in<strong>to</strong> o<strong>the</strong>r sec<strong>to</strong>rs. One important<br />
criterion is whe<strong>the</strong>r <strong>the</strong> country has <strong>the</strong> capacity <strong>to</strong> smooth out <strong>the</strong> high macroeconomic<br />
volatility that large swings in export prices can transmit <strong>to</strong><br />
mono-exporters. If not, it will be far more difficult <strong>to</strong> sustain investment in <strong>the</strong><br />
nonresource traded sec<strong>to</strong>rs, which will be destabilized by large swings in <strong>the</strong> real<br />
exchange rate. Cross-country studies also suggest that <strong>the</strong> impact <strong>of</strong> resources on<br />
growth is not homogeneous. Ra<strong>the</strong>r, <strong>the</strong> impact depends on whe<strong>the</strong>r <strong>the</strong> country<br />
is well endowed with two types <strong>of</strong> capital that can be seen as complementary <strong>to</strong><br />
natural resources: human capital and governance or institutional capital. Without<br />
<strong>the</strong>se, <strong>the</strong> country is more likely <strong>to</strong> experience a resource curse. There is also evidence<br />
that countries with lower levels <strong>of</strong> <strong>the</strong>se complementary assets will find it<br />
more difficult <strong>to</strong> diversify and <strong>to</strong> advance up <strong>the</strong> export technology ladder. This<br />
suggests that in <strong>the</strong> long run countries need a balanced endowment <strong>of</strong> fac<strong>to</strong>rs <strong>to</strong><br />
grow. Resource wealth <strong>of</strong>fers opportunities for countries <strong>to</strong> build human and<br />
institutional capital, but many countries lag badly in <strong>the</strong>se areas.<br />
Resource wealth also <strong>of</strong>fers countries a choice: whe<strong>the</strong>r <strong>to</strong> invest <strong>the</strong> wealth in<br />
ways that decrease costs and increase productivity in <strong>the</strong> nonresource traded sec<strong>to</strong>rs,<br />
or <strong>to</strong> spend it in o<strong>the</strong>r ways, which will lock in resource dependence.<br />
Currently <strong>the</strong>re is much debate over <strong>the</strong> policies for promoting economic growth<br />
and structural change. In particular, views diverge on <strong>the</strong> right balance between<br />
policies that emphasize macroeconomic stability, openness, and a generally sec<strong>to</strong>rneutral<br />
role for <strong>the</strong> state (“horizontal” policies) and policies that favor particular<br />
sec<strong>to</strong>rs and even firms (“vertical” policies). Old-style industrial policy was heavily<br />
identified with planning, protection, and <strong>the</strong> promotion <strong>of</strong> heavy industry. As<br />
evidence <strong>of</strong> its costs and ineffectiveness mounted, <strong>the</strong> weight <strong>of</strong> opinion shifted<br />
<strong>to</strong>ward open markets and minimal state intervention. More recently, however,<br />
many countries have been considering a range <strong>of</strong> active, market-compatible<br />
industrial policies aimed at encouraging investment by compensating for market<br />
imperfections, such as economies external <strong>to</strong> individual firms’ actions and coordination<br />
failures. 3<br />
This chapter does not take a position on vertical policies in principle—evidence<br />
is clear that <strong>the</strong> result will depend on how <strong>the</strong>y are designed and implemented.<br />
It recognizes that some form <strong>of</strong> vertical policy is probably inevitable for<br />
resource-rich countries seeking <strong>to</strong> diversify. Two reasons why this may be inevitable<br />
are (i) because market forces alone would tend <strong>to</strong> pull <strong>the</strong> country back<br />
<strong>to</strong>ward resource dependence and (ii) because resource rents provide governments<br />
with more discretion <strong>to</strong> implement such policies, for example, through targeted<br />
3 For a discussion <strong>of</strong> old-style “comparative advantage defying” policies that involve heavy protection<br />
and import-substitution, especially in favor <strong>of</strong> heavy industry, versus market-friendly “comparative<br />
advantage following” policies, see Lin (2009).<br />
©International Monetary Fund. Not for Redistribution
Gelb 59<br />
public investment programs <strong>to</strong> bring down <strong>the</strong> costs <strong>of</strong> production for nonresource<br />
traded sec<strong>to</strong>rs. However, <strong>the</strong> risks are particularly high for countries with<br />
resource wealth, where <strong>the</strong>re will be pressure <strong>to</strong> subvert such policies <strong>to</strong>wards <strong>the</strong><br />
goal <strong>of</strong> rent-seeking. If not designed and implemented well, <strong>the</strong>y will work against<br />
diversification even if intended <strong>to</strong> encourage it.<br />
The fourth section <strong>of</strong> this chapter considers policy frameworks employed <strong>to</strong><br />
encourage diversification in <strong>the</strong> context <strong>of</strong> some country examples. Both horizontal<br />
and vertical policies have been used in <strong>the</strong>se countries, and reasonably effectively.<br />
The former include macroeconomic policies, especially fiscal policy, <strong>to</strong><br />
stabilize <strong>the</strong> economy against <strong>the</strong> boom-bust cycle, exchange rate management<br />
and overall trade policy, as well as <strong>the</strong> provision <strong>of</strong> high-quality education and<br />
measures <strong>to</strong> lower <strong>the</strong> cost <strong>of</strong> doing business. One illustrative example showing<br />
an opportunity unrealized by most oil exporters is <strong>the</strong> need <strong>to</strong> improve tax administration<br />
for <strong>the</strong> nonresource sec<strong>to</strong>rs. The section also draws some lessons from<br />
<strong>the</strong> Dubai model for countries attempting <strong>to</strong> create competitiveness through<br />
agglomeration externalities (benefits that firms obtain when locating near each<br />
o<strong>the</strong>r) or special zones.<br />
<strong>Policies</strong> alone are not <strong>the</strong> complete answer. We also need <strong>to</strong> understand why<br />
some countries have been able <strong>to</strong> implement and sustain good policies and o<strong>the</strong>rs<br />
have not. The fifth section briefly discusses some common institutional features<br />
<strong>of</strong> resource exporters that may have been helpful, and notes some <strong>of</strong> <strong>the</strong> limits <strong>of</strong><br />
diversification that geography and environment can impose.<br />
WHY DIVERSIFY?<br />
Why might countries with rich oil or diamond or copper reserves want <strong>to</strong> diversify<br />
in <strong>the</strong> first place? Does this make sense, given <strong>the</strong>ir particular comparative<br />
advantage? How does investment in domestic economic diversification, as a strategy,<br />
compare with alternatives such as portfolio diversification through saving<br />
a high share <strong>of</strong> resource rents abroad <strong>to</strong> invest in a range <strong>of</strong> industries—or simply<br />
slowing <strong>the</strong> rate <strong>of</strong> reserve depletion <strong>to</strong> hold more assets under <strong>the</strong> ground?<br />
One argument is that diversified economies perform better over <strong>the</strong> long term.<br />
There is strong empirical support for this proposition; Hesse (2008), Lederman<br />
and Maloney (2007), and o<strong>the</strong>rs provide analyses and useful summaries. Their<br />
results are robust <strong>to</strong> <strong>the</strong> exclusion <strong>of</strong> OECD countries and also <strong>to</strong> a control for<br />
trade openness. 4<br />
One explanation for this relationship is that engaging in manufacturing<br />
enables dynamic learning-by-doing gains that raise productivity and income.<br />
A related argument is that diversification exposes producers <strong>to</strong> a wider range <strong>of</strong><br />
information, including about foreign markets, and so raises <strong>the</strong> number <strong>of</strong> opportunities<br />
for producing countries <strong>to</strong> discover <strong>the</strong>ir own untapped potential.<br />
4 Imbs and Wacziarg (2003) found a U-shaped pattern whereby countries in <strong>the</strong> earlier stages <strong>of</strong> development<br />
diversify production but countries above a certain level <strong>of</strong> income tend <strong>to</strong> re-concentrate<br />
production. Most developing countries are <strong>the</strong>refore in <strong>the</strong> former stage. See also Rodrik (2004).<br />
©International Monetary Fund. Not for Redistribution
60 Economic Diversifi cation in Resource-Rich Countries<br />
Capability in one sec<strong>to</strong>r can open <strong>the</strong> way <strong>to</strong> o<strong>the</strong>rs, especially those that use<br />
related knowledge.<br />
This leads <strong>to</strong> <strong>the</strong> question <strong>of</strong> whe<strong>the</strong>r <strong>the</strong> benefit from exporting depends on<br />
which products are exported. A considerable body <strong>of</strong> research argues that it does.<br />
Certain products are close <strong>to</strong> each o<strong>the</strong>r in product space in <strong>the</strong> sense that <strong>the</strong><br />
ability <strong>to</strong> export one can easily lead <strong>to</strong> a small jump in capability <strong>to</strong> produce and<br />
export <strong>the</strong> o<strong>the</strong>r. A country that can make <strong>to</strong>asters, for example, would have <strong>the</strong><br />
capability <strong>to</strong> move speedily <strong>to</strong> a range <strong>of</strong> o<strong>the</strong>r white goods, <strong>the</strong>n perhaps <strong>to</strong><br />
microwaves and electronics. There may <strong>the</strong>refore be a greater externality from<br />
encouraging investments in such dense sec<strong>to</strong>rs in product space than in encouraging<br />
products that are on <strong>the</strong> periphery without clear knowledge, skills, or market<br />
relationships with o<strong>the</strong>r sec<strong>to</strong>rs. It is also preferable if a country’s export bundle<br />
resembles those <strong>of</strong> countries with higher levels <strong>of</strong> productivity and income.<br />
O<strong>the</strong>rwise, <strong>the</strong> country risks being locked in <strong>to</strong> low-wage competition with<br />
poorer countries. 5<br />
Not all governments or economists agree with an au<strong>to</strong>matic strong focus on<br />
manufacturing industries or on particular industrial subsec<strong>to</strong>rs. Some countries<br />
may have a strong secondary comparative advantage in a range <strong>of</strong> resource-based<br />
sec<strong>to</strong>rs, including secondary minerals, forestry, or tree crops, that are not necessarily<br />
connected but which <strong>of</strong>fer good opportunities. Sinnott, Nash, and de la<br />
Torre (2010) note that <strong>the</strong> rate <strong>of</strong> technical change in <strong>the</strong> manufacturing sec<strong>to</strong>r<br />
is not necessarily greater than that in primary sec<strong>to</strong>rs and that <strong>the</strong> latter also <strong>of</strong>fer<br />
opportunities for learning-by-doing. Some commodity production is argued <strong>to</strong> be<br />
as valuable in terms <strong>of</strong> production linkages and spillovers as o<strong>the</strong>r types <strong>of</strong> production.<br />
Moreover, <strong>the</strong>y note that, in contrast <strong>to</strong> earlier views, recent studies have<br />
not supported <strong>the</strong> argument that in <strong>the</strong> long run primary commodity prices<br />
decline relative <strong>to</strong> <strong>the</strong> prices <strong>of</strong> manufactured goods. They also note that some<br />
studies suggest that what is important is product concentration itself, ra<strong>the</strong>r than<br />
<strong>the</strong> nature <strong>of</strong> <strong>the</strong> dominant product.<br />
O<strong>the</strong>r fac<strong>to</strong>rs may also be important for resource-rich countries. High rates <strong>of</strong><br />
population growth dilute <strong>the</strong> long-run level <strong>of</strong> rents per capita. If population<br />
grows at 3 percent per year, <strong>the</strong> per capita contribution <strong>of</strong> a constant resource<br />
sec<strong>to</strong>r will halve in 24 years. Long-run prosperity and social stability will require<br />
<strong>the</strong> productive employment <strong>of</strong> growing fac<strong>to</strong>rs <strong>of</strong> production, including labor.<br />
Ano<strong>the</strong>r argument for diversification is <strong>to</strong> self-insure against <strong>the</strong> large macroeconomic<br />
shocks transmitted <strong>to</strong> countries heavily dependent on a limited range <strong>of</strong><br />
resource exports by wide swings in resource prices.<br />
Still ano<strong>the</strong>r possibility is that an exporting country might be capital constrained<br />
(van der Ploeg and Venables, 2009), with a marginal internal return <strong>to</strong><br />
investment that is higher than <strong>the</strong> yield on foreign assets. This would argue for<br />
emphasizing domestic investment over saving abroad. In addition, complete<br />
5 For discussion <strong>of</strong> <strong>the</strong>se points and methodology, see Hausmann and Klinger (2007) and associated<br />
works. The income level <strong>of</strong> <strong>the</strong> export bundle (EXPY) is derived from <strong>the</strong> income levels <strong>of</strong> countries<br />
which demonstrate a comparative advantage in <strong>the</strong>se products.<br />
©International Monetary Fund. Not for Redistribution
Gelb 61<br />
dependence on a massive external asset fund as <strong>the</strong> sole nonresource provider <strong>of</strong><br />
foreign exchange could be considered an unacceptable long-run strategic risk even<br />
if <strong>the</strong> holdings <strong>of</strong> <strong>the</strong> fund are diversified across industries. Will such a fund<br />
always be considered as a welcome inves<strong>to</strong>r by host countries? Could homecountry<br />
dependence on foreign investments constrain national sovereignty in <strong>the</strong><br />
possible event <strong>of</strong> future disagreements? Such considerations could lead <strong>to</strong> <strong>the</strong><br />
yield on foreign assets being discounted below <strong>the</strong>ir market levels and a premium<br />
on domestic investments able <strong>to</strong> substitute for a savings fund <strong>to</strong> provide foreign<br />
exchange.<br />
The urgency <strong>of</strong> such arguments will depend on <strong>the</strong> expected time horizon <strong>of</strong><br />
rent relative <strong>to</strong> needs. Physical exhaustion may not be <strong>the</strong> only issue. While environmental<br />
degradation can cause <strong>the</strong> collapse <strong>of</strong> societies (e.g., <strong>the</strong> deforestation<br />
<strong>of</strong> Easter Island), mineral resources have actually run out on a nationwide basis<br />
in only a few cases. 6 Advances in drilling and mining technology have <strong>of</strong>ten been<br />
able <strong>to</strong> extend <strong>the</strong> life <strong>of</strong> producing fields, sometimes by many years, and commercially<br />
exploitable reserves are, in any event, more <strong>of</strong> an economic than a<br />
physical concept, since <strong>the</strong>ir level depends on <strong>the</strong> level <strong>of</strong> prices. Some countries,<br />
like Gabon, are likely <strong>to</strong> see <strong>the</strong> effects <strong>of</strong> declining high-rent reserves relatively<br />
soon. But even countries with large resource deposits might be concerned about<br />
<strong>the</strong> possibility <strong>of</strong> technology shocks that threaten <strong>to</strong> eliminate or sharply reduce<br />
<strong>the</strong>ir only comparative advantage, ei<strong>the</strong>r by creating substitutes or by opening up<br />
new sources <strong>of</strong> supply. 7 From this perspective, even keeping resources in <strong>the</strong><br />
ground is risky and insurance can be an important motivation for diversification.<br />
These considerations have implications for how a country sees diversification<br />
as part <strong>of</strong> its overall strategy. Most countries seek gains in terms <strong>of</strong> growth and<br />
employment, but some might be willing <strong>to</strong> pay a premium <strong>to</strong> diversify. The same<br />
considerations also influence <strong>the</strong> type <strong>of</strong> diversification that a country might<br />
pursue. For some purposes, it could be sufficient <strong>to</strong> diversify within <strong>the</strong> resource<br />
sec<strong>to</strong>r, moving from oil <strong>to</strong> natural gas or hard mining in order <strong>to</strong> extend rents<br />
in<strong>to</strong> <strong>the</strong> future, and trying <strong>to</strong> maximize domestic upstream linkages with <strong>the</strong><br />
resource sec<strong>to</strong>r. For o<strong>the</strong>r purposes, <strong>the</strong> focus may be on moving downstream <strong>to</strong><br />
increase value-added, including through policies <strong>to</strong> fill gaps in crucial supply<br />
6 One example is Nauru, which enjoyed very high GDP per capita after independence due <strong>to</strong> its rich<br />
phosphate deposits. In anticipation <strong>of</strong> <strong>the</strong> exhaustion <strong>of</strong> <strong>the</strong> deposits, substantial investments were<br />
made in trust funds aimed <strong>to</strong> help cushion <strong>the</strong> transition and provide for Nauru’s economic future.<br />
However, because <strong>of</strong> heavy spending from <strong>the</strong> trust funds, including some wasteful investment<br />
activities, <strong>the</strong> government moved <strong>to</strong> a situation <strong>of</strong> virtual bankruptcy. To cut costs it called for a freeze<br />
on wages, a reduction <strong>of</strong> over-staffed public service departments, privatization <strong>of</strong> numerous government<br />
agencies, and closure <strong>of</strong> some overseas consulates. Economic uncertainty caused by financial<br />
mismanagement and corruption, combined with shortages <strong>of</strong> basic goods, has resulted in domestic<br />
unrest. In 2004 Nauru was faced with chaos amid political strife and <strong>the</strong> collapse <strong>of</strong> <strong>the</strong> island’s telecommunications<br />
system. Nauru is now heavily dependent on Australian aid.<br />
7 One example is recent advances in hydraulic fracturing technology, which have opened up greatly<br />
increased supplies <strong>of</strong> natural gas in <strong>the</strong> United States. Fusion power, <strong>the</strong> development <strong>of</strong> safe and<br />
cheap nuclear technology, or renewable energy technologies plus improved battery technology could<br />
each have a major effect on <strong>the</strong> demand for oil.<br />
©International Monetary Fund. Not for Redistribution
62 Economic Diversifi cation in Resource-Rich Countries<br />
chains linking <strong>the</strong> resource base <strong>to</strong> downstream industries. In still o<strong>the</strong>r cases, <strong>the</strong><br />
priority will be <strong>to</strong> shift <strong>to</strong>ward labor-intensive manufactures. Different countries<br />
have different resource endowments and constraints, and may have different<br />
goals. Some high-income countries, including Australia and Canada, have highproductivity<br />
modern economies yet are still heavily dependent on resources for<br />
exports. 8 While effective diversification can be a good investment, countries can<br />
waste a great deal <strong>of</strong> resources on ineffective programs or programs targeted<br />
<strong>to</strong>ward inappropriate goals.<br />
THE RESOURCE CURSE: A DIVERSIFICATION<br />
PERSPECTIVE<br />
The impact <strong>of</strong> resource rents on economic performance has been a subject <strong>of</strong><br />
debate. Three main complications arise in <strong>the</strong> analysis: (i) how <strong>to</strong> deal with <strong>the</strong><br />
endogeneity <strong>of</strong> measures <strong>of</strong> resource abundance (reserves per head) and resource<br />
dependence (<strong>the</strong> resource intensity <strong>of</strong> exports or fiscal revenues or GDP); 9<br />
(ii) how <strong>to</strong> measure outcomes (income levels, growth rates, or broader development<br />
indica<strong>to</strong>rs); and (iii) how <strong>to</strong> allow for country heterogeneity. If <strong>the</strong> result<br />
depends, for example, on institutional quality or human capital, <strong>the</strong> problem may<br />
not be natural resources but <strong>the</strong> lack <strong>of</strong> <strong>the</strong>se complementary fac<strong>to</strong>rs.<br />
Studies using resource abundance measures tend <strong>to</strong> find positive associations<br />
between natural resources and growth. “Wealth <strong>of</strong> nations” estimates find that<br />
higher-income countries have higher levels per capita <strong>of</strong> all types <strong>of</strong> capital,<br />
including natural capital (cropland, forests and sub-soil mineral assets). <strong>Natural</strong><br />
capital averages only US$3,588 per capita in low-income countries but<br />
US$20,227 in those with high incomes. 10 These data hardly suggest that lowincome<br />
countries are locked in<strong>to</strong> <strong>the</strong>ir status by an excess <strong>of</strong> known natural capital.<br />
However, o<strong>the</strong>r categories <strong>of</strong> capital, including human capital and produced<br />
capital, increase far more rapidly across <strong>the</strong> income progression. This suggests that<br />
<strong>the</strong> different types <strong>of</strong> capital complement each o<strong>the</strong>r and that countries do diversify<br />
away from reliance on natural capital as <strong>the</strong>y grow richer.<br />
Studies using measures <strong>of</strong> resource dependence find a negative relation<br />
ship with economic growth. For example, Lederman and Maloney (2007) note<br />
that between 1980 and 2005 GDP per capita grew far more slowly in net<br />
natural resource exporters (0.6 percent) than in net natural resource importers<br />
8 In 2009, agricultural, energy, forestry, and mining provided about 58 percent <strong>of</strong> Canada’s <strong>to</strong>tal<br />
exports; agriculture and mining represented 42 percent <strong>of</strong> Australia’s exports. In terms <strong>of</strong> GDP, <strong>the</strong><br />
shares are smaller; resource sec<strong>to</strong>rs represent about 12 percent <strong>of</strong> GDP in Canada and 10 percent in<br />
Australia.<br />
9 Measures <strong>of</strong> resource abundance are higher in richer, more well-governed countries because <strong>the</strong>se<br />
have typically seen higher levels <strong>of</strong> exploration and prospecting. This suggests that much <strong>of</strong> <strong>the</strong><br />
resource wealth <strong>of</strong> poor countries is still awaiting discovery. Measures <strong>of</strong> resource dependence are<br />
higher in poorly governed countries partly because o<strong>the</strong>r productive activities are rendered unviable<br />
by risk and high costs, and low because low income and demand leave more resources for export.<br />
10 For estimates <strong>of</strong> national wealth see World Bank (2006).<br />
©International Monetary Fund. Not for Redistribution
Gelb 63<br />
(2.2 percent). 11 As discussed above, one interpretation is that countries that are<br />
specialized in mineral resources find it more difficult <strong>to</strong> make <strong>the</strong> jump <strong>to</strong> diversify<br />
<strong>to</strong>wards products that can open <strong>the</strong> way <strong>to</strong> acquiring capabilities in o<strong>the</strong>r,<br />
more advanced, products that can support higher wages as <strong>the</strong> country moves up<br />
<strong>the</strong> technology ladder. Oil, for example, is well separated in product space from<br />
dense clusters; unless technically sophisticated <strong>to</strong> <strong>the</strong> point where it can produce<br />
capital equipment, a producer may not learn much from oil production that<br />
enables it <strong>to</strong> produce o<strong>the</strong>r products. 12<br />
However, <strong>the</strong> question <strong>of</strong> where best <strong>to</strong> compete in terms <strong>of</strong> products could be<br />
quite difficult for a specialized mineral exporter. For example, a middle-income<br />
exporter starting out on <strong>the</strong> diversification process will not compete easily with<br />
products typically made by low-income resource-poor labor-abundant competi<strong>to</strong>rs.<br />
But with wage costs and a real exchange rate reflecting <strong>the</strong> level <strong>of</strong> income<br />
sustained by minerals, it may also not be easy <strong>to</strong> jump <strong>to</strong> o<strong>the</strong>r products made by<br />
nonresource countries at a similar level <strong>of</strong> income but with superior capacity.<br />
Managing Volatility<br />
One channel for <strong>the</strong> adverse linkage between resource dependence and growth is<br />
volatility. Resource prices are very volatile, particularly for oil, where <strong>the</strong> coefficient<br />
<strong>of</strong> variation <strong>of</strong> prices is 0.7. Prices are also very difficult <strong>to</strong> predict. Since <strong>the</strong><br />
start <strong>of</strong> <strong>the</strong> 1970s, none <strong>of</strong> <strong>the</strong> major turning points in <strong>the</strong> oil market has been<br />
widely predicted. Predictions in <strong>the</strong> early 1980s were for sustained price increases,<br />
which proved very far <strong>of</strong>f <strong>the</strong> outcome. During <strong>the</strong> recent oil boom, futures<br />
prices simply followed <strong>the</strong> spot price; <strong>the</strong>y were flat, extending <strong>the</strong> current price<br />
out as far as 10 years. Actual prices cannot strictly conform <strong>to</strong> such a random walk<br />
process because <strong>of</strong> some lower and some upper bound, but estimated prediction<br />
models do little or no better than a random walk.<br />
Hamil<strong>to</strong>n (2008) provides a careful study <strong>of</strong> <strong>the</strong> statistical properties <strong>of</strong> oil<br />
price series. He finds that <strong>the</strong> random walk hypo<strong>the</strong>sis cannot be rejected and<br />
that, starting from a price <strong>of</strong> US$115 per barrel, four years in<strong>to</strong> <strong>the</strong> future we<br />
should not be <strong>to</strong>o surprised <strong>to</strong> find <strong>the</strong> price <strong>of</strong> oil ei<strong>the</strong>r as high as US$391 per<br />
barrel or as low as US$34. The latter price was inconceivable at <strong>the</strong> time <strong>of</strong> that<br />
study and far outside <strong>the</strong> range <strong>of</strong> observed futures prices; however, prices did hit<br />
US$34 per barrel late in 2008 as <strong>the</strong> market collapsed. The resulting uncertainty<br />
is enormous for producers. Consider, for example, an exporter like Nigeria. With<br />
a base value <strong>of</strong> oil valued at US$100 per bbl, <strong>the</strong> difference between a price <strong>of</strong><br />
US$50 and one <strong>of</strong> US$150 is equivalent <strong>to</strong> a difference <strong>of</strong> 50 percent <strong>of</strong> its GDP.<br />
Oil exporters have typically not succeeded in smoothing <strong>the</strong>se extreme price<br />
cycles. They tend <strong>to</strong> alternate periods <strong>of</strong> shorter booms, marked by appreciating<br />
11<br />
Gylfason (this volume) reports <strong>the</strong>se two effects, one positive and <strong>the</strong> o<strong>the</strong>r negative, on one single<br />
regression.<br />
12<br />
Hausmann, Klinger, and Lopez-Calix (2010) analyze this issue in <strong>the</strong> context <strong>of</strong> Algeria. Countries<br />
like Norway and, more recently, Brazil, have shown <strong>the</strong> ability <strong>to</strong> build substantial upstream linkages<br />
from oil <strong>to</strong> industry.<br />
©International Monetary Fund. Not for Redistribution
64 Economic Diversifi cation in Resource-Rich Countries<br />
real exchange rates, 13 soaring prices in nontraded sec<strong>to</strong>rs (particularly real estate),<br />
and high but not spectacular growth rates <strong>of</strong> GDP, with prolonged slumps. This<br />
supply-side pattern mirrors <strong>the</strong> even larger swings in <strong>the</strong> rhythm <strong>of</strong> real absorption,<br />
usually led by swings in public spending.<br />
The destructiveness <strong>of</strong> <strong>the</strong>se cycles is clear from many examples. Mexico borrowed<br />
against expectations <strong>of</strong> increasing real oil prices after 1981 and suffered<br />
badly when <strong>the</strong>se expectations turned out <strong>to</strong> be far <strong>of</strong>f track. Before 1980,<br />
Venezuela had been one <strong>of</strong> <strong>the</strong> fastest-growing Latin American economies, with<br />
long-term growth averaging 6.4 percent. But following several euphoric years<br />
after 1974 it experienced a sharp decline, with output per capita halving over <strong>the</strong><br />
next two decades. Nigeria <strong>of</strong>fers a third example, with voracious public spending<br />
outpacing revenue increases up <strong>to</strong> 1984, followed by sharply lower debt-constrained<br />
spending <strong>the</strong>reafter (Budina and van Wijnbergen, 2008). Simulations<br />
show that such cycles can turn a potential oil windfall in<strong>to</strong> an actual loss (Gelb<br />
and Grasmann, 2010). A long line <strong>of</strong> research relates output volatility <strong>to</strong> slow<br />
growth. 14<br />
Severe macroeconomic instability also makes export diversification more difficult.<br />
Hausmann and Rigobon (2003) show how real exchange rate volatility<br />
stemming from shocks in markets for concentrated exports will reduce incentives<br />
in <strong>the</strong> nonresource traded sec<strong>to</strong>rs for risk-averse inves<strong>to</strong>rs. Investment will shift<br />
<strong>to</strong>ward <strong>the</strong> nontraded sec<strong>to</strong>rs, leading <strong>to</strong> premature specialization in <strong>the</strong> dominant<br />
resource. This in turn leads <strong>to</strong> still greater volatility, and <strong>to</strong> lower growth. 15<br />
One key element <strong>of</strong> diversification policy, <strong>the</strong>refore, should be prudent macroeconomic<br />
management over <strong>the</strong> resource cycle <strong>to</strong> help stabilize <strong>the</strong> economic setting<br />
for <strong>the</strong> traded sec<strong>to</strong>rs.<br />
Because <strong>of</strong> <strong>the</strong> importance <strong>of</strong> fiscal linkages, <strong>the</strong> prime component <strong>of</strong> stabilization<br />
policy over <strong>the</strong> boom-bust cycle has <strong>to</strong> be cautious public spending underpinned<br />
by high savings in <strong>the</strong> boom period <strong>to</strong> smooth out aggregate demand.<br />
O<strong>the</strong>r policies can have a subsidiary role in stabilizing <strong>the</strong> economic setting for<br />
firms in <strong>the</strong> nonresource traded sec<strong>to</strong>rs. But if <strong>the</strong>se firms are <strong>to</strong> have a reasonably<br />
stable base, <strong>the</strong>re is no alternative <strong>to</strong> efforts <strong>to</strong> sustain countercyclical fiscal policy<br />
over <strong>the</strong> resource cycle.<br />
Exchange rate policy presents a dilemma. On <strong>the</strong> upside <strong>of</strong> a strong cycle,<br />
a policy <strong>of</strong> fixed exchange rates will expose firms <strong>to</strong> <strong>the</strong> impact <strong>of</strong> appreciating<br />
demand and soaring prices in <strong>the</strong> booming nontraded sec<strong>to</strong>r. If <strong>the</strong> policy is sustained<br />
on <strong>the</strong> downside <strong>of</strong> <strong>the</strong> cycle, it can result in a painful period <strong>of</strong> falling<br />
13<br />
Real exchange rates do appear <strong>to</strong> be quite responsive <strong>to</strong> resource exports. For oil exporters, Korhonen<br />
and Juurikkala (2007) find a consistent relationship between real <strong>the</strong> exchange rate and oil prices with<br />
an elasticity <strong>of</strong> about 0.4.<br />
14<br />
Ramey and Ramey (1995) provide an early analysis; more recent research includes Hnatkovska and<br />
Loayza (2003).<br />
15Volatility increases because changes in relative prices can only affect <strong>the</strong> relative demand for nontraded<br />
and traded goods. With full specialization, <strong>the</strong> supply response is zero. Real exchange rates do appear <strong>to</strong><br />
be quite responsive <strong>to</strong> resource exports; for oil exporters, Korhonen and Juurikkala (2007) find a consistent<br />
relationship between <strong>the</strong> real exchange rate and oil prices with an elasticity <strong>of</strong> about 0.4.<br />
©International Monetary Fund. Not for Redistribution
Gelb 65<br />
demand and deflation. However, flexible rates will expose <strong>the</strong> firms <strong>to</strong> external<br />
competition even more rapidly in <strong>the</strong> upward phase <strong>of</strong> <strong>the</strong> cycle. 16<br />
As a number <strong>of</strong> countries have found, it is also futile <strong>to</strong> try <strong>to</strong> protect <strong>the</strong><br />
nonresource traded sec<strong>to</strong>rs by attempting <strong>to</strong> choke <strong>of</strong>f booming imports through<br />
a tightening <strong>of</strong> import barriers. The only effect will be fur<strong>the</strong>r appreciation <strong>of</strong> <strong>the</strong><br />
real exchange rate, higher domestic prices and input costs, and less competitive<br />
production.<br />
Monetary policy also has limitations. A general tightening <strong>of</strong> credit <strong>to</strong> slow <strong>the</strong><br />
booming nontraded sec<strong>to</strong>r will have a harmful impact on <strong>the</strong> traded sec<strong>to</strong>rs. It<br />
may also fur<strong>the</strong>r encourage capital inflows, which anyway tend <strong>to</strong> be procyclical.<br />
It may be necessary <strong>to</strong> use more discriminating <strong>to</strong>ols that can selectively tighten<br />
credit <strong>to</strong> <strong>the</strong> nontraded sec<strong>to</strong>rs <strong>to</strong> limit construction and real estate booms. 17 For<br />
example, faced with a booming real estate market in <strong>the</strong> 1980s, Malaysia imposed<br />
special reserve requirements on <strong>the</strong> banking system <strong>to</strong> discourage <strong>the</strong> diversion <strong>of</strong><br />
credit from agriculture and industry <strong>to</strong> <strong>the</strong> property market.<br />
Building Human Capital<br />
If <strong>the</strong>re is a resource curse, it seems <strong>to</strong> affect certain types <strong>of</strong> countries more than<br />
o<strong>the</strong>rs. Bravo-Ortega and de Gregorio (2007) find that <strong>the</strong> larger <strong>the</strong> s<strong>to</strong>ck <strong>of</strong><br />
human capital, <strong>the</strong> more positive <strong>the</strong> marginal effect <strong>of</strong> natural resource abundance<br />
on growth. Lederman and Maloney (2007) echo this message, noting that<br />
rich countries that have successfully used <strong>the</strong>ir natural resources <strong>to</strong> fur<strong>the</strong>r development<br />
outcomes, such as Australia and Norway, have done so on <strong>the</strong> basis <strong>of</strong><br />
high and growing levels <strong>of</strong> human capital.<br />
Studies also provide strong evidence <strong>of</strong> <strong>the</strong> importance <strong>of</strong> human capital for<br />
<strong>the</strong> structure <strong>of</strong> exports. In <strong>the</strong>ir classic study, Maier and Wood (1998) distinguish<br />
regions on <strong>the</strong> basis <strong>of</strong> two ratios: skills per head and land (a proxy for<br />
resources) per head. As population increases, <strong>the</strong> ratio <strong>of</strong> land/head declines over<br />
time; as countries invest in human capital <strong>the</strong> skills/head ratio increases. Sub-<br />
Saharan Africa ranks highest on land abundance and lowest on skills. In <strong>the</strong>se<br />
dimensions, it resembles most closely Latin America some 30 years earlier. Asian<br />
economies are relatively skills-abundant and <strong>the</strong>ir endowment in this area has<br />
been growing.<br />
Maier and Wood show that <strong>the</strong>re is a close relationship, both across regions<br />
and over time, between fac<strong>to</strong>r ratios and export composition. Regions with high<br />
ratios <strong>of</strong> land <strong>to</strong> skills tend <strong>to</strong> specialize in primary products. As <strong>the</strong> land <strong>to</strong> skills<br />
ratio falls, <strong>the</strong> export mix shifts, first <strong>to</strong>ward processed primary products, <strong>the</strong>n <strong>to</strong><br />
16 One <strong>of</strong> several options discussed by Frankel (2009) is <strong>to</strong> peg <strong>the</strong> currency <strong>to</strong> <strong>the</strong> price <strong>of</strong> <strong>the</strong> leading<br />
export, so accommodating <strong>to</strong> terms <strong>of</strong> trade shocks. The downside is that it destabilizes <strong>the</strong> localcurrency<br />
prices <strong>of</strong> o<strong>the</strong>r traded goods, a particularly problematical outcome from <strong>the</strong> perspective <strong>of</strong><br />
diversification. For more discussion see Sinnott, Nash, and de la Torre (2010); also Frankel in this<br />
volume.<br />
17 These could include cycle-adjusted capital requirement ratios, loan-loss provision ratios, and lending-<strong>to</strong>-asset-value<br />
ratios <strong>to</strong> discourage speculation in markets where a potential bubble is forming.<br />
©International Monetary Fund. Not for Redistribution
66 Economic Diversifi cation in Resource-Rich Countries<br />
simple manufactures, and <strong>the</strong>n <strong>to</strong>wards more complex and technologically<br />
demanding manufactures. Their study suggests that countries that fail <strong>to</strong> invest<br />
heavily in <strong>the</strong>ir human capital will find it difficult <strong>to</strong> move away from primary<br />
dependence and <strong>to</strong>ward more sophisticated products. 18 It is also no accident that<br />
countries like Finland and Korea, both known for <strong>the</strong>ir spectacular evolution<br />
from primary-based economies <strong>to</strong> exporters <strong>of</strong> hi-tech manufactures over <strong>the</strong><br />
space <strong>of</strong> a few decades, also routinely score at <strong>the</strong> <strong>to</strong>p in international comparisons<br />
<strong>of</strong> <strong>the</strong> quality <strong>of</strong> education. 19 Except for Norway, no countries specialized in<br />
resources score near <strong>the</strong>se high levels; most lag in human capital relative <strong>to</strong> <strong>the</strong>ir<br />
income level. Sustained attention <strong>to</strong> quality education on a broad basis <strong>to</strong> close<br />
<strong>the</strong> gap must be a key component <strong>of</strong> diversification policy.<br />
Institutions and Governance<br />
A substantial body <strong>of</strong> literature suggests that differences in <strong>the</strong> quality <strong>of</strong> institutions<br />
are at <strong>the</strong> root <strong>of</strong> <strong>the</strong> diverging growth paths <strong>of</strong> successful and less successful<br />
resource rich countries. For example Mehlum and o<strong>the</strong>rs (2006) find that <strong>the</strong><br />
quality <strong>of</strong> institutions is critical in determining whe<strong>the</strong>r countries avoid <strong>the</strong><br />
resource curse. <strong>Natural</strong> resources are only found <strong>to</strong> have a negative impact on<br />
growth performance among countries with inferior institutions.<br />
What kinds <strong>of</strong> institutions are important? Collier (2007) suggests that <strong>the</strong> issue<br />
is not simply whe<strong>the</strong>r countries are democratic. Without effective checks and balances<br />
on power, competition for natural resource rents can make democracies<br />
malfunction. Unlike normal taxation, competition for rents does not invite public<br />
scrutiny and political accountability, and <strong>the</strong>refore encourage <strong>the</strong> emergence <strong>of</strong><br />
patronage politics. Eifert, Gelb, and Tallroth (2003) distinguish “factional” democracies<br />
from “mature” democracies, and argue that highly personalized politics and<br />
rent-seeking in <strong>the</strong> former cases result in short-horizon, patronage-driven elec<strong>to</strong>ral<br />
competition and nontransparent allocation <strong>of</strong> rents. In extreme cases, competition<br />
may evolve in<strong>to</strong> open conflict. Some au<strong>to</strong>cracies have managed natural rent well;<br />
<strong>the</strong> risk, as seen in <strong>the</strong> case <strong>of</strong> <strong>the</strong> Suhar<strong>to</strong> regime in Indonesia, is that in <strong>the</strong> long<br />
run <strong>the</strong>y become entrenched and corrupted by resource wealth.<br />
How does <strong>the</strong> quality <strong>of</strong> institutions affect <strong>the</strong> potential for diversification? The<br />
extensive debate on how <strong>to</strong> measure institutions and whe<strong>the</strong>r resources undermine<br />
<strong>the</strong>m is beyond <strong>the</strong> scope <strong>of</strong> this chapter. However, recent research on long-term<br />
growth has increasingly emphasized <strong>the</strong> importance <strong>of</strong> institutions (Acemoglu,<br />
Johnson, and Robinson, 2003). There is a strong and systematic relationship<br />
18 On <strong>the</strong> basis <strong>of</strong> this analysis, it is not surprising that export diversification in African countries has<br />
largely involved broadening <strong>the</strong> range <strong>of</strong> resource-based products and services (including <strong>to</strong>urism) and<br />
moving up <strong>the</strong> processing chain, ra<strong>the</strong>r than a shift <strong>to</strong> manufactures. For more discussion <strong>of</strong> East Asia,<br />
including <strong>the</strong> very important role played by <strong>the</strong> accumulation <strong>of</strong> human capital, see Noland and Pack<br />
(2003).<br />
19 In recent PISA assessments <strong>of</strong> reading (2000), ma<strong>the</strong>matics (2003), and science (2006), Finland and<br />
Korea ranked, respectively: 1 and 5; 1 and 2; and 1 and 7 out <strong>of</strong> 27, 29, and 35 countries, respectively.<br />
They also rank high in TIMSS scores, and rank at numbers 7 and 2 in <strong>the</strong> Global Innovation Index.<br />
©International Monetary Fund. Not for Redistribution
Gelb 67<br />
between a variety <strong>of</strong> measures <strong>of</strong> institutions and level <strong>of</strong> income per head, particularly<br />
for countries not especially rich in natural resources. Institutional quality<br />
<strong>the</strong>refore appears <strong>to</strong> have a close relationship with <strong>the</strong> potential <strong>of</strong> an economy <strong>to</strong><br />
deliver high incomes by functioning at a high level <strong>of</strong> productivity. This means that,<br />
whatever <strong>the</strong> exact causality, institutional strength is important in relation <strong>to</strong> potential<br />
economic structure. Manufacturing industry, for example, is more transactionsintensive<br />
than subsistence agriculture or <strong>of</strong>f-shore oil rigs. It is more dependent on<br />
strong contract enforcement, a rule <strong>of</strong> law, and a generally strong business environment.<br />
In extreme cases <strong>of</strong> institutional breakdown, economies are likely <strong>to</strong> retreat<br />
back in<strong>to</strong> subsistence farming and enclave mineral production.<br />
Resource economies with strong institutions will <strong>the</strong>refore have a wider range<br />
<strong>of</strong> potential options for diversification than those where institutions are weak.<br />
Unfortunately, most resource exporters have weak institutions, as measured across<br />
a number <strong>of</strong> dimensions, at least relative <strong>to</strong> <strong>the</strong>ir levels <strong>of</strong> income. Using one set<br />
<strong>of</strong> institutional indica<strong>to</strong>rs, <strong>the</strong> Worldwide Governance Indica<strong>to</strong>rs, oil-exporting<br />
countries, on average, have an institutional score corresponding <strong>to</strong> that <strong>of</strong> far<br />
poorer non-oil economies. In some cases, <strong>the</strong>ir institutional scores are those<br />
<strong>of</strong> nonresource countries with income levels little over one quarter <strong>of</strong> <strong>the</strong>ir own.<br />
The result is not dependent on one particular region. In Gelb and Turner (2008),<br />
nine African oil exporters with average GDP per capita <strong>of</strong> US$979 (at market<br />
exchange rates) scored on average in <strong>the</strong> lowest decile on governance indica<strong>to</strong>rs.<br />
In contrast, a set <strong>of</strong> 11 low-income non-oil African countries, with average GDP<br />
per capita <strong>of</strong> only US$300, that had grown relatively rapidly over <strong>the</strong> previous<br />
decade scored around three deciles higher. Some clusters <strong>of</strong> countries show more<br />
strength in certain classes <strong>of</strong> institutions. The GCC countries, for example, tend<br />
<strong>to</strong> score better on measures reflecting <strong>the</strong> capacity <strong>of</strong> <strong>the</strong> state and <strong>the</strong> ability <strong>to</strong><br />
sustain a good regula<strong>to</strong>ry environment. Latin American oil producers, in contrast,<br />
tend <strong>to</strong> score better on measures <strong>of</strong> political participation and weaker on regula<strong>to</strong>ry<br />
policy.<br />
Oil, it could be argued, is not integrated in<strong>to</strong> <strong>the</strong> rest <strong>of</strong> <strong>the</strong> economy in <strong>the</strong><br />
first place, so it is unreasonable <strong>to</strong> benchmark governance estimates <strong>to</strong> <strong>the</strong> level<br />
<strong>of</strong> income per capita including oil. Some “governance discount” might reasonably<br />
have been expected. However, if levels <strong>of</strong> governance and institutions are taken as<br />
indica<strong>to</strong>rs <strong>of</strong> <strong>the</strong> potential productivity <strong>of</strong> <strong>the</strong> non-oil economy (as seems <strong>to</strong> be<br />
<strong>the</strong> case for nonresource economies in general), <strong>the</strong> magnitude <strong>of</strong> <strong>the</strong> discount<br />
suggests <strong>the</strong> gulf between actual incomes and <strong>the</strong> baseline level <strong>of</strong> productivity in<br />
<strong>the</strong> nonresource sec<strong>to</strong>rs. <strong>Policies</strong> <strong>to</strong> reduce this institutional gulf, whe<strong>the</strong>r by<br />
determined actions <strong>to</strong> improve <strong>the</strong> functioning <strong>of</strong> <strong>the</strong> state and its economy-wide<br />
service delivery, or <strong>to</strong> carve out a special development zone for <strong>the</strong> purpose, are<br />
<strong>the</strong>refore <strong>of</strong> <strong>the</strong> utmost importance for diversification policy.<br />
<strong>Natural</strong> resource wealth opens up windows <strong>of</strong> opportunity for such policies.<br />
The question is whe<strong>the</strong>r resource exporters choose <strong>to</strong> take advantage <strong>of</strong> <strong>the</strong>m.<br />
Botswana has partly invested its diamond income in creating (and paying for) an<br />
efficient bureaucracy. The country is perhaps <strong>the</strong> most striking case <strong>of</strong> an initially<br />
poor mineral exporter with strong initial institutions. Acemoglu, Johnson, and<br />
©International Monetary Fund. Not for Redistribution
68 Economic Diversifi cation in Resource-Rich Countries<br />
Robinson (2003) suggest that <strong>the</strong> foundation was laid before <strong>the</strong> discovery <strong>of</strong> diamonds.<br />
Its inclusive traditional institutions placed constraints on political elites,<br />
and <strong>the</strong>re was minimal disruption <strong>to</strong> <strong>the</strong>se traditions by colonial rule. Particularly<br />
noteworthy was Seretse Khama’s initiative in assigning sub-soil mining rights away<br />
from <strong>the</strong> tribes and <strong>to</strong>ward <strong>the</strong> state, in this way heading <strong>of</strong>f tribal contestation for<br />
revenue. Botswana used its diamond income well <strong>to</strong> fur<strong>the</strong>r streng<strong>the</strong>n institutions<br />
and capacity. It remunerated civil servants adequately and employed a corps <strong>of</strong><br />
foreign advisors <strong>to</strong> work alongside domestic <strong>of</strong>ficials, ra<strong>the</strong>r than rapidly indigenizing<br />
<strong>the</strong> civil service and lowering its quality. More recently, <strong>the</strong> government sought<br />
and obtained a sovereign debt rating even though Botswana had no immediate need<br />
<strong>to</strong> borrow. The rating was seen as a commitment device, <strong>to</strong> alert citizens by signaling<br />
potential policy slippage by future governments.<br />
In contrast, Equa<strong>to</strong>rial Guinea has been cited as an extreme case where oil<br />
rents sustain a pathology <strong>of</strong> authoritarian rule, instability, and underdevelopment,<br />
from which it is difficult <strong>to</strong> exit. McSharry (2006) analyzes <strong>the</strong> political economy<br />
<strong>of</strong> oil in Equa<strong>to</strong>rial Guinea, suggesting that <strong>the</strong> extraordinary weakness <strong>of</strong> government<br />
institutions and <strong>the</strong> dearth <strong>of</strong> social programs make it less likely that <strong>the</strong><br />
government will be able <strong>to</strong> buy <strong>the</strong> acquiescence <strong>of</strong> <strong>the</strong> population in <strong>the</strong> same<br />
way as, for example, Kuwait or Saudi Arabia.<br />
Ano<strong>the</strong>r example is tax administration. Oil-exporting countries typically raise<br />
lower non-oil tax revenues than o<strong>the</strong>r countries; <strong>the</strong> lower tax yield represents <strong>the</strong><br />
equivalent <strong>of</strong> about one fifth <strong>of</strong> oil revenues (Gelb and Grasmann, 2010). It may<br />
be reasonable <strong>to</strong> substitute some heavily dis<strong>to</strong>rting taxes by resource taxes, and<br />
a low-tax regime could also be a component <strong>of</strong> diversification policy. Freed from<br />
immediate revenue pressure, countries could streamline taxes, lower rates and<br />
broaden bases, abolish nuisance taxes, and improve tax administration. In some<br />
cases this has been done (see discussion <strong>of</strong> Dubai below), but all <strong>to</strong>o <strong>of</strong>ten it has<br />
not. Knack (2008) finds that <strong>the</strong> quality <strong>of</strong> non-oil tax administration (as measured<br />
by <strong>the</strong> World Bank’s Country Policy and Institutional Assessments) is actually<br />
lower in oil exporting countries than in o<strong>the</strong>rs.<br />
“Vertical” <strong>Policies</strong> and Effective Public Spending<br />
Diversification will also be affected by how governments choose <strong>to</strong> spend<br />
resource rents. Any spending with a domestic component will tend <strong>to</strong> draw<br />
resources <strong>to</strong> <strong>the</strong> nontraded sec<strong>to</strong>rs, appreciate <strong>the</strong> real exchange rate and<br />
weaken <strong>the</strong> nonresource traded sec<strong>to</strong>rs. This effect can be at least partly <strong>of</strong>fset<br />
by spending (or tax relief) that reduces production costs in <strong>the</strong>se sec<strong>to</strong>rs, raises<br />
<strong>the</strong>ir efficiency, and encourages <strong>the</strong> entry <strong>of</strong> inves<strong>to</strong>rs with new capabilities and<br />
knowledge. Well-designed and implemented investments in infrastructure,<br />
human capital, or improving institutions can have this effect, even if applied in<br />
a sec<strong>to</strong>r-neutral way.<br />
Never<strong>the</strong>less, some level <strong>of</strong> vertical policy and spending that targets nonresource<br />
traded sec<strong>to</strong>rs on a broader or more focused basis is probably inevitable in resourcerich<br />
countries. It is very difficult <strong>to</strong> promote all such sec<strong>to</strong>rs at <strong>the</strong> same time against<br />
©International Monetary Fund. Not for Redistribution
Gelb 69<br />
<strong>the</strong> pull <strong>to</strong>ward nontraded sec<strong>to</strong>rs that results from increased domestic demand<br />
fuelled by public spending funded by resource taxes. 20 Given that diversification is<br />
a national priority, vertical policies can be seen as efforts <strong>to</strong> compensate for market<br />
incentives dis<strong>to</strong>rted by <strong>the</strong> spending <strong>of</strong> resource rents. Governments also have<br />
greater possibilities for financing such measures, whe<strong>the</strong>r tailored infrastructure, tax<br />
rebates, investment incentives, or o<strong>the</strong>r inducements <strong>to</strong> invest.<br />
However, vertical policies involve several risks. One is serious dis<strong>to</strong>rtion <strong>of</strong><br />
market incentives, in particular <strong>to</strong>ward import-substitution. It is no accident that<br />
<strong>the</strong> more successful countries, discussed below, placed a heavy weight on exporting.<br />
Ano<strong>the</strong>r risk is “lock-in” <strong>to</strong> <strong>the</strong> interests <strong>of</strong> an established rent-seeking elite<br />
seeking <strong>to</strong> benefit from incentives ra<strong>the</strong>r than using incentives <strong>to</strong> encourage competitive<br />
investment, <strong>of</strong>ten by new players. A third risk is that <strong>of</strong> diverting <strong>the</strong><br />
attention <strong>of</strong> policymakers away from critical economy-wide impediments <strong>to</strong><br />
diversification and growth. It is <strong>of</strong>ten politically easier <strong>to</strong> introduce some new<br />
program ra<strong>the</strong>r than address long-standing obstacles <strong>to</strong> business and <strong>the</strong> vested<br />
interests behind <strong>the</strong>m. The fourth risk, <strong>of</strong> holding on <strong>to</strong> failing policies, is especially<br />
high for resource-rich countries because <strong>the</strong>re is not <strong>the</strong> same fiscal pressure<br />
<strong>to</strong> change <strong>the</strong>m. In his evaluation <strong>of</strong> industrial policy, Richard Auty notes:<br />
[A] favorable resource endowment may be squandered through <strong>the</strong> pursuit <strong>of</strong><br />
less prudent policies than would be practical in a resource-constrained country<br />
… There are two important consequences … first, economic damage cumulates<br />
… second, political groups become entrenched which have a vested interest.<br />
(Auty, 1994, p. 7)<br />
Spending alone, even if it is intended <strong>to</strong> support diversification, is not enough.<br />
Unless it is effective, it will only make diversification more difficult by increasing<br />
domestic demand.<br />
THE EXAMPLES OF MALAYSIA, INDONESIA, CHILE,<br />
AND DUBAI<br />
Although <strong>the</strong>re are not many examples <strong>of</strong> developing countries that have built<br />
diversified economies from initial conditions <strong>of</strong> strong concentration in <strong>the</strong> mineral<br />
sec<strong>to</strong>rs, <strong>the</strong>re are some notable examples <strong>of</strong> policy effort and relative success.<br />
Coxhead (2007) studied <strong>the</strong> long-term experience <strong>of</strong> countries with rich initial<br />
endowments <strong>of</strong> natural resources. He identified five such countries with strong<br />
long-term growth: Malaysia, Thailand, Chile, Indonesia, and Sri Lanka. All have<br />
diversified <strong>to</strong>ward manufactures or, as in Chile, widened <strong>the</strong>ir range <strong>of</strong> resourcebased<br />
exports <strong>to</strong> include new and more sophisticated products. The experience <strong>of</strong><br />
such countries is <strong>the</strong>refore <strong>of</strong> special interest, especially <strong>the</strong> three with substantial<br />
mineral resources.<br />
20 In a simple general equilibrium model it is only possible <strong>to</strong> expand all traded sec<strong>to</strong>rs if government cuts<br />
back on its purchases <strong>of</strong> nontraded goods and services. This is not a likely response <strong>to</strong> resource wealth.<br />
©International Monetary Fund. Not for Redistribution
70 Economic Diversifi cation in Resource-Rich Countries<br />
Malaysia was fortunate in its ra<strong>the</strong>r diversified resource endowment, which<br />
included good geographic location and deepwater ports, rubber and tin, as well<br />
as forest products, which preceded oil as export staples. Even in 2010, resourcebased<br />
products represented 42 percent <strong>of</strong> manufacturing value added. 21 It sustained<br />
a high and relatively stable savings rate, and it made massive investments<br />
in land development and replanting schemes <strong>to</strong> expand and modernize <strong>the</strong> production<br />
<strong>of</strong> rubber and palm oil. It also made heavy investments in technology and<br />
infrastructure, especially in <strong>the</strong> areas <strong>of</strong> energy, communications, and transport.<br />
Although Malaysia did start out on a protectionist path in <strong>the</strong> 1960s, in 1973–74<br />
it shifted <strong>to</strong> an extensive export promotion drive based on cheap manufactures.<br />
Measures <strong>to</strong> hold down costs included policies <strong>to</strong> reduce <strong>the</strong> costs <strong>of</strong> labor and<br />
manage industrial relations. 22 In <strong>the</strong> mid-1980s, strategy shifted <strong>to</strong>ward highertechnology<br />
products and skills upgrading. <strong>Policies</strong> included liberalizing skilled<br />
immigration, a dramatic expansion in enrolment in polytechnics, exchange relations<br />
with universities in Australia and Canada, and skills development programs<br />
jointly sponsored by <strong>the</strong> Federation <strong>of</strong> Manufacturing and <strong>the</strong> University <strong>of</strong><br />
Science and Technology.<br />
Macroeconomic policy in Malaysia also aimed at cost containment. Trade<br />
policy moved steadily <strong>to</strong>ward a relatively open trade regime. Devaluations depreciated<br />
<strong>the</strong> real exchange rate (by 22 percent from 1980 <strong>to</strong> 1992) <strong>to</strong> maintain<br />
incentives. Investments and targeted support were provided through a variety<br />
<strong>of</strong> programs, including free zones, export financing facilities, assistance with<br />
research, and product development and marketing, all aimed at reducing production<br />
costs and increasing competitiveness. While exporting was never stressed as<br />
strongly as a condition for support as in Korea, export performance was an<br />
important goal <strong>of</strong> diversification efforts.<br />
Indonesia shows <strong>the</strong> importance <strong>of</strong> using active policies <strong>to</strong> encourage<br />
agriculture in <strong>the</strong> face <strong>of</strong> a booming oil sec<strong>to</strong>r and so bringing down domestic<br />
costs <strong>to</strong> fur<strong>the</strong>r encourage diversifying exports. Good luck played a part<br />
in this success, which would not have been possible without <strong>the</strong> development<br />
<strong>of</strong> disease-resistant and high-yield rice varieties. But <strong>the</strong>ir diffusion in<br />
turn would not have been possible without <strong>the</strong> unusually broad-based<br />
development policies followed by <strong>the</strong> government. These included very<br />
large investments <strong>of</strong> oil income <strong>to</strong> develop natural gas resources, both for<br />
export <strong>to</strong> Japan and as an input <strong>to</strong> fertilizer production. Fertilizer was <strong>the</strong>n<br />
distributed at subsidized prices, greatly boosting yields. Agriculture and <strong>the</strong><br />
rural economy were fur<strong>the</strong>r streng<strong>the</strong>ned by a series <strong>of</strong> successful community-based<br />
programs that absorbed large quantities <strong>of</strong> labor and produced<br />
21 Electronics represented a fur<strong>the</strong>r 30 percent.<br />
22 For example, minimum-wage legislation was not enacted for export industries, only in-house unions<br />
were permitted, and less than 10 percent <strong>of</strong> workers in <strong>the</strong> electronics industries (78 percent <strong>of</strong> whom<br />
were female) were unionized. For more discussion see Kuruvilla (1996).<br />
©International Monetary Fund. Not for Redistribution
Gelb 71<br />
local infrastructure, including schools, roads and o<strong>the</strong>r local construction. 23<br />
Infrastructure, particularly in <strong>the</strong> rural areas absorbed one quarter <strong>of</strong> public<br />
investment during <strong>the</strong> oil boom (Auty, 1994).<br />
With a strong agriculture able <strong>to</strong> feed a growing industrial workforce relatively<br />
cheaply, Indonesia moved <strong>to</strong>ward low-wage manufacturing and an expor<strong>to</strong>riented<br />
strategy in <strong>the</strong> early 1980s. 24 Measures were taken <strong>to</strong> prevent <strong>the</strong> real<br />
exchange rate from moving <strong>to</strong>o far out <strong>of</strong> line. These included cautious management<br />
<strong>of</strong> public spending in <strong>the</strong> boom years 1974–81. Fiscal surpluses and reserves<br />
were accumulated despite <strong>the</strong> fact that <strong>of</strong>ficial policy called for a balanced budget.<br />
Government was also ready <strong>to</strong> rapidly restructure public spending and scale back<br />
planned projects when oil prices began <strong>to</strong> fall. The exchange rate policy aimed at<br />
limiting real exchange rate appreciation, and <strong>the</strong> policy package included major<br />
devaluations on <strong>the</strong> downside <strong>of</strong> <strong>the</strong> oil price cycle in 1983 and 1986 (in <strong>the</strong> latter<br />
case by 60 percent), and fur<strong>the</strong>r steps <strong>to</strong> ensure that it did not appreciate<br />
<strong>the</strong>reafter. Trade policy was progressively liberalized after 1985, and exporters<br />
were able <strong>to</strong> access imported inputs at world prices. Foreign direct investment<br />
(FDI) was liberalized, especially in<strong>to</strong> exporting sec<strong>to</strong>rs. By 2005 manufactures<br />
represented 47 percent <strong>of</strong> merchandise exports.<br />
Unlike Malaysia and Indonesia, Chile has not evolved in<strong>to</strong> a major industrial<br />
exporter. But it has developed in<strong>to</strong> a dynamic and more diversified commodity<br />
exporter, with an emphasis on high-value primary-based products that draw on<br />
its diversified resource base. One key element has been its successful implementation<br />
<strong>of</strong> countercyclical fiscal policy, stabilizing <strong>the</strong> economy by high savings during<br />
<strong>the</strong> copper boom years and dis-saving when prices began <strong>to</strong> fall. Chile also<br />
focused on improving <strong>the</strong> business climate, <strong>to</strong> become <strong>the</strong> highest rated Latin<br />
American country on <strong>the</strong> World Bank’s “Doing Business” indica<strong>to</strong>rs. 25<br />
In addition, Chile <strong>of</strong>fers several successful examples <strong>of</strong> active vertical public<br />
roles in helping <strong>to</strong> develop <strong>the</strong> salmon and wine industries. These include encouraging<br />
technical development and adaptation, disseminating information on standards,<br />
providing infrastructure and information, and coordinating numerous<br />
small producers (Benavente, 2006; and Katz, 2006). Both <strong>of</strong> <strong>the</strong>se industries<br />
involved developing long-term public-private partnerships such as those involving<br />
CORFO (Production Development Corporation) and Fundación Chile <strong>to</strong> help<br />
producers achieve critical mass and capabilities. Chile has also established a<br />
Competitiveness and Innovation Fund in 2005, financing this through a levy on<br />
mining, and developed sec<strong>to</strong>r clusters with private sec<strong>to</strong>r participation and partial<br />
23 The community-based government programs, known as INPRES, were intended <strong>to</strong> generate balanced<br />
regional development in Indonesia. The acronym refers <strong>to</strong> “presidential instruction.”<br />
24 Auty (1995) notes that both Indonesia and Malaysia made <strong>the</strong> errors <strong>of</strong> promoting inefficient industries<br />
during <strong>the</strong> oil boom period. However, concern <strong>to</strong> maintain sound macroeconomic management<br />
and contain losses limited <strong>the</strong> effects.<br />
25 Chile’s ranking on “Doing Business” was 40 out <strong>of</strong> 181 countries in 2009. The 2009 rankings for<br />
<strong>the</strong> o<strong>the</strong>r countries discussed in this section are: Malaysia 20, Botswana 38, UAE 46, Indonesia 129,<br />
and Algeria 132. The average ranking for nine oil exporters in SSA is 161. The average ranking for<br />
<strong>the</strong> 11 non-oil low-income fast-growing African countries noted in Gelb and Turner (2008) is 138.<br />
©International Monetary Fund. Not for Redistribution
72 Economic Diversifi cation in Resource-Rich Countries<br />
funding. Some 50 centers <strong>of</strong> excellence are in operation, <strong>the</strong> majority university<br />
based, and all competing for funding. Chile also sponsors investment in high-level<br />
human capital by funding scholarships for study abroad (Sinnott, Nash, and de la<br />
Torre, 2010).<br />
Finally, we consider <strong>the</strong> Dubai model. Dubai aims <strong>to</strong> attract investment (with risk<br />
implicitly underwritten by recourse <strong>to</strong> <strong>the</strong> oil riches <strong>of</strong> <strong>the</strong> United Arab Emirates 26 ) <strong>to</strong><br />
invest in infrastructure, real property, and a range <strong>of</strong> services, as well as establishing a<br />
free zone <strong>to</strong> fur<strong>the</strong>r build export capacity. Dubai is sui generis, especially its dependence<br />
on expatriate labor and skills: nationals constitute only 10 percent <strong>of</strong> <strong>the</strong> population.<br />
But it <strong>of</strong>fers some lessons for o<strong>the</strong>r countries considering diversifying <strong>the</strong>ir<br />
economies through a massive free zone or similar policy.<br />
Dubai’s vision was not simply based on “build it and <strong>the</strong>y will come.” It was also<br />
based on providing incentives <strong>to</strong> attract foreign direct investments and major<br />
multinational companies. These incentives included an efficient bureaucracy with little<br />
corruption; a regime <strong>of</strong> no taxes and low tariffs that proved extremely attractive <strong>to</strong><br />
companies and expatriates; a free-market economy with low restrictions on movement<br />
<strong>of</strong> funds and transactions; high-tech state-<strong>of</strong>-<strong>the</strong>-art infrastructure <strong>to</strong> sustain an<br />
electronic-based system and e-government; public support, direct or indirect, <strong>to</strong> all<br />
major projects; easy and quick processes <strong>to</strong> issue visas <strong>to</strong> businessmen and visi<strong>to</strong>rs;<br />
allowing foreigners <strong>to</strong> own property in free zone areas; and investing heavily in security.<br />
Very open trade and labor policy, a very low tax regime, and an exchange rate pegged <strong>to</strong><br />
<strong>the</strong> dollar have made Dubai a relatively stable and low-cost base for business.<br />
Dubai aims <strong>to</strong> create a new asset, a critical mass <strong>of</strong> world-class infrastructure,<br />
services and business, able <strong>to</strong> serve as a transport and logistics hub and <strong>to</strong> reap<br />
sufficient agglomeration and “network” externalities <strong>to</strong> be self-sustaining. To <strong>the</strong><br />
extent that it succeeds, it will have diversified <strong>the</strong> local economy, essentially by<br />
creating a new one. At <strong>the</strong> same time, Dubai nationals will still enjoy rent-based<br />
income, mostly from land and property rents and statu<strong>to</strong>ry participation in businesses<br />
usually run by expatriates. Little <strong>of</strong> <strong>the</strong> benefit <strong>to</strong> nationals comes through<br />
“normal” employment secured on competitive labor markets. 27<br />
Whe<strong>the</strong>r Dubai is able <strong>to</strong> succeed and, if so, at what cost <strong>to</strong> <strong>the</strong> oil wealth <strong>of</strong><br />
<strong>the</strong> UAE, will have <strong>to</strong> be seen as events unfold following <strong>the</strong> bursting <strong>of</strong> <strong>the</strong><br />
country’s property bubble in November 2009. Its experience confirms that <strong>the</strong><br />
boom-slump model can be very costly. In 2007 it was estimated that since 2004<br />
<strong>the</strong> six GCC countries had produced oil worth about US$2 trillion at spot prices,<br />
26While <strong>the</strong> debts <strong>of</strong> Dubai World may not have been formally guaranteed by <strong>the</strong> government, Abu<br />
Dhabi has provided assistance <strong>to</strong> restructure its debt.<br />
27<br />
Data from <strong>the</strong> 2005 International Comparison Project show that <strong>the</strong> GCC countries have domestic<br />
price levels at least 30% lower than those for countries at comparable levels <strong>of</strong> income per head.<br />
Because most <strong>of</strong> <strong>the</strong> “fixed fac<strong>to</strong>rs” usually assumed <strong>to</strong> constrain <strong>the</strong> nontraded good sec<strong>to</strong>rs are<br />
importable in <strong>the</strong> GCC countries (especially labor), Dutch disease is manifested less by high prices<br />
and an appreciated real exchange rate and more by <strong>the</strong> limited employability <strong>of</strong> high-cost nationals on<br />
a competitive basis in <strong>the</strong> private sec<strong>to</strong>r. Businesses in Dubai are required <strong>to</strong> take on local partners but<br />
not those in <strong>the</strong> Free Zone. The benefit <strong>the</strong> latter <strong>of</strong>fer <strong>to</strong> Dubai is largely in <strong>the</strong> form <strong>of</strong> contributing<br />
<strong>to</strong> agglomeration externalities and through demand for real estate and transport and logistics services.<br />
©International Monetary Fund. Not for Redistribution
Gelb 73<br />
and that more than US$1 trillion had been invested in domestic infrastructure<br />
and real estate (Janardhan, 2007). Urban real estate prices rose spectacularly after<br />
2004, from an index <strong>of</strong> 100 <strong>to</strong> almost 320, before plunging back <strong>to</strong> 130 by mid-<br />
2009—a spectacular cycle even by <strong>the</strong> standards <strong>of</strong> o<strong>the</strong>r concurrent property<br />
booms. 28 It is not yet clear how <strong>the</strong> massive losses will be apportioned, but it is<br />
clear that at least a part is being paid out <strong>of</strong> <strong>the</strong> financial assets <strong>of</strong> Abu Dhabi.<br />
Meanwhile, many properties stand vacant, prices have slipped fur<strong>the</strong>r, sometimes<br />
<strong>to</strong> as little as a fifth <strong>of</strong> previous levels, and Dubai faces high-risk spreads on its<br />
outstanding obligations.<br />
Do such examples have lessons for o<strong>the</strong>r resource-rich countries? Clearly,<br />
<strong>the</strong> potential for diversification is affected by many fac<strong>to</strong>rs, including <strong>the</strong><br />
resource base, <strong>the</strong> capacities <strong>of</strong> <strong>the</strong> population, and <strong>the</strong> quality <strong>of</strong> economic<br />
management. Malaysia and Chile have rich and varied resource bases;<br />
Indonesia has an abundant, low-cost labor supply as well as good location.<br />
One common <strong>the</strong>me running through <strong>the</strong> cases is <strong>the</strong> importance <strong>of</strong> avoiding<br />
wild swings in <strong>the</strong> real exchange rate and periods <strong>of</strong> high overvaluation.<br />
Ano<strong>the</strong>r is <strong>the</strong> need <strong>to</strong> reduce costs for <strong>the</strong> nonresource sec<strong>to</strong>rs, whe<strong>the</strong>r<br />
through macroeconomic management and exchange rate policy, trade policy,<br />
well-focused public investments, or o<strong>the</strong>r measures. Yet ano<strong>the</strong>r is <strong>the</strong> efforts<br />
<strong>to</strong> supplement market incentives in various ways <strong>to</strong> encourage diversification,<br />
while not trying <strong>to</strong> replace <strong>the</strong>m.<br />
A fur<strong>the</strong>r <strong>the</strong>me is <strong>the</strong> importance <strong>of</strong> openness <strong>to</strong> foreign inves<strong>to</strong>rs, new skills,<br />
and new markets. Entry and a focus on exporting have been vital points <strong>of</strong> policy<br />
emphasis for all <strong>of</strong> <strong>the</strong> countries. 29 A contrasting picture emerges from analyses <strong>of</strong><br />
countries in <strong>the</strong> Middle East and North Africa, many <strong>of</strong> which are heavily dependent<br />
on hydrocarbons. Analyzing <strong>the</strong> disappointing diversification <strong>of</strong> that region,<br />
Gourdon (2010) notes that <strong>the</strong> contribution from <strong>the</strong> introduction <strong>of</strong> new products<br />
has been small, and that what modest diversification has taken place has been<br />
due <strong>to</strong> <strong>the</strong> diversification <strong>of</strong> existing products. In contrast, new products have<br />
played a major role in <strong>the</strong> diversification <strong>of</strong> many countries outside <strong>the</strong> region.<br />
Nabli and o<strong>the</strong>rs 2008 explain <strong>the</strong> persistence in <strong>the</strong> region <strong>of</strong> vertical industrial<br />
policies that favor well-entrenched groups. This is due <strong>to</strong> <strong>the</strong> weakness <strong>of</strong> interest<br />
groups that might lobby for more outward-oriented horizontal policies relative <strong>to</strong><br />
privileged networks that seek <strong>to</strong> maintain <strong>the</strong>ir access <strong>to</strong> rents. These <strong>the</strong>mes resonate<br />
with <strong>the</strong> analysis <strong>of</strong> Algeria by Hausmann, Klinger, and Lopez-Calix (2010).<br />
They reject <strong>the</strong> conventional Dutch disease explanations for oil dependence,<br />
namely an appreciated real exchange rate and high macroeconomic volatility.<br />
Instead, <strong>the</strong>y note a poor business climate, including a lack <strong>of</strong> clear, predictable,<br />
and enforced rules <strong>of</strong> <strong>the</strong> game for market activity, and <strong>the</strong> combination <strong>of</strong> a<br />
28 IMF Article IV Consultation, February 2010.<br />
29 Not all elements <strong>of</strong> such a package have been followed by all rapidly diversifying countries. Korea,<br />
for example, restricted FDI in favor <strong>of</strong> acquiring technology by licensing and a very strong focus on<br />
building domestic capacity. Such a policy will be far more difficult for a country lacking Korea’s strong<br />
education system.<br />
©International Monetary Fund. Not for Redistribution
74 Economic Diversifi cation in Resource-Rich Countries<br />
highly protected internal market and competition for oil rents, which dulls incentives<br />
for private-sec<strong>to</strong>r investments in new export activities. 30<br />
Even with good policies, some resource exporters will find it very difficult <strong>to</strong><br />
diversify. Botswana, for example, scores high in many dimensions <strong>of</strong> economic<br />
management and governance and has managed its diamond wealth in an exemplary<br />
manner. But it faces particular constraints that make competitive<br />
diversification difficult <strong>to</strong> achieve. Unlike Dubai, Botswana does not benefit from<br />
location; it is sparse, far from major markets, and not on major transport routes.<br />
Despite a good investment climate and a his<strong>to</strong>ry <strong>of</strong> generous incentives, its industrial<br />
sec<strong>to</strong>r appears <strong>to</strong> be less competitive than those <strong>of</strong> neighboring countries. Its<br />
limited water resources limit diversification in<strong>to</strong> agro-based industries, including<br />
lives<strong>to</strong>ck. And because <strong>of</strong> <strong>the</strong> very low cost <strong>of</strong> transporting raw diamonds, it is<br />
hard-pressed <strong>to</strong> compete with <strong>the</strong> world’s dominant diamond-processing facilities<br />
in India, which can draw on abundant, cheap and skilled labor, <strong>to</strong>p-quality technology,<br />
and massive scale economies. 31<br />
SOME COMMON FACTORS IN SUCCESS<br />
Why have some countries managed <strong>to</strong> sustain good policies, including for diversification?<br />
Countries that start <strong>of</strong>f from strong institutional conditions can<br />
clearly expect <strong>to</strong> have a more positive range <strong>of</strong> alternatives for using oil rent than<br />
countries whose institutions are extremely challenged. 32 However, countries such<br />
as Chile, <strong>the</strong> experiences <strong>of</strong> Indonesia (especially during <strong>the</strong> first decade <strong>of</strong> <strong>the</strong><br />
30 Starting from a similar position in 1985, Indonesia has increased its non-oil EXPY (<strong>the</strong> GDP/capita<br />
<strong>of</strong> <strong>the</strong> export basket estimated on <strong>the</strong> basis <strong>of</strong> <strong>the</strong> incomes <strong>of</strong> countries showing comparative<br />
advantage in such a bundle <strong>of</strong> products) at twice <strong>the</strong> speed <strong>of</strong> Algeria, despite being a far poorer<br />
country.<br />
31 India accounts for about 60 percent <strong>of</strong> diamond processing in value, 80 percent in karatage, and<br />
90 percent in pieces. The leading center in Surat processes almost 80 percent <strong>of</strong> processed solitaire<br />
diamonds above one karat (The Economic Times, December 28, 2009).<br />
32 Botswana is perhaps <strong>the</strong> most striking case <strong>of</strong> an initially poor mineral exporter with strong initial<br />
institutions. Acemoglu, Johnson and Robinson (2003) suggest that <strong>the</strong> foundation was laid before <strong>the</strong><br />
discovery <strong>of</strong> diamonds. Its inclusive traditional institutions placed constraints on political elites, and<br />
<strong>the</strong>re was minimal disruption <strong>to</strong> <strong>the</strong>se traditions by colonial rule. Particularly noteworthy was Seretse<br />
Khama’s initiative in assigning sub-soil mining rights away from <strong>the</strong> tribes and <strong>to</strong>ward <strong>the</strong> state, in<br />
this way heading <strong>of</strong>f tribal contestation for revenue. Botswana used its diamond income well <strong>to</strong> fur<strong>the</strong>r<br />
streng<strong>the</strong>n institutions and capacity. It remunerated civil servants adequately and employed a<br />
corps <strong>of</strong> foreign advisors <strong>to</strong> work alongside domestic <strong>of</strong>ficials, ra<strong>the</strong>r than rapidly indigenizing <strong>the</strong> civil<br />
service and lowering its quality. More recently, <strong>the</strong> government sought and obtained a sovereign debt<br />
rating even though Botswana had no immediate need <strong>to</strong> borrow. The rating was seen as a commitment<br />
device, <strong>to</strong> alert citizens by signaling potential policy slippage by future governments. In contrast,<br />
Equa<strong>to</strong>rial Guinea has been cited as an extreme case where oil rents sustain a pathology <strong>of</strong> authoritarian<br />
rule, instability, and underdevelopment, from which it is difficult <strong>to</strong> exit. McSharry (2006) analyzes<br />
<strong>the</strong> political economy <strong>of</strong> oil in Equa<strong>to</strong>rial Guinea, suggesting that <strong>the</strong> extraordinary weakness <strong>of</strong><br />
government institutions and <strong>the</strong> dearth <strong>of</strong> social programs make it less likely that <strong>the</strong> government will<br />
be able <strong>to</strong> buy <strong>the</strong> acquiescence <strong>of</strong> <strong>the</strong> population in <strong>the</strong> same way as, for example, Kuwait or Saudi<br />
Arabia.<br />
©International Monetary Fund. Not for Redistribution
Gelb 75<br />
Suhar<strong>to</strong> government) and Malaysia show that even mineral countries with his<strong>to</strong>ries<br />
<strong>of</strong> instability and fractious politics can find windows <strong>of</strong> opportunity for good<br />
management that leads <strong>to</strong>ward diversification. Their experiences suggest a number<br />
<strong>of</strong> common fac<strong>to</strong>rs.<br />
Considering first Chile, <strong>the</strong> state has long been viewed as generally capable, and<br />
its technical capacity, including its key ministries and central bank, has traditionally<br />
been strong. In <strong>the</strong> early 1970s <strong>the</strong> country suffered both serious macroeconomic<br />
instability and social polarization. The period after <strong>the</strong> 1970 election <strong>of</strong> <strong>the</strong> Allende<br />
government and <strong>the</strong> September 1973 Pinochet coup was particularly traumatic. In<br />
1973–75 <strong>the</strong> consumer price index rose by 3000 percent; this was followed by a<br />
deep debt crisis and economic contraction in <strong>the</strong> early 1980s. Unemployment levels<br />
reached 33 percent by 1982. Following <strong>the</strong> return <strong>of</strong> civilian rule in 1990, <strong>the</strong><br />
traumatic experiences <strong>of</strong> <strong>the</strong> two previous decades underpinned widespread consensus<br />
around preventing fur<strong>the</strong>r disruptive boom-bust crises and avoiding conditions<br />
that might precipitate <strong>the</strong> political instability that could lead <strong>to</strong> a return <strong>to</strong> military<br />
government. The result was a broad constituency in favor <strong>of</strong> both economic stability<br />
and public debt reduction. The strength <strong>of</strong> this consensus is demonstrated by<br />
Chile’s response <strong>to</strong> spiraling copper prices and <strong>the</strong> exceptional accumulation <strong>of</strong><br />
surpluses in its copper stabilization fund after 2005. Net public debt fell <strong>to</strong> minus<br />
14 percent <strong>of</strong> GDP by 2008. Never<strong>the</strong>less, sustaining <strong>the</strong>se policies has required<br />
continuous efforts by <strong>the</strong> technocracy <strong>to</strong> reach out <strong>to</strong> elected <strong>of</strong>ficials and explain<br />
<strong>the</strong> implications <strong>of</strong> over-spending.<br />
Indonesia <strong>of</strong>fers ano<strong>the</strong>r interesting example <strong>of</strong> cautious and flexible macroeconomic<br />
management—implemented without a dedicated fund, without transparency,<br />
and even in violation <strong>of</strong> fiscal rules—at least during <strong>the</strong> first part <strong>of</strong> <strong>the</strong><br />
Suhar<strong>to</strong> period. This phase was classified as an example <strong>of</strong> “reforming au<strong>to</strong>cracy”<br />
by Eifert, Gelb, and Tallroth (2003). As in post-Pinochet Chile, <strong>the</strong> Suhar<strong>to</strong><br />
government came in<strong>to</strong> power with a huge stake in stability. The last years <strong>of</strong> <strong>the</strong><br />
“Guided Democracy” <strong>of</strong> <strong>the</strong> Sukarno period had been increasingly chaotic,<br />
including rice riots and ethnic rioting. The 1975 crisis <strong>of</strong> Pertamina, <strong>the</strong> national<br />
oil company, reinforced <strong>the</strong> caution <strong>of</strong> <strong>the</strong> government, and added <strong>to</strong> <strong>the</strong> credibility<br />
<strong>of</strong> <strong>the</strong> technocrats—a very stable team <strong>of</strong> economic advisers widely known as<br />
<strong>the</strong> “Berkeley Mafia.” 33 This team proved <strong>to</strong> have both great permanence and<br />
leeway <strong>to</strong> shape policies. Through <strong>the</strong> oil booms <strong>of</strong> 1974–81, <strong>the</strong> government<br />
formally adhered <strong>to</strong> a balanced budget law. However, without disclosure <strong>to</strong> <strong>the</strong><br />
public or <strong>the</strong> parliament, bureaucratic controls were applied <strong>to</strong> slow actual spending,<br />
creating a de fac<strong>to</strong> surplus and doubling reserves. Indonesia also managed its<br />
spending programs with great flexibility. As oil prices fell after 1981, <strong>the</strong> government<br />
moved aggressively with a drastic reprogramming <strong>of</strong> its development spending,<br />
cancelling projects and cutting subsidies and spending, as well as stabilizing<br />
<strong>the</strong> real exchange rate through progressive devaluation.<br />
33 Pertamina had been under <strong>the</strong> management <strong>of</strong> a military associate <strong>of</strong> <strong>the</strong> president, so that its<br />
crisis—which required a US$1 billion bailout—streng<strong>the</strong>ned <strong>the</strong> hand <strong>of</strong> <strong>the</strong> technocrats.<br />
©International Monetary Fund. Not for Redistribution
76 Economic Diversifi cation in Resource-Rich Countries<br />
Malaysia, ano<strong>the</strong>r success case, has faced a threat <strong>to</strong> economic and social stability<br />
from ei<strong>the</strong>r <strong>of</strong> two paths: rapid growth with Malays politically dominant yet<br />
economically disempowered, or economic collapse caused by excessively redistributive<br />
policies. These threats were clearly recognized. Nei<strong>the</strong>r <strong>of</strong> <strong>the</strong>se options<br />
was attractive, leaving effective economic management and <strong>the</strong> reinvestment <strong>of</strong><br />
rents <strong>to</strong> encourage growth, especially employment-creating growth for Malays, as<br />
<strong>the</strong> only option (Abidin 2001; Rasiah 2006).<br />
Chile, Indonesia, and Malaysia are clearly very different cases, yet <strong>the</strong>y show<br />
some common features. First, two goals were seen as important: accelerating<br />
development and sustaining economic and social stability. These goals enjoyed a<br />
fairly broad basis <strong>of</strong> support in all <strong>of</strong> <strong>the</strong> countries. Second, increasing <strong>the</strong> level<br />
and range <strong>of</strong> exports was seen as a major development priority. Third, <strong>the</strong> governments<br />
concerned were able <strong>to</strong> draw on a stable, strong, and credible technocracy,<br />
with a good understanding <strong>of</strong> <strong>the</strong> risks inherent in a minerals-based development<br />
strategy. Close relationships between politicians and technocrats helped <strong>to</strong> keep<br />
<strong>the</strong>se issues at <strong>the</strong> forefront <strong>of</strong> policy. Fourth, constituencies rooted in non-oil<br />
tradable sec<strong>to</strong>rs were powerful in all <strong>of</strong> <strong>the</strong> countries. In Malaysia, tin and rubber<br />
producers were influential. Agriculture played a similar strategic role in Indonesia,<br />
because <strong>of</strong> its importance in sustaining rural incomes and social stability. In Chile,<br />
a range <strong>of</strong> resource-based commodity exporters that had developed during <strong>the</strong><br />
years <strong>of</strong> low copper prices was actively courted by <strong>the</strong> technocracy and were rolled<br />
out as strong advocates for spending restraint during <strong>the</strong> copper boom. These<br />
interests have been important forces for stability; <strong>the</strong>y have helped <strong>to</strong> restrain<br />
sharp exchange rate appreciations that would damage <strong>the</strong> sec<strong>to</strong>rs concerned. 34<br />
CONCLUSIONS<br />
Some countries with a strong resource base have managed <strong>to</strong> diversify <strong>the</strong>ir<br />
economies and exports, but many have not. Although <strong>the</strong>re is evidence that diversifying<br />
economies can expect <strong>to</strong> do better over <strong>the</strong> long run, <strong>the</strong> urgency <strong>of</strong> <strong>the</strong><br />
issue will vary across countries. Geography, ecology, and o<strong>the</strong>r fac<strong>to</strong>rs severely<br />
constrain <strong>the</strong> possibilities for some countries. Never<strong>the</strong>less, most do have options,<br />
whe<strong>the</strong>r <strong>to</strong> widen <strong>the</strong> range <strong>of</strong> primary exports, move fur<strong>the</strong>r down processing<br />
value-added chains, or shift <strong>to</strong>ward manufactures. The question for <strong>the</strong>se countries<br />
is how strongly <strong>the</strong>y are motivated <strong>to</strong> diversify and whe<strong>the</strong>r <strong>the</strong>y are ready <strong>to</strong><br />
take <strong>the</strong> necessary steps <strong>to</strong> do so.<br />
The first policy message is <strong>the</strong> need <strong>to</strong> get some economy-wide horizontal basics<br />
right. Good macroeconomic management is critical. Failure <strong>to</strong> run a countercyclical<br />
fiscal policy <strong>to</strong> contain massive boom-bust cycles destabilizes <strong>the</strong> traded sec<strong>to</strong>rs and<br />
contributes <strong>to</strong> slow growth. O<strong>the</strong>r macroeconomic policies can have only a supporting<br />
role. Exchange-rate policy presents dilemmas; <strong>the</strong> most that can be sought<br />
34 Similarly, agents <strong>of</strong> restraint in Botswana included traditional chiefs and cattle owners, and in<br />
Norway <strong>the</strong>y included fishing and o<strong>the</strong>r decentralized industries that supported cautious spending.<br />
©International Monetary Fund. Not for Redistribution
Gelb 77<br />
is <strong>to</strong> prevent extended periods <strong>of</strong> overvaluation, especially on <strong>the</strong> downside <strong>of</strong> a<br />
cycle. Trade policy needs <strong>to</strong> be reasonably open, o<strong>the</strong>rwise domestic spending <strong>of</strong><br />
rent will raise prices and domestic costs, making it harder for <strong>the</strong> traded sec<strong>to</strong>rs <strong>to</strong><br />
compete. There may be a special place for selective credit policy <strong>to</strong> help prevent <strong>the</strong><br />
real estate booms and asset bubbles that characterize resource cycles.<br />
It is also vital <strong>to</strong> build o<strong>the</strong>r types <strong>of</strong> capital <strong>to</strong> complement natural resource<br />
wealth. These include human capital and institutional or governance capital.<br />
Countries with major shortfalls in <strong>the</strong>se assets are more likely <strong>to</strong> suffer from a<br />
resource curse. They will also find greater difficulty in establishing viable nonresource<br />
export sec<strong>to</strong>rs, because <strong>the</strong>y will be less able <strong>to</strong> compete with o<strong>the</strong>r<br />
countries at roughly comparable levels <strong>of</strong> income. Resource wealth opens up<br />
opportunities for countries <strong>to</strong> invest in high-quality human capital and in a<br />
capable and accountable state, but only a few countries have done so.<br />
Sec<strong>to</strong>rs will not diversify ei<strong>the</strong>r without measures <strong>to</strong> bring down production<br />
costs in <strong>the</strong> new traded sec<strong>to</strong>rs, both <strong>to</strong> spur efficiency and <strong>to</strong> encourage new<br />
entry. The horizontal policies discussed above will play an essential role; any<br />
economy-wide policies that increase <strong>the</strong> costs or difficulties <strong>of</strong> doing business<br />
make diversification more difficult. But some forms <strong>of</strong> vertical policy that favor<br />
traded sec<strong>to</strong>rs, whe<strong>the</strong>r on a broader or a narrower basis, are likely in resourcerich<br />
countries. They can include focused infrastructure investments, tax and tariff<br />
relief, special zones, programs or regulations that bring down labor costs, or o<strong>the</strong>r<br />
measures. There is still debate on how finely countries can target promising subsec<strong>to</strong>rs;<br />
while a range <strong>of</strong> analytic methods can be used <strong>to</strong> suggest promising focus<br />
areas, it will be necessary <strong>to</strong> maintain flexibility, especially if <strong>the</strong> intention is <strong>to</strong><br />
encourage <strong>the</strong> entry <strong>of</strong> new inves<strong>to</strong>rs.<br />
All <strong>of</strong> <strong>the</strong> successful countries discussed in this chapter have used such vertical<br />
policies, with a strong bias <strong>to</strong>ward broadening <strong>the</strong> range <strong>of</strong> operating businesses<br />
and exports. There may be special arguments for <strong>the</strong>se policies. As for nonresource<br />
economies, such vertical policies might help <strong>to</strong> address market failures,<br />
such as external economies or information or coordination failures, which slow<br />
<strong>the</strong> growth <strong>of</strong> new business. In addition, assuming that diversification is indeed a<br />
national long-term priority, <strong>the</strong>se policies <strong>of</strong>fer one way <strong>to</strong> counter <strong>the</strong> market’s<br />
immediate pull <strong>of</strong> fac<strong>to</strong>rs <strong>of</strong> production <strong>to</strong>ward <strong>the</strong> nontraded sec<strong>to</strong>rs, which<br />
comes from <strong>the</strong> spending <strong>of</strong> natural rent. Moreover, natural rent also provides<br />
government with increased resources <strong>to</strong> implement vertical policies.<br />
But <strong>the</strong> risks are particularly high. Securing access <strong>to</strong> fiscal incentives is a way<br />
<strong>to</strong> capture a share <strong>of</strong> natural rent, and this increases <strong>the</strong> pressures for special programs<br />
<strong>to</strong> become a mechanism <strong>of</strong> distribution <strong>to</strong> favored insiders. A focus on such<br />
programs can reduce policy attention <strong>to</strong> <strong>the</strong> basics: it is always easier <strong>to</strong> introduce<br />
a new program than <strong>to</strong> address <strong>the</strong> politically difficult problem <strong>of</strong> confronting <strong>the</strong><br />
supporters <strong>of</strong> existing policies and reforming <strong>the</strong>m. Having more fiscal resources<br />
also reduces <strong>the</strong> urgency <strong>of</strong> reversing failing policies. Even if <strong>the</strong>y are intended <strong>to</strong><br />
promote diversification, ineffective programs will be worse than not spending at<br />
all, since <strong>the</strong>ir effect will be on <strong>the</strong> demand side, pulling fac<strong>to</strong>rs <strong>of</strong> production<br />
<strong>to</strong>ward <strong>the</strong> nontraded sec<strong>to</strong>rs.<br />
©International Monetary Fund. Not for Redistribution
78 Economic Diversifi cation in Resource-Rich Countries<br />
REFERENCES<br />
Abidin, M.Z., 2001, “Competitive Industrialization with <strong>Natural</strong> Resource Abundance:<br />
Malaysia,” in Resource Abundance and Economic Development, ed. by Richard M. Auty<br />
(Oxford: Oxford University Press).<br />
Acemoglu, D., S. Johnson, and J.A. Robinson, 2003, “An African Success S<strong>to</strong>ry: Botswana,” in<br />
In Search <strong>of</strong> Prosperity: Analytical Narratives on Economic Growth, ed. by Dani Rodrik<br />
(Prince<strong>to</strong>n: Prince<strong>to</strong>n University Press).<br />
Arezki, R., R. Cherif, and J. Piotrowski, 2009, “Tourism Specialization and Economic<br />
Development: Evidence from <strong>the</strong> UNESCO World Heritage List,” IMF Working Paper No.<br />
09/176 (Washing<strong>to</strong>n: International Monetary Fund).<br />
Auty, R., 1994, Economic Development and Industrial Policy (London: Mikesell).<br />
———, 1995, Patterns <strong>of</strong> Development: <strong>Resources</strong>, Policy and Economic Growth (London: Edward<br />
Arnold).<br />
Benaventa, J., 2006, “Wine Production in Chile,” in Technology, Adaptation and Exports: How<br />
Some Developing Countries Got it Right, ed. by Vandana Chandra (Washing<strong>to</strong>n: World<br />
Bank).<br />
Bornhorst, F., G. Sanjeev, and J. Thorn<strong>to</strong>n, 2008, “<strong>Natural</strong> Resource Endowments, Governance<br />
and <strong>the</strong> Domestic Revenue Effort: Evidence From a Panel <strong>of</strong> Countries,” IMF Working Paper<br />
No. 08/170 (Washing<strong>to</strong>n: International Monetary Fund).<br />
Bravo-Ortega, C., and J. de Gregorio, 2007, “The Relative Richness <strong>of</strong> <strong>the</strong> Poor? <strong>Natural</strong><br />
<strong>Resources</strong>, Human Capital, and Economic Growth,” in <strong>Natural</strong> <strong>Resources</strong>: Nei<strong>the</strong>r Curse nor<br />
Destiny, ed. by D. Lederman and W. F. Maloney (Washing<strong>to</strong>n: The World Bank; and<br />
Stanford University Press).<br />
Budina, N., and S. van Wijnbergen, 2008, “Managing Oil Revenue Volatility in Nigeria: The<br />
Role <strong>of</strong> Fiscal Policy,” Chapter 10 in Africa at a Turning Point, ed. by D. Go and J. Page<br />
(Washing<strong>to</strong>n: World Bank).<br />
Collier, P., 2007, The Bot<strong>to</strong>m Billion: Why <strong>the</strong> Poorest Countries Are Failing and What Can Be<br />
Done About it (Oxford: Oxford University Press).<br />
Coxhead, I., 2007, “A New Resource Curse? Impacts <strong>of</strong> China’s Boom on Comparative<br />
Advantage and Resource Dependence in Sou<strong>the</strong>ast Asia,” World Development, Vol. 35, No. 7,<br />
pp. 1099–1119.<br />
Eifert, B., A. Gelb, and N. Tallroth, 2003, “The Political Economy <strong>of</strong> Fiscal Policy and<br />
Economic Management in Oil-Exporting Countries,” in Fiscal Policy Formulation and<br />
Implementation in Oil Producing Countries, ed. by Jeffrey M. Davis, R. Ossowski, and<br />
A. Fedelino (Washing<strong>to</strong>n: International Monetary Fund).<br />
Frankel, J.A., 2009, “A Comparison <strong>of</strong> Monetary Anchor Options for Commodity-<br />
Exporters in Latin America and <strong>the</strong> Caribbean,” Background paper for <strong>Natural</strong><br />
<strong>Resources</strong> in Latin America, ed. by N. Sinnott and A. de la Torre (Washing<strong>to</strong>n: World<br />
Bank, 2010).<br />
Gelb, A., 1988, Oil Windfalls: Blessing or Curse (Oxford: Oxford University Press).<br />
———, 2011, “<strong>Natural</strong> Resource Exports and African Development,” in The Oxford<br />
Companion <strong>to</strong> Economics in Africa, ed. by E. Aryeetey, S. Devarajan, R. Kanbur, and<br />
L. Kasekende (Oxford: Oxford University Press).<br />
Gelb, A., and S. Grasmann, 2010, “How Should Oil Exporters Spend <strong>the</strong>ir Rents?” Working<br />
Paper No. 221 (Washing<strong>to</strong>n: Center for Global Development), August.<br />
Gelb, A. and G. Turner, 2008, “Confronting <strong>the</strong> Resource Curse,” in Globalization and<br />
Economic Success: Policy Lessons for Developing Countries, ed. by B. Desker, J. Herbst, G. Mills,<br />
and M. Spicer (Johannesburg: The Brenthurst Foundation).<br />
Gourdon, J., 2010, “FDI Flows and Export Diversification: Looking at Extensive and Intensive<br />
Margins,” Trade Competitiveness <strong>of</strong> <strong>the</strong> Middle East and North Africa, ed. by J. Lopez-Calix,<br />
P. Walkenhorst, and N. Diop (Washing<strong>to</strong>n: World Bank).<br />
Hamil<strong>to</strong>n, J.D., 2008, “Understanding Crude Oil Prices,” draft (San Diego: University <strong>of</strong> San<br />
Diego), June 4.<br />
©International Monetary Fund. Not for Redistribution
Gelb 79<br />
Hausmann, R., and B. Klinger, 2007, “The Structure <strong>of</strong> <strong>the</strong> Product Space and <strong>the</strong> Evolution<br />
<strong>of</strong> Comparative Advantage,” Working Paper No. 146 (Cambridge, MA: Harvard University<br />
Center for Economic Development).<br />
Hausmann, R., B. Klinger, and J. Lopez-Calix, 2010, “Export Diversification in Algeria,”<br />
in Trade Competitiveness <strong>of</strong> <strong>the</strong> Middle East and North Africa, ed. by J. Lopez-Calix,<br />
P. Walkenhorst, and N. Diop (Washing<strong>to</strong>n: World Bank).<br />
Hausmann, R., and R. Rigobón, 2003, “An Alternative Interpretation <strong>of</strong> <strong>the</strong> Resource Curse:<br />
Theory and Policy Implications,” in Fiscal Policy Formulation and Implementation in Oil-<br />
Producing Countries, ed. by J. M. Davis, R. Ossowski, and A. Fedelino (Washing<strong>to</strong>n:<br />
International Monetary Fund).<br />
Hesse, H., 2008, “Export Diversification and Growth,” Growth Commission Working Paper<br />
No. 21 (Washing<strong>to</strong>n: World Bank).<br />
Hnatkovska,V., and N. Loayza, 2003, “Volatility and Growth,” World Bank Policy Research<br />
Working Paper No. 3184 (Washing<strong>to</strong>n: World Bank), April.<br />
Imbs, J., and R. Wacziarg, 2003, “Stages <strong>of</strong> Diversification,” American Economic Review,<br />
Vol. 95, No. 3.<br />
International Monetary Fund, 2007, Regional Economic Outlook: Sub-Saharan Africa (Washing<strong>to</strong>n,<br />
April).<br />
Janardhan, M., 2007, “Diversification Follows <strong>the</strong> ‘Copycat’ Route,” IPS—InterPress News<br />
Agency, online report dated November 28, 2007.<br />
Katz, J., 2006, “Salmon Farming in Chile,” in Technology, Adaptation, and Exports: How Some<br />
Developing Countries Got it Right, ed. by V. Chandra (Washing<strong>to</strong>n: World Bank).<br />
Knack, S., 2008, “Sovereign Rents and <strong>the</strong> Quality <strong>of</strong> Tax Policy and Administration,” World<br />
Bank Policy Research Report No. 4773 (Washing<strong>to</strong>n: World Bank), November.<br />
Korhonen, I., and T. Juurikkala, 2007, “Equilibrium Exchange Rates in Oil-Dependent<br />
Countries,” BOFIT Discussion Paper No. 8/2007 (Helsinki: Bank <strong>of</strong> Finland, Institute for<br />
Economies in Transition).<br />
Kuruvilla, S., 1996, “Linkages between Industrialization Strategies and Industrial Relations/<br />
Human Resource <strong>Policies</strong>: Singapore, Malaysia, <strong>the</strong> Philippines, and India” (Cornell University,<br />
School <strong>of</strong> Industrial and Labor Relations, http://digitalcommons.ilr.cornell.edu/cbpubs/6/<br />
Lederman, D., and W. Maloney, eds., 2007, <strong>Natural</strong> <strong>Resources</strong>: Nei<strong>the</strong>r Curse Nor Destiny<br />
(Washing<strong>to</strong>n: World Bank; and Stanford University Press).<br />
Lin, J.Y., 2009, Economic Development and Transition (Cambridge: Cambridge University<br />
Press).<br />
Maier, J., and A. Wood, 1998, “Africa’s Export Structure in a Comparative Perspective,” Study<br />
No. 4 (Geneva: United Nations Conference on Trade and Development).<br />
McSharry, B., 2006, “The Political Economy <strong>of</strong> Oil in Equa<strong>to</strong>rial Guinea,” African Studies<br />
Quarterly, Vol. 8, No. 23.<br />
Mehlum, H., K.O. Moene, and R. Torvik, 2006, “Institutions and <strong>the</strong> Resource Curse,”<br />
Economic Journal, Vol. 116, No. 508, pp. 1–20.<br />
Nabli, M., J. Keller, C. Nassaf, and C. Silva-Jauregui, 2008, “The Political Economy <strong>of</strong><br />
Industrial Policy in <strong>the</strong> Middle East and North Africa,” in Industrial Policy in <strong>the</strong> Middle East<br />
and North Africa: Rethinking <strong>the</strong> Role <strong>of</strong> <strong>the</strong> State, ed. by A. Galal (New York: The American<br />
University in Cairo Press).<br />
Noland, M., and H. Pack, 2003, Industrial Policy in an Era <strong>of</strong> Globalization: Lessons from Asia<br />
(Washing<strong>to</strong>n: Institute for International Economics).<br />
———, 2008, “The East Asian Industrial Policy Experience: Implications for <strong>the</strong> Middle East,”<br />
in Industrial Policy in <strong>the</strong> Middle East and North Africa: Rethinking <strong>the</strong> Role <strong>of</strong> <strong>the</strong> State, ed. by<br />
A. Galal (New York: The American University in Cairo Press).<br />
Ramey, G., and V. Ramey, 1995. “Cross-Country Evidence on <strong>the</strong> Link between Volatility and<br />
Growth,” American Economic Review, Vol. 85, No. 5 (December).<br />
Rasiah, R., 2006, “Explaining Malaysia’s Export Expansion in Palm Oil and Related Products,”<br />
in Technology, Adaptation, and Exports: How Some Developing Countries Got it Right, ed. by<br />
V. Chandra (Washing<strong>to</strong>n: World Bank).<br />
©International Monetary Fund. Not for Redistribution
80 Economic Diversifi cation in Resource-Rich Countries<br />
Rodrik, D., 2004, “Industrial Policy for <strong>the</strong> Twenty-First Century,” CEPR Discussion Paper No.<br />
4767 (London: Centre for Economic Policy Research), November.<br />
Sinnott, E., J. Nash, and A. de la Torre, 2010, <strong>Natural</strong> <strong>Resources</strong> in Latin America: Beyond Booms<br />
and Busts? (Washing<strong>to</strong>n: World Bank).<br />
van der Ploeg, F., and A. J. Venables, 2009, “<strong>Harness</strong>ing Windfall Revenues: Optimal <strong>Policies</strong><br />
for Resource-Rich Developing Economies,” OxCarre Research Paper No. 2008-09 (Oxford:<br />
Oxford University).<br />
World Bank, 2006, Where Is <strong>the</strong> Wealth <strong>of</strong> Nations? Measuring Capital for <strong>the</strong> 21st Century<br />
(Washing<strong>to</strong>n).<br />
———, 2007, Botswana Investment Climate Assessment (Washing<strong>to</strong>n).<br />
©International Monetary Fund. Not for Redistribution
Finance and Oil: Is There<br />
a Resource Curse?<br />
THORSTEN BECK<br />
INTRODUCTION<br />
CHAPTER 5<br />
An extensive literature has identified financial sec<strong>to</strong>r development as a critical<br />
fac<strong>to</strong>r in inclusive economic development (see Levine, 2005, and Beck, 2009,<br />
for overviews). Countries with deeper financial systems grow faster, and it is<br />
<strong>the</strong> lowest income quintile that benefits most from this deepening (Beck,<br />
Levine, and Loayza, 2000; Beck, Demirgüç-Kunt, and Levine, 2007).<br />
Countries with deeper financial systems also experience faster reductions in<br />
income inequality and poverty rates. Financial sec<strong>to</strong>r development helps<br />
industries that are most reliant on external finance grow faster, and it helps<br />
enterprises, especially smaller and more opaque ones, overcome financing constraints<br />
(Rajan and Zingales, 1998; Beck, Demirgüç-Kunt, and Maksimovic,<br />
2005). The positive effect <strong>of</strong> financial sec<strong>to</strong>r development on economic growth<br />
comes through improved resource allocation and productivity growth, ra<strong>the</strong>r<br />
than increased capital accumulation (Beck, Levine, and Loayza, 2000; Wurgler,<br />
2000).<br />
However, most <strong>of</strong> this literature is based on broad cross-country samples, following<br />
<strong>the</strong> assumption that <strong>the</strong> finance-growth relationship is linear and constant<br />
across countries. 1 Meanwhile, many o<strong>the</strong>r papers in <strong>the</strong> finance and growth literature<br />
drop oil-exporting countries or natural-resource-based economies in<br />
general, arguing that <strong>the</strong>ir economic development is driven by different fac<strong>to</strong>rs<br />
and that <strong>the</strong>ir financial sec<strong>to</strong>r has a role and structure that differs from what<br />
applies in o<strong>the</strong>r economies.<br />
Thorsten Beck is pr<strong>of</strong>essor <strong>of</strong> economics at Tilburg University and chairman <strong>of</strong> <strong>the</strong> European<br />
Banking Center. This chapter is based on <strong>the</strong> author’s presentation at “<strong>Natural</strong> <strong>Resources</strong>, Finance,<br />
and Development: Confronting Old and New Challenges,” a high-level seminar organized by <strong>the</strong><br />
Central Bank <strong>of</strong> Algeria and <strong>the</strong> IMF Institute, which <strong>to</strong>ok place in Algiers, on November 4 and 5,<br />
2010. The author gratefully acknowledges comments by Rabah Arezki, Thorvaldur Gylfason, Steven<br />
Poelhekke, and Marc Quintyn and research assistance by Mohammad Hoseini and Radomir Todorov.<br />
The author can be contacted at T.Beck@uvt.nl.<br />
1<br />
There are several papers, however, that have shown nonlinear finance–growth relationships, including<br />
Aghion, Howitt, and Mayer-Foulkes (2005) and Rioja and Valev (2004a, 2004b).<br />
©International Monetary Fund. Not for Redistribution<br />
81
82 Finance and Oil: Is There a Resource Curse?<br />
This chapter focuses on financial deepening in resource-based economies.<br />
Specifically, it will test whe<strong>the</strong>r <strong>the</strong> finance and growth relationship varies across<br />
countries depending on <strong>the</strong> degree <strong>to</strong> which <strong>the</strong>y rely on natural resources and,<br />
second, will document <strong>the</strong> development and structure <strong>of</strong> financial systems in<br />
resource-based economies compared <strong>to</strong> o<strong>the</strong>r countries. In <strong>the</strong> first section, we<br />
will use standard cross-country growth regressions as well as industry-level regressions,<br />
allowing for a differential relationship between finance and economic<br />
growth depending on <strong>the</strong> degree <strong>to</strong> which an economy relies on natural resource<br />
exports or is abundant in natural resource wealth. In <strong>the</strong> second section, we will<br />
use aggregate bank-level and firm-level data <strong>to</strong> explore whe<strong>the</strong>r <strong>the</strong> depth,<br />
breadth, and efficiency <strong>of</strong> financial systems varies systematically across countries<br />
with different degrees <strong>of</strong> natural resource reliance.<br />
Exploring <strong>the</strong> role financial-sec<strong>to</strong>r development plays in <strong>the</strong> growth <strong>of</strong><br />
resource-based economies is interesting and important for both academics and<br />
policymakers. There is a large literature on <strong>the</strong> natural resource “curse” and <strong>the</strong><br />
different channels through which resource abundance can influence growth;<br />
understanding <strong>the</strong> role <strong>of</strong> financial development in this context is critical.<br />
Policymakers who care about <strong>the</strong> development <strong>of</strong> <strong>the</strong>ir countries need <strong>to</strong> understand<br />
<strong>the</strong> relative importance <strong>of</strong> different policy areas and <strong>the</strong> effectiveness <strong>of</strong><br />
specific policies. Understanding channels through which resource abundance can<br />
stimulate or dampen economic development can be important <strong>to</strong> developing<br />
policies <strong>to</strong> maximize <strong>the</strong> benefits <strong>of</strong> natural capital.<br />
By exploring <strong>the</strong> role and structure <strong>of</strong> <strong>the</strong> financial system in resource-based<br />
economies, this chapter builds on <strong>the</strong> literature that has explored <strong>the</strong> abovementioned<br />
curse <strong>of</strong> natural resource abundance (see van der Ploeg, 2011, for a<br />
recent survey), which refers <strong>to</strong> <strong>the</strong> crowding out <strong>of</strong> nonresource-based activities<br />
or investment through price and incentive effects. One form <strong>of</strong> this curse—also<br />
referred <strong>to</strong> as Dutch disease—works through <strong>the</strong> exchange rate mechanism: commodity<br />
exports will put upwards pressure on <strong>the</strong> real exchange rate, which will<br />
turn nonresource exports uncompetitive, ultimately depressing <strong>the</strong> traded goods<br />
sec<strong>to</strong>r. The decline <strong>of</strong> British manufacturing after <strong>the</strong> discovery <strong>of</strong> oil in <strong>the</strong> 1970s<br />
and <strong>the</strong> decline <strong>of</strong> <strong>the</strong> Dutch manufacturing sec<strong>to</strong>r after <strong>the</strong> discovery <strong>of</strong> a natural<br />
gas field in 1959 are prominent recent examples, although nei<strong>the</strong>r decline lasted.<br />
Beyond price effects, <strong>the</strong> natural resource curse also refers <strong>to</strong> <strong>the</strong> dis<strong>to</strong>rtion <strong>of</strong><br />
incentives for investing in institutions, education, and o<strong>the</strong>r public services due<br />
<strong>to</strong> windfall gains from natural resources, which can ultimately have negative<br />
repercussions for political freedom and stability. It is generally easier <strong>to</strong> make<br />
short-term pr<strong>of</strong>its from natural resources such as oil than from fixed assets such<br />
as manufacturing plants, equipment, and machinery, because proceeds from<br />
natural resources depend less on <strong>the</strong> creation <strong>of</strong> a market, on human capital, and<br />
on research and development (R&D) investment. This in turn reduces incentives<br />
<strong>to</strong> invest in an institutional framework that supports broad domestic marketbased<br />
exchange, private property rights, and <strong>the</strong> contractual framework<br />
supporting non-commodity production (Besley and Persson, 2010). <strong>Natural</strong><br />
resource wealth also allows less than democratic governments <strong>to</strong> buy <strong>of</strong>f political<br />
©International Monetary Fund. Not for Redistribution
Beck 83<br />
opposition, avoid accountability, and prevent transparency. <strong>Natural</strong> resources<br />
make it more pr<strong>of</strong>itable for <strong>the</strong> elites <strong>to</strong> hang on <strong>to</strong> power and block <strong>the</strong> development<br />
<strong>of</strong> an open society (Beck and Laeven, 2006). This, in turn, can foster conflict,<br />
as seen most prominently across Sub-Saharan Africa (Collier and Hoeffler,<br />
2004). In addition, a commodity-induced bonanza can foster a shift from pr<strong>of</strong>itmaking<br />
entrepreneurship <strong>to</strong>ward socially inefficient rent seeking. However, <strong>the</strong>re<br />
is also an interaction between institutional development and resource abundance,<br />
with countries above a threshold <strong>of</strong> institutional development able <strong>to</strong> reap benefits<br />
from natural resource wealth (Mehlum, Moene, and Torvik, 2006).<br />
The empirical literature has provided ample evidence for <strong>the</strong> natural resource<br />
curse and <strong>the</strong> different channels through which it affects growth. However, this<br />
literature has also noted a wide cross-country variation in experiences. On <strong>the</strong> one<br />
hand, Nigeria has experienced negative growth since its independence, associated<br />
with exchange rate effects, rent seeking, and violence stemming from oil exports,<br />
while on <strong>the</strong> o<strong>the</strong>r hand Botswana has experienced positive growth over <strong>the</strong> past<br />
50 years, despite being heavily reliant on diamond exports. However, according<br />
<strong>to</strong> Gylfason (2001), only 4 out <strong>of</strong> 65 resource-based economies can be considered<br />
success s<strong>to</strong>ries in terms <strong>of</strong> growth (Indonesia, Malaysia, Thailand, and Botswana),<br />
and <strong>the</strong> three Asian countries in that group still fared less well than <strong>the</strong>ir East<br />
Asian neighbors Hong Kong, Singapore, and South Korea. With few exceptions,<br />
however, <strong>the</strong> literature has not considered <strong>the</strong> effect <strong>of</strong> natural resource abundance<br />
on financial development or <strong>the</strong> role <strong>of</strong> financial institutions in mitigating<br />
<strong>the</strong> natural resource curse (van der Ploeg, 2011). 2<br />
In exploring whe<strong>the</strong>r <strong>the</strong>re is a natural resource curse in financial development,<br />
this chapter also builds on a large literature on <strong>the</strong> determinants <strong>of</strong> financial<br />
deepening across countries. Boyd, Levine, and Smith (2001) show <strong>the</strong> importance<br />
<strong>of</strong> macroeconomic stability for financial deepening, while La Porta and<br />
o<strong>the</strong>rs (1997, 1998) and Djankov, McLiesh, and Shleifer (2007) show <strong>the</strong> importance<br />
that contractual and information frameworks have for financial development.<br />
3 A related literature has explored <strong>the</strong> importance <strong>of</strong> his<strong>to</strong>rical fac<strong>to</strong>rs, such<br />
as legal tradition, and geographic traits in forming institutional and specifically<br />
financial development (see Beck and Levine, 2005, for a survey).<br />
Theory and <strong>the</strong> institutional literature provide different hypo<strong>the</strong>ses on <strong>the</strong><br />
effects natural resource abundance has on financial system development. Both<br />
demand-side and supply-side effects are analyzed. Take first <strong>the</strong> demand side. On<br />
<strong>the</strong> one hand, windfall gains from natural resource abundance and <strong>the</strong> consequent<br />
expansion <strong>of</strong> <strong>the</strong> nontraded goods sec<strong>to</strong>r can lead <strong>to</strong> higher demand for<br />
financial services, including consumer credit. On <strong>the</strong> o<strong>the</strong>r hand, <strong>the</strong>re is lower<br />
2 Two exceptions are Bhattacharyya and Hodler (2010), who show a negative relationship between<br />
resource dependence and financing development in countries with low levels <strong>of</strong> democracy using<br />
country-level data, and Barajas, Chami, and Yousefi (2010), who explore <strong>the</strong> finance and growth<br />
relationship across countries with different degrees <strong>of</strong> resource dependence. Gylfason (2004) also<br />
<strong>of</strong>fers some suggestive evidence <strong>of</strong> lower financial development in resource-based economies.<br />
3 See Beck (2006) for an overview.<br />
©International Monetary Fund. Not for Redistribution
84 Finance and Oil: Is There a Resource Curse?<br />
demand for external financing from <strong>the</strong> natural resource sec<strong>to</strong>r than from <strong>the</strong><br />
nonresource traded goods sec<strong>to</strong>r, which will suffer in a Dutch disease scenario.<br />
Fur<strong>the</strong>r, <strong>the</strong> literature has documented lower savings and investment rates in<br />
resource-based economies, which in turn can also explain those economies’ lower<br />
demand for financial services. Specifically, resource-rich countries can use <strong>the</strong>ir<br />
resource revenues for consumption smoothing, which weakens <strong>the</strong> incentive <strong>to</strong><br />
build an effective financial system <strong>to</strong> serve as a buffer <strong>to</strong> smooth consumption over<br />
<strong>the</strong> business cycle (Gylfason, 2004). Take next <strong>the</strong> supply side. Higher investment<br />
in <strong>the</strong> natural resource sec<strong>to</strong>r can lead <strong>to</strong> lower investment in <strong>the</strong> financial sec<strong>to</strong>r<br />
and draw away skills from <strong>the</strong> financial system. In addition, <strong>the</strong> fact that financial<br />
systems depend heavily on sound institutional frameworks, including effective contractual<br />
frameworks, can hamper financial deepening in countries where natural<br />
resource abundance undermines institutional development.<br />
Theory also makes ambiguous predictions about <strong>the</strong> finance-growth relationship<br />
in resource-based economies. On <strong>the</strong> one hand, <strong>the</strong> financial system might<br />
be less important, since growth depends less on finance-intensive sec<strong>to</strong>rs. On <strong>the</strong><br />
o<strong>the</strong>r hand, financial system development might be more important <strong>to</strong> compensate<br />
for <strong>the</strong> negative effects <strong>of</strong> Dutch disease and in order <strong>to</strong> diversify <strong>the</strong> economy.<br />
In addition, financial systems in resource-based economies can help counter<br />
<strong>the</strong> negative impact <strong>of</strong> real exchange rate volatility (Aghion and o<strong>the</strong>rs, 2009).<br />
The following empirical results show that financial development is as important<br />
for economic growth in resource-based economies as in o<strong>the</strong>r countries. On <strong>the</strong><br />
o<strong>the</strong>r hand, resource-based economies do have less developed financial systems, and<br />
while <strong>the</strong>ir banks are more liquid, better capitalized, and more pr<strong>of</strong>itable, <strong>the</strong>y give<br />
fewer loans <strong>to</strong> firms. Firms in <strong>the</strong>se economies use less external finance than firms<br />
elsewhere, and a smaller share <strong>of</strong> <strong>the</strong>m uses bank loans, although <strong>the</strong>re is <strong>the</strong> same<br />
level <strong>of</strong> demand as in o<strong>the</strong>r countries, thus pointing <strong>to</strong> supply constraints. Overall,<br />
<strong>the</strong>re is some indication <strong>of</strong> a natural resource curse in financial development, <strong>the</strong><br />
weight <strong>of</strong> which falls more on enterprises than on households.<br />
Since this chapter is one <strong>of</strong> <strong>the</strong> first <strong>to</strong> rigorously explore <strong>the</strong> role <strong>of</strong> financial<br />
systems in resource-based economies, several caveats are due. First, we work with<br />
very rough measures <strong>of</strong> natural resource dependence, although we test <strong>the</strong> robustness<br />
<strong>of</strong> our results across several indica<strong>to</strong>rs. Second, this is a very broad but also<br />
preliminary exploration <strong>of</strong> <strong>the</strong> role <strong>of</strong> financial systems in resource-based economies;<br />
what we gain in breadth, we miss in depth in <strong>the</strong> different dimensions. Several<br />
<strong>of</strong> <strong>the</strong> <strong>to</strong>pics explored in this chapter could pr<strong>of</strong>itably be subjected <strong>to</strong> more in-depth<br />
explorations, which would also have <strong>to</strong> address issues <strong>of</strong> identification.<br />
This chapter is related <strong>to</strong> a small literature on <strong>the</strong> institutional resource curse.<br />
Beck and Laeven (2006) show that variations in <strong>the</strong> extent <strong>of</strong> natural resources<br />
across transition economies can partly explain variations in <strong>the</strong>ir institution<br />
building after 1990, when all <strong>the</strong>se countries faced <strong>the</strong> same challenge <strong>of</strong> building<br />
market-compatible institutions. Cross-country regressions have confirmed this<br />
negative relationship between natural resource abundance and <strong>the</strong> rule <strong>of</strong> law<br />
(Norman, 2009), control <strong>of</strong> corruption (Papyrakis and Gerlagh, 2004) and overall<br />
institutional capacity (Isham and o<strong>the</strong>rs, 2005).<br />
©International Monetary Fund. Not for Redistribution
Beck 85<br />
The remainder <strong>of</strong> <strong>the</strong> chapter is structured as follows. The next (second) section<br />
assesses whe<strong>the</strong>r <strong>the</strong> finance and growth relationship varies across countries<br />
according <strong>to</strong> <strong>the</strong> degree <strong>of</strong> importance that commodities have in <strong>the</strong> economy.<br />
The third section explores whe<strong>the</strong>r commodity-based economies have lower levels<br />
<strong>of</strong> financial development and is thus a test <strong>of</strong> <strong>the</strong> resource curse for financial<br />
system development. The fourth section analyzes banks’ balance sheets and<br />
income statements <strong>to</strong> show whe<strong>the</strong>r banks are different in resource-based economies.<br />
The fifth section uses firm-level survey data <strong>to</strong> explore differences in firms’<br />
use <strong>of</strong> external finance and firms’ financing obstacles across countries with a different<br />
reliance on natural resources and aggregate outreach data. The last section<br />
concludes and provides some policy discussion.<br />
FINANCE AND GROWTH: IS THERE A NATURAL<br />
RESOURCE DISCOUNT?<br />
This section explores whe<strong>the</strong>r <strong>the</strong> positive relationship between financial development<br />
and economic growth varies across countries depending on <strong>the</strong> degree <strong>of</strong><br />
natural resource reliance. In order <strong>to</strong> do so, we use Barro-style standard crosscountry<br />
finance and growth regressions, adding a variable capturing natural<br />
resource reliance or abundance plus its interaction with financial development.<br />
We use two indica<strong>to</strong>rs <strong>to</strong> gauge <strong>the</strong> reliance <strong>of</strong> economies on natural resources.<br />
The first indica<strong>to</strong>r is <strong>Natural</strong> Resource Exports, which is <strong>the</strong> sum <strong>of</strong> fuel, ores, and<br />
metal exports relative <strong>to</strong> GDP. 4 Data come from <strong>the</strong> World Bank’s World<br />
Development Indica<strong>to</strong>rs, and are available for a broad cross-section <strong>of</strong> countries on<br />
an annual basis over <strong>the</strong> period 1960 <strong>to</strong> 2007. The second indica<strong>to</strong>r is Subsoil Assets<br />
per capita and refers <strong>to</strong> natural assets (World Bank, 2006). It is computed as <strong>the</strong> net<br />
present value <strong>of</strong> <strong>the</strong> income <strong>the</strong>se resources are able <strong>to</strong> produce, calculated for <strong>the</strong><br />
year 2000. <strong>Natural</strong> Resource Exports ranges from zero, in countries like Mauritius,<br />
<strong>to</strong> almost 100 percent in many oil-exporting countries. Similarly, Subsoil Assets per<br />
capita ranges from zero, in countries like Singapore, <strong>to</strong> US$80,000 in Saudi Arabia.<br />
Given <strong>the</strong> wide variation, we use <strong>the</strong> log <strong>of</strong> one plus Subsoil Assets in our regressions.<br />
It is important <strong>to</strong> note that <strong>the</strong>re are important differences between <strong>the</strong>se two<br />
measures, with <strong>Natural</strong> Resource Exports referring <strong>to</strong> <strong>the</strong> realized income stream<br />
based on <strong>the</strong> resources and Subsoil Assets referring <strong>to</strong> <strong>the</strong> actual wealth. 5 However,<br />
<strong>the</strong> two measures are highly and significantly correlated with each o<strong>the</strong>r, suggesting<br />
that most economies that are abundant in natural resources also rely on natural<br />
resources as an export good. It is also important <strong>to</strong> note that both measures have<br />
<strong>the</strong>ir shortcomings. The ratio <strong>of</strong> <strong>Natural</strong> Resource Exports <strong>to</strong> GDP can be driven<br />
as much by <strong>the</strong> numera<strong>to</strong>r as by <strong>the</strong> denomina<strong>to</strong>r and depends very much on <strong>the</strong><br />
extraction rate. Subsoil Assets per capita is a more direct measure <strong>of</strong> natural resource<br />
4 We <strong>the</strong>refore abstract from agricultural commodities.<br />
5 Brunnschweiler and Bulte (2008) point <strong>to</strong> important differences in <strong>the</strong> effect <strong>of</strong> natural resource<br />
dependence and natural resource abundance on institutional and economic development.<br />
©International Monetary Fund. Not for Redistribution
86 Finance and Oil: Is There a Resource Curse?<br />
wealth, but it relies heavily on assumptions about reserves and extraction costs (van<br />
der Ploeg and Poelhekke, 2010).<br />
As an indica<strong>to</strong>r <strong>of</strong> financial development, we use a standard indica<strong>to</strong>r from <strong>the</strong><br />
literature, Private Credit, which is <strong>the</strong> <strong>to</strong>tal claims by financial institutions outstanding<br />
on <strong>the</strong> domestic nonfinancial private sec<strong>to</strong>r, divided by GDP. This<br />
indica<strong>to</strong>r ranges from less than 2 percent in <strong>the</strong> Democratic Republic <strong>of</strong> Congo<br />
<strong>to</strong> almost 150 percent in Switzerland. As an alternative indica<strong>to</strong>r, we use Liquid<br />
Liabilities <strong>to</strong> GDP, which is defined as currency plus demand and interest-bearing<br />
liabilities <strong>of</strong> banks and nonbank financial intermediaries, divided by GDP, and<br />
thus focuses on banks’ liability side. Both indica<strong>to</strong>rs are from <strong>the</strong> World Bank’s<br />
Financial Development and Structure Database (Beck, Demirgüç-Kunt, and<br />
Levine, 2010). All o<strong>the</strong>r macroeconomic indica<strong>to</strong>rs are from <strong>the</strong> World<br />
Development Indica<strong>to</strong>rs (WDI) <strong>of</strong> <strong>the</strong> World Bank.<br />
We average real GDP per capita growth over <strong>the</strong> period 1980 <strong>to</strong> 2007 and run<br />
<strong>the</strong> following regressions:<br />
g(i) = α1 + β1Private Credit (i) + β2Private Credit (i)<br />
*<strong>Natural</strong> <strong>Resources</strong> (i) + β3<strong>Natural</strong> <strong>Resources</strong> (i) + γ’C(i) + ε(i) (1)<br />
where β1 captures <strong>the</strong> general effect <strong>of</strong> financial development on growth, while β2<br />
captures <strong>the</strong> differential effect in economies that are more resource based.<br />
Following <strong>the</strong> finance and growth literature, our set <strong>of</strong> conditioning information<br />
includes (i) <strong>the</strong> log <strong>of</strong> initial real GDP per capita <strong>to</strong> control for convergence, (ii)<br />
average years <strong>of</strong> schooling <strong>to</strong> control for human capital accumulation, (iii) <strong>the</strong><br />
share <strong>of</strong> exports and imports <strong>to</strong> GDP, (iv) <strong>the</strong> inflation rate, and (v) <strong>the</strong> ratio <strong>of</strong><br />
government expenditures <strong>to</strong> GDP. 6 With <strong>the</strong> exception <strong>of</strong> initial GDP per capita,<br />
all explana<strong>to</strong>ry variables are averaged over <strong>the</strong> sample period, 1980 <strong>to</strong> 2007. 7<br />
The results in Table 5.1 do not show any significant difference in <strong>the</strong> finance and<br />
growth relationship linked with <strong>the</strong> degree <strong>of</strong> natural resource reliance. The column<br />
1 results confirm <strong>the</strong> findings in <strong>the</strong> cross-country finance and growth literature<br />
showing a positive relationship between financial development and long-run economic<br />
growth, while <strong>the</strong> column 2 results do not show any differential effect <strong>of</strong><br />
financial development on growth in resource-based economies, since <strong>the</strong> coefficient<br />
on <strong>the</strong> interaction term enters negatively, but insignificantly. Columns 3 and 4<br />
confirm our findings using our alternative indica<strong>to</strong>r <strong>of</strong> natural resource abundance,<br />
Subsoil Assets, and our alternative indica<strong>to</strong>r <strong>of</strong> financial development, Liquid<br />
Liabilities, respectively. Among <strong>the</strong> control variables, government consumption<br />
enters negatively and significantly, while years <strong>of</strong> schooling enters positively and<br />
significantly. Initial GDP per capita enters negatively, though it is not consistently<br />
6<br />
Similar sets <strong>of</strong> conditioning information were used by Beck, Levine, and Loayza (2000) and Beck and<br />
Levine (2004).<br />
7<br />
In <strong>the</strong> context <strong>of</strong> this chapter, we will not address issues <strong>of</strong> causality and omitted variable. A large literature<br />
has shown that <strong>the</strong> relationship between financial development and growth is robust <strong>to</strong> controlling<br />
for biases due <strong>to</strong> endogeneity, measurement, and omitted variables. See Beck (2009) for a survey.<br />
©International Monetary Fund. Not for Redistribution
TABLE 5.1<br />
Finance, natural resources, and growth across countries<br />
(1) (2) (3) (4) (5) (6)<br />
GDP pc GDP pc GDP pc GDP pc Growth Growth<br />
growth growth growth growth in Gini in Gini<br />
Initial GDP per capita -0.00354* -0.00356* -0.00274 -0.00561***<br />
Private credit 0.00735*** 0.00798*** 0.0105*** -0.00521** -0.00467*<br />
Inflation 0.00185 0.00228 -0.00067 0.00142 1.30E-05 1.35E-05<br />
Government consumption -0.0112** -0.0114** -0.0101** -0.0101**<br />
Trade 0.00545** 0.00552** *0.00425 0.00203 -0.00088 -0.00079<br />
Years <strong>of</strong> schooling 0.00227*** 0.00222*** 0.00226** 0.00308*** 0.000685 0.000494<br />
<strong>Natural</strong> resource exports -0.0284*** 0.0360** -0.0368** 0.0212** 0.00453<br />
<strong>Natural</strong> resource exports* -0.00657 -0.0108<br />
Private credit<br />
Beck 87<br />
Liquid liabilities 0.0101***<br />
<strong>Natural</strong> resource exports*<br />
Liquid liabilities<br />
-0.00912<br />
Subsoil assets -0.00064<br />
Subsoil assets*<br />
Private credit<br />
-0.00033<br />
Initial Gini -0.0173*** -0.0173***<br />
GDP pc growth 0.0464 0.0533<br />
Constant 0.0450** 0.0462** 0.0412** 0.0699*** 0.0578*** 0.0581***<br />
Observations 104 104 102 102 64 64<br />
R-squared 0.419 0.421 0.411 0.381 0.322 0.329<br />
Note: The symbols *** , ** , and * denote statistical significance at <strong>the</strong> 1, 5, and 10 percent levels, respectively.<br />
significant, while trade openness enters positively, but not always with a significant<br />
coefficient. Finally, inflation enters insignificantly, which can be explained by <strong>the</strong><br />
negative impact that inflation has on financial development (Boyd, Levine, and<br />
Smith, 2001) and which thus indirectly affects economic growth. In unreported<br />
regressions, we also use a dummy variable for countries with <strong>Natural</strong> Resource<br />
Exports greater than 10 percent <strong>of</strong> GDP and confirm our findings. Finally, we<br />
control whe<strong>the</strong>r <strong>the</strong> insignificant coefficient estimate for <strong>the</strong> interaction term is not<br />
driven by <strong>the</strong> absence <strong>of</strong> a nonlinear term <strong>of</strong> Private Credit <strong>to</strong> GDP; controlling for<br />
a squared term <strong>of</strong> Private Credit <strong>to</strong> GDP does not change our findings.<br />
Columns 5 and 6 consider <strong>the</strong> relationship between finance and income<br />
inequality. Building on previous work by Beck, Demirgüç-Kunt, and Levine<br />
(2007), we regress <strong>the</strong> average annual growth rate in <strong>the</strong> Gini coefficient on financial<br />
development, <strong>Natural</strong> Resource Export, <strong>the</strong>ir interaction and a set <strong>of</strong> conditioning<br />
information. 8 We find that financial development has a negative relationship<br />
8 We focus on <strong>the</strong> change in income distribution ra<strong>the</strong>r than <strong>the</strong> level as complement <strong>to</strong> <strong>the</strong> GDP per<br />
capita regressions. Specifically, changes in relative and absolute poverty levels can be decomposed in<strong>to</strong><br />
changes in average income growth (i.e. GDP per capita growth) and changes in income inequality.<br />
While columns 1 <strong>to</strong> 4 <strong>of</strong> Table 5.1 focus on <strong>the</strong> former, columns 5 and 6 focus on <strong>the</strong> latter. See Beck,<br />
Demirgüç-Kunt, and Levine (2007) for a more detailed discussion.<br />
©International Monetary Fund. Not for Redistribution
88 Finance and Oil: Is There a Resource Curse?<br />
with <strong>the</strong> growth rate in <strong>the</strong> Gini coefficient, while <strong>Natural</strong> Resource Reliance has a<br />
positive, thus inequality-increasing, impact. The interaction term between <strong>the</strong> two,<br />
on <strong>the</strong> o<strong>the</strong>r hand, does not enter significantly.<br />
The results in Table 5.1 suggest that <strong>the</strong> finance and growth and <strong>the</strong> finance<br />
and inequality relationships hold as much for resource-based economies as for<br />
o<strong>the</strong>r economies. The insignificant interaction term between natural resource<br />
dependence and financial development, however, can also be interpreted as indicating<br />
that financial development does not have a dampening impact on <strong>the</strong><br />
negative role <strong>of</strong> natural resources in <strong>the</strong> overall growth process.<br />
In a second step, we test whe<strong>the</strong>r industries that are more dependent on external<br />
finance grow faster in countries with deeper financial systems and whe<strong>the</strong>r<br />
this relationship depends on a country’s reliance on natural resources. This test<br />
follows <strong>the</strong> seminal work by Rajan and Zingales (1998) who show that financial<br />
development is indeed beneficial for industries that depend more on external<br />
financing sources, where this demand is measured for large U.S. corporations that<br />
face a flat supply curve. Since financial deepening is especially relevant for manufacturing—a<br />
sec<strong>to</strong>r, on <strong>the</strong> o<strong>the</strong>r hand, that might easily be crowded out by<br />
natural resource abundance—this test seems especially relevant <strong>to</strong> our assessment<br />
whe<strong>the</strong>r <strong>the</strong> finance and growth relationship holds for natural resource countries<br />
as much as it does for o<strong>the</strong>r countries. Specifically, we extend <strong>the</strong> Rajan and<br />
Zingales (1998) test as follows:<br />
g(i,k) = α(i) + λ(k) + β1(External(k)∗Private Credit(i)) + γShare(i,k)<br />
+ β2(External(k)*Private Credit(i)*<strong>Natural</strong> <strong>Resources</strong> (i)) + ε(i,k) (2)<br />
where g(i,k) is growth <strong>of</strong> industry k in country i, averaged over <strong>the</strong> 1980s,<br />
External(k) is an industry-level measure <strong>of</strong> external dependence that does not vary<br />
across countries, α and λ are vec<strong>to</strong>rs <strong>of</strong> country and industry dummies, respectively,<br />
and Share is <strong>the</strong> initial share <strong>of</strong> industry k’s value added in <strong>to</strong>tal manufacturing<br />
value added <strong>of</strong> country i. By including industry- and country-specific<br />
effects, <strong>the</strong> coefficient β measures <strong>the</strong> differential growth impact <strong>of</strong> financial<br />
development on high-dependence industries relative <strong>to</strong> low-dependence industries.<br />
While β1 captures <strong>the</strong> overall effect <strong>of</strong> financial development on industry<br />
growth dependent on <strong>the</strong> need <strong>of</strong> <strong>the</strong> industry for external finance, β2 measures<br />
<strong>the</strong> differential effect <strong>of</strong> this interaction depending on <strong>the</strong> abundance or reliance<br />
<strong>of</strong> <strong>the</strong> country on natural resources. We also include <strong>the</strong> interaction between<br />
external dependence and natural resources. 9<br />
Table 5.2 shows weak evidence that <strong>the</strong> finance and growth relationship might<br />
be even stronger for countries that rely more on natural resources. While <strong>the</strong><br />
interaction between Private Credit and External Dependence enters positively<br />
and significantly, <strong>the</strong> triple interaction with <strong>Natural</strong> Resource Exports enters<br />
positively but insignificantly (column 1). We find similar findings when using<br />
9<br />
We do not have <strong>to</strong> (and cannot) include <strong>the</strong> interaction between Private Credit <strong>to</strong> GDP and natural<br />
resources in <strong>the</strong> presence <strong>of</strong> country dummies.<br />
©International Monetary Fund. Not for Redistribution
TABLE 5.2<br />
Industry growth, finance, and natural resources across countries<br />
Beck 89<br />
Industry growth Industry growth Industry growth<br />
Initial share -0.936*** -1.080*** -1.111***<br />
Private credit*external dependence 0.0804** 0.0535 0.0766**<br />
Private credit*external dependence*<br />
<strong>Natural</strong> resource exports<br />
0.0408<br />
External dependence*natural resource exports 0.111<br />
Private credit*external dependence*<br />
Subsoil assets<br />
0.00922<br />
External dependence*subsoil assets -0.0046<br />
Private credit*external dependence*<br />
<strong>Natural</strong> resource dummy<br />
0.163*<br />
External dependence*natural resource dummy -0.0677<br />
Observations 1,105 1,132 1,147<br />
R-squared 0.302 0.277 0.281<br />
Note: The symbols *** , ** , and * denote statistical significance at <strong>the</strong> 1, 5, and 10 percent levels, respectively.<br />
Subsoil Assets, though here <strong>the</strong> interaction between Private Credit and External<br />
Dependence also enters insignificantly, possibly due <strong>to</strong> multi-collinearity with <strong>the</strong><br />
triple interaction term (column 2). When we use <strong>the</strong> <strong>Natural</strong> Export Dummy<br />
(indicating <strong>Natural</strong> Exports greater than 10 percent <strong>of</strong> GDP), however, <strong>the</strong> triple<br />
interaction enters positively and significantly at <strong>the</strong> 10 percent level (column 3),<br />
providing some evidence that <strong>the</strong> role <strong>of</strong> <strong>the</strong> financial system in channeling funds<br />
<strong>to</strong> manufacturing industries that need <strong>the</strong>m most might be even more important<br />
in resource-based economies.<br />
Summarizing, this initial evidence does not provide strong evidence that <strong>the</strong><br />
relationship between finance and growth differs across countries according <strong>to</strong> <strong>the</strong><br />
degree <strong>of</strong> natural resource abundance, nor that <strong>the</strong> relationship between finance<br />
and changes in income inequality differs. Financial development is not less<br />
important for growth in resource-based economies, and it might be even more<br />
important. These results are certainly not conclusive. More work is needed in this<br />
area, especially using industry and firm-level data and disaggregating GDP in<strong>to</strong><br />
its resource-related and nonresource-related components. Preliminary work by<br />
Barajas, Chami, and Yousefi (2010) shows that <strong>the</strong>re might be a differential effect<br />
if one considers panel ra<strong>the</strong>r than cross-country regressions, with financial development<br />
having lower if not negative impact on growth in oil-exporting countries.<br />
In related work, van der Ploeg and Poelhekke (2009) show that financial development<br />
has a dampening impact on volatility in resource-based economies, with<br />
positive repercussions for economic growth. Apparently, <strong>the</strong>n, policymakers in<br />
resource-based economies should care about financial sec<strong>to</strong>r deepening as much<br />
as policymakers in o<strong>the</strong>r countries.<br />
Having shown that financial development is as important for economic<br />
growth in resource-based economies as in o<strong>the</strong>r countries, we now explore<br />
whe<strong>the</strong>r <strong>the</strong> development and structure <strong>of</strong> financial systems differs across countries<br />
with different degrees <strong>of</strong> resource abundance.<br />
©International Monetary Fund. Not for Redistribution
90 Finance and Oil: Is There a Resource Curse?<br />
FINANCE AND NATURAL RESOURCES—IS THERE<br />
A RESOURCE CURSE?<br />
This section explores whe<strong>the</strong>r <strong>the</strong>re is empirical evidence for a resource curse in<br />
financial development. Specifically, we assess whe<strong>the</strong>r economies more reliant on<br />
natural resources have lower levels <strong>of</strong> financial development after controlling for<br />
standard fac<strong>to</strong>rs associated with variation in financial development across countries.<br />
Controlling for economic development, we find that countries that rely more<br />
on natural resource exports have lower levels <strong>of</strong> Private Credit. Figure 5.1 presents<br />
a partial scatter plot <strong>of</strong> Private Credit and <strong>Natural</strong> Resource Exports, controlling<br />
for GDP per capita. Here we present data across countries, with data averaged<br />
over <strong>the</strong> period 2000 <strong>to</strong> 2007. In <strong>the</strong> following, we will use multivariate regression<br />
analysis <strong>to</strong> assess <strong>the</strong> robustness <strong>of</strong> this finding while controlling for o<strong>the</strong>r<br />
determinants <strong>of</strong> financial development.<br />
The literature has pointed <strong>to</strong> macroeconomic stability and <strong>the</strong> efficiency <strong>of</strong> <strong>the</strong><br />
contractual and information frameworks as important determinants <strong>of</strong> financial<br />
sec<strong>to</strong>r development (Boyd, Levine, and Smith, 2001; Djankov, McLiesh, and<br />
Shleifer, 2007). In our analysis, we <strong>the</strong>refore control for (i) <strong>the</strong> log <strong>of</strong> real GDP<br />
per capita, averaged over <strong>the</strong> sample period (ii) <strong>the</strong> average inflation rate between<br />
2000 and 2007, (iii) time <strong>to</strong> enforce a contract in number <strong>of</strong> days, and (iv) <strong>the</strong><br />
efficiency <strong>of</strong> <strong>the</strong> credit information system, with <strong>the</strong> latter two measures averaged<br />
over <strong>the</strong> period 2003 <strong>to</strong> 2007. Specifically, we run <strong>the</strong> following regressions.<br />
Private Credit (i) = β<strong>Natural</strong> <strong>Resources</strong> (i) + γ’C(i) + ε(i) (3)<br />
In addition <strong>to</strong> <strong>the</strong> two financial system indica<strong>to</strong>rs introduced above, we<br />
focus on several o<strong>the</strong>r indica<strong>to</strong>rs, all from <strong>the</strong> Financial Development and<br />
Structure Database (Beck, Demirgüç-Kunt, and Levine, 2010). The Loan-<br />
Deposit Ratio is a measure <strong>of</strong> intermediation efficiency and is <strong>the</strong> ratio <strong>of</strong> <strong>to</strong>tal<br />
bank claims outstanding on domestic nonfinancial sec<strong>to</strong>rs <strong>to</strong> <strong>to</strong>tal bank deposits.<br />
Higher ratios indicate higher intermediation efficiency; ratios above one,<br />
however, might indicate overheating <strong>of</strong> <strong>the</strong> financial system. We also use two<br />
indica<strong>to</strong>rs <strong>to</strong> gauge <strong>the</strong> development <strong>of</strong> <strong>the</strong> s<strong>to</strong>ck market. Specifically, S<strong>to</strong>ck<br />
Market Capitalization <strong>to</strong> GDP is a measure <strong>of</strong> s<strong>to</strong>ck market size relative <strong>to</strong> real<br />
economic activity, and S<strong>to</strong>ck Market Turnover is an indica<strong>to</strong>r <strong>of</strong> s<strong>to</strong>ck market<br />
trading relative <strong>to</strong> s<strong>to</strong>ck market capitalization and <strong>the</strong>refore a measure <strong>of</strong> <strong>the</strong><br />
liquidity <strong>of</strong> <strong>the</strong> market.<br />
In addition <strong>to</strong> <strong>the</strong> financial development indica<strong>to</strong>rs defined above, we consider <strong>the</strong><br />
relationship between natural resource reliance and two indica<strong>to</strong>rs <strong>of</strong> financial structure,<br />
that is, <strong>the</strong> degree <strong>to</strong> which a financial system is market-based or bank-based.<br />
Following Beck and Levine (2002), we define Structure-Size as <strong>the</strong> ratio <strong>of</strong> S<strong>to</strong>ck<br />
Market Capitalization and Bank Assets, where <strong>the</strong> latter is defined as <strong>to</strong>tal banking<br />
claims on <strong>the</strong> nonfinancial (private and public) domestic sec<strong>to</strong>rs. Higher ratios would<br />
indicate a financial system that is more market-based. Structure-Efficiency is defined as<br />
©International Monetary Fund. Not for Redistribution
Figure 5.1<br />
Financial development and natural resource dependence<br />
Private Credit <strong>to</strong> GDP<br />
1<br />
.5<br />
0<br />
-.5<br />
-1<br />
-.2 0 .2 .4 .6<br />
<strong>Natural</strong> Resource Exports<br />
Private credit/GDP per capita Fitted values<br />
Beck 91<br />
<strong>the</strong> product <strong>of</strong> S<strong>to</strong>ck Market Turnover and banks’ Net Interest Margin (a negative<br />
indica<strong>to</strong>r <strong>of</strong> bank efficiency). Higher numbers would again indicate a financial system<br />
that is more market-based.<br />
Table 5.3 shows that countries relying more heavily on natural resource<br />
exports have lower levels <strong>of</strong> financial development, even after controlling for o<strong>the</strong>r<br />
determinants <strong>of</strong> financial development. The effect is not only statistically large<br />
but also economically large. Take <strong>the</strong> example <strong>of</strong> column 1. One standard deviation<br />
higher <strong>Natural</strong> Resource Exports implies 10 percentage points lower Private<br />
Credit. 10 Consistent with <strong>the</strong> literature, <strong>the</strong>re is a negative relationship <strong>of</strong> inflation<br />
and contract enforcement inefficiency, while <strong>the</strong> efficiency <strong>of</strong> credit information<br />
sharing does not enter significantly. Consistent with Figure 5.1, <strong>the</strong> log <strong>of</strong><br />
GDP per capita enters positively and significantly. The column 2 results confirm<br />
this finding using Subsoil Assets as <strong>the</strong> indica<strong>to</strong>r <strong>of</strong> natural resources, while column<br />
3 confirms <strong>the</strong> results using Liquid Liabilities. The column 4 results show<br />
that lower levels <strong>of</strong> financial intermediation do not imply lower intermediation<br />
efficiency, since <strong>Natural</strong> <strong>Resources</strong> does not enter significantly in <strong>the</strong> regression<br />
<strong>of</strong> <strong>the</strong> aggregate Loan-Deposit Ratio. Results in columns 5 and 6 show that in<br />
economies that rely more on natural resources, s<strong>to</strong>ck exchanges are not smaller<br />
but <strong>the</strong>y are significantly less liquid. <strong>Natural</strong> Resource Exports enters insignificantly<br />
in <strong>the</strong> regression <strong>of</strong> S<strong>to</strong>ck Market Capitalization <strong>to</strong> GDP, but negatively<br />
and significantly in <strong>the</strong> regression <strong>of</strong> S<strong>to</strong>ck Market Turnover.<br />
10 It is important <strong>to</strong> note, however, that not all resource-based economies have a lower level <strong>of</strong> Private<br />
Credit than predicted by <strong>the</strong> o<strong>the</strong>r variables. Norway and o<strong>the</strong>r high-income countries have even<br />
higher levels <strong>of</strong> Private Credit than predicted by <strong>the</strong> o<strong>the</strong>r included variables, while many developing<br />
resource-based economies have significantly lower levels. This points <strong>to</strong> a need for fur<strong>the</strong>r exploration<br />
<strong>of</strong> <strong>the</strong> differential effects <strong>of</strong> natural resource abundance in future research.<br />
©International Monetary Fund. Not for Redistribution
92 Finance and Oil: Is There a Resource Curse?<br />
Finally, <strong>the</strong> results in columns 7 and 8 show that when measured by size,<br />
resource-based economies have financial systems that are more market-based,<br />
while when measured by efficiency, <strong>the</strong>y have systems that are more bank-based.<br />
Given <strong>the</strong> previous results, we can interpret this as suggesting that <strong>the</strong> marketbased<br />
nature, in terms <strong>of</strong> size, stems from <strong>the</strong> smaller banking systems in resourcebased<br />
economies, while <strong>the</strong> bank-based nature, in terms <strong>of</strong> efficiency, stems from<br />
<strong>the</strong> lower s<strong>to</strong>ck market liquidity in <strong>the</strong>se countries. We confirm <strong>the</strong> findings <strong>of</strong><br />
Table 5.3 using our alternative indica<strong>to</strong>rs <strong>of</strong> natural resource abundance, Subsoil<br />
Assets and <strong>the</strong> <strong>Natural</strong> Resource Export dummy.<br />
The results so far have focused on cross-country variation in financial development,<br />
but <strong>the</strong>re is also a large variation within countries over time. How do countries<br />
with different degrees <strong>of</strong> natural resource dependence develop <strong>the</strong>ir financial<br />
systems? Does natural resource abundance help or impede fur<strong>the</strong>r financial deepening<br />
as demand for financial services increases with economic development?<br />
Table 5.4 explores <strong>the</strong> within-country variation <strong>of</strong> financial development as a<br />
function <strong>of</strong> natural resource reliance. Specifically, here we present estimations with<br />
country-fixed effects <strong>to</strong> explore how Private Credit develops over time with GDP<br />
per capita. We focus on a longer sample period, using annual data over <strong>the</strong> period<br />
1960 <strong>to</strong> 2007. We use this sample <strong>to</strong> assess how <strong>the</strong> financial system deepens as a<br />
function <strong>of</strong> economic development and o<strong>the</strong>r macroeconomic indica<strong>to</strong>rs, and<br />
whe<strong>the</strong>r <strong>the</strong>se relationships vary according <strong>to</strong> <strong>the</strong> degree <strong>of</strong> natural resource reliance.<br />
FD(i,t) = β1 GDP per capita (i,t)+ β2 GDP per capita(i,t)*<strong>Natural</strong> <strong>Resources</strong><br />
(i,t) + β3 <strong>Natural</strong> <strong>Resources</strong>(i,t) + γ’C(i,t) + δ’X(i) + ε(i,t) (4)<br />
Unlike in Table 5.3, we include all indica<strong>to</strong>rs in logs so that we can interpret <strong>the</strong><br />
coefficient estimates as elasticities. While β1 shows <strong>the</strong> relationship between Private<br />
Credit and GDP per capita, β2 indicates whe<strong>the</strong>r this relationship is significantly<br />
higher or lower in countries with higher reliance on natural resources. We do not<br />
include indica<strong>to</strong>rs <strong>of</strong> <strong>the</strong> contractual or information framework, since <strong>the</strong> timeseries<br />
variation and data availability in <strong>the</strong>se indica<strong>to</strong>rs are limited. We do include<br />
country-specific fixed effects and o<strong>the</strong>r time-varying country variables as explained<br />
below. By including country-specific effects, we effectively explore relationships<br />
within countries over time and abstract from <strong>the</strong> cross-country variation.<br />
The results in Table 5.4 indicate that Private Credit increases with GDP per<br />
capita, but <strong>to</strong> a lower extent in countries that rely more on natural resource exports.<br />
While <strong>the</strong> elasticity <strong>of</strong> Private Credit <strong>to</strong> GDP per capita is almost one for countries<br />
with no <strong>Natural</strong> Resource Exports, this elasticity is significantly lower in countries<br />
with higher <strong>Natural</strong> <strong>Resources</strong>. The column 2 results show that <strong>the</strong> significant<br />
interaction between GDP per capita and <strong>Natural</strong> Resource Exports is not driven by<br />
general trade openness. While <strong>the</strong>re is a positive relationship between Private Credit<br />
and <strong>the</strong> trade share, this relationship is more muted in countries with a higher reliance<br />
on natural resources. 11 The column 3 regression, on <strong>the</strong> o<strong>the</strong>r hand, shows that<br />
<strong>the</strong> relationship inverts when using Subsoil Assets, an indica<strong>to</strong>r <strong>of</strong> natural resource<br />
11 When computing trade share <strong>to</strong> GDP net <strong>of</strong> natural resource exports, our findings are confirmed.<br />
©International Monetary Fund. Not for Redistribution
TABLE 5.3<br />
Financial development across countries<br />
(1) (2) (3) (4) (5) (6) (7) (8)<br />
Private Credit Private Credit Liquid Liabilities<br />
Loan-deposit<br />
ratio<br />
S<strong>to</strong>ck market<br />
capitalization<br />
S<strong>to</strong>ck market<br />
turnover Structure-Size<br />
Structure-<br />
Efficiency<br />
Inflation -1.750*** -0.39 -1.976*** -0.032 0.106*** -0.0296 0.45 0.00762**<br />
GDP per capita 0.181*** 0.188*** 0.178*** 0.0349 0.256*** 0.0911* 0.128** -0.000205<br />
Time <strong>to</strong> enforce contract -0.000178*** -0.000132** -6.72E-05 -0.000238** -0.000201 -0.000231 2.62E-05 -1.37E-05<br />
Information sharing 0.00568 0.0197 -0.0602** 0.0654*** -0.043 0.0452* -0.0226 0.00203*<br />
<strong>Natural</strong> resource exports -0.658*** -0.733*** 0.384 0.0148 -0.704*** 1.557*** -0.0251**<br />
Subsoil assets -0.0145**<br />
Observations 142 149 140 152 106 106 102 103<br />
R-squared 0.662 0.6 0.464 0.178 0.359 0.159 0.193 0.073<br />
Note: Robust standard errors in paren<strong>the</strong>ses. *** p < 0.01, ** p < 0.05, * p < 0.1.<br />
©International Monetary Fund. Not for Redistribution<br />
Beck 93
94 Finance and Oil: Is There a Resource Curse?<br />
TABLE 5.4<br />
Financial development over time<br />
(1) (2) (3) (4) (5)<br />
Private Credit Private Credit Private Credit Private Credit Private Credit<br />
GDP per capita 0.902*** 1.100*** 1.304*** 1.526*** 1.544***<br />
Inflation -0.0538*** -0.0543** -0.0481*** -0.0393*** -0.0477***<br />
<strong>Natural</strong> resource exports 2.014*** 1.655** -4.034***<br />
<strong>Natural</strong> resource exports*<br />
GDP per capita<br />
-0.418*** -0.375*** 0.205<br />
Trade 0.194*** 0.505*** 1.116*** 0.921*** 0.924***<br />
Trade * GDP per capita -0.0433** -0.132*** -0.112*** -0.122***<br />
<strong>Natural</strong> resource exports*<br />
Real exchange rate<br />
-0.000642** -0.00279***<br />
Real exchange rate*<br />
<strong>Natural</strong> resource exports<br />
0.00608***<br />
Subsoil assets*<br />
GDP per capita<br />
0.0232*** 0.000875<br />
Subsoil assets*<br />
Real exchange rate<br />
0.000601***<br />
Observations 3,428 3,428 4,31! 1,803 1,770<br />
R-squared 0.401 0.402 0.31” 0.36 0.352<br />
Number <strong>of</strong> countries 148 148 153 86 84<br />
Note: The symbols *** , ** , and * denote statistical significance at <strong>the</strong> 1, 5, and 10 percent levels, respectively.<br />
abundance ra<strong>the</strong>r than exports. Countries with higher natural resource wealth<br />
deepen <strong>the</strong>ir financial systems at a faster rate than o<strong>the</strong>r countries. This points <strong>to</strong> an<br />
important difference between measures <strong>of</strong> resource dependence and measures <strong>of</strong><br />
resource abundance, as already noted by Brunnschweiler and Bulte (2008), and<br />
indicates that natural resource abundance can actually be used <strong>to</strong> <strong>the</strong> advantage <strong>of</strong><br />
countries in financial deepening. An important caveat, however, is that Subsoil<br />
Assets is measured in 2000, that is, it includes information that was available at this<br />
point in time, not necessarily in 1960.<br />
The results in columns 4 and 5 show that while real exchange rate appreciation<br />
leads <strong>to</strong> deeper financial systems (although economically it is a very small effect), this<br />
relationship is reversed for countries with a higher share <strong>of</strong> <strong>Natural</strong> Resource Exports.<br />
This might be <strong>the</strong> clearest evidence <strong>of</strong> a Dutch disease effect, that is, a crowding out<br />
<strong>of</strong> nonresource exports through an appreciating exchange rate can also crowd out<br />
financial development. Interestingly, when controlling for real exchange rate changes<br />
and <strong>the</strong>ir interaction with natural resource indica<strong>to</strong>rs, <strong>the</strong> interaction between <strong>the</strong><br />
natural resource indica<strong>to</strong>rs and GDP per capita turns insignificant, which would suggest<br />
that <strong>the</strong> resource curse in financial development does indeed work mainly<br />
through <strong>the</strong> Dutch disease effect <strong>of</strong> real exchange rate appreciation.<br />
Summarizing, resource-based economies have smaller banking systems and<br />
less liquid s<strong>to</strong>ck exchanges than predicted by <strong>the</strong>ir level <strong>of</strong> economic development,<br />
<strong>the</strong>ir degree <strong>of</strong> monetary stability, and <strong>the</strong> efficiency <strong>of</strong> <strong>the</strong>ir contractual<br />
and informational frameworks. As resource-based economies develop economically,<br />
<strong>the</strong>ir financial systems deepen at a slower rate than in o<strong>the</strong>r countries,<br />
©International Monetary Fund. Not for Redistribution
Beck 95<br />
although this result holds for natural resource reliance (or dependence) ra<strong>the</strong>r<br />
than natural resource abundance. The fact that this result holds after controlling<br />
for <strong>the</strong> contractual and information frameworks suggests that <strong>the</strong> natural resource<br />
curse in financial development goes beyond <strong>the</strong> institutional natural resource<br />
curse documented in <strong>the</strong> literature (e.g., Beck and Laeven, 2006).<br />
The findings so far are consistent with both a demand-driven and a supplydriven<br />
s<strong>to</strong>ry, that is, with lower demand for financial services resulting in a smaller<br />
financial system or supply constraints preventing a financial system from developing.<br />
In <strong>the</strong> next two sections, we <strong>the</strong>refore focus first on indica<strong>to</strong>rs derived from<br />
banks’ financial statements <strong>to</strong> assess whe<strong>the</strong>r banks in commodity-based economies<br />
are different in <strong>the</strong>ir business model, efficiency, and stability, before turning <strong>to</strong> firmlevel<br />
data <strong>to</strong> assess whe<strong>the</strong>r clients are underserved in resource-based economies.<br />
BANKS IN RESOURCE-BASED ECONOMIES<br />
While <strong>the</strong> previous section provides some evidence <strong>of</strong> a natural resource curse in<br />
financial development, this section digs deeper by exploring banks’ business models,<br />
efficiency, stability, and asset composition <strong>to</strong> assess whe<strong>the</strong>r <strong>the</strong>re are significant<br />
differences across banks in countries that rely on natural resources <strong>to</strong> different<br />
degrees. We use data from Bankscope 12 over <strong>the</strong> period 2000 <strong>to</strong> 2007 and<br />
construct and compare indica<strong>to</strong>rs <strong>of</strong> business orientation, efficiency, and stability<br />
across banks and across countries with different degrees <strong>of</strong> natural resource reliance.<br />
We only include banks with at least two observations and countries with<br />
data on at least four banks. We restrict our sample <strong>to</strong> <strong>the</strong> largest 100 banks<br />
(in terms <strong>of</strong> assets) within a country so that our sample is not dominated by any<br />
specific country. Finally, we eliminate outliers in all variables by winsorizing at <strong>the</strong><br />
1st and 99th percentiles.<br />
To compare <strong>the</strong> business orientation <strong>of</strong> banks, we use four indica<strong>to</strong>rs suggested<br />
by Demirgüç-Kunt and Huizinga (2010): <strong>the</strong> ratio <strong>of</strong> fee-based income <strong>to</strong> <strong>to</strong>tal<br />
operating income; <strong>the</strong> importance <strong>of</strong> non-deposit funding <strong>to</strong> <strong>to</strong>tal funding; <strong>the</strong><br />
traditional loan-<strong>to</strong>-deposit ratio; and <strong>the</strong> ratio <strong>of</strong> liquid assets <strong>to</strong> <strong>to</strong>tal assets. To<br />
compare bank efficiency, we use three indica<strong>to</strong>rs. Our first efficiency indica<strong>to</strong>r is<br />
overhead cost, which is computed as <strong>to</strong>tal operating costs divided by <strong>to</strong>tal assets.<br />
Second, we use <strong>the</strong> cost-<strong>to</strong>-income ratio, which measures overhead costs relative<br />
<strong>to</strong> gross revenues, with higher ratios indicating lower levels <strong>of</strong> cost efficiency. And<br />
third, we use <strong>the</strong> net interest margin, which is net interest revenue relative <strong>to</strong> <strong>to</strong>tal<br />
earning assets. All three indica<strong>to</strong>rs decrease in efficiency, that is, higher numbers<br />
indicate less efficient banks. To compare <strong>the</strong> stability <strong>of</strong> banks across countries,<br />
we focus on <strong>the</strong> z-score, which is defined as <strong>the</strong> sum <strong>of</strong> capital-<strong>to</strong>-asset ratio and<br />
return on assets, divided by <strong>the</strong> standard deviation <strong>of</strong> return on assets. This score<br />
measures <strong>the</strong> distance—in number <strong>of</strong> standard deviations in return on assets—<br />
that separates a bank from insolvency, and so it increases as <strong>the</strong> stability <strong>of</strong> a bank<br />
12 Bankscope is a database owned by Bureau van Dijk.<br />
©International Monetary Fund. Not for Redistribution
96 Finance and Oil: Is There a Resource Curse?<br />
increases. We also assess differences across banks and countries in <strong>the</strong> capital-<strong>to</strong>asset<br />
ratio and in return on assets, two <strong>of</strong> <strong>the</strong> components <strong>of</strong> <strong>the</strong> z-score.<br />
We average data over <strong>the</strong> sample period (2000 <strong>to</strong> 2007) and run <strong>the</strong> following<br />
regression:<br />
Bank (i,j) = αB(i,j) + β1 GDP per capita(j) + β2 <strong>Natural</strong>(j) + ε(i,j) (5)<br />
where i stands for bank and j for country. B is a set <strong>of</strong> bank-level control variables,<br />
including size (measured in logs <strong>of</strong> millions <strong>of</strong> USD <strong>of</strong> <strong>to</strong>tal assets), <strong>the</strong> share <strong>of</strong><br />
non-loan earning assets in <strong>to</strong>tal assets, and <strong>the</strong> ratio <strong>of</strong> fixed assets <strong>to</strong> <strong>to</strong>tal assets.<br />
We control for <strong>the</strong> log <strong>of</strong> GDP per capita <strong>to</strong> avoid confounding <strong>the</strong> relationship<br />
between economic development and natural resource dependence with <strong>the</strong> relationship<br />
between natural resource dependence and bank characteristics. We apply<br />
standard errors clustered on <strong>the</strong> country level, that is, we allow for correlation<br />
between error terms <strong>of</strong> banks within countries but not across countries, in order<br />
<strong>to</strong> control for unobserved fac<strong>to</strong>rs across banks within a country.<br />
The results in Table 5.5 show few significant differences across banks according<br />
<strong>to</strong> <strong>the</strong> reliance on natural resources in <strong>the</strong> countries where <strong>the</strong>y operate.<br />
Regarding <strong>the</strong> business model, we find no significant differences in <strong>the</strong> share <strong>of</strong><br />
fee income, <strong>the</strong> reliance on non-deposit funding, or <strong>the</strong> loan-deposit ratio across<br />
countries with different degrees <strong>of</strong> reliance on natural resources. However, we do<br />
find that <strong>the</strong> share <strong>of</strong> liquid assets in <strong>to</strong>tal assets increases as we move from countries<br />
with no natural resource exports <strong>to</strong> resource-based economies. In terms <strong>of</strong><br />
efficiency, <strong>the</strong> only dimension where <strong>the</strong> degree <strong>of</strong> natural resource reliance seems<br />
<strong>to</strong> matter is <strong>the</strong> cost-<strong>to</strong>-income ratio, which is significantly lower in countries that<br />
are more resource-based. On <strong>the</strong> o<strong>the</strong>r hand, <strong>the</strong>re are no significant differences<br />
in <strong>the</strong> net interest margin or overhead costs across countries with different reliance<br />
on natural resources.<br />
Finally, we find no significant differences in <strong>the</strong> stability <strong>of</strong> banks across countries<br />
with different degrees <strong>of</strong> reliance on natural resources, but we do find a significant<br />
difference in capitalization and pr<strong>of</strong>itability. Banks in resource-based<br />
economies are significantly better capitalized and more pr<strong>of</strong>itable. The higher<br />
pr<strong>of</strong>itability also explains why we find a lower cost-<strong>to</strong>-income ratio for banks in<br />
resource-based economies, while <strong>the</strong>re are no significant differences in <strong>the</strong> o<strong>the</strong>r<br />
two efficiency indica<strong>to</strong>rs. We confirm all our findings using Subsoil Assets and<br />
<strong>the</strong> <strong>Natural</strong> Export dummy as indica<strong>to</strong>rs <strong>of</strong> <strong>the</strong> resource nature <strong>of</strong> economies.<br />
Turning <strong>to</strong> <strong>the</strong> control variables, we find that banks in richer countries have<br />
higher cost-<strong>to</strong>-income ratios but lower net-interest margins, and <strong>the</strong>y are more<br />
stable due <strong>to</strong> higher capitalization and despite lower pr<strong>of</strong>itability. Banks with a<br />
higher share <strong>of</strong> fixed assets have higher fee income and a lower loan-<strong>to</strong>-deposit<br />
ratio, and <strong>the</strong>y are less efficient and better capitalized. Banks with higher nonloan<br />
earning assets have higher fee income, lower loan-<strong>to</strong>-deposit ratio, higher<br />
liquid assets, and lower net-interest margins, and <strong>the</strong>y are less stable. Finally,<br />
larger banks rely more on non-deposit funding, have lower loan-<strong>to</strong>-deposit ratios,<br />
hold fewer liquid assets, are more efficient, and have lower capital-<strong>to</strong>-asset ratios<br />
and returns on assets.<br />
©International Monetary Fund. Not for Redistribution
TABLE 5.5<br />
Banks’ business model, efficiency, and stability across countries<br />
(1) (2) (3) (4) (5) (6) (7) (8) (9) (10)<br />
Fee income Non-deposit<br />
funding<br />
Loan-deposit<br />
ratio<br />
Liquid assets Cost-income<br />
ratio<br />
Overhead<br />
costs<br />
Net interest<br />
margin<br />
Z-score Equity-asset<br />
ratio<br />
Fixed assets 1.439** -0.0232 -0.0584*** -0.274 3.546*** 0.596*** 0.00269*** -0.544* 0.278** -0.0285<br />
Non-loan earning assets 0.192*** 0.00168 -0.0159*** 0.543*** 0.0385 0.00125 -0.000185*** -0.0617*** 0.0113 0.000809<br />
Size -0.408 0.558** -0.0474*** -1.673*** -1.708*** -0.409*** -0.00286*** -0.402 -1.990*** -0.0494**<br />
GDP per capita 0.927 -0.314 0.0248 -0.0659 2.066*** -0.0142 -0.00361*** 2.288*** 0.465** -0.0989***<br />
<strong>Natural</strong> resource exports 2.302 -1.636 0.222 16.49*** -24.86*** 0.341 0.0161 -0.911 6.247*** 2.277***<br />
Observations 2,160 3,503 3,432 3,555 3,422 3,446 3,437 3,525 3,554 3,547<br />
R-squared 0.061 0.014 0.137 0.525 0.155 0.409 0.268 0.075 0.341 0.132<br />
Number <strong>of</strong> countries<br />
*** p < 0.01, ** p < 0.05, * p < 0.1<br />
113 114 114 114 114 114 114 114 114 114<br />
©International Monetary Fund. Not for Redistribution<br />
ROA<br />
Beck 97
98 Finance and Oil: Is There a Resource Curse?<br />
In a separate analysis, we compare <strong>the</strong> balance sheet composition <strong>of</strong> banks<br />
in resource- and nonresource-based economies using data from <strong>the</strong> IMF’s<br />
International Financial Statistics. Specifically, we compare <strong>the</strong> asset shares <strong>of</strong><br />
(i) credit <strong>to</strong> <strong>the</strong> private sec<strong>to</strong>r, (ii) credit <strong>to</strong> national and subnational governments,<br />
(iii) credit <strong>to</strong> state-owned enterprises, (iv) foreign assets, and (v) liquid assets,<br />
comparing between banks in countries where <strong>Natural</strong> Resource Exports make up<br />
more than 10 percent <strong>of</strong> GDP and those in countries where <strong>the</strong>se exports make<br />
up less than 10 percent <strong>of</strong> GDP.<br />
Figure 5.2 shows that banks in resource-based economies invest a lower share<br />
<strong>of</strong> <strong>the</strong>ir assets in loans <strong>to</strong> <strong>the</strong> private sec<strong>to</strong>r or government, but a higher share in<br />
loans <strong>to</strong> state-owned enterprises. They also hold a larger share <strong>of</strong> <strong>the</strong>ir assets in<br />
both liquid and foreign assets. These differences are consistent with <strong>the</strong> previous<br />
findings reported in Table 5.5, but <strong>the</strong>y also show a weaker tendency <strong>of</strong> banks <strong>to</strong><br />
fulfill <strong>the</strong>ir intermediation function.<br />
Summarizing, comparisons <strong>of</strong> bank-level indica<strong>to</strong>rs suggest that <strong>the</strong> only differences<br />
between banks in natural-resource-based economies and those in o<strong>the</strong>r<br />
economies is that banks in <strong>the</strong> former countries are better capitalized, more liquid,<br />
and more pr<strong>of</strong>itable. There are no significant differences in <strong>the</strong> business<br />
model, in <strong>the</strong> overall efficiency, or in <strong>the</strong>ir stability. Comparisons <strong>of</strong> asset composition<br />
across <strong>the</strong>se two country groups also suggest that banks in resource-based<br />
economies are less engaged in financial intermediation. We will now turn <strong>to</strong><br />
demand-side data <strong>to</strong> complement this analysis.<br />
ACCESS TO FINANCE IN RESOURCE-BASED<br />
ECONOMIES<br />
While <strong>the</strong> previous sections focused on aggregate and supplier data <strong>to</strong> explore<br />
differences across countries with different levels <strong>of</strong> natural resource reliance, we<br />
now explore whe<strong>the</strong>r <strong>the</strong>se differences also translate in<strong>to</strong> differences in firms’<br />
financing patterns and financing obstacles. We rely on <strong>the</strong> World Bank/IFC<br />
Figure 5.2<br />
Asset composition in resource-based economies<br />
100%<br />
90<br />
80<br />
70<br />
60<br />
50<br />
40<br />
30<br />
20<br />
10<br />
0<br />
O<strong>the</strong>r countries<br />
Resource-abundant<br />
Liquid assets<br />
Foreign assets<br />
Credit <strong>to</strong> SOEs<br />
Credit <strong>to</strong> government<br />
Credit <strong>to</strong> private sec<strong>to</strong>r<br />
©International Monetary Fund. Not for Redistribution
Beck 99<br />
Enterprise Surveys, which have been conducted over <strong>the</strong> past eight years in almost<br />
100 countries with a consistent survey instrument. 13 The surveys try <strong>to</strong> capture<br />
businesses’ perceptions <strong>of</strong> <strong>the</strong> most important obstacles <strong>to</strong> enterprise operation<br />
and growth, but <strong>the</strong>y also include detailed information on management and<br />
financing arrangements <strong>of</strong> companies. Sample sizes vary between 250 and 1,500<br />
companies per country, and data are collected using ei<strong>the</strong>r simple random or<br />
random stratified sampling. The sample includes formal enterprises <strong>of</strong> all sizes, <strong>of</strong><br />
different ownership types, and across 26 industries in manufacturing, construction,<br />
services and transportation.<br />
We focus on several questions that capture firms’ financing patterns. First, we<br />
compute <strong>the</strong> share <strong>of</strong> enterprises with a loan or overdraft facility. Second, we<br />
compute <strong>the</strong> average share <strong>of</strong> working capital that is financed through external<br />
financial source across all enterprises in a country. Finally, we compute <strong>the</strong> average<br />
share <strong>of</strong> fixed assets that is financed with external financial source across all enterprises<br />
in a country. We also focus on a demand-side question, specifically, What<br />
share <strong>of</strong> firms in each country states that financing is a severe obstacle <strong>to</strong> its<br />
operation and growth?<br />
Figures 5.3 through 5.6 show <strong>the</strong> correlation between <strong>Natural</strong> <strong>Resources</strong> and<br />
four indica<strong>to</strong>rs <strong>of</strong> firm finance. We see a negative relationship between reliance on<br />
natural resources and (i) <strong>the</strong> share <strong>of</strong> firms with loans or lines <strong>of</strong> credit, (ii) <strong>the</strong><br />
average share <strong>of</strong> working capital financed externally, and (iii) <strong>the</strong> average share <strong>of</strong><br />
fixed asset investment financed externally. We note, however, that <strong>the</strong>se negative<br />
relationships are weak and noisy and driven by countries with a high share <strong>of</strong><br />
natural resource exports. The share <strong>of</strong> firms that rate financing as a severe obstacle<br />
for <strong>the</strong>ir operation and growth, on <strong>the</strong> o<strong>the</strong>r hand, is not significantly correlated<br />
with <strong>Natural</strong> <strong>Resources</strong> (Figure 5.6).<br />
Table 5.6, Panel A, shows that <strong>the</strong> negative relationship between access <strong>to</strong><br />
external finance and <strong>Natural</strong> <strong>Resources</strong> is consistent across firms <strong>of</strong> all sizes. To<br />
assess <strong>the</strong> relationship between firms’ financing patterns and natural resource reliance<br />
across different size classes, we recalculate <strong>the</strong> above-mentioned indica<strong>to</strong>rs<br />
within each country for small firms (fewer than 20 employees), mid-size companies<br />
(20 <strong>to</strong> 100 employees), and large enterprises (over 100 employees). For each<br />
size class, we compare <strong>the</strong> indica<strong>to</strong>rs, averaged across countries with <strong>Natural</strong><br />
Resource Exports <strong>of</strong> less than 10 percent <strong>of</strong> GDP and averaged across countries<br />
with <strong>Natural</strong> Resource Exports <strong>of</strong> more than 10 percent. Unlike in <strong>the</strong> scatter<br />
plots, we find significant differences between firms in resource-based economies<br />
and those in o<strong>the</strong>r economies, across all size groups. Firms <strong>of</strong> all sizes use less<br />
external finance in resource-based economies than <strong>the</strong>y do in o<strong>the</strong>r economies.<br />
The fact that in resource-based economies large firms use external financing as<br />
little as small firms do is in contrast <strong>to</strong> general cross-country findings, which show<br />
13 See www.enterpriseseurveys.org for more details. Similar surveys were previously conducted under<br />
<strong>the</strong> leadership <strong>of</strong> <strong>the</strong> World Bank and o<strong>the</strong>r IFIs in Africa (RPED) and <strong>the</strong> Central and Eastern<br />
European transition economies (BEEPS) in <strong>the</strong> 1990s, and <strong>the</strong>n worldwide in 2000 (World Business<br />
Environment Survey).<br />
©International Monetary Fund. Not for Redistribution
100 Finance and Oil: Is There a Resource Curse?<br />
Figure 5.3<br />
External finance in working capital and natural<br />
resource dependence<br />
External Finance for Working Capital<br />
60<br />
50<br />
40<br />
30<br />
20<br />
10<br />
0 .1 .2 .3 .4 .5<br />
<strong>Natural</strong> Resource Exports<br />
External finance in working capital Fitted values<br />
Figure 5.4<br />
External finance in fixed asset investment and natural<br />
resource dependence<br />
External Finance for Investment<br />
80<br />
60<br />
40<br />
20<br />
0<br />
0 .1 .2 .3 .4 .5<br />
<strong>Natural</strong> Resource Exports<br />
External finance for investment<br />
Fitted values<br />
significantly less external financing by small firms than by large enterprises (Beck,<br />
Demirgüç-Kunt, and Maksimovic, 2008).<br />
Table 5.6, Panel B, shows additional significant differences between firms in<br />
<strong>the</strong> two types <strong>of</strong> economies regarding <strong>the</strong>ir access <strong>to</strong> finance. Here, we dig deeper<br />
in<strong>to</strong> firms’ loan application process, splitting our sample again in<strong>to</strong> countries with<br />
<strong>Natural</strong> Resource Exports, averaged over 2000 <strong>to</strong> 2007, below 10 percent <strong>of</strong> GDP<br />
and above 10 percent <strong>of</strong> GDP. Line 1 shows that firms in resource-based economies<br />
are significantly less likely <strong>to</strong> have a loan, consistent with Figure 5.2. Among<br />
<strong>the</strong> firms that do not have a loan, however, <strong>the</strong>re is no significant difference in <strong>the</strong><br />
©International Monetary Fund. Not for Redistribution
Figure 5.5<br />
Share <strong>of</strong> firms with credit and natural resource<br />
dependence<br />
Share <strong>of</strong> firms with loans<br />
.8<br />
.6<br />
.4<br />
.2<br />
0<br />
0 .1 .2 .3 .4 .5<br />
<strong>Natural</strong> Resource Exports<br />
Share <strong>of</strong> firms with loans Fitted values<br />
Figure 5.6<br />
Financing obstacles and natural resource dependence<br />
Share <strong>of</strong> firms with severe<br />
financing obstacles<br />
.5<br />
.4<br />
.3<br />
.2<br />
.1<br />
0<br />
0 .1 .2 .3 .4<br />
<strong>Natural</strong> Resource Exports<br />
Share—severe obstacle Fitted values<br />
Beck 101<br />
tendency <strong>to</strong> apply for a loan across countries with and without resource abundance<br />
(line 2). Among <strong>the</strong> firms that decided not <strong>to</strong> apply, however, significantly<br />
more firms in resource-based economies stated that <strong>the</strong>y did not apply because <strong>of</strong><br />
cumbersome application procedures, while a significantly smaller share <strong>of</strong> nonapplicants<br />
stated as <strong>the</strong>ir reason that <strong>the</strong>y did not need a loan. Overall, <strong>the</strong> share <strong>of</strong><br />
firms stating that <strong>the</strong>y did not need a loan is about <strong>the</strong> same in both samples,<br />
which clearly suggests that it is not a lack <strong>of</strong> demand that drives <strong>the</strong> lower level <strong>of</strong><br />
financial development in resource-based economies. There are no significant differences<br />
in o<strong>the</strong>r reasons for not applying for a loan. In summary, <strong>the</strong>se data<br />
suggest that <strong>the</strong> lower use <strong>of</strong> external finance by firms in resource-based economies<br />
is not driven by demand but ra<strong>the</strong>r by supply-side constraints.<br />
©International Monetary Fund. Not for Redistribution<br />
.5
102 Finance and Oil: Is There a Resource Curse?<br />
TABLE 5.6<br />
Firms’ financing patterns and obstacles across countries<br />
Resource-based Nonresource-<br />
p-value T-<br />
economies based economies Difference stat<br />
Panel A: Use <strong>of</strong> external finance and financing obstacles across different size groups<br />
Small enterprises<br />
External finance in working capital 23.70 30.74 -7.042 0.0272**<br />
External finance in investment 28.06 37.48 -9.424 0.0122**<br />
Share <strong>of</strong> firms with loan 23.32 33.02 -9.709 0.0059***<br />
Share <strong>of</strong> firms with severe financing<br />
obstacles<br />
16.31 16.84 -0.525 0.8047<br />
Medium-size enterprises<br />
External finance in working capital 30.13 39.51 -9.377 0.0034***<br />
External finance in investment 30.29 41.90 -11.613 0.0004***<br />
Share <strong>of</strong> firms with loan 36.69 49.00 -12.317 0.003***<br />
Share <strong>of</strong> firms with severe financing<br />
obstacles<br />
13.55 12.90<br />
Large enterprises<br />
0.654 0.7031<br />
External finance in working capital 33.05 42.82 -9.773 0.0095***<br />
External finance in investment 34.83 43.40 -8.571 0.0216**<br />
Share <strong>of</strong> firms with loan 49.59 59.83 -10.243 0.0243**<br />
Share <strong>of</strong> firms with severe financing<br />
obstacles<br />
12.14 11.16 0.983 0.6147<br />
Panel B: The demand for loans across countries<br />
Do you have a loan? 30.783 42.079 -11.296 0.0066***<br />
If you do not have a loan, did you apply<br />
for a loan?<br />
Why did you not apply for a loan?<br />
13.271 13.395 -0.124 0.933<br />
No need for a loan—establishment has<br />
sufficient capital<br />
47.288 61.363 -14.075 0.001***<br />
Application procedures for loans or lines<br />
<strong>of</strong> credit are complex<br />
15.561 8.152 7.409 0.0003***<br />
Interest rates are not favorable 14.262 13.003 1.260 0.510<br />
Collateral requirements are <strong>to</strong>o high 6.865 6.342 0.523 0.646<br />
Did not think it would be approved 7.364 6.488 0.877 0.562<br />
Note: The symbols *** , ** , and * denote statistical significance at <strong>the</strong> 1, 5, and 10 percent levels, respectively.<br />
Table 5.7 shows weak evidence for lower bank outreach in resource-based<br />
economies and o<strong>the</strong>r countries. Here, we follow <strong>the</strong> model <strong>of</strong> Table 5.3 and<br />
regress indica<strong>to</strong>rs <strong>of</strong> branch penetration per capita and deposit accounts per<br />
capita on (i) log <strong>of</strong> GDP per capita, (ii) time <strong>to</strong> enforce a contract, (iii) efficiency<br />
<strong>of</strong> credit information sharing, (iv) inflation, and (v) <strong>Natural</strong> Resource Exports <strong>to</strong><br />
GDP or Subsoil Assets. We focus on branch penetration, measured as branches<br />
per capita, and account penetration, measured as deposit accounts per capita.<br />
Both <strong>Natural</strong> Resource Exports and Subsoil Assets enter negatively in all regressions,<br />
but only <strong>Natural</strong> Resource Exports enters significantly in <strong>the</strong> regression <strong>of</strong><br />
branches per capita. Overall, this seems <strong>to</strong> be weak evidence <strong>of</strong> a lower outreach<br />
in resource-based economies. It suggests that it is not <strong>the</strong> lack <strong>of</strong> geographic outreach,<br />
nor overall lower bank penetration, that drives <strong>the</strong> more limited access <strong>to</strong><br />
external finance by firms in resource-based economies.<br />
©International Monetary Fund. Not for Redistribution
TABLE 5.7<br />
Banking sec<strong>to</strong>r outreach across countries<br />
(1) (2) (3) (4)<br />
Branches per Accounts per Branches per Accounts per<br />
capita<br />
capita<br />
capita<br />
capita<br />
Inflation -0.668 -180.6**” -1.093 -128.8*<br />
GDP per capita 5.175*** 546.8*** 5.387*** 532.9***<br />
Time <strong>to</strong> enforce contract 0.000966 -0.243 0.000662 -0.137<br />
Information sharing 0.0824 -130.8** -0.0671 -113.6**<br />
<strong>Natural</strong> resource exports -5.528 -1.267**<br />
Subsoil assets -0.0532 -29.82<br />
Observations 114 82 114 83<br />
R-squared 0.283 0.504 0.302 0.483<br />
Note: The symbols *** , ** , and * denote statistical significance at <strong>the</strong> 1, 5, and 10 percent levels, respectively.<br />
SUMMARY AND POLICY IMPLICATIONS<br />
Beck 103<br />
This chapter tested for <strong>the</strong> existence <strong>of</strong> a natural resource curse in financial system<br />
development. We can summarize our findings as follows:<br />
• Banking systems are smaller in resource-based economies, and s<strong>to</strong>ck markets<br />
are less liquid, that is, <strong>the</strong>y have lower trading activity.<br />
• Financial deepening is less income-elastic in resource-based economies, which<br />
suggests that resource-based economies invest less in <strong>the</strong>ir economies as <strong>the</strong>y grow.<br />
• In resource-based economies, banks are more liquid, 14 more pr<strong>of</strong>itable, and<br />
better capitalized, but <strong>the</strong>y do not have different business models nor are<br />
<strong>the</strong>y more or less efficient or stable than banks in o<strong>the</strong>r countries. They also<br />
engage less in intermediation with <strong>the</strong> real economy.<br />
• Firms in resource-based economies are less likely <strong>to</strong> have a loan, and <strong>the</strong>y<br />
finance a lower share <strong>of</strong> <strong>the</strong>ir working capital and fixed asset investment<br />
using external finance; in addition, this gap is consistent across firms <strong>of</strong> all<br />
sizes. However, this is not due <strong>to</strong> a lack <strong>of</strong> demand.<br />
• Supply constraints, although not necessarily related <strong>to</strong> banks’ physical outreach,<br />
explain <strong>the</strong> more limited access firms have <strong>to</strong> external finance and<br />
<strong>the</strong>ir overall lower levels <strong>of</strong> financial development.<br />
Overall, <strong>the</strong>se findings point <strong>to</strong> a natural resource curse in financial development,<br />
with negative repercussions for resource-based economies. The finance and<br />
growth relationship seems as important for resource-based economies as for o<strong>the</strong>r<br />
economies, so that <strong>the</strong> under-investment in <strong>the</strong> financial sec<strong>to</strong>r will have longterm<br />
negative repercussions for economic growth. Country characteristics and<br />
policies related <strong>to</strong> financial sec<strong>to</strong>r deepening—macroeconomic stability, legal<br />
14 Note that <strong>the</strong> concept <strong>of</strong> liquidity is a different one in <strong>the</strong> case <strong>of</strong> banks and s<strong>to</strong>ck markets. In <strong>the</strong><br />
case <strong>of</strong> banks, it refers <strong>to</strong> <strong>the</strong> asset holdings, i.e., it is a s<strong>to</strong>ck variable, while in <strong>the</strong> case <strong>of</strong> financial<br />
markets, it refers <strong>to</strong> an activity, i.e., it is a flow variable.<br />
©International Monetary Fund. Not for Redistribution
104 Finance and Oil: Is There a Resource Curse?<br />
system efficiency, and an effective information sharing framework—hold true in<br />
resource-based economies as much as <strong>the</strong>y do in o<strong>the</strong>r economies. It seems,<br />
ra<strong>the</strong>r, that lack <strong>of</strong> investment in <strong>the</strong> necessary financial and human resources in<br />
<strong>the</strong> financial sec<strong>to</strong>r can explain <strong>the</strong> natural resource curse <strong>of</strong> finance.<br />
What are <strong>the</strong> policy implications <strong>of</strong> <strong>the</strong>se findings? Policymakers in resourcebased<br />
economies should care about <strong>the</strong> financial sec<strong>to</strong>r as much as policymakers<br />
in o<strong>the</strong>r economies, but <strong>the</strong>y will have <strong>to</strong> “make <strong>the</strong> extra effort” in order <strong>to</strong><br />
achieve <strong>the</strong> goals <strong>of</strong> inclusive financial deepening. In addition <strong>to</strong> <strong>the</strong> medium- <strong>to</strong><br />
long-term policies—macroeconomic stability and an effective contractual and<br />
information framework—competition seems a fruitful area for policymakers <strong>to</strong><br />
consider, given <strong>the</strong> high pr<strong>of</strong>itability <strong>of</strong> banks in resource-based markets, which<br />
might be partly due <strong>to</strong> lack <strong>of</strong> competition. Additional incentives for marketbased<br />
lending <strong>to</strong> <strong>the</strong> private sec<strong>to</strong>r might be ano<strong>the</strong>r important area, that is,<br />
through partial credit guarantees. It is important, however, that <strong>the</strong> necessary<br />
institutional framework first be in place in order <strong>to</strong> ensure <strong>the</strong> necessary governance<br />
structure for such interventions. It is also important <strong>to</strong> note that it is not<br />
<strong>the</strong> lack <strong>of</strong> resources that constrains intermediation in <strong>the</strong>se countries, but ra<strong>the</strong>r<br />
missing incentives.<br />
As mentioned in <strong>the</strong> Introduction, this is a first explora<strong>to</strong>ry study <strong>of</strong> <strong>the</strong> role<br />
<strong>of</strong> financial systems in resource-based economies, with many fur<strong>the</strong>r venues open<br />
for research. It will be important <strong>to</strong> analyze <strong>the</strong> role <strong>of</strong> financial sec<strong>to</strong>rs in<br />
resource-led boom and bust cycles, as well as <strong>the</strong> role <strong>of</strong> government interference<br />
and bank governance in resource-based economies. Disentangling financial intermediation<br />
in<strong>to</strong> different components—such as enterprise lending and household<br />
lending—seems a promising approach <strong>to</strong> better understanding <strong>the</strong> role <strong>of</strong> financial<br />
systems in <strong>the</strong> growth process <strong>of</strong> natural resource based economies. Finally,<br />
sound policy advice will also require exploring <strong>the</strong> role <strong>of</strong> <strong>the</strong> financial systems in<br />
mitigating <strong>the</strong> effects <strong>of</strong> commodity price changes and ensuing exchange rate<br />
volatility.<br />
REFERENCES<br />
Aghion, P., P. Bacchetta, R. Ranciere, and K. Rog<strong>of</strong>f, 2009, “Exchange Rate Regimes and<br />
Productivity Growth: The Role <strong>of</strong> Financial Development,” Journal <strong>of</strong> Monetary Economics<br />
Vol. 56, 494–551.<br />
Aghion, P., P. Howitt, and D. Mayer-Foulkes, 2005, “The Effect <strong>of</strong> Financial Development on<br />
Convergence: Theory and Evidence,” Quarterly Journal <strong>of</strong> Economics, Vol. 120, pp. 173–222.<br />
Barajas, A., R. Chami, and R. Yousefi, 2010, “The Finance and Growth Nexus Re-examined:<br />
Are There Cross-Region Differences?” unpublished (Washing<strong>to</strong>n: International Monetary<br />
Fund).<br />
Beck, T., 2006, “Creating an Efficient Financial System: Challenges in a Global Economy,” in<br />
Economic Growth, <strong>the</strong> proceedings <strong>of</strong> a G-20 seminar organized by <strong>the</strong> South African Reserve<br />
Bank, Banco de México, and People’s Bank <strong>of</strong> China, held in Pre<strong>to</strong>ria, South Africa, August<br />
4–5, 2005 .<br />
———, 2009, “The Econometrics <strong>of</strong> Finance and Growth,” in Palgrave Handbook <strong>of</strong><br />
Econometrics, Vol. 2, ed. by T. Mills and K. Patterson (London: Palgrave Macmillan).<br />
©International Monetary Fund. Not for Redistribution
Beck 105<br />
Beck, T., A. Demirgüç-Kunt, and R. Levine, 2007, “Finance, Inequality, and <strong>the</strong> Poor,” Journal<br />
<strong>of</strong> Economic Growth, Vol. 12, pp. 27–49.<br />
———, 2010, “Financial Institutions and Markets across Countries and Over Time: The<br />
Updated Financial Development and Structure Database” World Bank Economic Review,<br />
Vol. 24, pp. 77–92.<br />
Beck, T., A. Demirgüç-Kunt, and V. Maksimovic, 2005, “Financial and Legal Constraints <strong>to</strong><br />
Firm Growth: Does Firm Size Matter?” Journal <strong>of</strong> Finance, Vol. 60, pp. 137–77.<br />
———, 2008, “Financing Patterns around <strong>the</strong> World: Are Small Firms Different?” Journal <strong>of</strong><br />
Financial Economics, Vol. 89, pp. 467–87.<br />
Beck, T., and L. Laeven, 2006, “Institution Building and Growth in Transition Economies,”<br />
Journal <strong>of</strong> Economic Growth, Vol. 11, pp. 157–86.<br />
Beck, T., and R. Levine, 2002, “Industry Growth and Capital Allocation: Does Having a Market-<br />
or Bank-Based System Matter?” Journal <strong>of</strong> Financial Economics, Vol. 64, pp. 147– 80.<br />
———, 2004, “S<strong>to</strong>ck Markets, Banks and Growth: Panel Evidence,” Journal <strong>of</strong> Banking and<br />
Finance, Vol. 28, pp. 423–42.<br />
———, 2005, “Legal Institutions and Financial Development,” in Handbook <strong>of</strong> New<br />
Institutional Economics, ed. by C. Menard and M. Shirley (Dordrecht, The Ne<strong>the</strong>rlands:<br />
Springer).<br />
Beck, T., R. Levine, and N. Loayza, 2000, “Finance and <strong>the</strong> Sources <strong>of</strong> Growth,” Journal <strong>of</strong><br />
Financial Economics, Vol. 58, pp. 261–300.<br />
Besley, T., and T. Persson, 2010, “State Capacity, Conflict, and Development,” Econometrica,<br />
Vol. 78, pp. 1–34.<br />
Bhattacharyya, S., and R. Hodler, 2010, “Do <strong>Natural</strong> Resource Revenues Hinder Financial<br />
Development? The Role <strong>of</strong> Political Institutions,” unpublished (Oxford: Oxford University).<br />
Boyd, J., R. Levine, and B. Smith, 2001, “The Impact <strong>of</strong> Inflation on Financial Sec<strong>to</strong>r<br />
Performance,” Journal <strong>of</strong> Monetary Economics, Vol. 47, pp. 221–48.<br />
Brunnschweiler, C.N., and E. Bulte, 2008, “The Resource Curse Revisited and Revised: A Tale<br />
<strong>of</strong> Paradoxes and Red Herrings,” Journal <strong>of</strong> Environmental Economics and Management,<br />
Vol. 55, pp. 248–64.<br />
Collier, P., and A. Hoeffler, 2004, “Greed and Grievance in Civil Wars,” Oxford Economic Papers<br />
No. 56 (Oxford: Oxford University).<br />
Demirgüç-Kunt, A., and H. Huizinga, 2010, “Bank Activity and Funding Strategies,” Journal<br />
<strong>of</strong> Financial Economics, Vol. 98, pp. 626–50.<br />
Djankov, S., C. McLiesh, and A. Shleifer, 2007, “Private Credit in 129 Countries,” Journal <strong>of</strong><br />
Financial Economics, Vol. 84, pp. 299–329.<br />
Gylfason, T., 2001, “<strong>Natural</strong> <strong>Resources</strong>, Education and Economic Development,” European<br />
Economic Review No. 45, pp. 847–59.<br />
———, 2004, “<strong>Natural</strong> <strong>Resources</strong> and Economic Growth: From Dependence <strong>to</strong> Diversification,”<br />
CEPR Discussion Paper No. 4804 (London: Centre for Economic Policy Research).<br />
Isham, J., M. Woolcock, L. Pritchett, and G. Busby, 2005, “The Varieties <strong>of</strong> Resource<br />
Experience: <strong>Natural</strong> Resource Export Structures and <strong>the</strong> Political Economy <strong>of</strong> Economic<br />
Growth,” World Bank Economic Review, Vol. 19, pp. 141–74.<br />
La Porta, R., F. Lopez-de-Silanes, A. Shleifer, and R.W. Vishny, 1997, “Legal Determinants <strong>of</strong><br />
External Finance,” Journal <strong>of</strong> Finance, Vol. 52, pp. 1131–50.<br />
———, 1998, “Law and Finance,” Journal <strong>of</strong> Political Economy, Vol. 106, pp. 1113–55.<br />
Levine, R., 2005, “Finance and Growth: Theory and Evidence,” in Handbook <strong>of</strong> Economic<br />
Growth, ed. by P. Aghion and S. Durlauf (Dordrecht: The Ne<strong>the</strong>rlands: Elsevier Science).<br />
Mehlum, H., K. Moene, and R. Torvik, 2006, “Institutions and <strong>the</strong> Resource Curse,” Economic<br />
Journal, Vol. 116, pp. 1–20.<br />
Norman, C., 2009, “Rule <strong>of</strong> Law and <strong>the</strong> Resource Curse: Abundance versus Intensity,”<br />
Environmental and Resource Economics, Vol. 43, pp. 183–207.<br />
Papyrakis, E., and R. Gerlagh, 2004, “The Resource Curse Hypo<strong>the</strong>sis and its Transmission<br />
Channels,” Journal <strong>of</strong> Comparative Economics, Vol. 31, pp. 181–93.<br />
©International Monetary Fund. Not for Redistribution
106 Finance and Oil: Is There a Resource Curse?<br />
Rajan, R., and L. Zingales, 1998, “Financial Dependence and Growth,” American Economic<br />
Review, Vol. 88, pp. 559–87.<br />
Rioja, F., and N. Valev, 2004a, “Does One Size Fit All? A Reexamination <strong>of</strong> <strong>the</strong> Finance and<br />
Growth Relationship,” Journal <strong>of</strong> Development Economics, Vol. 74, pp. 429–47.<br />
———, 2004b, “Finance and <strong>the</strong> Sources <strong>of</strong> Growth at Various Stages <strong>of</strong> Economic<br />
Development,” Economic Inquiry, Vol. 42, No. 1, pp. 127–40.<br />
Van der Ploeg, F., 2011, “<strong>Natural</strong> <strong>Resources</strong>: Curse or Blessing?” Journal <strong>of</strong> Economic Literature,<br />
Vol. 49, No. 2, pp. 366–420.<br />
Van der Ploeg, F., and S. Poelhekke, 2009, “Volatility and <strong>the</strong> <strong>Natural</strong> Resource Curse,” Oxford<br />
Economic Papers, Vol. 61, pp. 727–60.<br />
———, 2010, “The Pungent Smell <strong>of</strong> ‘Red Herrings’: Subsoil Assets, Rents, Volatility and <strong>the</strong><br />
Resource Curse,” Journal <strong>of</strong> Environmental Economics and Management, Vol. 60,<br />
pp. 44–55.<br />
World Bank, 2006, Where Is <strong>the</strong> Wealth <strong>of</strong> Nations: Measuring Capital for <strong>the</strong> 21st Century<br />
(Washing<strong>to</strong>n).<br />
Wurgler, J., 2000, “Financial Markets and <strong>the</strong> Allocation <strong>of</strong> Capital,” Journal <strong>of</strong> Financial<br />
Economics, Vol. 58, pp. 187–214.<br />
©International Monetary Fund. Not for Redistribution
The Economics <strong>of</strong> Sovereign<br />
Wealth Funds: Lessons from<br />
Norway<br />
THOMAS EKELI AND AMADOU N.R. SY<br />
INTRODUCTION<br />
CHAPTER 6<br />
While most studies <strong>of</strong> sovereign wealth funds (SWFs) focus on <strong>the</strong>ir wealth management<br />
functions, particularly <strong>the</strong>ir investment strategies, it is essential <strong>to</strong> start<br />
with <strong>the</strong> basics. After all, an SWF is a <strong>to</strong>ol that must support <strong>the</strong> development<br />
goals a country has set for itself.<br />
Norway has one <strong>of</strong> <strong>the</strong> largest SWFs in <strong>the</strong> world, with <strong>to</strong>tal assets reaching<br />
approximately US$0.5 trillion. The Norwegian SWF is a petroleum fund,<br />
financed by <strong>the</strong> state’s share <strong>of</strong> oil and gas revenues—<strong>of</strong>ficially coined <strong>the</strong><br />
Government Pension Fund Global—and it has one <strong>of</strong> <strong>the</strong> most sophisticated<br />
investment strategies and most transparent institutional set-ups among its<br />
peers.<br />
Not surprisingly, most studies <strong>of</strong> sovereign wealth management discuss <strong>the</strong><br />
Norwegian experience in harnessing volatile oil revenues <strong>to</strong> safeguard wealth for<br />
future generations. However, an important issue <strong>of</strong>ten overlooked by <strong>the</strong> burgeoning<br />
literature on SWFs is that <strong>the</strong> Norwegian oil fund and its accompanying<br />
institutional and fiscal frameworks resulted from a long process, one that started<br />
by asking <strong>the</strong> right economic questions. Perhaps <strong>the</strong> key lesson from Norway’s<br />
experience is that policymakers in natural-resource-rich countries need <strong>to</strong> start<br />
<strong>the</strong> process <strong>of</strong> setting up an SWF (or deciding not <strong>to</strong>) by going back <strong>to</strong> <strong>the</strong> key<br />
question: how <strong>to</strong> achieve sustainable growth.<br />
O<strong>the</strong>r chapters in this book study <strong>the</strong>se economics principles in more detail,<br />
but Norway’s experience <strong>of</strong>fers important and practical policy examples relevant<br />
Thomas Ekeli is economic counselor at <strong>the</strong> Norwegian Delegation <strong>to</strong> <strong>the</strong> OECD, and Amadou<br />
N.R. Sy is deputy division chief in <strong>the</strong> Monetary and Capital Markets Department <strong>of</strong> <strong>the</strong> IMF. This<br />
chapter is based on <strong>the</strong> authors’ presentation at “<strong>Natural</strong> <strong>Resources</strong>, Finance, and Development:<br />
Confronting Old and New Challenges,” a high-level seminar organized by <strong>the</strong> Central Bank <strong>of</strong> Algeria<br />
and <strong>the</strong> IMF Institute, which <strong>to</strong>ok place in Algiers, on November 4 and 5, 2010. The authors can be<br />
contacted at Thomas.Ekeli@fin.dep.no and ASy@imf.org.<br />
©International Monetary Fund. Not for Redistribution<br />
107
108 The Economics <strong>of</strong> Sovereign Wealth Funds: Lessons from Norway<br />
<strong>to</strong> natural-resource-rich countries. First, implementing <strong>the</strong> Hartwick rule is one<br />
way <strong>to</strong> achieve sustainable growth and development, but it requires sound fiscal<br />
policy and public investment management. 1 As stressed by Hamil<strong>to</strong>n and Ley’s<br />
chapter in this volume, building wealth through fiscal policy involves (i) effective<br />
revenue instruments, (ii) fiscal rules <strong>to</strong> limit discretion, (iii) <strong>the</strong> operation <strong>of</strong><br />
natural resource funds, and (iv) effective public investment management. As a<br />
result, <strong>the</strong> decision <strong>to</strong> set up (or not) an SWF, although an important one, is only<br />
one part <strong>of</strong> <strong>the</strong> much broader growth equation.<br />
THE ECONOMICS OF SOVEREIGN WEALTH FUNDS<br />
To borrow from <strong>the</strong> title <strong>of</strong> an influential World Bank volume, we start by asking,<br />
“Where is <strong>the</strong> Wealth <strong>of</strong> Norway?” Norway’s GDP per capita is <strong>the</strong> second highest<br />
among OECD countries, and it is tempting <strong>to</strong> seek a causal link between its<br />
oil wealth and its economic wealth.<br />
Norway <strong>of</strong>fers a useful benchmark for sub-Saharan Africa’s natural-resourcerich<br />
countries. Whereas in Norway oil wealth (discounted petroleum wealth and<br />
financial assets) accounts for 9 percent <strong>of</strong> wealth per capita, in sub-Saharan Africa<br />
natural wealth dominates at a whopping 50 percent <strong>of</strong> <strong>to</strong>tal wealth. And while<br />
<strong>the</strong> discounted value <strong>of</strong> labor accounts for 82 percent <strong>of</strong> Norwegian wealth,<br />
intangible wealth (both human and social capital) is small in sub-Saharan Africa,<br />
making up just 35 percent <strong>of</strong> <strong>to</strong>tal wealth. That is much lower than <strong>the</strong> 60 <strong>to</strong> 70<br />
percent in a typical developing country (see Hamil<strong>to</strong>n, 2010) and is indicative <strong>of</strong><br />
a low return on <strong>to</strong>tal assets.<br />
Norway’s management <strong>of</strong> its oil revenues has been successful in many respects,<br />
but it is clear from <strong>the</strong> evidence above that Norway’s affluence is due <strong>to</strong> many<br />
fac<strong>to</strong>rs o<strong>the</strong>r than petroleum. The Norwegian experience highlights <strong>the</strong> importance<br />
<strong>of</strong> fac<strong>to</strong>rs o<strong>the</strong>r than a sound management <strong>of</strong> natural resources revenues in<br />
establishing sustainable growth. Unlike <strong>the</strong> case in most developing countries rich<br />
in natural resources, productivity has been <strong>the</strong> key <strong>to</strong> welfare in Norway, not oil.<br />
It is also clear that <strong>the</strong> sources <strong>of</strong> growth in Norway and o<strong>the</strong>r OECD countries<br />
involve a number <strong>of</strong> policies, including stability-oriented macroeconomic policies,<br />
flexible and competitive product markets, a high degree <strong>of</strong> exposure <strong>to</strong> foreign<br />
trade, flexible labor markets, adequate education and training, a low level <strong>of</strong><br />
taxation, and significant public spending on research and development.<br />
It is <strong>the</strong>refore useful, especially for policymakers in countries where new discoveries<br />
<strong>of</strong> natural resources have been made recently, <strong>to</strong> take a step back and look<br />
at <strong>the</strong> bigger question, that is, <strong>the</strong> process that may lead <strong>to</strong> sustainable growth and<br />
which may or may not involve <strong>the</strong> establishment <strong>of</strong> an SWF. The first step is <strong>to</strong><br />
ask how <strong>to</strong> achieve sustainable growth and development in resource-dependent<br />
economies.<br />
1 J.M. Hartwick (1977) showed that a simple policy rule—invest all resource rents in o<strong>the</strong>r assets—will<br />
yield sustainable development in countries with exhaustible resources.<br />
©International Monetary Fund. Not for Redistribution
Ekeli and Sy 109<br />
One answer is <strong>the</strong> Hartwick rule, which depends on (i) effective revenue instruments,<br />
(ii) fiscal rules <strong>to</strong> limit discretion, and (iii) effective public investment<br />
management (see Hamil<strong>to</strong>n and Ley’s chapter). Hamil<strong>to</strong>n (2010) shows that had<br />
sub-Saharan African countries followed <strong>the</strong> Hartwick rule, <strong>the</strong>ir hypo<strong>the</strong>tical<br />
produced capital would have been higher than <strong>the</strong>ir actual produced capital. He<br />
fur<strong>the</strong>r shows that <strong>the</strong> resource-rich countries in sub-Saharan Africa would have<br />
much larger per capita capital had <strong>the</strong>y followed <strong>the</strong> Hartwick rule. Specifically,<br />
he estimates that under that rule, countries such as Gabon would have had (hypo<strong>the</strong>tically)<br />
a 2005 per capita capital <strong>of</strong> about US$68,000, compared <strong>to</strong> its actual<br />
produced per capita capital <strong>of</strong> about US$19,000. His figures for Nigeria are about<br />
US$5,350, compared with about <strong>the</strong> actual US$1,350, and for Congo US$16,000<br />
instead <strong>of</strong> <strong>the</strong> actual US$3,700.<br />
THE (LONG) ROAD TO A SOVEREIGN WEALTH FUND<br />
The Norwegian model is <strong>the</strong> result <strong>of</strong> a long and ongoing process, which shows<br />
that <strong>the</strong> decision <strong>to</strong> set up an SWF is part <strong>of</strong> a much broader issue. Harding and<br />
van der Ploeg (2009) <strong>of</strong>fer a detailed account <strong>of</strong> Norwegian policy initiatives. The<br />
first oil field was discovered in Norway in 1969, and production started in 1971.<br />
During 1973–75, <strong>the</strong> Ministry <strong>of</strong> Finance and <strong>the</strong> Ministry <strong>of</strong> Industry initiated<br />
analytical work on a number <strong>of</strong> issues, including Dutch disease, <strong>the</strong> size <strong>of</strong><br />
reserves, <strong>the</strong> likely lifecycles <strong>of</strong> oil fields, and environmental concerns. Interestingly<br />
enough, policymakers did not seem <strong>to</strong> pay much attention <strong>to</strong> long-run spending<br />
needs at that time.<br />
In 1983, <strong>the</strong> Tempo Committee recommended that <strong>the</strong> government put its<br />
hydrocarbon revenues in a fund and spend only <strong>the</strong> real return on <strong>the</strong> assets<br />
accumulated in this fund (what Harding and van der Ploeg (2009) call <strong>the</strong><br />
“bird-in-<strong>the</strong>-hand” approach). The Tempo Committee report also discussed<br />
how such a petroleum fund and spending rules should work in practice. It<br />
stressed <strong>the</strong> importance <strong>of</strong> converting oil and gas in <strong>the</strong> ground in<strong>to</strong> financial<br />
assets in a fund and decoupling hydrocarbon income from spending. Owing <strong>to</strong><br />
political pressures <strong>to</strong> spend, however, <strong>the</strong> Tempo Committee discounted <strong>the</strong><br />
likelihood <strong>of</strong> such a stabilization fund being implemented and <strong>the</strong>refore recommended<br />
slow extraction <strong>of</strong> oil and gas as a way <strong>to</strong> distribute oil and gas wealth<br />
<strong>to</strong> future generations.<br />
Five years later, in 1988, <strong>the</strong> Steigum Committee concluded that government<br />
spending should depend on <strong>the</strong> permanent income <strong>of</strong> <strong>to</strong>tal hydrocarbon wealth,<br />
consisting <strong>of</strong> <strong>the</strong> financial reserves plus <strong>the</strong> value <strong>of</strong> oil and gas reserves in <strong>the</strong><br />
ground. It stressed that <strong>the</strong> calculation <strong>of</strong> <strong>to</strong>tal hydrocarbon wealth requires <strong>the</strong><br />
prediction <strong>of</strong> an optimal depletion path, given expected oil and gas prices, technology,<br />
and interest rates. In contrast <strong>to</strong> <strong>the</strong> Tempo Committee, <strong>the</strong> Steigum<br />
Committee did argue for <strong>the</strong> establishment <strong>of</strong> a financial hydrocarbon fund. It<br />
stressed <strong>the</strong> importance <strong>of</strong> regarding this fund and <strong>the</strong> value <strong>of</strong> oil and gas reserves<br />
in <strong>the</strong> ground as part <strong>of</strong> <strong>the</strong> same portfolio.<br />
©International Monetary Fund. Not for Redistribution
110 The Economics <strong>of</strong> Sovereign Wealth Funds: Lessons from Norway<br />
The Norwegian Government Petroleum Fund was finally established in 1990,<br />
19 years after production had started. The first net assets were accumulated in <strong>the</strong><br />
fund in 1996, and in 2001 (30 years after production started), <strong>the</strong> 4 percent birdin-<strong>the</strong>-hand<br />
rule was implemented. This means that four percent <strong>of</strong> <strong>the</strong> value <strong>of</strong><br />
<strong>the</strong> petroleum fund at <strong>the</strong> end <strong>of</strong> <strong>the</strong> previous year was used as a reference for how<br />
much should be extracted from <strong>the</strong> fund and used <strong>to</strong> fund <strong>the</strong> government’s nonoil<br />
deficit. The Petroleum Fund changed its name <strong>to</strong> <strong>the</strong> Government Pension<br />
Fund Global in 2006 in connection with a broader pension reform.<br />
However, it is important <strong>to</strong> note that <strong>the</strong> whole policy approach was very<br />
gradual from <strong>the</strong> period <strong>of</strong> discovery and extraction and that institutions were<br />
carefully calibrated and adapted <strong>to</strong> <strong>the</strong> lessons learned from initial mistakes and<br />
later experiences. It is also useful <strong>to</strong> note that Norway had already experienced a<br />
period <strong>of</strong> boom and bust in oil revenues before setting up <strong>the</strong> petroleum fund.<br />
Initially, Norway had used its oil revenues <strong>to</strong> expand its welfare system rapidly<br />
and <strong>to</strong> support <strong>the</strong> expansion <strong>of</strong> public services and employment. In <strong>the</strong> late<br />
1970s, as noted by Qvigstad (2011), <strong>the</strong> government lowered <strong>the</strong> pension age,<br />
increased agricultural subsidies, widened industrial policies, and reduced taxes.<br />
Oil revenues were not used <strong>to</strong> boost infrastructure, since <strong>the</strong> country had already<br />
reached a level <strong>of</strong> industrialization.<br />
The initial policy choice regarding oil revenues had serious consequences on<br />
both macroeconomic and financial stability as inflation increased, credit grew<br />
rapidly, <strong>the</strong> currency depreciated, and productivity stalled. As a result, after 1986<br />
<strong>the</strong> Norwegian government under<strong>to</strong>ok corrective policy actions by reducing <strong>the</strong><br />
fiscal deficit and increasing interest rates <strong>to</strong> slow down lending. However, higher<br />
interest rates in <strong>the</strong> aftermath <strong>of</strong> German unification led <strong>to</strong> a severe banking crisis<br />
in 1990 in Norway, and unemployment reached record levels. To resolve <strong>the</strong><br />
banking crisis, <strong>the</strong> Norwegian government fully nationalized three <strong>of</strong> <strong>the</strong> country’s<br />
four largest banks. 2 Two <strong>of</strong> <strong>the</strong> problem banks were subsequently privatized,<br />
while <strong>the</strong> government retained 34 percent <strong>of</strong> <strong>the</strong> third one.<br />
From a political economy perspective, <strong>the</strong> 1990 banking crisis provided<br />
Norwegian policymakers with an opportunity <strong>to</strong> push for structural reforms. As<br />
stressed by Qvigstad (2011), <strong>the</strong> Norwegian government leveraged <strong>the</strong> banking<br />
crisis <strong>to</strong> remove subsidies, close down government-owned enterprises, and deregulate<br />
<strong>the</strong> housing and electricity markets. It also implemented a tax reform that<br />
increased incentives <strong>to</strong> work and closed tax evasion loopholes, and reformed parliamentary<br />
budget procedures. 3<br />
It was only after a number <strong>of</strong> crises—<strong>the</strong> severe macroeconomic consequences<br />
<strong>of</strong> <strong>the</strong> initial choice for <strong>the</strong> use <strong>of</strong> oil revenues and <strong>of</strong> <strong>the</strong> banking crisis—that<br />
2 See Drees and Pazarbaşioğlu (1998) who contrast <strong>the</strong> Norwegian crisis with that in two o<strong>the</strong>r Nordic<br />
countries, Sweden and Finland, which also experienced a banking crisis at <strong>the</strong> same time.<br />
3 Norges Bank Deputy Governor Qvistad (2011) notes that “...when bad news fills newspapers and<br />
television programs, <strong>the</strong> elec<strong>to</strong>rate is more likely <strong>to</strong> accept necessary measures. In <strong>the</strong> long run,<br />
reforms prove <strong>to</strong> be very pr<strong>of</strong>itable even though <strong>the</strong>y are painful in <strong>the</strong> short run.”<br />
©International Monetary Fund. Not for Redistribution
Figure 6.1<br />
Norway—Timeline <strong>of</strong> crises and structural reforms<br />
First<br />
discovery<br />
<strong>of</strong> oil on<br />
Norwegian<br />
shelf<br />
Huge increase<br />
in fiscal<br />
expenditure<br />
Government<br />
Petroleum<br />
Fund Act<br />
Structural<br />
reforms<br />
Ekeli and Sy 111<br />
Norwegian policymakers implemented <strong>the</strong> key structural reforms crucial <strong>to</strong> <strong>the</strong><br />
country’s longer-term economic prosperity (Figure 6.1).<br />
One can <strong>the</strong>refore conclude that adequate structural reforms helped <strong>the</strong><br />
Norwegian economy take advantage <strong>of</strong> favorable terms-<strong>of</strong>-trade shocks <strong>to</strong> achieve<br />
robust economic growth and remain resilient <strong>to</strong> <strong>the</strong> global financial crisis. Over<br />
<strong>the</strong> past 20 years, Norway’s income has nearly tripled following positive terms<strong>of</strong>-trade<br />
shocks. The price <strong>of</strong> oil has increased and so did <strong>the</strong> price <strong>of</strong> o<strong>the</strong>r<br />
Norwegian exports (such as fish and aluminum), while <strong>the</strong> price <strong>of</strong> <strong>the</strong> most<br />
important imports has decreased.<br />
The policy process is ongoing, since issues need <strong>to</strong> be continually addressed.<br />
Harding and van der Ploeg (2009) question whe<strong>the</strong>r <strong>the</strong> current fiscal rule is sufficiently<br />
taking in<strong>to</strong> account <strong>the</strong> aging <strong>of</strong> <strong>the</strong> Norwegian population. The recent<br />
global financial crisis has shown how important it is <strong>to</strong> have a transparent communication<br />
strategy, given <strong>the</strong> short-term volatility and tail shocks inherent in<br />
financial assets. More generally, research in finance is still working on <strong>the</strong> issue <strong>of</strong><br />
deriving an asset allocation for SWFs that would take in<strong>to</strong> account <strong>the</strong> liability<br />
side <strong>of</strong> <strong>the</strong> fund. For instance, Amenc and o<strong>the</strong>rs (2010) study how <strong>the</strong> optimal<br />
asset allocation strategy takes in<strong>to</strong> account <strong>the</strong> s<strong>to</strong>chastic features <strong>of</strong> (i) where <strong>the</strong><br />
money is coming from (<strong>the</strong> endowment process), (ii) what <strong>the</strong> money is going <strong>to</strong><br />
be used for (expected liability value), and (iii) what types <strong>of</strong> assets are held in <strong>the</strong><br />
fund’s portfolio.<br />
SOVEREIGN WEALTH MANAGEMENT<br />
Fiscal<br />
rule and<br />
inflation<br />
target<br />
1969 1975 1986 1990 1992 1996 2001<br />
Source: Qvigstad, 2011.<br />
Several<br />
devaluations<br />
Banking<br />
crisis<br />
First<br />
transfer<br />
A key insight <strong>of</strong> <strong>the</strong> Norwegian model is that petroleum revenues are different.<br />
They stem from <strong>the</strong> depletion <strong>of</strong> real wealth, <strong>the</strong>y are volatile and uncertain due<br />
<strong>to</strong> price and volume changes, and <strong>the</strong>y pose a number <strong>of</strong> governance challenges,<br />
including <strong>the</strong> appearance <strong>of</strong> “free money.” A key policy question is <strong>the</strong>refore how<br />
<strong>to</strong> transform <strong>the</strong>se volatile revenues in<strong>to</strong> a smooth consumption path.<br />
Norway’s chosen solution—establishing a petroleum fund and using a fiscal<br />
rule—separates savings policy from <strong>the</strong> savings instrument. The choice <strong>of</strong> savings<br />
policy stems from <strong>the</strong> need <strong>to</strong> decouple spending from <strong>the</strong> petroleum cash flow,<br />
©International Monetary Fund. Not for Redistribution
112 The Economics <strong>of</strong> Sovereign Wealth Funds: Lessons from Norway<br />
and <strong>the</strong> choice <strong>of</strong> savings instrument arises from <strong>the</strong> need <strong>to</strong> address <strong>the</strong> governance<br />
<strong>of</strong> savings. As a result, large and volatile oil revenues are split between<br />
domestic spending and oil fund savings.<br />
The Norwegian petroleum fund is fully integrated with <strong>the</strong> state budget and<br />
builds on existing institutions <strong>to</strong> streng<strong>the</strong>n <strong>the</strong> budget process. The government<br />
collects taxes from all sec<strong>to</strong>rs <strong>of</strong> <strong>the</strong> economy, including <strong>the</strong> petroleum sec<strong>to</strong>r, and<br />
transfers <strong>the</strong> surplus <strong>to</strong> <strong>the</strong> petroleum fund, but only after all government expenditures<br />
are paid. This means that it is only through responsible fiscal policy that<br />
reserves will accumulate in <strong>the</strong> fund, and <strong>the</strong> fund will <strong>the</strong>n be a reflection <strong>of</strong><br />
accumulated budget surpluses (and financial returns). The fiscal guideline since<br />
2001 mandates that <strong>the</strong> government should aim <strong>to</strong> use annually <strong>the</strong> estimated<br />
long-term real return on <strong>the</strong> Government Pension Fund Global, set at 4 percent.<br />
In <strong>the</strong> past 10 years, fiscal policy in Norway has <strong>the</strong>refore been geared <strong>to</strong>ward<br />
a cyclically adjusted non-oil deficit, which corresponds <strong>to</strong> 4 percent <strong>of</strong> <strong>the</strong> fund<br />
every year. The fiscal framework allows <strong>the</strong> non-oil budget deficit <strong>to</strong> deviate from<br />
<strong>the</strong> 4 percent path, that is, <strong>to</strong> undertake countercyclical fiscal policy, while <strong>the</strong><br />
4 percent rule remains an important medium-term anchor for fiscal policy.<br />
The chosen spending rule aims <strong>to</strong> use <strong>the</strong> real return <strong>of</strong> <strong>the</strong> assets in <strong>the</strong> petroleum<br />
fund, as prescribed by <strong>the</strong> bird-in-<strong>the</strong>-hand approach. It is <strong>the</strong>refore more<br />
conservative than a permanent-income rule linked <strong>to</strong> <strong>the</strong> sum <strong>of</strong> financial assets<br />
and petroleum assets, and partly reflects Norway’s demographics and attendant<br />
large future spending commitments. Following such a rule allows <strong>the</strong> real value<br />
<strong>of</strong> <strong>the</strong> petroleum fund <strong>to</strong> be kept stable while spending its estimated sustainable<br />
income, which is akin <strong>to</strong> perpetuity where equal amounts could be withdrawn<br />
forever. The oil fund is only invested abroad in financial assets in order <strong>to</strong> protect<br />
<strong>the</strong> domestic economy, diversify risks, and maximize returns. Toge<strong>the</strong>r, <strong>the</strong> oil<br />
fund and <strong>the</strong> savings policy serve as a macroeconomic stabilization <strong>to</strong>ol that protects<br />
<strong>the</strong> non-oil economy from overheating and deindustrialization by (i) investing<br />
fund assets abroad, and (ii) deciding on an appropriate amount <strong>of</strong> oil income<br />
<strong>to</strong> take in<strong>to</strong> <strong>the</strong> domestic economy through <strong>the</strong> state budget.<br />
The oil fund does not invest in domestic assets, ei<strong>the</strong>r physical or financial.<br />
The Norwegian government has decided not <strong>to</strong> invest <strong>the</strong>se revenues in such<br />
domestic assets as infrastructure and human capital, because it prefers <strong>to</strong> invest in<br />
<strong>the</strong>m through <strong>the</strong> budget process and does not want <strong>the</strong> oil fund <strong>to</strong> be a second<br />
budget for less qualified projects. Moreover, <strong>the</strong>re is no general lack <strong>of</strong> capital for<br />
private projects in Norway, and expanding domestic real investment would carry<br />
<strong>the</strong> risk <strong>of</strong> reducing <strong>the</strong> return on investment. Similarly, investing in financial<br />
domestic assets using oil revenues (which are not akin <strong>to</strong> national savings) could<br />
make <strong>the</strong> economy more cyclical. Such a process would also be at <strong>the</strong> mercy <strong>of</strong><br />
poor governance practices.<br />
Instead, <strong>the</strong> oil fund invests only in foreign assets, mostly financial ones. This<br />
is an efficient way <strong>of</strong> achieving capital outflows that reflect current account surpluses,<br />
and it shelters <strong>the</strong> domestic economy from overheating and deindustrialization.<br />
International financial assets, such as bonds and equities, are liquid and<br />
are traded in relatively efficient markets, which help spread risks. Foreign physical<br />
©International Monetary Fund. Not for Redistribution
Figure 6.2<br />
Norway—Timeline <strong>of</strong> major changes in investment strategy<br />
Some<br />
emerging<br />
markets<br />
(EM)<br />
More EM,<br />
new ethical<br />
guidelines<br />
60%<br />
equities,<br />
small-cap<br />
-Real estate<br />
-All EM equity<br />
markets<br />
1998 2000 2002 2004 2006 2007 2008 2010<br />
Nongovernment<br />
bonds<br />
Source: Norwegian Ministry <strong>of</strong> Finance.<br />
Evaluation<br />
<strong>of</strong> active<br />
management<br />
Ekeli and Sy 113<br />
assets such as real estate, although less liquid and transparent than financial assets,<br />
can none<strong>the</strong>less <strong>of</strong>fer marginal benefits from a portfolio perspective.<br />
Of course, any investment strategy has <strong>to</strong> take in<strong>to</strong> account <strong>the</strong> inves<strong>to</strong>r’s circumstances<br />
and preferences. In <strong>the</strong> case <strong>of</strong> Norway, a starting principle is that <strong>the</strong><br />
general accumulation <strong>of</strong> assets belongs <strong>to</strong> <strong>the</strong> Norwegian people. The finance<br />
minister is responsible for <strong>the</strong> management and strategic asset allocation (<strong>the</strong> risk<br />
and return choice). The portfolio’s strong risk-bearing capacity reflects a very long<br />
investment horizon, no leverage, no claims for immediate withdrawal <strong>of</strong> funds,<br />
and no direct link <strong>to</strong> liabilities. The main risk is that political authorities might<br />
lose faith in <strong>the</strong> strategy for managing <strong>the</strong> petroleum wealth, so <strong>the</strong> investment<br />
strategy and governance arrangements need <strong>to</strong> bear this in mind.<br />
Moreover, circumstances and preferences might change, leading <strong>to</strong> adjustments<br />
in <strong>the</strong> investment strategy. Starting with liquid and nominal assets such as<br />
investment-grade bonds, <strong>the</strong> oil fund’s investment strategy has evolved over time<br />
<strong>to</strong> gradually add liquid real assets such as listed equities and less liquid nominal<br />
instruments such as high-yield and emerging market bonds, and, finally, <strong>to</strong><br />
include less liquid real assets such as emerging-market equities and unlisted real<br />
estate. Its strategic benchmark now allocates 60 percent <strong>of</strong> assets <strong>to</strong> equities and<br />
35 <strong>to</strong> 40 percent <strong>to</strong> fixed-income instruments, with <strong>the</strong> remainder (0–5 percent)<br />
going <strong>to</strong> real estate investments. In addition, <strong>the</strong> oil fund does not take controlling<br />
stakes in companies, capping ownership at 10 percent, and it follows ethical<br />
guidelines. (See Figure 6.2.)<br />
The oil fund’s governance structure leads <strong>to</strong> a clear mandate from political<br />
authorities. The governance <strong>of</strong> <strong>the</strong> oil fund is founded on an act passed by parliament<br />
and an investment mandate issued by <strong>the</strong> Ministry <strong>of</strong> Finance. As <strong>the</strong> fund<br />
owner, <strong>the</strong> Ministry <strong>of</strong> Finance has a separate asset management department with<br />
overall responsibility for managing <strong>the</strong> fund. It establishes its strategic asset allocation,<br />
both benchmarks and risk limits, and moni<strong>to</strong>rs and evaluates operation<br />
management. It is also responsible for investment practices and reports <strong>to</strong><br />
©International Monetary Fund. Not for Redistribution
114 The Economics <strong>of</strong> Sovereign Wealth Funds: Lessons from Norway<br />
Parliament. In contrast, <strong>the</strong> central bank, as <strong>the</strong> operational manager <strong>of</strong> <strong>the</strong> fund,<br />
has a separate entity within its organizational structure (Norges Bank Investment<br />
Management) charged with that responsibility. It implements <strong>the</strong> investment<br />
strategy and actively manages part <strong>of</strong> <strong>the</strong> fund <strong>to</strong> achieve excess returns. It is also<br />
responsible for risk control and reporting and exercises <strong>the</strong> fund’s ownership<br />
rights.<br />
Reporting and transparency both help <strong>to</strong> build support for <strong>the</strong> management<br />
<strong>of</strong> <strong>the</strong> oil revenues. The Ministry <strong>of</strong> Finance reports <strong>to</strong> Parliament on all important<br />
matters relating <strong>to</strong> <strong>the</strong> fund and publishes all <strong>the</strong> advice it receives from<br />
external consultants in an annual white paper. Performance, risk, and costs are<br />
reported every quarter and published on a website by <strong>the</strong> central bank. The focus<br />
<strong>of</strong> <strong>the</strong>se reports is on <strong>the</strong> contribution <strong>to</strong> value added in operational management.<br />
Press conferences are held on quarterly, shortly after an <strong>of</strong>ficial meeting with <strong>the</strong><br />
Ministry <strong>of</strong> Finance. Finally, an annual report listing all investments, both equities<br />
and fixed income, is made publicly available.<br />
In 2010, <strong>the</strong> result <strong>of</strong> this process was a $525 billion fund with a transparent<br />
governance structure and a mechanism integrated with fiscal policy, which allows<br />
large and volatile oil revenues <strong>to</strong> be split between domestic spending and oil fund<br />
savings. This result has helped Norway in its objective <strong>of</strong> achieving sustainable<br />
financial and macroeconomic growth and stability.<br />
CONCLUSIONS AND POLICY IMPLICATIONS<br />
Most studies <strong>of</strong> SWFs focus on sovereign wealth management considerations,<br />
including <strong>the</strong>ir asset allocation and governance. That focus is motivated by <strong>the</strong><br />
rapid growth in number and size <strong>of</strong> SWFs and by <strong>the</strong> emergence <strong>of</strong> non-oil funds,<br />
since some countries have been able <strong>to</strong> accumulate very large international<br />
reserves through <strong>the</strong>ir exports <strong>of</strong> non-natural resource products.<br />
However, a number <strong>of</strong> countries are now discovering that <strong>the</strong>y are endowed in<br />
natural resources while o<strong>the</strong>rs, having benefited from <strong>the</strong> acceleration <strong>of</strong> commodity<br />
prices, are considering setting up sovereign wealth funds. Our recommendation<br />
<strong>to</strong> policymakers in natural-resource-rich countries is <strong>to</strong> go back <strong>to</strong> <strong>the</strong><br />
key question <strong>of</strong> how <strong>to</strong> achieve sustainable economic growth and development. In this<br />
regard, Norway’s experience in economic and wealth management is useful.<br />
The decision <strong>to</strong> create an SWF and derive optimal asset allocations from it is<br />
only one part <strong>of</strong> a much bigger question. The first question is how <strong>to</strong> achieve<br />
sustainable growth and development in resource-dependent economies. One<br />
answer, given by <strong>the</strong> Hartwick rule, stresses <strong>the</strong> importance <strong>of</strong> effective revenue<br />
instruments, fiscal rules <strong>to</strong> limit discretion, and effective public investment management,<br />
which includes SWF management.<br />
The key considerations for an optimal asset allocation in natural-resource-rich<br />
countries should include <strong>the</strong>se:<br />
• A country’s starting point, including its stage <strong>of</strong> economic development and<br />
<strong>the</strong> strength <strong>of</strong> its public sec<strong>to</strong>r institutions and political culture;<br />
©International Monetary Fund. Not for Redistribution
Ekeli and Sy 115<br />
• The size <strong>of</strong> petroleum assets, <strong>the</strong>ir impact on <strong>the</strong> real economy, and <strong>the</strong><br />
choice <strong>of</strong> savings policy (whe<strong>the</strong>r a buffer fund or long-term savings fund);<br />
• Economic and investment policy choices, which include transforming <strong>the</strong><br />
revenues from petroleum <strong>to</strong> o<strong>the</strong>r assets such as human, physical, and financial<br />
assets; holding assets domestically or abroad; and diversifying assets and<br />
raising returns;<br />
• The risks and rewards <strong>of</strong> different allocation choices and how much <strong>to</strong><br />
spend <strong>to</strong>day and save for <strong>to</strong>morrow (discount rate); and<br />
A governance model will need <strong>to</strong> distribute responsibilities between various organizations<br />
while considering clear lines <strong>of</strong> responsibility and applying disciplinary pressures<br />
<strong>to</strong> perform. It will require acceptance and commitment by key stakeholders,<br />
aided by consultation and transparency, <strong>to</strong> ensure that <strong>the</strong> strategy is sustainable.<br />
As a result, policymakers, especially in developing countries, will have <strong>to</strong> look<br />
out for a number <strong>of</strong> pitfalls. First, and not surprisingly, lack <strong>of</strong> fiscal discipline<br />
does not help transform a windfall in<strong>to</strong> permanent income, and can instead lead<br />
<strong>to</strong> overheating and deindustrialization ra<strong>the</strong>r than sustained growth. Second,<br />
poorly chosen investments can lead <strong>to</strong> large-scale industry investments and public<br />
infrastructure projects with high political prestige but vague or low economic<br />
return, <strong>of</strong>ten <strong>to</strong> <strong>the</strong> detriment <strong>of</strong> investment in general education, health, and<br />
o<strong>the</strong>r social capital that is crucial <strong>to</strong> deliver sound and sustainable economic<br />
growth. Third, a loss <strong>of</strong> focus in structural policy can reorient policymakers so<br />
<strong>the</strong>y are concentrating on how <strong>to</strong> capture resource revenues, leading <strong>to</strong> slower<br />
growth in non-oil activity, falling labor supply, and disappointing productivity.<br />
Finally, resource wealth is <strong>of</strong>ten associated with weak government institutions,<br />
rent-seeking activities, and increased corruption as governance weakens.<br />
With increased awareness <strong>of</strong> <strong>the</strong> double-edged sword that resource revenues represent,<br />
countries are better placed <strong>to</strong> build more robust strategies for managing those<br />
resources in a manner that supports broad and durable economic development.<br />
REFERENCES<br />
Amenc, N., L. Martellini, F. Goltz, and V. Milhau, 2010, “New Frontiers in Benchmarking and<br />
Liability-Driven Investing” (London: EDHEC-Risk Institute), September.<br />
Drees, B., and C. Pazarbaşioğlu, 1998, “The Nordic Banking Crises: Pitfalls in Financial<br />
Liberalization?” IMF Occasional Paper No. 161 (Washing<strong>to</strong>n: International Monetary Fund).<br />
Hamil<strong>to</strong>n, K., 2010, “Sustainable Fiscal Policy in Mineral-Dependent Economies,” speech<br />
delivered at <strong>the</strong> Seminar on <strong>Natural</strong> <strong>Resources</strong>, Finance and Development: Confronting Old<br />
and New Challenges, organized by <strong>the</strong> IMF Institute in collaboration with <strong>the</strong> Bank <strong>of</strong><br />
Algeria, November 4–5, 2010.<br />
Harding, T., and F. van der Ploeg, 2009. “Is Norway’s Bird-in-Hand Stabilization Fund Prudent<br />
Enough? Fiscal Reactions <strong>to</strong> Hydrocarbon Windfalls and Graying Populations,” CESifo<br />
Working Paper No. 2830 (Munich: CESifo Group).<br />
Hartwick, J.M., 1977, “Intergenerational Equity and <strong>the</strong> Investing <strong>of</strong> Rents from Exhaustible<br />
<strong>Resources</strong>,” American Economic Review, Vol. 66, pp. 972–74.<br />
Qvigstad, J.F., 2011, “Managing Wealth—The Norwegian Experience,” Speech at a seminar<br />
hosted by FEDEA (Fundación de studios de economía aplicada), Madrid, March 23, 2011.<br />
©International Monetary Fund. Not for Redistribution
This page intentionally left blank<br />
©International Monetary Fund. Not for Redistribution
Fiscal Policy<br />
PART III<br />
©International Monetary Fund. Not for Redistribution
This page intentionally left blank<br />
©International Monetary Fund. Not for Redistribution
CHAPTER 7<br />
Primary Commodity Price Series:<br />
Lessons for Policymakers<br />
in Resource-Rich Countries<br />
KADDOUR HADRI<br />
INTRODUCTION<br />
This chapter investigates <strong>the</strong> challenges faced by policymakers when conducting<br />
a fiscal policy in resource-rich countries. These challenges become more acute in<br />
resource-rich countries in Africa, because in many <strong>of</strong> <strong>the</strong>m revenues from exporting<br />
primary commodities still account for <strong>the</strong> bulk <strong>of</strong> export earnings. We shall<br />
mainly consider three challenges: (i) <strong>the</strong> possible secular decline <strong>of</strong> real commodity<br />
prices, <strong>the</strong> so-called Prebish–Singer hypo<strong>the</strong>sis, (ii) <strong>the</strong> long cycles that characterize<br />
real commodity prices, (iii) <strong>the</strong> exceeding volatility <strong>of</strong> real commodity<br />
prices and <strong>the</strong> fact that this volatility is time varying.<br />
A fourth challenge is that many <strong>of</strong> <strong>the</strong>se primary commodities are exhaustible,<br />
which raises <strong>the</strong> question <strong>of</strong> equity across generations and <strong>the</strong> necessity <strong>to</strong> invest<br />
<strong>the</strong> rents from natural-resource extraction in<strong>to</strong> reproducible capital in order <strong>to</strong><br />
enjoy a constant stream <strong>of</strong> consumption, following <strong>the</strong> so-called Hartwick rule<br />
(see Hartwick, 1977; and Atkinson and Hamil<strong>to</strong>n, 2003). We will not deal<br />
directly with this fourth challenge in this chapter, because an analysis <strong>of</strong> commodity<br />
prices is <strong>of</strong> little help in tackling this challenge.<br />
We recall that <strong>the</strong> Prebish–Singer hypo<strong>the</strong>sis states that real commodity prices<br />
follow a downward secular trend. Prebish (1950) and Singer (1950) claimed that<br />
<strong>the</strong>re had been a downward long-term trend in <strong>the</strong>se prices and that this decline<br />
was likely <strong>to</strong> carry on. The main <strong>the</strong>oretical explanations given for this adverse<br />
long-term trend are: (i) income elasticities <strong>of</strong> demand for primary commodities<br />
Kaddour Hadri is pr<strong>of</strong>essor <strong>of</strong> economics and research direc<strong>to</strong>r for Economics Analysis and<br />
Behaviour at Queens University Management School, Belfast. This chapter is based on <strong>the</strong> author’s<br />
presentation at “<strong>Natural</strong> <strong>Resources</strong>, Finance, and Development: Confronting Old and New<br />
Challenges,” a high-level seminar organized by <strong>the</strong> Central Bank <strong>of</strong> Algeria and <strong>the</strong> IMF Institute,<br />
which <strong>to</strong>ok place in Algiers, on November 4 and 5, 2010. The author wishes <strong>to</strong> thank <strong>the</strong> seminar<br />
participants for <strong>the</strong>ir comments, as well as Rabah Arezki from <strong>the</strong> IMF Institute for suggesting this<br />
research and for suggestions that significantly shaped <strong>the</strong> paper. The author can be contacted at<br />
k.hadri@qub.ac.uk.<br />
©International Monetary Fund. Not for Redistribution<br />
119
120 Primary Commodity Price Series: Lessons for Policymakers in Resource-Rich Countries<br />
being lower than those for manufactures; (ii) absence <strong>of</strong> differentiation among<br />
commodity producers leading <strong>to</strong> highly competitive markets; (iii) productivity<br />
differentials between North and South; (iv) asymmetric market structures<br />
(oligopolistic rents for <strong>the</strong> North and zero economic pr<strong>of</strong>it for competitive commodity<br />
producers in <strong>the</strong> South; (v) <strong>the</strong> inability <strong>of</strong> wages <strong>to</strong> grow in <strong>the</strong> presence<br />
<strong>of</strong> an “unlimited” supply <strong>of</strong> labor at <strong>the</strong> subsistence wage in primary commodity<br />
producing countries (Lewis, 1954), which implies a zero trend, and (vi) a decline<br />
in demand from industrial countries.<br />
The consequences <strong>of</strong> <strong>the</strong> Prebish–Singer hypo<strong>the</strong>sis are very important for<br />
developing countries, because many <strong>of</strong> <strong>the</strong>m depend on only a few primary commodities<br />
<strong>to</strong> generate most <strong>of</strong> <strong>the</strong>ir export earnings. For instance, it is estimated<br />
that around 60 percent <strong>of</strong> <strong>the</strong>ir export earnings are obtained from primary commodities.<br />
For approximately 40 such countries, export earnings depend on <strong>the</strong><br />
production <strong>of</strong> three or fewer commodities. This overwhelming commodity reliance<br />
has serious policy consequences. In case <strong>of</strong> an actual long-run downward<br />
trend <strong>of</strong> <strong>the</strong> exported commodities, <strong>the</strong> concerned country might have <strong>to</strong> explore<br />
diversifying its export portfolio <strong>to</strong> include manufactures and services.<br />
The first empirical studies revealing a downward real price assumed that t y ,<br />
<strong>the</strong> logarithm <strong>of</strong> <strong>the</strong> real commodity price, is generated by a stationary process<br />
around a time trend (I(0)):<br />
yt = β0 + β1 t + εt,<br />
t = 1, … , T,<br />
where t is a linear trend and <strong>the</strong> random variable ε t is stationary with mean 0<br />
2<br />
and variance σ ε . The parameter <strong>of</strong> interest is <strong>the</strong> slope β 1, which is predicted<br />
<strong>to</strong> be negative under <strong>the</strong> Prebish–Singer hypo<strong>the</strong>sis. Grilli and Yang (1988),<br />
among o<strong>the</strong>rs, employing a data set <strong>of</strong> 24 annual commodity prices found that a<br />
weighted aggregate index dropped by 0.6 percent per year. O<strong>the</strong>r researchers<br />
assumed that commodity prices were generated by a so-called difference-stationary<br />
(DS or I(1)) model, implying that t y is nonstationary:<br />
Δ yt = β1 + νt,<br />
t = 1, … , T,<br />
where ν t is stationary and invertible. Some empirical studies employing equation (2)<br />
show evidence against <strong>the</strong> hypo<strong>the</strong>sis. In particular, Kim and o<strong>the</strong>rs (2003) found that<br />
relative commodity prices behave like unit root processes (nonstationary process), and<br />
only five commodity prices among <strong>the</strong> 25 commodity prices included in <strong>the</strong> Grilli–<br />
Wang index exhibit <strong>the</strong> negative trend predicted by <strong>the</strong> hypo<strong>the</strong>sis. It is well known,<br />
now, that if y t is a DS process, <strong>the</strong>n using equation (1) <strong>to</strong> test <strong>the</strong> null hypo<strong>the</strong>sis:<br />
β = 0 will result in acute size dis<strong>to</strong>rtions, leading <strong>to</strong> a wrong rejection <strong>of</strong> <strong>the</strong> null<br />
1<br />
when no trend is present, even asymp<strong>to</strong>tically.<br />
Alternatively, if <strong>the</strong> true generating process is given by equation (1) and we base<br />
our test on equation (2), our test becomes inefficient and less powerful than <strong>the</strong> one<br />
based on <strong>the</strong> correct equation. Therefore, when testing <strong>the</strong> Prebish–Singer hypo<strong>the</strong>sis<br />
we must first test <strong>the</strong> order <strong>of</strong> integration <strong>of</strong> our relative commodity prices in<br />
©International Monetary Fund. Not for Redistribution<br />
(1)<br />
(2)
Hadri 121<br />
order <strong>to</strong> use <strong>the</strong> right equation. The problem might be compounded by <strong>the</strong> presence<br />
<strong>of</strong> structural breaks in equation (1) or (2). In that case, <strong>the</strong> true generating<br />
process may be a trend-stationary process with breaks:<br />
y t DU DT t T<br />
* *<br />
t = β0 + β1 + δ t( ω ) + γ t( ω ) + εt,<br />
= 1, … , ,<br />
or, alternatively, a difference stationary with breaks:<br />
Δ y = t + D + DT +Δ t = … T<br />
* *<br />
t β1 δ t( ω ) γ t( ω ) εt,<br />
2, , ,<br />
* *<br />
*<br />
* *<br />
where DTt ( ω ) = t −Twhen t > T and 0 o<strong>the</strong>rwise, DUt ( ω ) = 1 if t > T<br />
* *<br />
* *<br />
and 0 o<strong>the</strong>rwise Dt( ω ) = 1 when t = T + 1 and 0 o<strong>the</strong>rwise, with T = [ ω T]<br />
*<br />
<strong>the</strong> break date with <strong>the</strong> associated break fraction ω ∈ (0,1) and [.] denotes <strong>the</strong><br />
integer part <strong>of</strong> <strong>the</strong> argument. As shown by Perron (1989), <strong>the</strong> properties <strong>of</strong> tests<br />
for <strong>the</strong> presence <strong>of</strong> a break in trend are also highly dependent on <strong>the</strong> order <strong>of</strong><br />
integration <strong>of</strong> <strong>the</strong> series concerned.<br />
To increase <strong>the</strong> power <strong>of</strong> <strong>the</strong>se tests we may use panel unit-root and/or stationarity<br />
tests, which are well known <strong>to</strong> be more powerful than <strong>the</strong>ir single-time series<br />
counter-part. However, in order <strong>to</strong> avoid <strong>the</strong> pretesting problem, we will also use<br />
<strong>the</strong> tests for <strong>the</strong> presence <strong>of</strong> linear trend and <strong>the</strong> tests for a broken trend, proposed<br />
by Harvey, Leybourne, and Taylor (2007 and 2009, respectively) which are both<br />
robust <strong>to</strong> whe<strong>the</strong>r shocks are generated by I(0) or I(1) processes. However, <strong>the</strong><br />
knowledge that commodity prices are stationary (mean reverting) or nonstationary<br />
is crucial for conducting an appropriate fiscal policy. In <strong>the</strong> case where commodity<br />
prices are mean reverting, any shock will have only a transi<strong>to</strong>ry effect,<br />
whereas if commodity prices are nonstationary, shocks imprint a permanent effect<br />
on those prices.<br />
The second aspect <strong>of</strong> real primary commodity prices that we will explore is <strong>the</strong><br />
identification <strong>of</strong> cycles. The presence <strong>of</strong> cycles, particularly long cycles, creates<br />
booms and busts in income and unemployment, necessitating <strong>the</strong> construction <strong>of</strong><br />
stable and sustainable budgets, that is, countercyclical budgets, also called structural<br />
budgets. The main explanations given for <strong>the</strong> presence <strong>of</strong> long-term cycles<br />
are <strong>the</strong>se:<br />
(i) Elasticities <strong>of</strong> supply and demand relative <strong>to</strong> price are low in <strong>the</strong> short term<br />
but increase with time. Therefore, prices come back <strong>to</strong> <strong>the</strong> long-run equilibrium<br />
after a peak.<br />
(ii) For nonrenewable resources, <strong>the</strong> answer <strong>to</strong> <strong>the</strong> question, Should we leave<br />
resources in <strong>the</strong> ground or extract <strong>the</strong>m? will depend on an arbitrage condition<br />
between <strong>the</strong> interest rate and <strong>the</strong> expected future <strong>of</strong> price increase<br />
(Hotelling, 1931). This leads <strong>to</strong> an inverse relationship between real interest<br />
rates and real commodity prices.<br />
(iii) Speculative bubbles may drive commodity prices away from <strong>the</strong>ir fundamentals<br />
until <strong>the</strong>y burst, pushing commodity prices back <strong>to</strong> <strong>the</strong>ir equilibrium<br />
(e.g., oil speculation during <strong>the</strong> recent peak).<br />
©International Monetary Fund. Not for Redistribution<br />
(3)<br />
(4)
122 Primary Commodity Price Series: Lessons for Policymakers in Resource-Rich Countries<br />
Finally, <strong>the</strong> last challenge when trying <strong>to</strong> conduct a successful fiscal policy in<br />
resource-rich countries is that most commodity prices are found <strong>to</strong> be volatile,<br />
and this volatility is time varying (UNCTAD, 2008; Mintz, 1967). The possible<br />
causes <strong>of</strong> price volatility are <strong>the</strong>se:<br />
• Supply shocks: wars, epidemics, wea<strong>the</strong>r, political unrest lead <strong>to</strong> shortfalls in<br />
production and <strong>to</strong> large price variances.<br />
• The switch <strong>to</strong> floating exchange rate regimes has increased <strong>the</strong> volatility <strong>of</strong><br />
commodity prices (Reinhart and Wickham, 1994).<br />
In <strong>the</strong> next section, we present <strong>the</strong> data and examine <strong>the</strong> empirical evidence <strong>of</strong><br />
<strong>the</strong>se three challenges. After that we review <strong>the</strong> possible solutions suggested in <strong>the</strong><br />
literature <strong>to</strong> tackle <strong>the</strong>se three challenges, followed by some concluding remarks.<br />
EMPIRICAL EVIDENCE<br />
Data<br />
The annual data set used in this study covers <strong>the</strong> period 1960–2007 for nine<br />
primary commodities: zinc, tin, oil, wool, iron, aluminum, beef, c<strong>of</strong>fee, and<br />
cocoa. Figure 7.1 plots <strong>the</strong> natural logarithm <strong>of</strong> <strong>the</strong> nine commodity prices relative<br />
<strong>to</strong> <strong>the</strong> U.S. Commodity Price Index for 2005. Looking only at <strong>the</strong>se graphs,<br />
it is difficult <strong>to</strong> say whe<strong>the</strong>r <strong>the</strong> series are stationary (mean reverting) or nonstationary.<br />
It is also very hard <strong>to</strong> say whe<strong>the</strong>r <strong>the</strong>y present a deterministic downward<br />
trend. We have <strong>to</strong> use appropriate tests <strong>to</strong> settle <strong>the</strong>se two questions. We also present<br />
in Figure 7.2 <strong>the</strong> distributions <strong>of</strong> <strong>the</strong> nine commodity prices. It is clear that<br />
<strong>the</strong>se distributions are very different from <strong>the</strong> normal distribution. They have at<br />
least two modes, which might indicate clustering <strong>of</strong> prices at different levels due<br />
<strong>to</strong> persistent cycles. Most <strong>of</strong> <strong>the</strong>se distributions, if not all <strong>of</strong> <strong>the</strong>m, have fatter tails<br />
than <strong>the</strong> normal distribution, suggesting <strong>the</strong> possibility <strong>of</strong> extreme values.<br />
Testing Whe<strong>the</strong>r <strong>the</strong> Series Are Mean Reverting Using Panel<br />
Data Stationarity Tests<br />
It is well known that univariate time series tests for unit root and stationarity have<br />
very low power. It has been shown through simulations that panel data tests for unit<br />
root and stationarity are far more powerful than <strong>the</strong>ir univariate counterpart (see<br />
Breitung and Pesaran, 2008, for a review <strong>of</strong> this literature). In this chapter, we use<br />
<strong>the</strong> recent panel stationarity test proposed by Hadri and Rao (2008). This test allows<br />
for a break in <strong>the</strong> intercept or <strong>the</strong> trend or in both. The selection <strong>of</strong> <strong>the</strong> appropriate<br />
break model for each price series, among <strong>the</strong> four possible ones, is data driven. Any<br />
serial correlation is mopped out. It also corrects for <strong>the</strong> very likely presence <strong>of</strong> crosssectional<br />
dependence <strong>of</strong> unknown form via <strong>the</strong> bootstrapping method.<br />
Table 7.1 shows <strong>the</strong> pairwise correlation coefficients across prices. There are<br />
positive and significant correlations between real commodity prices, except<br />
for <strong>the</strong> oil price series where <strong>the</strong> coefficients are relatively small and some are<br />
negative (but all are insignificant at <strong>the</strong> 5 percent significance level). Pindyck<br />
©International Monetary Fund. Not for Redistribution
Figure. 7.1<br />
Prices <strong>of</strong> nine commodities, 1960–2007<br />
Zinc Price (2005 US$)<br />
4 4.5 5 5.5 6<br />
Wool Price (2005 US$)<br />
6 6.5 7 7.5 8<br />
Beef Price (2005 US$)<br />
4.5 5 5.5 6<br />
Zinc<br />
1960 1970 1980 1990 2000 2010<br />
Year<br />
Wool<br />
1960 1970 1980 1990 2000 2010<br />
Year<br />
Beef<br />
1960 1970 1980 1990 2000 2010<br />
Year<br />
Tin Price (2005 US$)<br />
4.5 5 5.5 6 6.5<br />
Iron Price (2005 US$)<br />
4.8 5 5.2 5.4 5.6 5.8<br />
C<strong>of</strong>fee Price (2005 US$)<br />
4.5 5 5.5 6 6.5 7<br />
Tin<br />
1960 1970 1980 1990 2000 2010<br />
Year<br />
Iron<br />
1960 1970 1980 1990 2000 2010<br />
Year<br />
C<strong>of</strong>fee<br />
1960 1970 1980 1990 2000 2010<br />
Year<br />
Oil Price (2005 US$)<br />
3.5 4 4.5 5 5.5<br />
Aluminium Price (2005 US$)<br />
Cocoa Price (2005 US$)<br />
5 6 7<br />
Sources: National Bureau <strong>of</strong> Economic Research (NBER); and United Nations Trade Database.<br />
Figure 7.2<br />
Distribution <strong>of</strong> <strong>the</strong> nine commodity prices, 1960–2007<br />
0 .5 1 1.5<br />
Density<br />
0 .2 .4 .6 .8 1<br />
Density<br />
0 .2 .4 .6 .8 1<br />
Density<br />
Zinc Price<br />
4 4.5 5 5.5 6<br />
lrzinc<br />
Kernel density estimate<br />
Normal density<br />
kernel = Epanechnikov, bandwidth = 0.1007<br />
Wool Price<br />
6 6.5 7 7.5 8<br />
lrwool<br />
Kernel density estimate<br />
Normal density<br />
kernel = Epanechnikov, bandwidth = 0.1611<br />
Beef Price<br />
4.5 5 5.5 6 6.5<br />
lrbeef<br />
Kernel density estimate<br />
Normal density<br />
kernel = Epanechnikov, bandwidth = 0.1692<br />
0 .2 .4 .6 .8<br />
Density<br />
0 .5 1 1.5<br />
Density<br />
0 .2 .4 .6 .8<br />
Density<br />
Tin Price<br />
4 5 6 7<br />
lrtin<br />
Kernel density estimate<br />
Normal density<br />
kernel = Epanechnikov, bandwidth = 0.2538<br />
Iron Price<br />
4.5 5 5.5 6<br />
lriron<br />
Kernel density estimate<br />
Normal density<br />
kernel = Epanechnikov, bandwidth = 0.1223<br />
C<strong>of</strong>fee Price<br />
4 5 6 7 8<br />
lrc<strong>of</strong>fee<br />
Kernel density estimate<br />
Normal density<br />
kernel = Epanechnikov, bandwidth = 0.2534<br />
0 .2 .4 .6 .8<br />
Density<br />
0 .5 1 1.5<br />
Density<br />
0 .2 .4 .6 .8<br />
Density<br />
4.6 4.8 5 5.2 5.4 5.6<br />
Oil<br />
1960 1970 1980 1990 2000 2010<br />
Year<br />
Aluminum<br />
1960 1970 1980 1990 2000 2010<br />
Year<br />
Cocoa<br />
1960 1970 1980 1990 2000 2010<br />
Year<br />
Oil Price<br />
3.5 4 4.5 5 5.5 6<br />
lroil<br />
Kernel density estimate<br />
Normal density<br />
kernel = Epanechnikov, bandwidth = 0.2510<br />
Aluminium Price<br />
4.5 5 5.5 6<br />
lralum<br />
Kernel density estimate<br />
Normal density<br />
kernel = Epanechnikov, bandwidth = 0.1241<br />
Cocoa Price<br />
4 5 6 7 8<br />
lrcocoa<br />
Kernel density estimate<br />
Normal density<br />
kernel = Epanechnikov, bandwidth = 0.2365<br />
Sources: National Bureau <strong>of</strong> Economic Research (NBER); United Nations Trade Database; and author’s estimates.<br />
©International Monetary Fund. Not for Redistribution<br />
Hadri 123
124 Primary Commodity Price Series: Lessons for Policymakers in Resource-Rich Countries<br />
TABLE 7.1<br />
Correlation coefficients <strong>of</strong> commodity prices (p-values between paren<strong>the</strong>ses)<br />
Zinc Tin Oil Wool Iron Aluminum Beef C<strong>of</strong>fee Cocoa<br />
Zinc 1.0000<br />
Tin 0.5673<br />
(0.0000)<br />
1.0000<br />
Oil 0.2560 0.1963 1.0000<br />
(0.0791) (0.1812)<br />
Wool 0.5594 0.7897 -0.0442 1.0000<br />
(0.0000) (0.0000) (0.7653)<br />
Iron 0.5748 0.7305 0.1786 0.6100 1.0000<br />
(0.0000) (0.0000) (0.2246) (0.0000)<br />
Aluminum 0.5896 0.7882 -0.1067 0.8381 0.6360 1.0000<br />
(0.0000) (0.0000) (0.4706) (0.0000) (0.0000)<br />
Beef 0.4558 0.8465 -0.1757 0.7744 0.5567 0.7911 1.0000<br />
(0.0011) (0.0000) (0.2322) (0.0000) (0.0000) (0.0000)<br />
C<strong>of</strong>fee 0.4546 0.8736 0.0444 0.7441 0.5879 0.7328 0.7407 1.0000<br />
(0.0012) (0.0000) (0.7646) (0.0000) (0.0000) (0.0000) (0.0000)<br />
Cocoa 0.4141 0.8802 0.1662 0.7584 0.6032 0.6860 0.7610 0.8899 1.0000<br />
(0.0034) (0.0000) (0.2590) (0.0000) (0.0000) (0..0000) (0.0000) (0.0000)<br />
Source: Author’s analysis.<br />
and Rotemberg (1990) noted this strong correlation in <strong>the</strong> prices <strong>of</strong> unrelated<br />
commodities, which <strong>the</strong>y called “excess co-movement.” They found that even<br />
after controlling for current and expected future values <strong>of</strong> macroeconomic variables,<br />
this excess co-movement remains.<br />
By using panel we are able <strong>to</strong> account for this cross-sectional dependence.<br />
We are in a position <strong>to</strong> test jointly <strong>the</strong> null hypo<strong>the</strong>sis that all <strong>the</strong> commodity<br />
prices are stationary (I(0)) against <strong>the</strong> alternative hypo<strong>the</strong>sis that some <strong>of</strong> <strong>the</strong>m<br />
are nonstationary or unit root processes (I(1)). The results <strong>of</strong> <strong>the</strong> test are given<br />
in Table 7.2.<br />
The null hypo<strong>the</strong>sis that all <strong>the</strong> commodity prices are stationary is not rejected,<br />
indicating that all <strong>the</strong> commodity prices are mean reverting (<strong>the</strong> two criteria used<br />
are for <strong>the</strong> correction for possible serial correlation; see Hadri and Rao, 2008) for<br />
more explanations). This is an important result. It means that shocks have only<br />
temporary effects on real commodity prices. The fact that <strong>the</strong> nine commodity<br />
prices are stationary will permit us <strong>to</strong> use classical econometrics <strong>to</strong>ols <strong>to</strong> test <strong>the</strong><br />
Prebish–Singer hypo<strong>the</strong>sis. The latter test is presented in Table 7.3.<br />
All commodities without a break have a significant negative trend except oil,<br />
which is positive but not significant. The commodities with a break have a significant<br />
negative trend before <strong>the</strong> break and a positive but insignificant trend after<br />
<strong>the</strong> break. The estimations after <strong>the</strong> break are not reliable because <strong>of</strong> <strong>the</strong> size <strong>of</strong><br />
<strong>the</strong> sample (only five observations). We also employed two o<strong>the</strong>r tests that do not<br />
require a priori knowledge <strong>of</strong> whe<strong>the</strong>r <strong>the</strong> real price <strong>of</strong> a commodity is stationary<br />
or a unit root process. Both tests are univariate, that is, <strong>the</strong>y test one price series<br />
at a time, unlike <strong>the</strong> panel data test.<br />
©International Monetary Fund. Not for Redistribution
TABLE 7.2<br />
Panel stationary test results<br />
N T Statistic value Bootstrap critical values<br />
10% 5%<br />
Using tsig criterion 9 48 3.913 11.164 12.617<br />
Using tsig criterion 9 48 2.647 7.824 8.975<br />
Source: Author’s analysis.<br />
TABLE 7.3<br />
One-sided test for a negative trend (P-value inside brackets)<br />
Growth rate (%)<br />
(no break) Before break After break<br />
Zinc -0.0087<br />
(.0055)<br />
Tin -0.033<br />
(0.000)<br />
Oil 0.0214<br />
(1)<br />
Wool -0.0205<br />
(0.000)<br />
Iron -0.0184<br />
(0.000)<br />
Aluminum -0.16<br />
(0.000)<br />
Beef -0.024<br />
(0.000)<br />
C<strong>of</strong>fee -0.294<br />
(0.000)<br />
Cocoa -0.0254<br />
(0.000)<br />
Source: Author’s analysis.<br />
Hadri 125<br />
The first test, proposed by Harvey, 1 Leybourne, and Taylor (2007), does<br />
not allow for a structural break. The second test, <strong>of</strong>fered by <strong>the</strong> same authors,<br />
allows for one structural break. Both tests give mixed results when testing for<br />
<strong>the</strong> Prebish–Singer hypo<strong>the</strong>sis. The results <strong>of</strong> <strong>the</strong> two tests are not reported<br />
here but can be obtained from <strong>the</strong> authors. Results from panel data tests are<br />
more reliable than tests based on single-time series, on at least three accounts:<br />
(i) panel data have been shown <strong>to</strong> be more powerful than <strong>the</strong>ir single series<br />
counterparts, because <strong>of</strong> <strong>the</strong> joint use <strong>of</strong> all <strong>the</strong> information in <strong>the</strong> panel,<br />
(ii) panel tests allow for cross-sectional dependence, whereas single-time series<br />
tests cannot, by construction, and (iii) our panel tests permit more than one<br />
structural break.<br />
1 We thank Steve Harvey for providing <strong>the</strong> GAUSS programs.<br />
0.35078<br />
(0.993)<br />
0.1905<br />
(0.97)<br />
0.2339<br />
(0.994)<br />
©International Monetary Fund. Not for Redistribution
126 Primary Commodity Price Series: Lessons for Policymakers in Resource-Rich Countries<br />
Identification <strong>of</strong> Cycles in Commodity Prices<br />
Commodity prices are well known <strong>to</strong> have long cycles, which presents serious<br />
challenges <strong>to</strong> policymakers when <strong>the</strong>y seek <strong>to</strong> devise stable budgets in order <strong>to</strong><br />
avoid booms and busts. We employ <strong>the</strong> asymmetric bandpass filter proposed by<br />
Christiano and Fitzgerald (2003) <strong>to</strong> decompose commodity prices in<strong>to</strong> three<br />
components:<br />
y = T + LC + SC , t = 1, … , T,<br />
t t t t<br />
where is a secular trend, LC t is a long-term cyclical element, SC t is a shortterm<br />
cyclical element, and Y t is a real commodity price. We define <strong>the</strong> trend as<br />
all cycle elements lasting more than 30 years, <strong>the</strong> long-term cycles as those lasting<br />
from 10 <strong>to</strong> 30 years, and short-term cycles as those ranging from 2 <strong>to</strong> 10<br />
years. These definitions depend on <strong>the</strong> length <strong>of</strong> <strong>the</strong> data we are using and<br />
<strong>the</strong>refore have a certain degree <strong>of</strong> arbitrariness. Table 7.4 provides some summary<br />
measures <strong>of</strong> <strong>the</strong> cyclical components when <strong>the</strong> bandpass filter is applied<br />
<strong>to</strong> <strong>the</strong> individual commodity prices <strong>of</strong> our data set. Column 2 shows <strong>the</strong> standard<br />
deviation <strong>of</strong> <strong>the</strong> long-term cyclical component ( LC t)<br />
and column 3 shows<br />
<strong>the</strong> ratio <strong>of</strong> <strong>the</strong> standard deviations <strong>of</strong> LCt and <strong>the</strong> <strong>to</strong>tal nontrend cyclical component<br />
( LCt + SCt)<br />
. The range <strong>of</strong> this ratio is from 0.414 (aluminum) <strong>to</strong> 0.854<br />
(oil), clearly showing <strong>the</strong> dominance <strong>of</strong> <strong>the</strong> long-term component in cyclical<br />
commodity price movements.<br />
The mean periodicity (column 4) ranges from 11.7 years (zinc) <strong>to</strong> 20 years<br />
(cocoa). This indicates that common policy initiatives <strong>to</strong> smooth ei<strong>the</strong>r commodity<br />
prices <strong>the</strong>mselves or producer or consumer incomes around a trend may<br />
require economic planning over a long time horizon. (Using longer time series,<br />
Harvey and o<strong>the</strong>rs (2010) found mean periodicity ranging from 23.5 years <strong>to</strong><br />
43.3 years.)<br />
Finally, column 5 indicates <strong>the</strong> first-order au<strong>to</strong>correlation measure <strong>of</strong> persistence<br />
in <strong>the</strong> LC t component <strong>of</strong> each series. The estimates are all greater than 0.89, showing<br />
extreme persistence in <strong>the</strong> long-term cyclical elements <strong>of</strong> <strong>the</strong> relative primary<br />
commodity price series. Therefore, policymakers should be aware that commodity<br />
prices may not return <strong>to</strong> equilibrium for many years and should take appropriate<br />
measures, such as adopting a structural budget as Chile has done. (Structural budgets<br />
will be explained fur<strong>the</strong>r below.)<br />
Volatility in Primary Commodity Prices<br />
It is well documented both that primary commodity prices are highly volatile and<br />
that this volatility is time varying (Mintz, 1967; Reinhart and Wickham, 1994;<br />
for oil, see Dvir and Rog<strong>of</strong>f, 2009).We test for multiple breaks in commodity<br />
price volatility, employing <strong>the</strong> methods proposed by Bai and Perron (1998,<br />
2003). Figure 7.3 provides visual evidence <strong>of</strong> this volatility and <strong>the</strong> changes in it<br />
for <strong>the</strong> nine commodity prices in our sample.<br />
©International Monetary Fund. Not for Redistribution<br />
(5)
TABLE 7.4<br />
Summary measures <strong>of</strong> 10- <strong>to</strong> 30-year cyclical components (LCt)<br />
s.d. (LCt)<br />
s.d. (LCt)<br />
s.d. (SCt + LCt)<br />
Mean periodicity AR(1) parameter<br />
Zinc 0.141 0.661 11.667 0.918<br />
Tin 0.170 0.824 17.500 0.935<br />
Oil 0.289 0.854 16.500 0.956<br />
Wool 0.140 0.632 12.333 0.904<br />
Iron 0.108 0.777 14.667 0.936<br />
Aluminum 0.073 0.414 12.000 0.924<br />
Beef 0.093 0.710 12.000 0.902<br />
C<strong>of</strong>fee 0.211 0.690 16.500 0.898<br />
Cocoa 0.178 0.643 20.000 0.952<br />
Source: Author’s analysis.<br />
WHAT CAN POLICYMAKERS DO TO COUNTER THESE<br />
THREE CHALLENGES?<br />
Secular Downward Trend <strong>of</strong> Real Commodity Prices<br />
Hadri 127<br />
In order <strong>to</strong> <strong>of</strong>fset <strong>the</strong> effect <strong>of</strong> <strong>the</strong> secular downward trend <strong>of</strong> real commodity<br />
prices, <strong>the</strong> resource-rich countries must diversify <strong>the</strong>ir exports by investing in well<br />
run and beneficial manufactures and services. This is more easily said than done.<br />
Some resource-rich countries embarked on ambitious diversification (industrialization)<br />
programs that were not very successful. For a program <strong>to</strong> be fruitful,<br />
certain necessary reforms must be adopted. Also, <strong>to</strong> achieve sustainability <strong>the</strong>re<br />
must be an effective and judicious application <strong>of</strong> <strong>the</strong> Hartwick rule (Hartwick<br />
(1977), Hamil<strong>to</strong>n and Hartwick, (2005)), which requires that any depletion <strong>of</strong><br />
natural capital be <strong>of</strong>fset by a compensating increase in o<strong>the</strong>r forms <strong>of</strong> capital<br />
capable <strong>of</strong> generating as much income as <strong>the</strong> natural capital <strong>the</strong>y replace.<br />
In this regard, an example <strong>of</strong> good practice is Botswana, which applied <strong>the</strong><br />
Hartwick rule rigorously and successfully by investing <strong>the</strong> rent from its exploitation<br />
<strong>of</strong> diamonds in <strong>to</strong>p-rated funds (see Lange and Wright, 2004). The Hartwick<br />
rule is generally prescribed for countries with exhaustible resources, but it is also<br />
beneficial <strong>to</strong> resource-rich countries with declining real commodities prices, even<br />
if <strong>the</strong>ir resources are not exhaustible, as is <strong>the</strong> case for cot<strong>to</strong>n, c<strong>of</strong>fee, and cocoa.<br />
The resource-rich countries may also enter in<strong>to</strong> international commodity agreements<br />
<strong>to</strong> keep <strong>the</strong> real prices <strong>of</strong> <strong>the</strong>ir resources at acceptable levels.<br />
Long Cycles in Real Commodity Prices<br />
The fluctuations <strong>of</strong> real commodity prices between relatively high and low levels,<br />
<strong>of</strong>ten for long periods, as shown above, pose serious challenges <strong>to</strong> policymakers<br />
working <strong>to</strong> achieve price stability and maintain <strong>the</strong> financial soundness <strong>of</strong> <strong>the</strong><br />
economy. A countercyclical policy is <strong>to</strong> be adopted <strong>to</strong> smooth <strong>the</strong> cycles <strong>of</strong> commodity<br />
prices. A rule <strong>of</strong> thumb is <strong>to</strong> save during boom times and spend during<br />
©International Monetary Fund. Not for Redistribution
128 Primary Commodity Price Series: Lessons for Policymakers in Resource-Rich Countries<br />
Figure 7.3<br />
Volatility for <strong>the</strong> nine real commodity prices, 1962–2007<br />
Price volatility<br />
0.05 0.10 0.15<br />
0.00<br />
Price volatility<br />
Price volatility<br />
0.01 0.02 0.03 0.04 0.05 0.00 0.02 0.04 0.06 0.08<br />
0.00<br />
Real Zinc price volatility, 1962-2007<br />
Break I: 1972<br />
Break II: 2000<br />
1970 1980 1990 2000 1970 1980 1990 2000 1970 1980 1990 2000<br />
Time<br />
Time<br />
Time<br />
Real Wool price volatility, 1962-2007<br />
Break: 1971<br />
Price volatility<br />
0.02 0.04 0.06 0.08 0.10<br />
Price volatility<br />
0.00 0.02 0.04 0.06 0.08<br />
1970 1980 1990 2000 1970 1980 1990 2000 1970 1980 1990 2000<br />
Time<br />
Time<br />
Time<br />
Real Beef price volatility, 1962-2007 Real C<strong>of</strong>fee price volatility, 1962-2007 Real Cocoa price volatility, 1962-2007<br />
Break I: 1972 Break II: 1981<br />
Price volatility<br />
0.00 0.05 0.10 0.15<br />
Real Tin price volatility, 1962-2007 Real Oil price volatility, 1962-2007<br />
1970 1980 1990 2000 1970 1980 1990 2000 1970 1980 1990 2000<br />
Time<br />
Source: Author’s analysis.<br />
0.00<br />
bust times. But—save and spend by how much, and when? The structural budget<br />
suggested by <strong>the</strong> IMF and adopted, adapted, and implemented successfully by<br />
Chile achieved a spectacular countercyclical policy.<br />
The structural budget, unlike <strong>the</strong> effective budget, must reflect a medium- <strong>to</strong><br />
long-term view <strong>of</strong> <strong>the</strong> economy. Roughly, it prescribes saving during economic<br />
prosperity and spending during <strong>the</strong> lean years, within structural budget limits. In<br />
a nutshell, it amounts <strong>to</strong> fixing <strong>the</strong> cyclical components at <strong>the</strong>ir medium/long run<br />
levels. For Chile, <strong>the</strong>se were (i) output (GDP), (ii) price <strong>of</strong> copper, and (iii) price<br />
<strong>of</strong> molybdenum. In order <strong>to</strong> insulate <strong>the</strong> estimation <strong>of</strong> <strong>the</strong>se three components<br />
from possible contamination by politics, in Chile <strong>the</strong> estimations are undertaken<br />
independently by expert panels (for more information on structural budget, see<br />
Rodríguez, Tokman, and Vega (2007) and Frankel (2011).<br />
High and Changing Volatility <strong>of</strong> Real Commodity Prices<br />
Many solutions have been proposed in <strong>the</strong> literature and practiced <strong>to</strong> protect<br />
resource revenues from <strong>the</strong> effects <strong>of</strong> <strong>the</strong> volatility <strong>of</strong> commodity prices.<br />
Stabilization funds have been suggested <strong>to</strong> insure against future shocks. Such<br />
Price volatility<br />
0.00 0.05 0.10 0.15 0.20 0.25 0.30<br />
Real iron price volatility, 1962-2007 Real Aluminium volatility, 1962-2007<br />
Break: 1975<br />
Break: 2000<br />
No Break<br />
Time<br />
Price volatility<br />
0.00 0.02 0.04 0.06 0.08<br />
Price volatility<br />
0.00 0.02 0.04 0.06 0.08<br />
Break: 1973<br />
Break I: 1973<br />
Time<br />
Break II:1996<br />
©International Monetary Fund. Not for Redistribution
Hadri 129<br />
funds should be commodity specific. Hedging strategies using financial instruments<br />
also have been employed. Ano<strong>the</strong>r <strong>to</strong>ol used <strong>to</strong> protect credit-rationed<br />
commodity-exporting countries from volatility effects is <strong>to</strong> provide external<br />
finance facilities. Studies on this <strong>to</strong>pic include those by Mintz (1967) and<br />
Reinhart and Wickham (1994). It should be noted that generally, <strong>the</strong> export <strong>of</strong><br />
more than one commodity will not hedge <strong>the</strong> exporting country against adverse<br />
commodity price movements.<br />
SUMMARY<br />
In this chapter, we have reviewed <strong>the</strong> main causes <strong>of</strong> <strong>the</strong> challenges policymakers<br />
encounter in conducting fiscal policy in resource-rich countries: <strong>the</strong> secular<br />
decline <strong>of</strong> real commodity prices, long cycles, and relatively high and time-varying<br />
volatility. If real, <strong>the</strong>se challenges constitute acute problems <strong>to</strong> policymakers<br />
conducting fiscal policies <strong>to</strong> realize stable and sustainable budgets over <strong>the</strong> long<br />
run (avoiding booms and busts) and across generations (<strong>to</strong> prevent inequity across<br />
generations). Investigating and testing <strong>the</strong>se three characteristics through a sample<br />
<strong>of</strong> nine real price commodities observed over 48 years (1960–2007), we found<br />
that all <strong>the</strong> commodities in our sample are mean-reverting (stationary) based on<br />
a panel stationary test. We also discovered that <strong>the</strong> nine commodities are, pairwise,<br />
positively and significantly correlated except with <strong>the</strong> real price <strong>of</strong> oil. That<br />
is, <strong>the</strong> correlations between oil and <strong>the</strong> rest are not significant. The significant<br />
correlations we discovered will magnify cycles and volatilities. We also uncovered<br />
<strong>the</strong> fact that <strong>the</strong>se cycles range from 12 <strong>to</strong> 20 years. As expected, it was shown<br />
that real commodity prices are relatively volatile and that <strong>the</strong> volatility is timevarying.<br />
Finally, we have summarized <strong>the</strong> successful policy solutions reported in<br />
<strong>the</strong> literature as <strong>the</strong>y apply <strong>to</strong> <strong>the</strong>se three challenges.<br />
REFERENCES<br />
Atkinson, G., and K. Hamil<strong>to</strong>n, 2003, “Savings, Growth and Resource Curse Hypo<strong>the</strong>sis,”<br />
World Development, Vol. 31, No. 11, pp. 1793–1807.<br />
Bai, J., and P. Perron, 1998, “Estimating and Testing Linear Models with Multiple Structural<br />
Changes,” Econometrica, Vol. 66, pp. 47–78.<br />
———, 2003, “Computation and Analysis <strong>of</strong> Multiple Structural Change Models,” Journal <strong>of</strong><br />
Applied Econometrics, Vol. 18, pp. 1–22.<br />
Breitung, J., and M.H. Pesaran, 2008, “Unit Roots and Cointegration in Panels,” in The<br />
Econometrics <strong>of</strong> Panel Data: Fundamentals and Recent Developments in Theory and Practice,<br />
third edition, ed. by L. Matyas and P. Sevestre (Dordrecht: Kluwer Academic Publishers).<br />
Christiano, L., and T.J. Fitzgerald, 2003, “The Bandpass Filter,” International Economic Review,<br />
Vol. 44, pp. 435–65.<br />
Cudding<strong>to</strong>n, J., and D. Jerret, 2008, “Super Cycles in Metal Prices?” IMF Staff Papers, Vol. 55,<br />
No. 4, pp. 541–65.<br />
Dea<strong>to</strong>n, A., 1999, “Commodity Prices and Growth in Africa,” Journal <strong>of</strong> Economic Perspectives,<br />
Vol. 13, pp. 23–40.<br />
Dvir, E., and K.S. Rog<strong>of</strong>f, 2009, “The Three Epochs <strong>of</strong> Oil,” Working paper posted online at<br />
http://www.economics.harvard.edu/files/faculty/51_ Three_Epochs_<strong>of</strong>_Oil.pdf.<br />
©International Monetary Fund. Not for Redistribution
130 Primary Commodity Price Series: Lessons for Policymakers in Resource-Rich Countries<br />
Frankel, J., 2011, “A Solution <strong>to</strong> Fiscal Procyclicality: The Structural Budget Institutions<br />
Pioneered by Chile,” NBER Working Paper No. 16945 (Cambridge, MA: National Bureau<br />
<strong>of</strong> Economic Research, April).<br />
Grilli, R.E., and M.C. Yang, 1988, “Commodity Prices, Manufactured Goods Prices, and<br />
<strong>the</strong> Terms <strong>of</strong> Trade <strong>of</strong> Developing Countries,” World Bank Economic Review, Vol. 2,<br />
pp. 1–48.<br />
Hadri, K., and Y. Rao, 2008, “Panel Stationarity Test with Structural Breaks,” Oxford Bulletin<br />
<strong>of</strong> Economics and Statistics, Vol. 70, pp. 245–69.<br />
Hamil<strong>to</strong>n, K., and J.M. Hartwick, 2005, “Investing Exhaustible Resource Rents and <strong>the</strong> Path<br />
<strong>of</strong> Consumption,” Canadian Journal <strong>of</strong> Economics, Vol. 38, No. 2, pp. 615–21.<br />
Hartwick, J., 1977, “Intergenerational Equity and <strong>the</strong> Investing <strong>of</strong> Rents from Exhaustible<br />
<strong>Resources</strong>,” American Economic Review, Vol. 66, pp. 972–74.<br />
Harvey, D.I., N.M. Kellard, J.B. Madsen, and M.E. Wohar, 2010, “The Prebish–Singer<br />
Hypo<strong>the</strong>sis: Four Centuries <strong>of</strong> Evidence,” Review <strong>of</strong> Economics and Statistics, Vol. 92, No. 2,<br />
pp. 367–77.<br />
Harvey, D.I., S.J. Leybourne, and A.M.R. Taylor, 2007, “A Simple, Robust and <strong>Power</strong>ful Test<br />
<strong>of</strong> <strong>the</strong> Trend Hypo<strong>the</strong>sis,” Journal <strong>of</strong> Econometrics, Vol. 14, pp. 1302–30.<br />
———, 2009, “Simple, Robust and <strong>Power</strong>ful Tests <strong>of</strong> <strong>the</strong> Breaking Trend Hypo<strong>the</strong>sis,”<br />
Econometric Theory, Vol. 25, pp. 995–1029.<br />
Heitzman, J., and L. Worden, 1989, Bangladesh: A Country Study (Washing<strong>to</strong>n: Library <strong>of</strong><br />
Congress, Federal Research Division).<br />
Hotteling, H., 1931, “The Economics <strong>of</strong> Exhaustible <strong>Resources</strong>,” Journal <strong>of</strong> Political Economy,<br />
Vol. 39, No. 2, pp. 137–75.<br />
Kellard, N., and M.E. Wohar, 2006, “On <strong>the</strong> Prevalence <strong>of</strong> Trends in Primary Commodity<br />
Prices,” Journal <strong>of</strong> Development Economics, Vol. 79, pp. 146–67.<br />
Kim, T., S. Pfaffenzeller, A. Rayner, and P. Newbold, 2003, “Testing for Linear Trend with<br />
Application <strong>to</strong> Relative Primary Commodity Prices,” Journal <strong>of</strong> Time Series Analysis, Vol. 24,<br />
pp. 539–51.<br />
Lange, G., and M. Wright, 2004, “Sustainable Development in Mineral Economies: The<br />
Example <strong>of</strong> Botswana,” Environment and Development Economics, Vol. 9, pp. 485–505.<br />
Lewis, W.A., 1954, “Economic Development with Unlimited Supplies <strong>of</strong> Labour,” Manchester<br />
School <strong>of</strong> Economics and Social Studies, Vol. 22, No.2, pp. 139–91.<br />
Mintz, I., 1967, Cyclical Fluctuations in <strong>the</strong> Exports <strong>of</strong> <strong>the</strong> United States since 1879 (New York:<br />
Columbia University Press).<br />
Perron, P., 1989, “The Great Crash, <strong>the</strong> Oil Price Shock, and <strong>the</strong> Unit Root Hypo<strong>the</strong>sis,”<br />
Econometrics, Vol. 57, pp. 1361–1401.<br />
Pindyck, R.S., and J.J. Rotemberg, 1990, “The Excess Co-Movements <strong>of</strong> Commodity Prices,”<br />
Economic Journal, Vol. 100, pp. 1173–89.<br />
Prebish, R., 1950, “The Economic Development <strong>of</strong> Latin America and Its Principal Problems,”<br />
Economic Bulletin for Latin America, Vol. 7, pp. 1–12.<br />
Reinhart, C., and P. Wickham, 1994, “Commodity Prices: Cyclical Weakness or Secular<br />
Decline?” MPRA paper No. 8173, posted online at: http://mpra.ub.uni-muenchen.de/8173/.<br />
Rodríguez, J.C., C.R Tokman, and A.C. Vega, 2007, “Structural Balance Policy in Chile,” Paper<br />
published by <strong>the</strong> Budget Office <strong>of</strong> <strong>the</strong> Finance Ministry <strong>of</strong> Chile, available at: www.dipres.cl.<br />
Singer, H., 1950, “The Distribution <strong>of</strong> Gains between Investing and Borrowing Countries,”<br />
American Economic Review, Papers and Proceedings, Vol. 40, pp. 473–85.<br />
UNCTAD, 2008, The Least Developed Countries Report 2008 (Geneva: UN Conference on<br />
Trade and Development).<br />
©International Monetary Fund. Not for Redistribution
Sustainable Fiscal Policy<br />
for Mineral-Based Economies<br />
KIRK HAMILTON AND EDUARDO LEY<br />
INTRODUCTION<br />
CHAPTER 8<br />
Economic management in mineral- and energy-based extractive economies must<br />
confront a wide range <strong>of</strong> challenges: investments in <strong>the</strong> sec<strong>to</strong>r are large and longterm<br />
in nature, rents from extraction are <strong>of</strong>ten large relative <strong>to</strong> GDP (as are<br />
potential tax revenues), <strong>the</strong> resources’ extent and future prices are highly uncertain,<br />
information between producers and governments is asymmetric, and <strong>the</strong><br />
resource deposits <strong>the</strong>mselves are exhaustible. 1 The latter point—exhaustibility—<br />
raises particular concerns about <strong>the</strong> sustainability <strong>of</strong> growth and development in<br />
<strong>the</strong>se economies, and this in turn is strongly linked <strong>to</strong> fiscal policy.<br />
As noted in Where Is <strong>the</strong> Wealth <strong>of</strong> Nations? (World Bank, 2006), <strong>the</strong>re are no<br />
sustainable diamond mines, but <strong>the</strong>re are sustainable diamond-mining countries.<br />
While individual mines eventually are exhausted or cease <strong>to</strong> be economic, <strong>the</strong><br />
country that owns <strong>the</strong> minerals being mined has <strong>the</strong> option <strong>of</strong> investing <strong>the</strong> rents<br />
from extraction in o<strong>the</strong>r assets that can sustain income generation beyond <strong>the</strong> life<br />
<strong>of</strong> <strong>the</strong> mine. This insight suggests an important linkage between sustaining development<br />
and maintaining wealth, an inference that is borne out by a large body<br />
<strong>of</strong> research. 2<br />
In this chapter, we argue that <strong>the</strong> exhaustibility <strong>of</strong> mineral resources raises two<br />
specific concerns for economic management: (i) How should we measure economic<br />
performance? and (ii) How should we design fiscal policies <strong>to</strong> sustain<br />
growth and development in <strong>the</strong> face <strong>of</strong> exhaustibility? The chapter is broken in<strong>to</strong><br />
Kirk Hamil<strong>to</strong>n and Eduardo Ley are both lead economists at <strong>the</strong> World Bank. This chapter is based<br />
on <strong>the</strong> authors’ presentation at “<strong>Natural</strong> <strong>Resources</strong>, Finance, and Development: Confronting Old and<br />
New Challenges,” a high-level seminar organized by <strong>the</strong> Central Bank <strong>of</strong> Algeria and <strong>the</strong> IMF<br />
Institute, which <strong>to</strong>ok place in Algiers, on November 4 and 5, 2010. The authors can be contacted at<br />
khamil<strong>to</strong>n@worldbank.org and eley@worldbank.org.<br />
1<br />
These issues and more are discussed in Boadway and Keen (2010).<br />
2<br />
See in particular Hartwick (1977), Hamil<strong>to</strong>n and Clemens (1999), Dasgupta and Mäler (2000),<br />
Asheim and Weitzman (2001), and Ferreira, Hamil<strong>to</strong>n, and Vincent (2008).<br />
©International Monetary Fund. Not for Redistribution<br />
131
132 Sustainable Fiscal Policy for Mineral-Based Economies<br />
two main parts <strong>to</strong> deal with <strong>the</strong>se two questions. The concluding section draws<br />
<strong>the</strong> pieces <strong>to</strong>ge<strong>the</strong>r.<br />
MEASURING ECONOMIC PERFORMANCE<br />
While GDP growth is <strong>the</strong> canonical measure <strong>of</strong> economic performance used by<br />
finance ministries everywhere, <strong>the</strong>re is good reason <strong>to</strong> question its usefulness in<br />
economies that depend on exhaustible resources, particularly smaller developing<br />
countries where resource extraction may be a very large portion <strong>of</strong> <strong>the</strong> economy.<br />
There are two main reasons for this. First, national income, ra<strong>the</strong>r than domestic<br />
product, is a more appropriate income measure in countries where largely foreignoperated<br />
extractive industries are substantial, since payments <strong>to</strong> foreign-owned<br />
fac<strong>to</strong>rs are <strong>of</strong>ten considerable. Second, in resource-rich countries, national<br />
income must be adjusted by <strong>of</strong>fsetting a part <strong>of</strong> <strong>the</strong> credits for resource extraction<br />
with <strong>the</strong> corresponding depletion costs, which are similar <strong>to</strong> capital depreciation.<br />
This suggests using a measure <strong>of</strong> national income adjusted for resource depletion<br />
as <strong>the</strong> measure <strong>of</strong> economic performance. This adjusted net national income<br />
(aNNI) is defined as follows:<br />
Net national income (NNI) = GDP + (net foreign fac<strong>to</strong>r income)<br />
– (depreciation <strong>of</strong> fixed capital)<br />
Adjusted net national income (aNNI) = NNI – (depletion <strong>of</strong> natural capital)<br />
After adding net foreign fac<strong>to</strong>r income <strong>to</strong> GDP and subtracting <strong>the</strong> consumption<br />
<strong>of</strong> fixed and natural capital, we obtain <strong>the</strong> country’s aNNI. This is a better<br />
measure <strong>of</strong> <strong>the</strong> available income, which can be consumed or invested <strong>to</strong> increase<br />
<strong>the</strong> nation’s future consumption.<br />
Taking mineral-dependent sub-Saharan African countries as a group, 3 Figure 8.1<br />
plots GDP and aNNI since 1990.<br />
As <strong>the</strong> figure makes clear, adjusting for fac<strong>to</strong>r payments abroad and resource<br />
depletion produces a significant difference in <strong>the</strong> level <strong>of</strong> <strong>the</strong> national accounting<br />
aggregates, more than an $80 billion difference in 2008. The annual growth rates<br />
also diverge sharply, averaging 6.4 percent for GDP but only 3.8 percent for<br />
aNNI. This reflects <strong>the</strong> resource boom that started during <strong>the</strong> early 2000s, boosting<br />
real commodity prices, levels <strong>of</strong> extraction, <strong>the</strong> value <strong>of</strong> resource depletion,<br />
and flows <strong>of</strong> pr<strong>of</strong>its out <strong>of</strong> <strong>the</strong>se economies.<br />
This difference in levels and growth rates indicates <strong>the</strong> scope for governments<br />
<strong>to</strong> make policy mistakes during boom times: <strong>the</strong>y believe that income is much<br />
higher than it is in fact, and <strong>the</strong>y believe that economic growth is much higher as<br />
3 Figure 8.1 plots aggregate GDP and aNNI for countries where mineral and petroleum rents are<br />
greater than 5 percent <strong>of</strong> GDP and where a sufficient time series is available. The countries are Angola,<br />
Cameroon, Chad, Congo (Democratic Republic), Congo (Republic), Gabon, Ghana, Guinea,<br />
Mauritania, Mozambique, Sudan, Togo, and Zambia.<br />
©International Monetary Fund. Not for Redistribution
Figure 8.1<br />
Real GDP and aNNI in mineral-dependent African countries<br />
(in 2005 US$ billions), 1990–2008<br />
200<br />
180<br />
160<br />
140<br />
120<br />
100<br />
80<br />
60<br />
40<br />
1990<br />
1991<br />
1992<br />
1993<br />
1994<br />
1995<br />
1996<br />
1997<br />
1998<br />
1999<br />
2000<br />
2001<br />
2002<br />
2003<br />
2004<br />
2005<br />
2006<br />
2007<br />
2008<br />
Source: Authors’ calculations.<br />
Real GDP Real aNNI<br />
Hamil<strong>to</strong>n and Ley 133<br />
well. Governments may be tempted <strong>to</strong> opt for expansionary policies that are at<br />
variance with <strong>the</strong> true state <strong>of</strong> <strong>the</strong> economy.<br />
If we switch <strong>the</strong> policy focus from growth <strong>to</strong> <strong>the</strong> sustainability <strong>of</strong> growth—a<br />
real concern when resources are being depleted—<strong>the</strong>n it is clear that aNNI alone<br />
is not going <strong>to</strong> be a sufficient indica<strong>to</strong>r. aNNI is an accurate measure <strong>of</strong> current<br />
income, but it does not indicate <strong>the</strong> prospects for future social welfare. For that,<br />
it is necessary <strong>to</strong> look at <strong>the</strong> national balance sheet and at net wealth creation in<br />
particular. The appropriate measure <strong>of</strong> net creation <strong>of</strong> real wealth is adjusted net<br />
saving, 4 calculated as follows:<br />
Gross domestic saving (GDS) = GDP – consumption<br />
Net national saving (NNS) = GDS + (net foreign fac<strong>to</strong>r income)<br />
+ (net transfers) – (consumption <strong>of</strong> fixed capital)<br />
Adjusted net saving = NNS + (education expenditure) – depletion<br />
– (pollution damage)<br />
Adjusted net saving aims <strong>to</strong> be comprehensive, classifying education expenditures<br />
as investment ra<strong>the</strong>r than consumption (contrary <strong>to</strong> <strong>the</strong> practice <strong>of</strong> <strong>the</strong> System<br />
<strong>of</strong> National Accounts (SNA)), deducting <strong>the</strong> value <strong>of</strong> mineral and energy depletion<br />
and net depletion <strong>of</strong> forests, and finally deducting <strong>the</strong> damage <strong>to</strong> assets associated<br />
with exposure <strong>to</strong> pollution. Figure 8.2 plots gross domestic saving and adjusted net<br />
saving for <strong>the</strong> resource-extracting African economies appearing in Figure 8.1.<br />
As Figure 8.2 makes clear, <strong>the</strong> finance ministers in <strong>the</strong>se mineral- and energyexporting<br />
countries are almost certainly looking at <strong>the</strong> wrong numbers when it<br />
4 Adjusted net saving has been published by <strong>the</strong> World Bank in <strong>the</strong> World Development Indica<strong>to</strong>rs since<br />
1999. Also termed “genuine saving,” <strong>the</strong> underlying <strong>the</strong>ory for it is developed in Hamil<strong>to</strong>n and<br />
Clemens (1999).<br />
©International Monetary Fund. Not for Redistribution
134 Sustainable Fiscal Policy for Mineral-Based Economies<br />
Figure 8.2<br />
Gross and adjusted net saving in mineral-dependent<br />
African countries (percent), 1990–2008<br />
30<br />
20<br />
10<br />
0<br />
-10<br />
-20<br />
-30<br />
1990<br />
1991<br />
1992<br />
1993<br />
1994<br />
1995<br />
1996<br />
1997<br />
1998<br />
1999<br />
2000<br />
2001<br />
2002<br />
2003<br />
2004<br />
2005<br />
2006<br />
2007<br />
2008<br />
Gross Domestic Saving (%GDP) Adjusted Net Saving (%GNI)<br />
Source: Authors’ calculations.<br />
comes <strong>to</strong> wealth creation and <strong>the</strong> sustainability <strong>of</strong> development. Gross domestic<br />
saving shows an upward trend since 1990, approaching roughly 25 percent <strong>of</strong><br />
GDP. Adjusted net saving has been negative every year except 1996, with <strong>the</strong><br />
mean value approaching –10 percent <strong>of</strong> GNI since <strong>the</strong> year 2000.<br />
It is important <strong>to</strong> understand what <strong>the</strong>se savings figures mean for development.<br />
The discovery and development <strong>of</strong> a mineral or energy resource <strong>of</strong>fers a<br />
country <strong>the</strong> opportunity <strong>to</strong> put well being, measured narrowly as consumption,<br />
on<strong>to</strong> a permanently higher plateau. The policy rule for achieving this, described<br />
below, is <strong>the</strong> Hartwick rule: invest rents from resource extraction in o<strong>the</strong>r forms<br />
<strong>of</strong> capital. The fact that we observe negative saving in Figure 8.2 is a straightforward<br />
reflection <strong>of</strong> <strong>the</strong> fact that <strong>the</strong> Hartwick rule is not being followed: rents are<br />
actually being consumed. Negative saving reflects an opportunity not taken, and<br />
future generations will be poorer as a result.<br />
Government Finance Statistics and Exhaustible <strong>Resources</strong><br />
This discussion <strong>of</strong> adjusted national accounting aggregates as <strong>the</strong> basis for measuring<br />
economic performance has strong parallels in <strong>the</strong> development <strong>of</strong> government<br />
finance statistics in mineral-extracting economies. The IMF’s Government<br />
Finance Statistics Manual 2001 (IMF, 2001) brings <strong>the</strong> treatment <strong>of</strong> government<br />
finance in line with <strong>the</strong> 1993 System <strong>of</strong> National Accounts (SNA93) by including<br />
publicly owned commercial natural resources in <strong>the</strong> government’s balance sheet<br />
account. This has potential implications for <strong>the</strong> derivation <strong>of</strong> basic government<br />
fiscal balances.<br />
The Government Finance Statistics Manual 2001 follows <strong>the</strong> SNA93 convention<br />
<strong>of</strong> treating <strong>the</strong> depletion <strong>of</strong> natural resources as ano<strong>the</strong>r volume change<br />
ra<strong>the</strong>r than as capital consumption. As a result, <strong>the</strong> depletion <strong>of</strong> natural resources<br />
has no impact on <strong>the</strong> measured operating balance for government operations. To<br />
get a true measure <strong>of</strong> <strong>the</strong> government’s fiscal stance, <strong>the</strong>refore, an adjusted measure<br />
<strong>of</strong> <strong>the</strong> operating balance is required, similar <strong>to</strong> <strong>the</strong> adjustment discussed for<br />
©International Monetary Fund. Not for Redistribution
Hamil<strong>to</strong>n and Ley 135<br />
<strong>the</strong> national accounting aggregate measures <strong>of</strong> income and saving. We <strong>the</strong>refore<br />
have <strong>the</strong> following:<br />
Gross operating balance = Revenue – expense (excluding consumption <strong>of</strong><br />
fixed capital)<br />
Net operating balance = Gross operating balance – consumption <strong>of</strong> fixed<br />
capital<br />
Adjusted net operating balance = Net operating balance – depletion <strong>of</strong><br />
natural resources<br />
For countries where fiscal revenues from taxing petroleum and mineral extraction<br />
are large, <strong>the</strong> adjusted net operating balance provides <strong>the</strong> most comprehensive<br />
measure <strong>of</strong> <strong>the</strong> government’s fiscal stance. Similarly, <strong>the</strong> most general measure <strong>of</strong> <strong>the</strong><br />
change in fiscal space in a country is <strong>the</strong> change in <strong>the</strong> government’s balance sheet,<br />
which will be directly affected by <strong>the</strong> depletion <strong>of</strong> petroleum and mineral deposits.<br />
ACHIEVING ECONOMIC AND FISCAL<br />
SUSTAINABILITY<br />
While <strong>the</strong> proper measurement <strong>of</strong> economic performance and <strong>the</strong> government’s<br />
fiscal balance in mineral-extracting economies is obviously important, <strong>the</strong> central<br />
<strong>to</strong>ol for achieving sustainability has <strong>to</strong> be public policy. How can government policy,<br />
fiscal policy in particular, contribute <strong>to</strong> sustainable growth and development?<br />
The Hartwick Rule for Sustainable Development<br />
with Exhaustible <strong>Resources</strong><br />
In 1973, at <strong>the</strong> height <strong>of</strong> <strong>the</strong> first oil crisis, <strong>the</strong> economics pr<strong>of</strong>ession turned its<br />
attention <strong>to</strong> <strong>the</strong> question <strong>of</strong> sustainability: If an essential resource like energy is<br />
finite in extent, can economic output be sustained indefinitely, or will output<br />
eventually begin <strong>to</strong> decline? Solow (1974) showed that consumption can be sustained<br />
even with a fixed production technology as long as <strong>the</strong> share <strong>of</strong> <strong>the</strong><br />
exhaustible resource in production is less than that <strong>of</strong> produced capital, and <strong>the</strong>re<br />
is sufficient substitutability between <strong>the</strong> two production fac<strong>to</strong>rs. Hartwick<br />
(1977), in a justly famous result, showed that underlying <strong>the</strong> Solow finding is<br />
a simple policy rule: invest resource rents in o<strong>the</strong>r assets.<br />
The Hartwick rule accords with common-sense notions <strong>of</strong> keeping capital<br />
intact, but actually implementing <strong>the</strong> rule has been a challenge for many governments.<br />
The evidence for this lies in a simple counterfactual: If resource rents had<br />
actually been invested in fixed capital over <strong>the</strong> 25 years from 1980 <strong>to</strong> 2005, we<br />
could construct a hypo<strong>the</strong>tical estimate <strong>of</strong> capital s<strong>to</strong>ck and compare it with <strong>the</strong><br />
observed capital s<strong>to</strong>ck in each resource-extracting economy. The result, drawn<br />
from The Changing Wealth <strong>of</strong> Nations (World Bank, 2011), is shown in Figure 8.3.<br />
©International Monetary Fund. Not for Redistribution
136 Sustainable Fiscal Policy for Mineral-Based Economies<br />
Figure 8.3<br />
The Hartwick counterfactual: Actual vs. hypo<strong>the</strong>tical fixed<br />
capital in 2005, selected countries<br />
(in U.S. dollars per capita)<br />
80000<br />
70000<br />
60000<br />
66,359<br />
67,994<br />
50000<br />
40000<br />
45,246<br />
30000<br />
20000<br />
20,021<br />
12,793<br />
18,885<br />
16,088<br />
10000<br />
5,349<br />
1,369 3,741<br />
2005 U.S. dollars per capita<br />
For <strong>the</strong> five major extractive resource exporters shown in Figure 8.3, <strong>the</strong>re<br />
is clearly a large gap between how rich <strong>the</strong>y were in 2005 and how rich <strong>the</strong>y<br />
could have been if <strong>the</strong>y had followed <strong>the</strong> Hartwick rule. World Bank (2011)<br />
shows this <strong>to</strong> be true for a very wide range <strong>of</strong> extractive economies, while<br />
countries like Malaysia, Tunisia, Colombia, and China featured both heavy<br />
resource dependence (where rents on extractive resources exceeded 5 percent <strong>of</strong><br />
GDP) and a 2005 s<strong>to</strong>ck <strong>of</strong> fixed capital that exceeded its hypo<strong>the</strong>tical value<br />
under <strong>the</strong> Hartwick rule—<strong>the</strong>se countries were saving <strong>the</strong>ir resource rents, and<br />
more.<br />
There is a danger in looking at counterfactuals, however, because <strong>the</strong>y make<br />
<strong>the</strong> application <strong>of</strong> <strong>the</strong> Hartwick rule seem like something mechanical, something<br />
that is easily achieved by government fiat. In practice, <strong>the</strong>re is a sequence <strong>of</strong><br />
actions, mostly in <strong>the</strong> fiscal domain, that needs <strong>to</strong> be implemented if resource<br />
wealth is <strong>to</strong> be parlayed in<strong>to</strong> sustainable growth and development.<br />
Achieving Fiscal Sustainability<br />
-<br />
Trinidad and<br />
Tobago<br />
Venezuela<br />
Gabon Nigeria<br />
Congo, Rep.<br />
Actual Produced Capital Hypo<strong>the</strong>tical Produced Capital (Hartwick Rule)<br />
Source: Authors’ estimates.<br />
The Hartwick rule provides <strong>the</strong> policy prescription for achieving sustainable<br />
growth and development in exhaustible resource-based economies. Sustainability<br />
at <strong>the</strong> economy-wide level is equated <strong>to</strong> maintaining or increasing real wealth.<br />
The same principles can be applied <strong>to</strong> achieving fiscal sustainability, which can be<br />
defined <strong>to</strong> be <strong>the</strong> maintenance <strong>of</strong> real government wealth when part <strong>of</strong> <strong>the</strong><br />
endowment consists <strong>of</strong> s<strong>to</strong>cks <strong>of</strong> exhaustible resources owned by <strong>the</strong> public sec<strong>to</strong>r.<br />
Fiscal sustainability is <strong>the</strong>refore a pillar <strong>of</strong> macro sustainability.<br />
For governments <strong>to</strong> achieve fiscal sustainability, a number <strong>of</strong> distinct elements<br />
<strong>of</strong> <strong>the</strong> fiscal system need <strong>to</strong> work efficiently and effectively, including <strong>the</strong>se:<br />
• Effective rent capture by government (assuming that exploitation <strong>of</strong> <strong>the</strong><br />
natural resource is carried out by private ac<strong>to</strong>rs)<br />
• Fiscal rules <strong>to</strong> limit discretionary use <strong>of</strong> resource revenues<br />
©International Monetary Fund. Not for Redistribution
Hamil<strong>to</strong>n and Ley 137<br />
• Operation <strong>of</strong> natural resource funds, and<br />
• Effective public investment management.<br />
In <strong>the</strong> following discussion, each <strong>of</strong> <strong>the</strong>se elements is addressed in turn.<br />
Effective Revenue Instruments<br />
Since <strong>the</strong> economic value <strong>of</strong> a resource asset is <strong>the</strong> present value <strong>of</strong> <strong>to</strong>tal resource<br />
rents, <strong>the</strong> perfect revenue instrument would capture all available rents. In practice,<br />
<strong>the</strong>re are a number <strong>of</strong> constraints on government’s ability <strong>to</strong> capture resource<br />
rents. 5 A key issue is information asymmetry—firms know <strong>the</strong>ir costs with more<br />
precision than government, so it is difficult <strong>to</strong> design <strong>the</strong> perfect fiscal instrument,<br />
one that captures resource rents (economic pr<strong>of</strong>its) but nei<strong>the</strong>r depresses<br />
after-tax pr<strong>of</strong>its below “normal” levels nor leaves windfall pr<strong>of</strong>its in <strong>the</strong> hands <strong>of</strong><br />
firms. Firms can also dis<strong>to</strong>rt reported pr<strong>of</strong>it levels by using transfer pricing.<br />
As Sunley, Baunsgaard, and Simard (2003) note, governments tend <strong>to</strong> use a<br />
range <strong>of</strong> fiscal instruments in order <strong>to</strong> capture resource rents, including <strong>the</strong>se:<br />
• Royalties, charged ei<strong>the</strong>r as specific taxes or at assessed-value rerates, administered<br />
on gross production. Royalties are unpopular with producers because<br />
<strong>the</strong>y place all down-side market risks on <strong>the</strong>m, ra<strong>the</strong>r than on government.<br />
• Income taxes, typically with some restrictions on consolidation <strong>of</strong> income<br />
and tax deductions across different activities such as exploration, development,<br />
and production.<br />
• Resource rent taxes, which attempt <strong>to</strong> tax away super-normal pr<strong>of</strong>its but are<br />
subject <strong>to</strong> <strong>the</strong> information asymmetry limitations noted above.<br />
• Production-sharing agreements, which split gross income in<strong>to</strong> a cost-recovery<br />
component and a pr<strong>of</strong>it component that is shared between producer and<br />
government according <strong>to</strong> an agreed formula—in principle, mimicking a<br />
resource rent tax.<br />
• Indirect taxes, including tariffs, export duties, and value-added taxes.<br />
There is a large literature on resource taxation, a considerable portion <strong>of</strong> which<br />
is summarized by Boadway and Keen (2010). They note <strong>the</strong> range <strong>of</strong> issues that<br />
make <strong>the</strong> taxation <strong>of</strong> mineral and energy resources particularly complex, including<br />
high sunk costs and long production periods (which can lead <strong>to</strong> time-inconsistency<br />
problems), uncertainty about resource extent, extraction cost, and future<br />
market conditions, and problems <strong>of</strong> market power.<br />
Complexities abound, <strong>the</strong>refore, but <strong>the</strong> basic principle is clear: As <strong>the</strong> owner<br />
<strong>of</strong> <strong>the</strong> natural resource, a government can only realize <strong>the</strong> benefits <strong>of</strong> ownership<br />
through effective and efficient fiscal instruments <strong>to</strong> capture resource rents.<br />
5 If resources are extracted by a state-owned enterprise, <strong>the</strong>n in principle all rents can be captured<br />
through flows <strong>of</strong> pr<strong>of</strong>its <strong>to</strong> <strong>the</strong> treasury. But his<strong>to</strong>rical experience has not been positive—public-sec<strong>to</strong>r<br />
firms are <strong>of</strong>ten subject <strong>to</strong> political meddling, a lack <strong>of</strong> commercial orientation reduces pr<strong>of</strong>its, and<br />
investment finance may be limited by government capital budgets. See McPherson, 2003 and 2010.<br />
©International Monetary Fund. Not for Redistribution
138 Sustainable Fiscal Policy for Mineral-Based Economies<br />
Fiscal Rules Limiting <strong>the</strong> Uses <strong>of</strong> Resource Revenues<br />
A defining characteristic <strong>of</strong> petroleum revenues is that <strong>the</strong>y <strong>of</strong>ten amount <strong>to</strong> tens<br />
<strong>of</strong> percentage points <strong>of</strong> national income and correspondingly larger shares <strong>of</strong><br />
government revenues. There is consequently a strong temptation for governments<br />
<strong>to</strong> spend resource revenues on public sec<strong>to</strong>r consumption. In <strong>the</strong> face <strong>of</strong> <strong>the</strong>se<br />
temptations, some governments have implemented fiscal rules <strong>to</strong> limit what is<br />
quite literally capital consumption.<br />
The best-known example <strong>of</strong> such a fiscal rule is Botswana’s Sustainable Budget<br />
Index. It is calculated this way:<br />
Sustainable Budget Index =<br />
recurrent expenditure<br />
recurrent revenue<br />
Here <strong>the</strong> definitions are important: Recurrent expenditure excludes spending<br />
on health and education, since <strong>the</strong>se are defined as development expenditure,<br />
while recurrent revenue excludes revenue from <strong>the</strong> mining sec<strong>to</strong>r. Botswana’s<br />
policy aims <strong>to</strong> ensure that <strong>the</strong> Sustainable Budget Index does not exceed 1, since<br />
that would indicate that resource revenues are being consumed. Resource revenues<br />
are invested domestically in infrastructure, health, and education, or<br />
invested in financial assets when <strong>the</strong> government feels that <strong>the</strong> domestic absorptive<br />
capacity for investment is being stretched.<br />
As Kojo (2010) reports, government policy has generally been successful in<br />
following <strong>the</strong> Sustainable Budget Index rule, but <strong>the</strong> index did exceed 1 in<br />
1994–95 as well as from 2000–01 <strong>to</strong> 2004–05. Kojo (2010) also notes that “diamonds<br />
are not forever”—in fact, by <strong>the</strong> mid-2020s <strong>the</strong> low-cost diamond reserves<br />
will be exhausted, and new reserves will likely have much higher extraction costs.<br />
Botswana will have <strong>to</strong> plan for a fiscal transition before that point is reached,<br />
improving tax administration, increasing non-mining revenue generation, and<br />
reducing overall government expenditures in order <strong>to</strong> ensure medium-term fiscal<br />
sustainability.<br />
Operation <strong>of</strong> <strong>Natural</strong> Resource Funds<br />
Even if governments are prudent and choose <strong>to</strong> invest resource revenues ra<strong>the</strong>r<br />
than consuming <strong>the</strong>m, this raises two interlinked issues: (i) <strong>the</strong> limited capacity<br />
<strong>of</strong> developing countries <strong>to</strong> absorb large amounts <strong>of</strong> investment, and (ii) <strong>the</strong> effectiveness<br />
<strong>of</strong> public investment management systems. The latter point is discussed<br />
in <strong>the</strong> next section.<br />
If government investments in physical and human capital are bumping in<strong>to</strong><br />
<strong>the</strong> constraints <strong>of</strong> absorptive capacity in <strong>the</strong> economy, 6 <strong>the</strong>n investing in financial<br />
assets is <strong>the</strong> obvious alternative. This is typically achieved by establishing natural<br />
resource funds that invest in a variety <strong>of</strong> financial assets.<br />
6Absorptive capacity constraints are generally signaled by shortages <strong>of</strong> skills, with consequent delays<br />
in implementation and rising prices <strong>of</strong> inputs.<br />
©International Monetary Fund. Not for Redistribution
Hamil<strong>to</strong>n and Ley 139<br />
<strong>Natural</strong> resource funds (NRFs) are a particular class <strong>of</strong> fiscal rules, or more<br />
generally <strong>of</strong> rules-based fiscal policy. In recent times, several countries—<strong>of</strong>ten in<br />
response <strong>to</strong> <strong>the</strong> deterioration <strong>of</strong> <strong>the</strong>ir public finances—have adopted rules constraining<br />
<strong>the</strong> extent <strong>of</strong> discretionary fiscal policy in order <strong>to</strong> correct for <strong>the</strong> deficit<br />
bias. A fiscal policy rule is defined as a permanent constraint on fiscal policy,<br />
expressed as a summary indica<strong>to</strong>r <strong>of</strong> fiscal performance, such as <strong>the</strong> government<br />
budget deficit, borrowing, debt, or a major component <strong>the</strong>re<strong>of</strong> (Kopits and<br />
Symansky, 1998). Kopits and Symansky identify a list <strong>of</strong> characteristics for an<br />
ideal fiscal rule: it should be well-defined, transparent, simple, flexible, adequate<br />
relative <strong>to</strong> <strong>the</strong> final goal, enforceable, consistent, and supported by sound policies,<br />
including structural reforms if needed.<br />
As Davis, Ossowski, and Fedelino (2003) note, NRFs serve <strong>to</strong> buffer <strong>the</strong><br />
economy from <strong>the</strong> volatility <strong>of</strong> natural resource markets, can limit Dutch disease<br />
symp<strong>to</strong>ms by spreading <strong>the</strong> conversion <strong>of</strong> resource receipts in<strong>to</strong> domestic currency<br />
over time, and can provide a useful source <strong>of</strong> liquidity for governments<br />
concerned with running countercyclical fiscal regimes. They highlight two broad<br />
types <strong>of</strong> natural resource funds: stabilization funds and saving funds.<br />
Stabilization funds, as <strong>the</strong> name implies, are primarily aimed at stabilizing<br />
public finances by buffering <strong>the</strong> budget from <strong>the</strong> volatility <strong>of</strong> natural resource<br />
revenues. These funds <strong>of</strong>ten use contingent rules for determining whe<strong>the</strong>r funds<br />
are accumulating or being withdrawn for use in <strong>the</strong> government budget, setting<br />
thresholds for prices or revenues above which revenues can accumulate and<br />
below which <strong>the</strong>y are drawn down. While this buffering effect can obviously be<br />
important for <strong>the</strong> stability <strong>of</strong> public finances over <strong>the</strong> business cycle, 7 <strong>the</strong>re is no<br />
guarantee that stabilization funds are financially sustainable, owing <strong>to</strong> significant<br />
uncertainties about whe<strong>the</strong>r <strong>the</strong> thresholds for accumulation and drawdown<br />
are representative <strong>of</strong> normal deviations from long-term averages. For<br />
example, if resource prices move <strong>to</strong> permanently higher or lower mean levels, <strong>the</strong><br />
stabilization fund could ei<strong>the</strong>r accumulate in perpetuity or eventually be driven<br />
<strong>to</strong> zero.<br />
Savings funds generally aim <strong>to</strong> invest some specified proportion <strong>of</strong> resource<br />
revenue. Consequently, <strong>the</strong>y have a potential stabilizing effect on government<br />
revenues, particularly if <strong>the</strong> funds can be drawn upon at <strong>the</strong> low point <strong>of</strong> <strong>the</strong><br />
business cycle. But governments are still free <strong>to</strong> run deficits, which can <strong>of</strong>fset <strong>the</strong>se<br />
savings, so <strong>the</strong> issue is ultimately whe<strong>the</strong>r governments wish <strong>to</strong> run prudent fiscal<br />
policies.<br />
The institutional setting and management <strong>of</strong> NRFs also raises a number <strong>of</strong><br />
important questions for government. A key issue is integration with <strong>the</strong> budget:<br />
If resource funds are free <strong>to</strong> make domestic investments outside <strong>of</strong> <strong>the</strong> budget<br />
process, this undermines <strong>the</strong> integrity <strong>of</strong> <strong>the</strong> overall budgetary system. It could<br />
7 Davis, Ossowski, and Fedelino (2003) note, however, that <strong>the</strong>re is nothing <strong>to</strong> prevent governments<br />
from running deficits during boom times, when <strong>the</strong> resource stabilization fund is in accumulation<br />
mode, <strong>the</strong>reby <strong>of</strong>fsetting some or all <strong>of</strong> <strong>the</strong> stabilizing effect <strong>of</strong> <strong>the</strong> natural resource fund.<br />
©International Monetary Fund. Not for Redistribution
140 Sustainable Fiscal Policy for Mineral-Based Economies<br />
also raise questions <strong>of</strong> transparency in <strong>the</strong> use <strong>of</strong> <strong>the</strong> resource fund. There are also<br />
important questions about asset management. To <strong>the</strong> extent that fund investments,<br />
whe<strong>the</strong>r in physical or financial assets, are made in <strong>the</strong> domestic economy,<br />
this risks transmitting natural resource sec<strong>to</strong>r volatility back in<strong>to</strong> <strong>the</strong> domestic<br />
economy. Investing in foreign assets may be <strong>the</strong> preferred option from this perspective,<br />
but doing so may be politically difficult if <strong>the</strong>re are constituencies pushing<br />
for investing “at home.”<br />
Ano<strong>the</strong>r objective <strong>of</strong> NRFs is <strong>to</strong> preserve <strong>the</strong> quality <strong>of</strong> spending: by setting<br />
limits on spending increases <strong>the</strong>y avoid waste in boom times. As noted by Davis,<br />
Ossowski, Daniel, and Barnett (2001), <strong>the</strong> establishment <strong>of</strong> NRFs may be justified<br />
on political economy grounds, as <strong>the</strong>y help <strong>the</strong> government <strong>to</strong> resist spending<br />
pressures by formally limiting <strong>the</strong> resources available <strong>to</strong> <strong>the</strong> budget during<br />
upswings. In effect, a transparent and well-managed NRF protects resource revenues<br />
from <strong>the</strong> voracity effect and preserves resources for high-quality spending—<br />
that is, for well-appraised public investments.<br />
However, Petrie (2009a) notes that an NRF should be introduced only if it is<br />
judged likely <strong>to</strong> change <strong>the</strong> behavior <strong>of</strong> political ac<strong>to</strong>rs in ways that reduce <strong>the</strong>ir<br />
incentives <strong>to</strong> spend <strong>to</strong>o much <strong>to</strong>o soon. If it is not likely <strong>to</strong> do so, an NRF may<br />
only succeed in reducing <strong>the</strong> transparency <strong>of</strong> fiscal policy by creating a parallel<br />
budget or, at least, making it harder <strong>to</strong> moni<strong>to</strong>r <strong>the</strong> government’s performance in<br />
fiscal management.<br />
Humphreys and Sandbu (2007) suggest three general approaches <strong>to</strong> designing<br />
an NRF that could help <strong>to</strong> improve <strong>the</strong> incentives for responsible fiscal<br />
policy:<br />
• Rules-based design—The NRF should operate under rules that determine<br />
which revenues will be paid in<strong>to</strong> <strong>the</strong> fund and limit <strong>the</strong> discretion <strong>of</strong> <strong>the</strong><br />
current government <strong>to</strong> determine both <strong>the</strong> size and <strong>the</strong> allocation <strong>of</strong> spending<br />
from <strong>the</strong> fund. Determining how hard <strong>the</strong> rules should be involves <strong>the</strong><br />
familiar trade-<strong>of</strong>f between commitment and flexibility.<br />
• Broad governance—Governance <strong>of</strong> an NRF can be broadened beyond <strong>the</strong><br />
government <strong>of</strong> <strong>the</strong> day by involving o<strong>the</strong>r ac<strong>to</strong>rs in its decision-making,<br />
such as <strong>the</strong> legislature (as in Norway), members <strong>of</strong> opposition parties (as<br />
in Alaska), or new technical bodies that include representatives <strong>of</strong> civil<br />
society.<br />
• Transparency—Transparent operation <strong>of</strong> <strong>the</strong> NRF is critical <strong>to</strong> its efficacy.<br />
Fiscal transparency is a prerequisite for good governance in general (Kopits<br />
and Craig, 1998). It should lead <strong>to</strong> better-informed public debate about <strong>the</strong><br />
design and results <strong>of</strong> fiscal policy, make governments more accountable, and<br />
<strong>the</strong>reby streng<strong>the</strong>n government credibility and enhance public understanding<br />
<strong>of</strong> macroeconomic policies and choices.<br />
With respect <strong>to</strong> transparency, Collier and o<strong>the</strong>rs (2009) argue that one<br />
approach is <strong>to</strong> establish new, explicit, and transparent decision processes for natural<br />
resource revenues linked <strong>to</strong> a clear vision <strong>of</strong> long-term development. While<br />
this approach runs counter <strong>to</strong> <strong>the</strong> ideal fiscal principle <strong>of</strong> a fully integrated budget<br />
©International Monetary Fund. Not for Redistribution
Hamil<strong>to</strong>n and Ley 141<br />
in which all revenues are pooled, Collier and o<strong>the</strong>rs argue that it might have<br />
superior informational properties. By spotlighting <strong>the</strong> new spending, it may make<br />
scrutiny easier and signal <strong>to</strong> citizens that a windfall will not be captured by special<br />
interests.<br />
Concerning <strong>the</strong> design <strong>of</strong> NRFs, Collier and o<strong>the</strong>rs (2009) note that while<br />
most <strong>of</strong> <strong>the</strong> policy attention <strong>to</strong> date has been focused on “How much should be<br />
saved?” <strong>the</strong> most important question for low-income countries is “What assets<br />
should be acquired?” They answer that, since low-income countries are capitalscarce,<br />
<strong>the</strong> assets should be accumulated by public investment within <strong>the</strong> country.<br />
Thus, for low-income countries, Sachs (2007) and Collier and o<strong>the</strong>rs (2009)<br />
argue strongly for using <strong>the</strong> natural-resource revenues <strong>to</strong> increase public investment,<br />
spending <strong>the</strong>m on public assets (human capital and physical infrastructure)<br />
with a high social rate <strong>of</strong> return.<br />
This strategy, however, requires that countries invest in <strong>the</strong>ir capacity <strong>to</strong> invest.<br />
For public investment <strong>to</strong> deliver high returns, it must be appropriately appraised<br />
and well managed. Countries <strong>of</strong>ten encounter managerial and physical bottlenecks<br />
when stepping up public investment. In many cases, avoiding bad investments<br />
may be as important as identifying <strong>the</strong> best projects.<br />
Sachs (2007) also argues that well-appraised public investment can help alleviate<br />
<strong>the</strong> effects <strong>of</strong> Dutch disease. He makes <strong>the</strong> case that Dutch disease is primarily<br />
a concern if <strong>the</strong> resource boom is used <strong>to</strong> finance consumption ra<strong>the</strong>r<br />
than investment. In many resource-rich developing economies, <strong>the</strong>re is a serious<br />
gap in public goods. Developing public infrastructure—roads, ports, power,<br />
communications, education, and health care services—will raise <strong>the</strong> productivity<br />
<strong>of</strong> private capital and induce greater private investment. This effect can <strong>of</strong>fset<br />
<strong>the</strong> negative impact <strong>of</strong> exchange rate appreciation on <strong>the</strong> nonresource tradable<br />
sec<strong>to</strong>r.<br />
Resource funds can be a useful <strong>to</strong>ol for stabilizing <strong>the</strong> fiscal system in <strong>the</strong> face<br />
<strong>of</strong> revenue volatility, <strong>the</strong>refore, and can ensure that <strong>the</strong> revenues from exhaustible<br />
resources are saved ra<strong>the</strong>r than consumed. But <strong>the</strong>y are not a substitute for overall<br />
fiscal discipline and sound budgetary practices.<br />
Examples <strong>of</strong> NRFs around <strong>the</strong> world are shown in <strong>the</strong> Appendix.<br />
Public Investment Management<br />
If governments choose <strong>to</strong> invest resource revenues in infrastructure and o<strong>the</strong>r<br />
public projects, <strong>the</strong>n <strong>the</strong> quality <strong>of</strong> public investment management becomes key<br />
in determining <strong>the</strong>ir development outcomes. Harberger (2005) argues that an<br />
improved project evaluation system, one that significantly increases <strong>the</strong> rate <strong>of</strong><br />
economic productivity <strong>of</strong> public investments, will have a permanent and continuing<br />
effect on a country’s growth rate. This contrasts with o<strong>the</strong>r successful policy<br />
reforms (e.g., trade, tax, and regula<strong>to</strong>ry reforms) that raise <strong>the</strong> time path <strong>of</strong><br />
national income but whose effects on <strong>the</strong> growth rate are one-<strong>of</strong>f events (that is,<br />
yielding benefits only at <strong>the</strong> time <strong>of</strong> <strong>the</strong> reform). An improved public investment<br />
management system has <strong>the</strong> potential <strong>to</strong> permanently increase <strong>the</strong> country’s<br />
growth rate.<br />
©International Monetary Fund. Not for Redistribution
142 Sustainable Fiscal Policy for Mineral-Based Economies<br />
As noted by Belli and o<strong>the</strong>rs (2001), decision makers must look at public projects<br />
from several points <strong>of</strong> view simultaneously, including <strong>the</strong>se three:<br />
• Pr<strong>of</strong>itability: From <strong>the</strong> country’s viewpoint—<strong>to</strong> ensure that projects contribute<br />
more resources <strong>to</strong> <strong>the</strong> economy than <strong>the</strong>y use.<br />
• Feasibility: From <strong>the</strong> financial and fiscal viewpoints—<strong>to</strong> ensure that <strong>the</strong><br />
implementing agencies will have <strong>the</strong> necessary resources <strong>to</strong> implement projects<br />
as designed.<br />
• Fairness: From <strong>the</strong> viewpoint <strong>of</strong> <strong>the</strong> people who are most affected by <strong>the</strong><br />
projects—<strong>to</strong> ensure that <strong>the</strong> distribution <strong>of</strong> costs and benefits is acceptable<br />
<strong>to</strong> society at large.<br />
Rajaram and o<strong>the</strong>rs (2008) identify a list <strong>of</strong> nine key must-have features in any<br />
well-functioning system for public investment management. These comprise <strong>the</strong><br />
bare-bones institutional features that would minimize major risks and provide an<br />
effective process for managing public investments:<br />
(i) Investment guidance and preliminary screening. Some measure <strong>of</strong> broad<br />
strategic guidance for public investment is <strong>of</strong>ten an important way <strong>to</strong><br />
anchor government decisions and <strong>to</strong> guide sec<strong>to</strong>r-level decision makers.<br />
Such guidance may be derived from a national plan or ano<strong>the</strong>r medium<strong>to</strong><br />
long-term strategic document that establishes economy-wide development<br />
priorities at <strong>the</strong> highest decision-making levels. A first-level screening<br />
<strong>of</strong> all project proposals should be undertaken <strong>to</strong> ensure that <strong>the</strong>y meet<br />
<strong>the</strong> minimum criteria <strong>of</strong> consistency with <strong>the</strong> strategic goals <strong>of</strong> <strong>the</strong> government,<br />
as well as meeting <strong>the</strong> budget-classification tests for inclusion as<br />
a project ra<strong>the</strong>r than as a recurrent spending item.<br />
(ii) Formal project appraisal. Projects or programs that meet <strong>the</strong> first screening<br />
test should undergo more rigorous scrutiny <strong>of</strong> <strong>the</strong>ir cost-benefit ratio or<br />
cost effectiveness. The project selection process needs <strong>to</strong> ensure that projects<br />
proposed for financing have been evaluated for <strong>the</strong>ir social and economic<br />
value. The quality <strong>of</strong> beforehand project evaluation depends very<br />
much on <strong>the</strong> quality <strong>of</strong> this analysis, which in turn depends on <strong>the</strong> capacity<br />
<strong>of</strong> <strong>the</strong> staff and <strong>the</strong>ir project evaluation skills. Investment in training<br />
on project evaluation techniques is an important aspect <strong>of</strong> an effective<br />
public investment system.<br />
(iii) Independent review <strong>of</strong> appraisal. Where departments and ministries (ra<strong>the</strong>r<br />
than a central unit) undertake <strong>the</strong> appraisal, an independent peer review<br />
might be necessary in order <strong>to</strong> check any subjective, self-serving bias in<br />
<strong>the</strong> evaluation. It is crucial <strong>to</strong> kill bad projects before <strong>the</strong>y develop a<br />
strong constituency—even <strong>the</strong> worst projects have groups <strong>of</strong> beneficiaries<br />
and promoters.<br />
(iv) Project selection and budgeting. It is important that <strong>the</strong> process <strong>of</strong> appraising<br />
and selecting public investment projects is linked in an appropriate<br />
way <strong>to</strong> <strong>the</strong> budget cycle, even though <strong>the</strong> project evaluation and selection<br />
cycle may run on a different timetable. There is clearly a two-way<br />
©International Monetary Fund. Not for Redistribution
Hamil<strong>to</strong>n and Ley 143<br />
relationship between <strong>the</strong> budget cycle and <strong>the</strong> project evaluation and<br />
selection cycle. The fiscal framework and <strong>the</strong> annual budget need <strong>to</strong><br />
establish envelopes for public investment (on an aggregate and/or sec<strong>to</strong>ral<br />
basis) so that a sustainable investment program can be undertaken.<br />
Efficient investment also depends on whe<strong>the</strong>r <strong>the</strong> recurrent budget<br />
adjusts <strong>to</strong> reflect <strong>the</strong> impact <strong>of</strong> <strong>the</strong> capital projects.<br />
(v) Project implementation. Project design should include clear organizational<br />
arrangements and a realistic timetable <strong>to</strong> ensure that institutional capacity<br />
<strong>to</strong> implement <strong>the</strong> project is available and adequate.<br />
(vi) Project adjustment. The funding review process should be flexible in its<br />
disbursement pr<strong>of</strong>ile <strong>to</strong> account for changes in project circumstances. Each<br />
funding request should be accompanied by an updated cost-benefit analysis<br />
and a reminder <strong>to</strong> project sponsors <strong>of</strong> <strong>the</strong>ir accountability for <strong>the</strong> delivery<br />
<strong>of</strong> <strong>the</strong> benefits. These funding mechanisms can reinforce <strong>the</strong> moni<strong>to</strong>ring<br />
process, making it an active ra<strong>the</strong>r than a passive form <strong>of</strong> moni<strong>to</strong>ring.<br />
Governments need <strong>to</strong> create <strong>the</strong> capacity <strong>to</strong> moni<strong>to</strong>r implementation in a<br />
timely way and <strong>to</strong> address problems proactively as <strong>the</strong>y are identified.<br />
(vii) Facility operation. Asset registers need <strong>to</strong> be maintained and asset values<br />
recorded. Ideally, countries should require <strong>the</strong>ir operating agencies <strong>to</strong><br />
compile balance sheets on which <strong>the</strong> value <strong>of</strong> assets created through new<br />
fixed capital expenditures would be recorded. Whe<strong>the</strong>r <strong>the</strong>re is accrual<br />
accounting or not, agencies should maintain thorough asset registers,<br />
including legal title <strong>to</strong> property where necessary.<br />
(viii) Post-project evaluation. Evaluation <strong>of</strong> completed projects should focus on<br />
comparing <strong>the</strong> project’s outputs and outcomes with <strong>the</strong> objectives set<br />
forth in <strong>the</strong> project design. Good practice suggests that <strong>the</strong> project design<br />
should build in <strong>the</strong> evaluation criteria and that learning from such postcompletion<br />
evaluations should be applied <strong>to</strong> improve future project<br />
design and implementation.<br />
(ix) A fur<strong>the</strong>r concern is <strong>the</strong> public procurement process—since investment<br />
projects will need <strong>to</strong> contract for services and purchase project inputs, it<br />
is vital that <strong>the</strong> procurement system be transparent and rules-based. Weak<br />
procurement processes open <strong>the</strong> door <strong>to</strong> political interference and waste<br />
<strong>of</strong> public resources.<br />
Petrie (2009a, 2009b) discusses issues pertaining <strong>to</strong> public investment management<br />
in resource-rich countries. Petrie (2009a) notes that a public investment<br />
management system is an open system that impacts, and is impacted by, <strong>the</strong><br />
broader political economy <strong>of</strong> <strong>the</strong> state. It is increasingly recognized that <strong>the</strong> key<br />
determinants <strong>of</strong> success for a resource-dependent economy are <strong>the</strong> country’s overall<br />
governance framework and <strong>the</strong> political economy <strong>of</strong> rent extraction and management.<br />
Consequently, Petrie (2009b) sets <strong>the</strong> public investment management<br />
system within <strong>the</strong> context <strong>of</strong> <strong>the</strong> broader policy issues relating <strong>to</strong> natural resource<br />
extraction and <strong>the</strong> overall political environment.<br />
©International Monetary Fund. Not for Redistribution
144 Sustainable Fiscal Policy for Mineral-Based Economies<br />
CONCLUSIONS AND POLICY IMPLICATIONS<br />
Three key characteristics <strong>of</strong> mineral and energy resources have major impacts on<br />
public finances and government development policy:<br />
• Resource revenues tend <strong>to</strong> be large relative both <strong>to</strong> GDP and <strong>to</strong> <strong>the</strong> government<br />
budget.<br />
• Resource revenues are volatile, closely tied <strong>to</strong> <strong>the</strong> world business cycle.<br />
• The resources <strong>the</strong>mselves are finite and exhaustible.<br />
While natural resource abundance should be a blessing, <strong>the</strong>se three characteristics<br />
complicate a government’s task in ensuring sustainable growth and development:<br />
<strong>the</strong> first two characteristics potentially create a strong procyclical bias in<br />
fiscal policy, which can have destabilizing effects on macroeconomic performance;<br />
<strong>the</strong> third characteristic, exhaustibility, has implications for both how<br />
economic performance is measured and how a government leverages natural<br />
resources for development.<br />
On measuring economic performance, two alternative national accounting<br />
measures are needed for resource-extracting economies. Adjusted net national<br />
income (aNNI) gives a true measure <strong>of</strong> income, one that will generally be much<br />
lower than GNI, and its growth rate is likely <strong>to</strong> be considerably lower than <strong>the</strong><br />
GDP growth rate during resource booms. Tracking aNNI growth can <strong>the</strong>refore<br />
reduce policy mistakes in <strong>the</strong> form <strong>of</strong> overly expansionist fiscal policies. A second<br />
measure, adjusted net saving, gives a true measure <strong>of</strong> wealth creation, after<br />
accounting for investment in human capital, depletion <strong>of</strong> natural resources, and<br />
pollution damages—both <strong>the</strong>ory and evidence show this <strong>to</strong> be a leading indica<strong>to</strong>r<br />
<strong>of</strong> <strong>the</strong> sustainability <strong>of</strong> development.<br />
Sustainable fiscal policy, essential for sustainable development in resourceextracting<br />
economies, requires a foundation built out <strong>of</strong> five essential materials:<br />
(i) tracking adjusted measures <strong>of</strong> <strong>the</strong> government’s net operating balance in order<br />
<strong>to</strong> assess fiscal space; (ii) effectively and efficiently taxing <strong>the</strong> pr<strong>of</strong>its on resource<br />
exploitation; (iii) applying fiscal rules in order <strong>to</strong> ensure that resource revenues are<br />
saved ra<strong>the</strong>r than consumed; (iv) establishing a natural resource fund in order <strong>to</strong><br />
assist with stabilization and ensure that savings are used effectively; and (v) building<br />
a strong public investment management system in order <strong>to</strong> ensure <strong>the</strong> quality<br />
<strong>of</strong> public investments financed by resource revenues.<br />
That list <strong>of</strong> <strong>the</strong> constituents <strong>of</strong> sustainable fiscal policy is long, suggesting <strong>the</strong><br />
size <strong>of</strong> <strong>the</strong> challenge that extractive economies face. While <strong>the</strong> Hartwick rule is<br />
easy <strong>to</strong> state, it is complex <strong>to</strong> implement, and it requires fiscal discipline. But a<br />
growing understanding by policymakers <strong>of</strong> <strong>the</strong> need <strong>to</strong> transform exhaustible<br />
resources in<strong>to</strong> o<strong>the</strong>r forms <strong>of</strong> wealth can provide <strong>the</strong> impetus for reform and<br />
policy success.<br />
©International Monetary Fund. Not for Redistribution
Appendix. Examples <strong>of</strong> <strong>Natural</strong> Resource Funds<br />
Country/<br />
state Name<br />
Alberta<br />
(Canada)<br />
Alaska<br />
(United<br />
States)<br />
Alberta<br />
Heritage<br />
Savings Trust<br />
Fund<br />
Alaska<br />
Permanent<br />
Fund<br />
Chile Copper<br />
Stabilization<br />
Fund<br />
Kuwait GRF General Reserve<br />
Fund<br />
Kuwait<br />
RFFG<br />
Reserve Fund<br />
for Future<br />
Kiribati Generations<br />
Revenue<br />
Equalization<br />
Reserve Fund<br />
Norway Government<br />
Pension Fund<br />
Global<br />
Stated<br />
objective(s)<br />
Savings<br />
(prior <strong>to</strong> 1997<br />
economic and<br />
social development<br />
were<br />
also included)<br />
Date<br />
established<br />
Accumulation<br />
rules<br />
1976 30% <strong>of</strong> resource<br />
revenues until<br />
1983. 1984-87:<br />
15%. Transfers<br />
discontinued<br />
<strong>the</strong>reafter.<br />
Savings 1976 50% <strong>of</strong> certain<br />
mineral revenues<br />
(increased from<br />
25% in 1980).<br />
Stabilization 1985<br />
(activated<br />
in 1987)<br />
Stabilization<br />
and savings<br />
Based on discretionary<br />
reference<br />
price determined<br />
by <strong>the</strong> government.<br />
1960 Residual budgetary<br />
surpluses.<br />
Savings 1976 10% <strong>of</strong> all government<br />
revenue 3<br />
Stabilization<br />
and savings<br />
Stabilization<br />
and savings<br />
1956 4 “When surplus<br />
permits,” later<br />
apparently<br />
changed <strong>to</strong> 25%<br />
<strong>of</strong> all phosphate<br />
receipts.<br />
1990,<br />
activated<br />
in 1995<br />
Net government<br />
oil revenues.<br />
Hamil<strong>to</strong>n and Ley 145<br />
Withdrawal<br />
rules<br />
Discretionary<br />
transfers<br />
<strong>to</strong> <strong>the</strong> budget.<br />
Principal (inflation-adjusted).<br />
1<br />
Transfers <strong>to</strong><br />
<strong>the</strong> budget<br />
(and extrabudgetary<br />
lending) based<br />
on discretionary<br />
reference<br />
price determined<br />
by <strong>the</strong><br />
government. 2<br />
Discretionary<br />
transfers <strong>to</strong> <strong>the</strong><br />
budget.<br />
Discretionary<br />
transfers <strong>to</strong><br />
<strong>the</strong> budget<br />
(with National<br />
Assembly<br />
approval).<br />
Discretionary<br />
transfers <strong>to</strong> <strong>the</strong><br />
budget with<br />
Parliamentary<br />
approval and<br />
that <strong>of</strong> o<strong>the</strong>r<br />
<strong>of</strong>ficials.<br />
Discretionary<br />
transfers <strong>to</strong> <strong>the</strong><br />
budget <strong>to</strong><br />
finance <strong>the</strong><br />
non-oil deficit<br />
(approved by<br />
Parliament).<br />
©International Monetary Fund. Not for Redistribution<br />
Compliance<br />
with rules/<br />
Control<br />
changes <strong>to</strong><br />
rules<br />
Yes/Yes:<br />
Oversight<br />
Committee<br />
(Members <strong>of</strong><br />
Parliament)<br />
and Provincial<br />
Treasurer<br />
Yes/Yes:<br />
Independent<br />
trustees, ultimately<br />
<strong>the</strong><br />
governor and<br />
legislature<br />
Yes/No:<br />
Ministry <strong>of</strong><br />
finance,<br />
Central Bank,<br />
and state copper<br />
company<br />
(CODELCO)<br />
Minister <strong>of</strong><br />
Finance,<br />
Central Bank,<br />
governor, and<br />
o<strong>the</strong>r <strong>of</strong>ficials<br />
Minister <strong>of</strong><br />
Finance,<br />
Central Bank<br />
governor, and<br />
o<strong>the</strong>r <strong>of</strong>ficials<br />
No/Yes:<br />
Minister <strong>of</strong><br />
Finance,<br />
Secretary <strong>of</strong><br />
<strong>the</strong> Cabinet,<br />
and o<strong>the</strong>r <strong>of</strong>ficials<br />
Yes/No:<br />
Ministry <strong>of</strong><br />
Finance
146 Sustainable Fiscal Policy for Mineral-Based Economies<br />
Appendix (continued)<br />
Country/<br />
state Name<br />
Oman<br />
SGRF<br />
Oman<br />
CF<br />
Oman<br />
OF<br />
Papua New<br />
Guinea<br />
State General<br />
Reserve Fund<br />
Contingency<br />
Fund<br />
Stated<br />
objective(s)<br />
Oil Fund Oil sec<strong>to</strong>r<br />
investment<br />
Mineral<br />
<strong>Resources</strong><br />
Stabilization<br />
Fund<br />
Venezuela Macroeconomic<br />
Stabilization<br />
Fund<br />
Date<br />
established<br />
Accumulation<br />
rules<br />
Savings 1980 Since 1998, oil<br />
revenue in excess<br />
<strong>of</strong> budgeted<br />
amount.<br />
Stabilization 1990,<br />
abolished<br />
in 1993<br />
Stabilization 1974,<br />
abolished<br />
in 2001<br />
Residual oil revenue<br />
after budget<br />
and SGRF allocations.<br />
1993 Since 1998,<br />
market value <strong>of</strong><br />
15,000 barrels per<br />
day.<br />
Government mineral<br />
revenues.<br />
Stabilization 1998 Since 1999, 50%<br />
<strong>of</strong> oil revenue<br />
above reference<br />
values, set by<br />
decree for 1999-<br />
2004. 5<br />
Withdrawal<br />
rules<br />
Discretionary<br />
transfers <strong>to</strong> <strong>the</strong><br />
budget.<br />
Government<br />
discretion,<br />
though based<br />
on estimates<br />
<strong>of</strong> long-run<br />
prices.<br />
Transfers <strong>to</strong><br />
<strong>the</strong> budget<br />
and o<strong>the</strong>r state<br />
entities based<br />
on reference<br />
values; discretionary<br />
transfers also<br />
allowed. 5<br />
Compliance<br />
with rules/<br />
Control<br />
changes <strong>to</strong><br />
rules<br />
Yes:<br />
Au<strong>to</strong>nomous<br />
government<br />
agency<br />
Ministry <strong>of</strong><br />
Finance<br />
Yes:<br />
Government<br />
No/Yes:<br />
Parliament<br />
and <strong>the</strong><br />
Executive.<br />
Sources: Table 11.2 in Davis, Ossowski, Daniel, and Barnett (2001); original sources: national authorities; and<br />
IMF staff.<br />
1<br />
Fixed proportion <strong>of</strong> <strong>the</strong> earnings are distributed as cash <strong>to</strong> Alaskans; earnings are also used <strong>to</strong> inflationpro<strong>of</strong><br />
<strong>the</strong> principal (as required by <strong>the</strong> 1982 amendment) and <strong>to</strong> increase capital.<br />
2<br />
If copper price reaches $0.04 per pound above reference price, no deposit is made; <strong>the</strong>re is a 50 percent<br />
deposit between $0.04 and $0.06 per pound, and 100 percent <strong>the</strong>reafter. Withdrawals are symmetric.<br />
3<br />
Received 50 percent <strong>of</strong> GRF assets when established.<br />
4<br />
Phosphate s<strong>to</strong>ck became exhausted in 1979.<br />
5Fifty percent (100 percent before 1999 change) <strong>of</strong> revenue above reference value <strong>to</strong> be deposited.<br />
Withdrawals, with congressional approval, if (a) oil revenues in given year are lower than reference value,<br />
or (b) <strong>the</strong> resources <strong>of</strong> <strong>the</strong> fund exceed 80 percent <strong>of</strong> annual average oil revenue in <strong>the</strong> five preceding<br />
years. Withdrawals under (b) were initially earmarked for debt repayment and capital expenditure. After<br />
1999 <strong>the</strong>se withdrawals were earmarked for social and investment spending and debt repayment. Fund<br />
balance at <strong>the</strong> end <strong>of</strong> <strong>the</strong> fiscal year must not be less than one-third <strong>of</strong> <strong>the</strong> balance at <strong>the</strong> end <strong>of</strong> <strong>the</strong> preceding<br />
year. In late 2001 <strong>the</strong> rules were modified again, and <strong>the</strong> central government and <strong>the</strong> state oil company<br />
were exempted from depositing resources in <strong>the</strong> fund in <strong>the</strong> last quarter <strong>of</strong> 2001 and during 2002.<br />
©International Monetary Fund. Not for Redistribution
REFERENCES<br />
Hamil<strong>to</strong>n and Ley 147<br />
Asheim, G.B., and M.L. Weitzman, 2001, “Does NNP Growth Indicate Welfare Improvement?”<br />
Economics Letters, Vol. 73, No. 2, pp. 233–39.<br />
Belli, P., J.R. Anderson, H.N. Barnum, J.A. Dixon, and J.-P. Tan, 2001, Economic Analysis <strong>of</strong><br />
Investment Operations—Analytical Tools and Practical Applications (Washing<strong>to</strong>n: World<br />
Bank).<br />
Boadway, R., and M. Keen, 2010, “Theoretical Perspectives on Resource Tax Design,” in The<br />
Taxation <strong>of</strong> Petroleum and Minerals: Principles, Problems and Practice, ed. by P. Daniel,<br />
M. Keen, and C. McPherson (Abingdon: Routledge).<br />
Collier, P., R. van der Ploeg, M. Spence, and A. Venables, 2010, “Managing Resource Revenues<br />
in Developing Countries,” IMF Staff Papers, Vol. 57, No. 1, pp. 84–118.<br />
Dasgupta, P., and K-G Mäler, 2000, “Net National Product, Wealth, and Social Well-Being,”<br />
Environment and Development Economics, Vol. 5, Parts 1&2 (February and May), pp. 69–93.<br />
Davis, J., R. Ossowski, J. Daniel, and S. Barnett, 2001, Stabilization and Savings Funds for<br />
Nonrenewable <strong>Resources</strong>: Experience and Fiscal Policy Implications, IMF Occasional Paper No.<br />
205 (Washing<strong>to</strong>n: International Monetary Fund).<br />
Davis, J.M., R. Ossowski, and A. Fedelino, 2003, Fiscal Policy Formulation and Implementation<br />
in Oil-Producing Countries (Washing<strong>to</strong>n: International Monetary Fund).<br />
Ferreira, S., K. Hamil<strong>to</strong>n, and J. Vincent, 2008, “Comprehensive Wealth and Future<br />
Consumption: Accounting for Population Growth,” World Bank Economic Review, Vol. 22,<br />
No. 2, pp. 233–48.<br />
Hamil<strong>to</strong>n, K., and M. Clemens, 1999, “Genuine Savings Rates in Developing Countries,” The<br />
World Bank Economic Review, Vol. 13, No. 2, pp. 333–56.<br />
Harberger, A., 2005, “On <strong>the</strong> Process <strong>of</strong> Growth and Economic Policy in Developing<br />
Countries,” USAID PPC Issue Paper No. 13 (Washing<strong>to</strong>n: U.S. Agency for International<br />
Development).<br />
Hartwick, J., 1977, “Intergenerational Equity and <strong>the</strong> Investing <strong>of</strong> Rents from Exahustible<br />
<strong>Resources</strong>,” The American Economic Review, Vol. 66, pp. 972–74.<br />
Humphreys, M., and M.E. Sandbu, 2007, “The Political Economy <strong>of</strong> <strong>Natural</strong> Resource Funds,”<br />
in Escaping <strong>the</strong> Resource Curse, ed. by M. Humphreys, J.D. Sachs, and J.E. Stiglitz (New York:<br />
Columbia University Press).<br />
International Monetary Fund (IMF), 2001, Government Finance Statistics Manual 2001<br />
(Washing<strong>to</strong>n: International Monetary Fund).<br />
Kojo, N.C., 2010, “Diamonds Are Not Forever: Botswana Medium-Term Fiscal Sustainability,”<br />
Policy Research Working Paper No. 5480 (Washing<strong>to</strong>n: The World Bank).<br />
Kopits, G.F., and J. Craig, 1998, “Transparency in Government Operations,” IMF Occasional<br />
Paper No. 158 (Washing<strong>to</strong>n: International Monetary Fund).<br />
Kopits, G.F., and S. Symansky, 1998, “Fiscal Policy Rules,” IMF Occasional Paper No. 162<br />
(Washing<strong>to</strong>n: International Monetary Fund).<br />
McPherson, C., 2003, “National Oil Companies: Evolution, Issues, Outlook,” in Fiscal Policy<br />
Formulation and Implementation in Oil-Producing Countries, ed. by J.M. Davis, R. Ossowski,<br />
and A. Fedelino (Washing<strong>to</strong>n: International Monetary Fund).<br />
———, 2010, “State Participation in <strong>the</strong> <strong>Natural</strong> Resource Sec<strong>to</strong>rs: Evolution, Issues, and<br />
Outlook,” in The Taxation <strong>of</strong> Petroleum and Minerals: Principles, Problems and Practice, ed. by<br />
P. Daniel, M. Keen, and C. McPherson (Abingdon: Routledge).<br />
Petrie, M., 2009a, “Public Investment Management in Resource-Rich Countries: Overview<br />
Paper,” unpublished (Washing<strong>to</strong>n: World Bank PRMPS).<br />
———, 2009b, “Public Investment Management: Technical Note as Adapted for Resource<br />
Rich Countries” unpublished (Washing<strong>to</strong>n: World Bank, Public Sec<strong>to</strong>r Governance Unit).<br />
Rajaram, A., T.-M. Le, N. Biletska, and J. Brumby, 2008, “A Diagnostic Framework for<br />
Assessing Public Investment Management” (Washing<strong>to</strong>n: World Bank PRMPS, PREM<br />
Network).<br />
©International Monetary Fund. Not for Redistribution
148 Sustainable Fiscal Policy for Mineral-Based Economies<br />
Sachs, J.D., 2007, “How <strong>to</strong> Handle <strong>the</strong> Macroeconomics <strong>of</strong> Oil Wealth,” in Escaping <strong>the</strong><br />
Resource Curse, ed. by M. Humphreys, J. D. Sachs, and J.E. Stiglitz (New York: Columbia<br />
University Press).<br />
Solow, R.M., 1974, “Intergenerational Equity and Exhaustible <strong>Resources</strong>,” Review <strong>of</strong> Economic<br />
Studies, Vol. 41, Symposium on <strong>the</strong> Economics <strong>of</strong> Exhaustible <strong>Resources</strong>, pp. 29–45.<br />
Sunley, E.M., T. Baunsgaard, and D. Simard, 2003, “Revenue from <strong>the</strong> Oil and Gas Sec<strong>to</strong>r:<br />
Issues and Country Experience,” in Fiscal Policy Formulation and Implementation in Oil-<br />
Producing Countries, ed. by J.M. Davis, R. Ossowski, and A. Fedelino (Washing<strong>to</strong>n:<br />
International Monetary Fund).<br />
World Bank, 2006, Where Is <strong>the</strong> Wealth <strong>of</strong> Nations? Measuring Capital for <strong>the</strong> 21st Century<br />
(Washing<strong>to</strong>n: The World Bank).<br />
———, 2010, World Development Indica<strong>to</strong>rs 2010 (Washing<strong>to</strong>n: The World Bank).<br />
———, 2011, The Changing Wealth <strong>of</strong> Nations: Measuring Sustainable Development in <strong>the</strong> New<br />
Millennium (Washing<strong>to</strong>n: The World Bank).<br />
©International Monetary Fund. Not for Redistribution
Fiscal Policy in Commodity-<br />
Exporting Countries: Stability<br />
and Growth<br />
RABAH AREZKI<br />
INTRODUCTION<br />
CHAPTER 9<br />
In <strong>the</strong> late 1950s, Richard Musgrave made <strong>the</strong> case for a “three-function framework”<br />
which has influenced <strong>the</strong> way economists approach fiscal policy and its<br />
objectives <strong>to</strong> this day. This framework suggests that government activity should<br />
be separated in<strong>to</strong> three branches, namely macroeconomic stabilization, resource<br />
allocation, and income redistribution. The stabilization branch is <strong>to</strong> assure <strong>the</strong><br />
achievement <strong>of</strong> high employment and price stability, <strong>the</strong> allocation branch is <strong>to</strong><br />
see that resources are used efficiently, and <strong>the</strong> distribution branch is <strong>to</strong> achieve an<br />
equitable distribution <strong>of</strong> income. (Musgrave, 1959). The present chapter is concerned<br />
specifically with <strong>the</strong> performance <strong>of</strong> commodity-exporting countries in<br />
terms <strong>of</strong> macroeconomic stability and long-run economic growth, based on an<br />
examination <strong>of</strong> a new dataset on nonresource GDP from a panel <strong>of</strong> up <strong>to</strong> 134<br />
countries during <strong>the</strong> period 1970–2007. 1,2<br />
This chapter links <strong>to</strong> <strong>the</strong> literature on <strong>the</strong> role <strong>of</strong> fiscal policy in shaping <strong>the</strong><br />
economic performance <strong>of</strong> developing countries. There is ample evidence that fiscal<br />
policy in developing countries has achieved mixed results, in both <strong>the</strong> short<br />
run and <strong>the</strong> long run. In <strong>the</strong> short run, Kaminsky, Reinhart, and Vegh (2004),<br />
Rabah Arezki is an economist at <strong>the</strong> IMF Institute, International Monetary Fund. This chapter is<br />
based on <strong>the</strong> author’s presentation at “<strong>Natural</strong> <strong>Resources</strong>, Finance, and Development: Confronting<br />
Old and New Challenges,” a high-level seminar organized by <strong>the</strong> Bank <strong>of</strong> Algeria and <strong>the</strong> IMF<br />
Institute, which <strong>to</strong>ok place in Algiers, on November 4 and 5, 2010. The author wishes <strong>to</strong> thank<br />
Bertrand Candelon, Reda Cherif, Kirk Hamil<strong>to</strong>n, Aasim Husain, Mustapha Nabli, and <strong>the</strong> seminar<br />
participants, as well as Kazim Kazimov for outstanding research assistance. The author can be contacted<br />
at rarezki@imf.org.<br />
1<br />
Arezki, Hamil<strong>to</strong>n, and Kazimov (2011) provide a detailed technical discussion <strong>of</strong> <strong>the</strong> results presented<br />
in this chapter.<br />
2<br />
We leave <strong>the</strong> analysis <strong>of</strong> <strong>the</strong> “third function” <strong>of</strong> fiscal policy in commodity-exporting countries—<br />
namely achieving an equitable distribution <strong>of</strong> income—for fur<strong>the</strong>r research. A nascent literature has<br />
investigated <strong>the</strong> issue (see Ross (2007) and Goderis and Malone (2008) among o<strong>the</strong>rs).<br />
©International Monetary Fund. Not for Redistribution<br />
149
150 Fiscal Policy in Commodity-Exporting Countries: Stability and Growth<br />
among o<strong>the</strong>rs, provide evidence that fiscal policy tends <strong>to</strong> be procyclical in developing<br />
countries, especially when compared <strong>to</strong> industrialized countries. Three<br />
important characteristics <strong>of</strong> commodity-exporting countries complicate <strong>the</strong> conduct<br />
<strong>of</strong> fiscal policy and are likely <strong>to</strong> make government spending more procyclical<br />
than in non-commodity-exporting countries. First, government revenues derived<br />
from <strong>the</strong> exploitation <strong>of</strong> natural resources are more volatile than o<strong>the</strong>r sources<br />
<strong>of</strong> government revenue. Second, <strong>the</strong> size <strong>of</strong> <strong>the</strong> revenues derived from natural<br />
resources is disproportionately large in commodity-exporting countries, notwithstanding<br />
<strong>the</strong> distinction between resource dependence and resource abundance.<br />
Third, those revenues are prone <strong>to</strong> rent-seeking behavior, as <strong>the</strong>y more directly<br />
transit <strong>to</strong> government c<strong>of</strong>fers.<br />
Cudding<strong>to</strong>n (1989) provides some evidence supporting <strong>the</strong> claim that fiscal<br />
policy is more procyclical in commodity-exporting countries. In <strong>the</strong> long run,<br />
<strong>the</strong>re is also mixed evidence that government spending has helped boost developing<br />
countries’ economic performance (Blejer and Khan, 1984; Khan, 1996). In<br />
commodity-exporting countries, Gelb and associates (1988) provide evidence<br />
that governments in those countries <strong>of</strong>ten embark on large investment projects following<br />
commodity price booms. They argue that those investment projects have<br />
been plagued by inefficiencies and also contributed <strong>to</strong> resource misallocation.<br />
Disproportionally large investment projects also get depreciated quickly or even<br />
become obsolete when governments become unable <strong>to</strong> cover <strong>the</strong> associated high<br />
maintenance costs due <strong>to</strong> lack <strong>of</strong> financing. Robinson and Torvik (2005) provide a<br />
political economy model in which “white elephants” may be preferred <strong>to</strong> socially<br />
efficient projects when <strong>the</strong> political benefits are large compared <strong>to</strong> <strong>the</strong> surplus generated<br />
by <strong>the</strong> efficient projects. This evidence could suggest that poor long-run<br />
economic performance in commodity-exporting countries may stem from inefficiencies<br />
in government investments ra<strong>the</strong>r than from underinvestment.<br />
Fur<strong>the</strong>r, this chapter relates <strong>to</strong> <strong>the</strong> literature on <strong>the</strong> so-called resource curse,<br />
focusing specifically on <strong>the</strong> consequences that resource endowment has on <strong>the</strong><br />
economic performance <strong>of</strong> commodity-exporting countries. This literature has<br />
emphasized several channels through which resource windfalls may affect economic<br />
performance, including <strong>the</strong> so-called Dutch disease and a deterioration <strong>of</strong><br />
institutions, <strong>to</strong> name a few (Frankel, 2011a). Overall, <strong>the</strong>re is some evidence,<br />
albeit controversial, that commodity-exporting countries’ growth performance<br />
compares less favorably with <strong>the</strong> growth performance <strong>of</strong> non-commodityexporting<br />
countries. Among o<strong>the</strong>rs, Alexeev and Conrad (2009) provide evidence<br />
supporting a more skeptical view <strong>of</strong> <strong>the</strong> resource curse. Using traditional crosssectional<br />
growth regressions, <strong>the</strong>y find for instance that <strong>the</strong> empirical association<br />
between resource dependence and economic performance is not robust when<br />
using samples with different starting years. In a recent attempt <strong>to</strong> reconcile this<br />
conflicting evidence regarding <strong>the</strong> existence <strong>of</strong> a resource curse, Collier and<br />
Goderis (2007) use panel cointegration techniques, allowing <strong>the</strong>m <strong>to</strong> disentangle<br />
<strong>the</strong> short- and long-run effects <strong>of</strong> resource windfalls on overall GDP growth.<br />
They find that commodity price shocks have a positive effect in <strong>the</strong> short run but<br />
a negative effect in <strong>the</strong> long run.<br />
©International Monetary Fund. Not for Redistribution
Arezki 151<br />
This chapter makes two main contributions <strong>to</strong> <strong>the</strong> existing literature. First, it<br />
focuses on <strong>the</strong> effect resource windfalls have on <strong>the</strong> nonresource sec<strong>to</strong>r. To examine<br />
this, we use a new dataset on nonresource GDP, allowing us <strong>to</strong> avoid <strong>the</strong> noise<br />
introduced by <strong>the</strong> resource-sec<strong>to</strong>r contribution <strong>to</strong> overall GDP. 3 As argued by <strong>the</strong><br />
World Bank, “There are no sustainable diamond mines, but <strong>the</strong>re are sustainable<br />
diamond-mining countries” (World Bank, 2006). Hartwick (1977) provides a<br />
canonical rule for sustainability in resource-dependent economies: If genuine saving<br />
is set equal <strong>to</strong> zero at each point in time (that is, traditional net saving just<br />
equals resource depletion), <strong>the</strong>n consumption can be maintained indefinitely,<br />
even in <strong>the</strong> face <strong>of</strong> finite resources and fixed technology. From a policy perspective,<br />
nonresource-sec<strong>to</strong>r GDP is thus <strong>the</strong> relevant measure <strong>to</strong> be used when assessing<br />
both <strong>the</strong> macroeconomic stability and <strong>the</strong> long-run economic performance <strong>of</strong><br />
commodity-exporting countries. Indeed preserving <strong>the</strong> macroeconomic stability<br />
<strong>of</strong> <strong>the</strong> nonresource sec<strong>to</strong>r specifically will contribute <strong>to</strong> fostering investments in<br />
that sec<strong>to</strong>r and will <strong>the</strong>refore contribute <strong>to</strong> sustained economic growth after<br />
natural resources are depleted.<br />
Second, unlike previous studies, <strong>the</strong> econometric investigation in this chapter<br />
explicitly takes in<strong>to</strong> account <strong>the</strong> role <strong>of</strong> fiscal policy in <strong>the</strong> analysis <strong>of</strong> <strong>the</strong> resource<br />
curse. In commodity-exporting countries, <strong>the</strong> resource sec<strong>to</strong>r <strong>of</strong>ten lacks direct<br />
structural linkages with <strong>the</strong> rest <strong>of</strong> <strong>the</strong> economy but exercises a significant externality,<br />
mostly through <strong>the</strong> fact that a large chunk <strong>of</strong> government spending is<br />
financed from revenues originating in <strong>the</strong> resource sec<strong>to</strong>r (through state ownership,<br />
taxation, or export tariffs). Identifying <strong>the</strong> nature <strong>of</strong> that externality can help<br />
foster our understanding <strong>of</strong> both <strong>the</strong> short-run dynamics <strong>of</strong> <strong>the</strong> nonresource<br />
sec<strong>to</strong>r and <strong>the</strong> sec<strong>to</strong>r’s long-run economic viability after natural resources are<br />
depleted.<br />
Our main findings are tw<strong>of</strong>old. First, we find that overall government spending<br />
in commodity-exporting countries has been procyclical. We also find that<br />
resource windfalls initially crowd out nonresource GDP, which <strong>the</strong>n increases as<br />
a result <strong>of</strong> <strong>the</strong> fiscal expansion. Second, we find that in <strong>the</strong> long run, resource<br />
windfalls have negative effects on <strong>the</strong> nonresource sec<strong>to</strong>r’s GDP growth but not<br />
over government spending. Both effects—<strong>of</strong> resource windfalls and government<br />
spending on macroeconomic stability and economic growth—are moderated by<br />
<strong>the</strong> quality <strong>of</strong> political institutions.<br />
The remainder <strong>of</strong> this chapter is organized as follows. The next section<br />
describes <strong>the</strong> data. The section following that presents <strong>the</strong> estimation strategy and<br />
results, and <strong>the</strong> final section <strong>of</strong>fers four concluding remarks.<br />
3<br />
The next section describes <strong>the</strong> estimation <strong>of</strong> nonresource GDP, which takes in<strong>to</strong> account <strong>the</strong> depletion<br />
<strong>of</strong> <strong>the</strong> s<strong>to</strong>ck <strong>of</strong> natural resources.<br />
©International Monetary Fund. Not for Redistribution
152 Fiscal Policy in Commodity-Exporting Countries: Stability and Growth<br />
DATA<br />
Nonresource GDP<br />
Nonresource GDP is constructed by subtracting <strong>the</strong> real values <strong>of</strong> natural resources<br />
depletion from <strong>to</strong>tal GDP in 2005 purchasing power parity (PPP)-adjusted<br />
U.S. dollars. 4 <strong>Natural</strong> resources give rise <strong>to</strong> rents because <strong>the</strong>y are not produced;<br />
in contrast, for produced goods and services competitive forces will expand supply<br />
until economic pr<strong>of</strong>its are driven <strong>to</strong> zero. An economic rent represents an<br />
excess return <strong>to</strong> a given fac<strong>to</strong>r <strong>of</strong> production. The value <strong>of</strong> resource depletion is<br />
<strong>the</strong>refore calculated as <strong>the</strong> <strong>to</strong>tal rents on resource extraction and harvest, where<br />
rents are estimated as <strong>the</strong> difference between <strong>the</strong> value <strong>of</strong> production at world<br />
prices and <strong>to</strong>tal costs <strong>of</strong> production, including depreciation <strong>of</strong> fixed capital and<br />
return on capital (see Hamil<strong>to</strong>n and Ruta, 2008, for more details). The energy<br />
resources include oil, natural gas, and coal, while metals and minerals include<br />
bauxite, copper, gold, iron ore, lead, nickel, phosphate, silver, tin, and zinc.<br />
Resource Windfalls<br />
To capture revenue windfalls from international commodity price booms, <strong>the</strong><br />
analysis constructs a country-specific index which consists <strong>of</strong> a geometric average<br />
<strong>of</strong> international prices <strong>of</strong> various commodities using (time-invariant) weights<br />
based on <strong>the</strong> average value <strong>of</strong> exports <strong>of</strong> each commodity as measured in <strong>the</strong> GDP<br />
<strong>of</strong> a given country. Annual international commodity price data are for <strong>the</strong> 1970–<br />
2007 period, reported in <strong>the</strong> United Nations Conference on Trade and<br />
Development (UNCTAD) Commodity Statistics; data on <strong>the</strong> value <strong>of</strong> commodity<br />
exports is from <strong>the</strong> National Bureau <strong>of</strong> Economic Research (NBER)-United<br />
Nations Trade Database. Because <strong>the</strong> time-series behavior <strong>of</strong> many international<br />
commodity prices is highly persistent, commodity price shocks are identified by<br />
<strong>the</strong> (log) change in <strong>the</strong> international commodity price. 5<br />
Democracy<br />
Democracy is measured by <strong>the</strong> revised combined Polity score (Polity2) <strong>of</strong> <strong>the</strong> Polity<br />
IV database (Marshall and Jaggers, 2009). The Polity2 score ranges from –10 <strong>to</strong><br />
+10, with higher values indicating more democratic institutions. Following Persson<br />
and Tabellini (2003, 2006) and <strong>the</strong> Polity IV project, we code countries as democracies<br />
if <strong>the</strong>ir Polity2 score is strictly positive and as au<strong>to</strong>cracies if it is strictly negative.<br />
We fur<strong>the</strong>r classify countries as deep democracies if <strong>the</strong>ir Polity2 score is<br />
higher than 6, and as deep au<strong>to</strong>cracies if <strong>the</strong>ir Polity2 score is lower than –6.<br />
4<br />
The resource depletion data are from World Bank (2011) and <strong>the</strong> GDP data are from Hes<strong>to</strong>n,<br />
Summers, and Aten (2009).<br />
5The commodities included in <strong>the</strong> commodity export price index are aluminum, beef, c<strong>of</strong>fee, cocoa,<br />
copper, cot<strong>to</strong>n, gold, iron, maize, oil, rice, rubber, sugar, tea, <strong>to</strong>bacco, wheat, and wood. In case <strong>the</strong>re<br />
were multiple prices listed for <strong>the</strong> same commodity, a simple arithmetic price average was used.<br />
©International Monetary Fund. Not for Redistribution
ESTIMATION STRATEGY AND MAIN RESULTS<br />
Macroeconomic Stability<br />
Arezki 153<br />
A preliminary comparison between <strong>the</strong> evolution <strong>of</strong> our resource windfalls index<br />
and government spending indicates that for most commodity-exporting countries,<br />
those two aggregates co-move, and <strong>the</strong> extent <strong>of</strong> <strong>the</strong> co-movement has been<br />
increasing during <strong>the</strong> past decade following <strong>the</strong> commodity price boom <strong>of</strong> <strong>the</strong><br />
2000s. Figure 9.1 illustrates such findings for <strong>the</strong> case <strong>of</strong> Venezuela. The comovement<br />
between government spending and resource windfalls provides some<br />
evidence <strong>of</strong> <strong>the</strong> procyclicity <strong>of</strong> fiscal policy for most commodity-exporting countries.<br />
In contrast, for a limited number <strong>of</strong> commodity-exporting countries, such<br />
as Norway, government spending appears <strong>to</strong> move countercyclically with respect<br />
<strong>to</strong> resource windfalls, as illustrated in Figure 9.2. The latter evidence indicates<br />
some degree <strong>of</strong> heterogeneity in <strong>the</strong> fiscal policy <strong>of</strong> commodity-exporting countries.<br />
We now turn <strong>to</strong> a more systematic analysis <strong>of</strong> <strong>the</strong> short-run dynamics <strong>of</strong><br />
government spending and nonresource GDP in <strong>the</strong> face <strong>of</strong> resource windfall<br />
shocks.<br />
To do so we use panel vec<strong>to</strong>r au<strong>to</strong>regression (VAR) techniques, making it possible<br />
<strong>to</strong> isolate <strong>the</strong> dynamics <strong>of</strong> a statistical relationship and <strong>the</strong> interdependencies<br />
between multiple economic variables, namely resource windfalls assumed <strong>to</strong> be<br />
exogenous, and two endogenous variables, namely nonresource GDP and government<br />
spending as share <strong>of</strong> nonresource GDP. 6 Ano<strong>the</strong>r advantage <strong>of</strong> panel VAR<br />
techniques is that <strong>the</strong>y allow one <strong>to</strong> simultaneously estimate all relationships<br />
while taking in<strong>to</strong> account specific country characteristics through <strong>the</strong> use <strong>of</strong> fixed<br />
effects. 7 The results <strong>of</strong> <strong>the</strong> estimations are illustrated by <strong>the</strong> impulse responses<br />
presented in Figure 9.3. These suggest that <strong>the</strong> average effect <strong>of</strong> an increase in<br />
resource windfalls is followed by a statistically and economically significant<br />
increase in government spending. This provides supportive evidence <strong>of</strong> procyclical<br />
government spending policy in commodity-exporting countries. Figure 9.3<br />
also shows that resource windfall shocks initially crowd out nonresource GDP,<br />
which in turn increases as a result <strong>of</strong> <strong>the</strong> fiscal expansion. The intuition behind<br />
this result is that an increase in resource windfalls raises <strong>the</strong> return on investing<br />
in <strong>the</strong> resource sec<strong>to</strong>r, which in turn leads <strong>to</strong> a reallocation <strong>of</strong> fac<strong>to</strong>rs away from<br />
<strong>the</strong> nonresource sec<strong>to</strong>r in favor <strong>of</strong> <strong>the</strong> resource sec<strong>to</strong>r. As government spending<br />
increases in response <strong>to</strong> an increase in government revenues following a resource<br />
windfall, <strong>the</strong> nonresource sec<strong>to</strong>r expands. The latter results provide empirical<br />
evidence <strong>of</strong> a resource sec<strong>to</strong>r externality on<strong>to</strong> <strong>the</strong> nonresource sec<strong>to</strong>r, stemming<br />
from resource windfalls spurring government spending.<br />
6 Government spending data is from Hes<strong>to</strong>n, Summers, and Aten (2009).<br />
7 All <strong>the</strong> variables used in <strong>the</strong> panel VAR are used in log-difference. This is motivated by <strong>the</strong> fact that<br />
while panel-unit root tests suggest that those series are nonstationary, panel cointegration tests (first<br />
and second generations taking in<strong>to</strong> account cross-sectional dependence) reject <strong>the</strong> evidence <strong>of</strong> cointegration<br />
relationship between those variables.<br />
©International Monetary Fund. Not for Redistribution
154 Fiscal Policy in Commodity-Exporting Countries: Stability and Growth<br />
Figure 9.1<br />
Venezuela: Evolution <strong>of</strong> government spending and<br />
resource windfalls, 1970–2007<br />
Government Spending Per Capita<br />
0.4<br />
0.2<br />
0<br />
-0.2<br />
0.04<br />
0.03<br />
0.02<br />
0.01<br />
-0.01<br />
-0.4<br />
1970 1975 1980 1985 1990<br />
Years<br />
1995 2000 2005<br />
-0.02<br />
2010<br />
Government Spending Per Capita<br />
Resource Windfall Index<br />
Sources: Hes<strong>to</strong>n, Summers, and Aten (2009); UNCTAD Commodity Statistics;<br />
NBER-United Nations Trade Database; and author’s analysis.<br />
Figure 9.2<br />
Norway: Evolution <strong>of</strong> government spending and<br />
resource windfalls, 1970–2007<br />
Government Spending Per Capita<br />
0.08<br />
0.06<br />
0.04<br />
0.02<br />
0<br />
-0.02<br />
-0.02<br />
1970 1975 1980 1985 1990<br />
Years<br />
1995 2000 2005 2010<br />
Government Spending Per Capita<br />
Resource Windfall Index<br />
Sources: Hes<strong>to</strong>n, Summers, and Aten (2009); UNCTAD Commodity Statistics;<br />
NBER-United Nations Trade Database; and author’s analysis.<br />
0<br />
0.04<br />
0.03<br />
0.02<br />
0.01<br />
0<br />
-0.01<br />
©International Monetary Fund. Not for Redistribution<br />
Resource Windfall Index<br />
Resource Windfall Index
Figure 9.3<br />
Estimations <strong>of</strong> impulse response, panel VAR<br />
Spending Response<br />
NRGDP Response<br />
Resource Windfall shock<br />
0.010<br />
0.005<br />
0.000<br />
−0.005<br />
0.015<br />
0.010<br />
0.005<br />
0.000<br />
−0.005<br />
0 1 2 3 4 5 6<br />
0.010<br />
0.005<br />
0.000<br />
−0.005<br />
−0.010<br />
Resource Windfall shock<br />
−0.015<br />
0 1 2 3 4 5 6<br />
Source: Author’s analysis.<br />
Spending Response<br />
0.150<br />
0.100<br />
0.050<br />
0.000<br />
Spending shock<br />
− 0.050<br />
0 1 2 3 4 5 6<br />
Spending shock<br />
0.010<br />
0.000<br />
−0.010<br />
0.040<br />
0.030<br />
0.020<br />
0.010<br />
0.000<br />
−0.010<br />
0 1 2 3 4 5 6<br />
NRGDP Response<br />
−0.005<br />
0 1 2 3 4 5 6<br />
Arezki 155<br />
When expanding <strong>the</strong> empirical analysis <strong>to</strong> <strong>the</strong> real exchange rate and <strong>the</strong> nonresource<br />
current account, we find that resource windfalls lead <strong>to</strong> increased growth<br />
<strong>of</strong> <strong>the</strong> real effective exchange rate and <strong>to</strong> a deterioration in <strong>the</strong> nonresource current<br />
account (results not reported in tables). 8 Those results are consistent with<br />
Dutch disease. Indeed, government spending directed <strong>to</strong>ward <strong>the</strong> nontradable<br />
sec<strong>to</strong>r, where supply is inelastic, leads <strong>to</strong> an increase in <strong>the</strong> price <strong>of</strong> nontradable<br />
compared <strong>to</strong> tradable goods. This increase leads <strong>to</strong> an appreciation <strong>of</strong> <strong>the</strong> real<br />
exchange rate, with potentially harmful effects on external competitiveness consistent<br />
with a deterioration <strong>of</strong> <strong>the</strong> nonresource current account following a<br />
resource windfall shock.<br />
A relevant question is whe<strong>the</strong>r countries that have implemented fiscal rules<br />
defined as numerical targets <strong>to</strong> constraint budget aggregates differ in <strong>the</strong>ir macroeconomic<br />
stability. To answer this, we added <strong>to</strong> <strong>the</strong> previous VAR specification<br />
an interaction term between our resource windfall index and fiscal-rule dummies<br />
obtained from IMF (2009) (results not reported in tables). Our results indicate<br />
no evidence <strong>of</strong> a dicho<strong>to</strong>mous effect <strong>of</strong> resource windfalls depending on whe<strong>the</strong>r<br />
a fiscal rule has been implemented. One explanation could be that it is simply <strong>to</strong>o<br />
early <strong>to</strong> tell. Indeed, as documented by Ossowski and o<strong>the</strong>rs (2008), many <strong>of</strong><br />
those fiscal rules in commodity-exporting countries were only put in place in <strong>the</strong><br />
early 2000s. An alternative explanation could be that fiscal rules are not necessarily<br />
effective, since <strong>the</strong>y can be circumvented, especially in weak institutional<br />
environments. If that is true, <strong>the</strong> design <strong>of</strong> fiscal rules in commodity-exporting<br />
countries should perhaps be revisited <strong>to</strong> adapt <strong>the</strong>m <strong>to</strong> <strong>the</strong> challenges posed by<br />
8 The real exchange rate data is obtained from IMF (2010a) and <strong>the</strong> current account data is from IMF<br />
(2010b). The nonresource current account is constructed by subtracting commodity exports from<br />
overall current account.<br />
Spending Response<br />
NRGDP Response<br />
0.020<br />
0.015<br />
0.010<br />
0.005<br />
0.000<br />
NRGDP shock<br />
NRGDP shock<br />
0.060<br />
0.040<br />
0.020<br />
0.000<br />
0.080<br />
0.060<br />
0.040<br />
0.020<br />
0.000<br />
0 1 2 3 4 5 6<br />
©International Monetary Fund. Not for Redistribution
156 Fiscal Policy in Commodity-Exporting Countries: Stability and Growth<br />
<strong>the</strong> institutional environment. One country that has successfully implemented a<br />
fiscal rule, Chile, has targeted a structural budget balance set by a panel <strong>of</strong> experts.<br />
This could certainly be a source <strong>of</strong> inspiration (Frankel, 2011b).<br />
A related policy issue is whe<strong>the</strong>r fiscal rules in commodity exporters should<br />
take in<strong>to</strong> account <strong>the</strong> composition <strong>of</strong> government spending. Indeed, fiscal rules<br />
may indeed impact <strong>the</strong> composition <strong>of</strong> spending, since <strong>the</strong> politically sensitive<br />
nature <strong>of</strong> some types <strong>of</strong> spending could lead <strong>to</strong> a fiscal rule’s having adverse effects<br />
on long-run economic growth. Blanchard and Giavazzi (2003) provide an interesting<br />
discussion <strong>of</strong> those issues in <strong>the</strong> context <strong>of</strong> <strong>the</strong> European Stability and<br />
Growth Pact. Arezki and Ismail (2010) find that fiscal rules in oil-exporting<br />
countries have forced <strong>the</strong> adjustment on capital spending in bust times, raising<br />
some concern over <strong>the</strong> consequences on economic growth. Arezki and Alichi<br />
(2009) provide <strong>the</strong>oretical and empirical evidence <strong>of</strong> <strong>the</strong> negative effects <strong>of</strong> current<br />
spending on non-oil GDP growth in oil-exporting countries. The United<br />
Kingdom and Peru are among <strong>the</strong> few countries that have shielded <strong>the</strong> composition<br />
<strong>of</strong> <strong>the</strong>ir spending from <strong>the</strong> implementation <strong>of</strong> fiscal rules.<br />
Ano<strong>the</strong>r relevant question is whe<strong>the</strong>r countries endowed with mineral and<br />
energy resources have fared differently in macroeconomic stability when compared<br />
<strong>to</strong> countries endowed with agricultural resources. To answer this, we partition<br />
our sample, distinguishing countries where agricultural exports dominate<br />
from countries where minerals and energy exports dominate. We find that countries<br />
that export mostly minerals and energy commodities display a statistically<br />
significant increase <strong>of</strong> government spending following an increase in resource<br />
windfalls, whereas countries exporting mainly agricultural commodities do not<br />
display any statistically significant increase (results not reported in tables).<br />
Those results suggest that windfalls originating from point-based resources,<br />
that is, geographically more concentrated resources (mostly minerals and energy<br />
commodities) are more likely <strong>to</strong> lead <strong>to</strong> procyclical fiscal policies than windfalls<br />
originating from diffuse resources, that is, more geographically dispersed resources<br />
(mostly agricultural commodities). Our results are also consistent with those <strong>of</strong><br />
Isham and o<strong>the</strong>rs (2005), who provide evidence that mineral and energy exporters<br />
are plagued with weaker economic performance and in particular weaker<br />
recovery. Point-based as opposed <strong>to</strong> diffuse resources are indeed seen as more<br />
subject <strong>to</strong> rent-seeking behavior, weakening <strong>the</strong> effectiveness <strong>of</strong> moni<strong>to</strong>ring<br />
mechanisms over how much <strong>the</strong> government receives and how much it spends,<br />
both from independent institutional bodies and from <strong>the</strong> public more generally.<br />
Given <strong>the</strong> potentially higher level <strong>of</strong> rent-seeking by governments in countries<br />
endowed with point-based resources, it is plausible that those governments would<br />
spend more in boom times in order <strong>to</strong> quell <strong>the</strong> masses whose grievances in times<br />
<strong>of</strong> plenty may be conducive <strong>to</strong> social instability.<br />
We also explore whe<strong>the</strong>r <strong>the</strong> quality <strong>of</strong> political institutions influences <strong>the</strong> way<br />
resource windfall shocks affect macroeconomic stability in commodity-exporting<br />
countries. To do so, we split <strong>the</strong> sample between deep au<strong>to</strong>cracies and deep<br />
democracies and run our panel VAR regressions for both subsamples (results<br />
not reported in tables). We find strong evidence that government spending in<br />
©International Monetary Fund. Not for Redistribution
Arezki 157<br />
au<strong>to</strong>cracies increases following a resource windfall shock. In contrast, we find<br />
evidence, albeit weaker, that government spending in deep democracies decreases<br />
on impact and <strong>the</strong>n does not increase significantly following a resource windfall<br />
shock. These results suggest that deep democracies are less prone <strong>to</strong> <strong>the</strong> procyclical<br />
fiscal policies that have destabilizing effects. In <strong>the</strong> next subsection, we fur<strong>the</strong>r<br />
elaborate on <strong>the</strong> <strong>the</strong>ories that may explain why democracies, as opposed <strong>to</strong> au<strong>to</strong>cracies,<br />
can experience superior macroeconomic stability and long-run growth. We<br />
also find that in both groups, resource windfall shocks initially crowd out nonresource<br />
GDP, which <strong>the</strong>n increases following <strong>the</strong> fiscal expansion, although <strong>the</strong><br />
evidence <strong>of</strong> this is weaker among deep democracies.<br />
Economic Growth<br />
The above-mentioned results suggest that commodity-exporting countries, on<br />
average, are subject <strong>to</strong> macroeconomic instability, which in turn can harm <strong>the</strong>ir<br />
long-run economic performance. In addition, one key challenge that <strong>the</strong>se countries<br />
face is <strong>to</strong> reduce <strong>the</strong>ir dependence on commodities by rebalancing <strong>the</strong>ir<br />
wealth from natural capital in favor <strong>of</strong> reproducible capital and social capital,<br />
including human capital. Figure 9.4 illustrates <strong>the</strong> fact that commodity-exporting<br />
countries in sub-Saharan Africa and <strong>the</strong> Middle East hold a disproportionately<br />
higher share (over 30 percent) <strong>of</strong> <strong>the</strong>ir <strong>to</strong>tal wealth as natural capital. However,<br />
a large increase in government spending risks yielding poor efficiency in <strong>the</strong><br />
execution <strong>of</strong> projects and misallocation <strong>of</strong> resources.<br />
To take s<strong>to</strong>ck <strong>of</strong> <strong>the</strong> his<strong>to</strong>rical experiences <strong>of</strong> commodity-exporting countries,<br />
we now systematically investigate <strong>the</strong> impact <strong>of</strong> government spending<br />
on long-run nonresource-sec<strong>to</strong>r growth in <strong>the</strong> face <strong>of</strong> resource windfall<br />
shocks. To do so, we use panel cointegration techniques <strong>to</strong> separate out <strong>the</strong><br />
Figure 9.4<br />
Worldwide map <strong>of</strong> natural capital as a share <strong>of</strong> <strong>to</strong>tal<br />
capital, 2005<br />
Share <strong>of</strong> <strong>Natural</strong> Capital in Total Capital (in percent)<br />
Less than 6<br />
6–12<br />
12–18<br />
18–24<br />
24–36<br />
More than 36<br />
Source: World Bank (2011) and author’s analysis.<br />
©International Monetary Fund. Not for Redistribution
158 Fiscal Policy in Commodity-Exporting Countries: Stability and Growth<br />
short-run from <strong>the</strong> long-run effects <strong>of</strong> government spending on nonresource<br />
GDP growth. The empirical model is specified so that GDP per capita growth<br />
in <strong>the</strong> nonresource sec<strong>to</strong>r is <strong>the</strong> dependent variable. The independent variables<br />
are our resource windfall index, <strong>the</strong> share <strong>of</strong> government spending in<br />
GDP, <strong>the</strong> change in <strong>the</strong> logarithm <strong>of</strong> <strong>the</strong> real exchange rate, and <strong>the</strong> quality<br />
<strong>of</strong> political institutions.<br />
Table 9.1 presents <strong>the</strong> results <strong>of</strong> <strong>the</strong> Pool Mean Group estimations focusing on<br />
<strong>the</strong> long-run coefficients. On average, we find that resource windfall shocks have<br />
a statistically and economically significant negative effect on <strong>the</strong> long-run nonresource-sec<strong>to</strong>r<br />
GDP growth, as shown throughout columns 1 <strong>to</strong> 5. We also find<br />
that, on average, an increase in <strong>the</strong> share <strong>of</strong> government spending has a negative<br />
effect on long-run nonresource GDP growth. Those two results are in line with<br />
<strong>the</strong> existing literature, providing evidence that resource windfalls and larger governments<br />
both lead <strong>to</strong> weaker long-run economic growth. However, what is new<br />
in <strong>the</strong> findings is that resource windfalls s<strong>to</strong>p having a negative effect on long-run<br />
nonresource growth when controlling for government spending, as shown in<br />
columns 3 <strong>to</strong> 5. This result suggests that government spending is an important<br />
vehicle <strong>of</strong> <strong>the</strong> resource curse hypo<strong>the</strong>sis. In o<strong>the</strong>r words, <strong>the</strong> externality stemming<br />
from <strong>the</strong> resource sec<strong>to</strong>r <strong>to</strong> <strong>the</strong> nonresource sec<strong>to</strong>r is mainly conveyed through<br />
government spending, chiefly financed by resource-sec<strong>to</strong>r-related government<br />
revenues.<br />
When controlling for <strong>the</strong> change in <strong>the</strong> real exchange rate, as shown in column 4,<br />
resource windfall shocks have a positive effect on nonresource GDP growth. This<br />
result confirms that Dutch disease is an important channel <strong>of</strong> <strong>the</strong> resource curse.<br />
When controlling for <strong>the</strong> quality <strong>of</strong> political institutions, as shown in column 5, <strong>the</strong><br />
above results do not appear <strong>to</strong> change significantly. Given <strong>the</strong> fact that <strong>the</strong> quality <strong>of</strong><br />
political institutions changes little even over a relatively long time period, it is hard <strong>to</strong><br />
meaningfully assess <strong>the</strong> individual effect <strong>of</strong> democracy on long-run economic growth<br />
when exploiting within-country variation.<br />
TABLE 9.1<br />
Variables (1) (2) (3) (4) (5)<br />
Long-Run Coefficients<br />
Initial GDP -0.089 -0.051 -0.074 -0.107 -0.061<br />
0.006 0.004 0.006 0.006 0.006<br />
∆ Resource Windfall -1.082 -0.804 5.399 -0.160<br />
0.454 0.501 0.657 0.497<br />
Government Size -0.049 -0.022 -0.081 -0.042<br />
0.018 0.020 0.022 0.017<br />
∆ REER 0.018<br />
0.005<br />
Polity II<br />
Low income interaction<br />
0.004<br />
0.002<br />
No. <strong>of</strong> Countries 108 129 94 94 94<br />
No. <strong>of</strong> Observations<br />
Source: Author’s analysis.<br />
3564 4257 3102 2277 3094<br />
©International Monetary Fund. Not for Redistribution
Arezki 159<br />
In Table 9.2, we explore <strong>the</strong> potential heterogeneity in <strong>the</strong> effects <strong>of</strong> resource<br />
windfalls and government spending on nonresource GDP growth. We explore<br />
first whe<strong>the</strong>r <strong>the</strong> quality <strong>of</strong> political institutions helps alleviate <strong>the</strong> resource curse<br />
by interacting both our resource windfall index and government spending with<br />
our measure <strong>of</strong> <strong>the</strong> quality <strong>of</strong> political institutions. We find that <strong>the</strong> impact <strong>of</strong><br />
resource windfalls and government spending are moderated by <strong>the</strong> quality <strong>of</strong><br />
political institutions so much that at a high level <strong>of</strong> political institutions <strong>the</strong> effect<br />
<strong>of</strong> resource windfalls on long-run nonresource GDP becomes positive, as shown<br />
in columns 1 and 2. A large share <strong>of</strong> commodity windfalls accrues <strong>to</strong> <strong>the</strong> government<br />
sec<strong>to</strong>r (through state ownership or taxation or export tariffs). These results<br />
suggest that democracy, by promoting accountability and consensus, reduces <strong>the</strong><br />
perverse effect that resource windfalls may have on <strong>the</strong> nonresource sec<strong>to</strong>r, for<br />
instance through fewer discretionary policies that are conducive <strong>to</strong> macroeconomic<br />
volatility. Some authors have indeed stressed <strong>the</strong> importance <strong>of</strong> political<br />
institutions in achieving better policy outcomes (see for example Persson, 2002).<br />
In <strong>the</strong>ir seminal contribution <strong>to</strong> <strong>the</strong> growth and institutions literature, Acemoglu,<br />
Johnson, and Robinson (2001, 2002) have shown that political institutions are<br />
key determinants for long-run economic development.<br />
Following Melhum, Moene, and Torvik (2006), who provide some evidence that<br />
good economic institutions can alleviate <strong>the</strong> resource curse using standard cross-sectional<br />
growth regressions, we also try interacting resource windfalls with <strong>the</strong> quality <strong>of</strong><br />
economic institutions ra<strong>the</strong>r than political institutions. We do not find any robust<br />
evidence that economic institutions moderate <strong>the</strong> effect <strong>of</strong> resource windfalls on nonresource<br />
GDP growth, supporting <strong>the</strong> primacy <strong>of</strong> political institutions over economic<br />
institutions as a <strong>to</strong>ol <strong>to</strong> alleviate <strong>the</strong> resource curse. In columns 3 and 4, we also provide<br />
evidence that <strong>the</strong> quality <strong>of</strong> political institutions moderates <strong>the</strong> effect <strong>of</strong> government<br />
spending on long-run nonresource GDP growth, suggesting that <strong>the</strong> benefit <strong>of</strong><br />
political institutions for economic growth is channeled through better fiscal policy.<br />
TABLE 9.2<br />
Variables<br />
Long-Run Coefficients<br />
(1) (2) (3) (4)<br />
Initial GDP -0.080 -0.062 -0.075 -0.041<br />
0.006 0.005 0.005 0.004<br />
∆ Resource Windfall -1.866 -0.834 0.388<br />
0.597 0.497 0.429<br />
Government Size -0.030 -0.019 -0.061<br />
0.017 0.018 0.020<br />
Polity2 0.004 0.003 0.003 0.005<br />
0.002 0.002 0.002 0.002<br />
Polity2 x Windfall 0.072 0.160<br />
0.040 0.037<br />
Polity2 x Gov. Size 0.002 0.001<br />
0.001 0.000<br />
No. <strong>of</strong> Countries 94 94 94 94<br />
No. <strong>of</strong> Observations 3290 3290 3290 3290<br />
Source: Author’s analysis.<br />
©International Monetary Fund. Not for Redistribution
160 Fiscal Policy in Commodity-Exporting Countries: Stability and Growth<br />
Indeed, a large share <strong>of</strong> commodity windfalls accrues <strong>to</strong> <strong>the</strong> government sec<strong>to</strong>r<br />
(through state ownership, taxation, or export tariffs). Therefore, more accountable<br />
governments can better support <strong>the</strong> nonresource sec<strong>to</strong>r’s long-run economic performance<br />
by reducing government spending inefficiencies and resource misallocation.<br />
This finding is consistent with Arezki and Brückner (2010a), who find that commodity<br />
price booms lead <strong>to</strong> increased government spending, external debt, and default risk<br />
in au<strong>to</strong>cracies, but do not have <strong>the</strong> same effects in democracies. Arezki and Brückner<br />
(2010b) also provide evidence <strong>of</strong> dicho<strong>to</strong>mous effects on sovereign bond spreads in<br />
au<strong>to</strong>cratic versus democratic commodity-exporting countries.<br />
Finally, we explore whe<strong>the</strong>r countries that export mineral and energy commodities<br />
are subject <strong>to</strong> weaker long-run nonresource-sec<strong>to</strong>r performance as compared<br />
<strong>to</strong> countries that export agricultural commodities (results not reported in<br />
tables). We find once again that minerals and energy exporters perform less favorably<br />
than agricultural exporters in <strong>the</strong> face <strong>of</strong> resource windfall shocks. This result<br />
confirms that <strong>the</strong> negative effect <strong>of</strong> resource windfalls on long-run nonresource<br />
GDP is a robust feature <strong>of</strong> mineral- and energy-exporting countries.<br />
CONCLUSION<br />
This chapter examined <strong>the</strong> performance <strong>of</strong> commodity-exporting countries in<br />
terms <strong>of</strong> macroeconomic stability and growth in a panel <strong>of</strong> up <strong>to</strong> 134 countries<br />
during <strong>the</strong> period 1970–2007, using a new dataset on nonresource GDP. Our<br />
main findings are tw<strong>of</strong>old. First, we find that on average government spending in<br />
commodity-exporting countries has been procyclical. We also find that resource<br />
windfalls initially crowd out nonresource GDP, which <strong>the</strong>n increases as a result <strong>of</strong><br />
<strong>the</strong> fiscal expansion. Second, we find that in <strong>the</strong> long run, resource windfalls have<br />
negative effects on nonresource-sec<strong>to</strong>r GDP growth, but <strong>the</strong>se effects are not over<br />
government spending. The effects <strong>of</strong> resource windfalls on both macroeconomic<br />
stability and economic growth are moderated by <strong>the</strong> quality <strong>of</strong> political institutions.<br />
A policy recommendation that can be derived from <strong>the</strong> above results would<br />
consist in finding a creative way <strong>to</strong> promote government accountability in commodity-exporting<br />
countries. One could suggest <strong>to</strong> governments in <strong>the</strong>se countries<br />
that <strong>the</strong>y should increase <strong>the</strong>ir revenue mobilization in <strong>the</strong> nonresource sec<strong>to</strong>r,<br />
which is currently at a relatively low rate both statu<strong>to</strong>rily and effectively. Indeed,<br />
Bornhorst, Gupta, and Thorn<strong>to</strong>n (2009) provide evidence that resource windfall<br />
shocks lower revenue mobilization. Keen and Mansour (2009) have found that<br />
a low statu<strong>to</strong>ry tax rate on natural-resource-sec<strong>to</strong>r activities and high informality<br />
are prevalent in <strong>the</strong> commodity-exporting countries in sub-Saharan African. One<br />
could explore nonresource-sec<strong>to</strong>r taxation as a way <strong>to</strong> generate a positive externality,<br />
while recognizing <strong>the</strong> classical argument against taxation stemming from its<br />
dis<strong>to</strong>rtive nature. Indeed, a recent literature has emphasized <strong>the</strong> importance <strong>of</strong><br />
taxation for state building. Grassroots taxpayer associations could exercise moni<strong>to</strong>ring<br />
over <strong>the</strong> efficiency <strong>of</strong> government spending. Brautigam, Fjeldstad, and<br />
Moore (2008) provides anecdotal evidence that <strong>the</strong> imposition <strong>of</strong> a tax by <strong>the</strong><br />
©International Monetary Fund. Not for Redistribution
Arezki 161<br />
British colonial rule on <strong>the</strong> sugar industry in Mauritius led <strong>to</strong> <strong>the</strong> emergence <strong>of</strong><br />
grassroots tax-payer associations, which up <strong>to</strong> this day exercise a moni<strong>to</strong>ring role<br />
over <strong>the</strong> way taxpayers’ money is spent by <strong>the</strong> government. In addition, increasing<br />
nonresource-sec<strong>to</strong>r revenue mobilization would deliver o<strong>the</strong>r benefits, including<br />
combating volatility in government revenues by diversifying <strong>the</strong> sources <strong>of</strong> government<br />
revenues.<br />
Fur<strong>the</strong>r research should investigate <strong>the</strong> performance <strong>of</strong> resource-rich countries<br />
in addressing issues <strong>of</strong> income distribution. A cursory look at <strong>the</strong> data indicates<br />
that natural-resource-abundant countries are rich but unequal. Despite several<br />
authors, including Subramanian and Sala-i-Martin (2003), who have advocated<br />
direct redistribution, <strong>the</strong>re are many reasons <strong>to</strong> think that it may not be a good<br />
idea <strong>to</strong> engage excessively in such action. Indeed, direct redistribution may fuel<br />
increased consumption as opposed <strong>to</strong> investment, which may infringe on <strong>the</strong><br />
Hartwick rule. Indeed, individuals may underinvest <strong>the</strong> proceeds <strong>of</strong> resource<br />
revenues in, say, education and health, as <strong>the</strong>y may not internalize <strong>the</strong> social benefits<br />
<strong>of</strong> those investments. One possibility would be <strong>to</strong> redistribute not necessarily<br />
directly, in <strong>the</strong> form <strong>of</strong> cash transfers, but ra<strong>the</strong>r in <strong>the</strong> form <strong>of</strong> greater information<br />
and enhanced transparency concerning <strong>the</strong> management <strong>of</strong> revenues and on<br />
<strong>the</strong> rationale behind <strong>the</strong> choice <strong>of</strong> <strong>the</strong> level and composition <strong>of</strong> spending. Citizens<br />
must take part in <strong>the</strong> major debates addressing public action. That will make it<br />
possible <strong>to</strong> improve <strong>the</strong> efficiency <strong>of</strong> government spending, which in turn will<br />
benefit <strong>the</strong> citizenry.<br />
REFERENCES<br />
Acemoglu, D., S. Johnson, and J. Robinson, 2001, “The Colonial Origins <strong>of</strong> Comparative<br />
Development: An Empirical Investigation,” American Economic Review, Vol. 91, pp. 1369–<br />
1401.<br />
———, 2002, “Reversal <strong>of</strong> Fortune: Geography and Institutions in <strong>the</strong> Making <strong>of</strong> <strong>the</strong> Modern<br />
World Income Distribution,” Quarterly Journal <strong>of</strong> Economics, Vol. 117, pp. 1231–1344.<br />
Alexeev, M., and R. Conrad, 2009, “The Elusive Curse <strong>of</strong> Oil,” The Review <strong>of</strong> Economics and<br />
Statistics, Vol. 91. No. 3, pp. 586–98.<br />
Arezki, R., and A. Alichi, 2009, “An Alternative Explanation for <strong>the</strong> Resource Curse: The<br />
Income Effect Channel,” IMF Working Paper No. 09/112 (Washing<strong>to</strong>n: International<br />
Monetary Fund).<br />
Arezki, R., and M. Brückner, 2010a, “International Commodity Price Shocks, Democracy,<br />
and External Debt,” IMF Working Paper No. 10/53 (Washing<strong>to</strong>n: International Monetary<br />
Fund).<br />
———, 2010b, “Resource Windfalls and Emerging Market Sovereign Bond Spreads: The Role<br />
<strong>of</strong> Political Institutions,” IMF Working Paper No. 10/179 (Washing<strong>to</strong>n: International<br />
Monetary Fund).<br />
Arezki, R., K. Hamil<strong>to</strong>n, and K. Kazimov, 2011, “Resource Windfalls, Macroeconomic Stability<br />
and Growth: The Role <strong>of</strong> Political Institutions,” IMF Working Paper No. 11/142<br />
(Washing<strong>to</strong>n: International Monetary Fund).<br />
Arezki, R., and K. Ismail, 2010, “Boom-Bust Cycle, Asymmetrical Fiscal Response and <strong>the</strong><br />
Dutch Disease,” IMF Working Paper No. 10/94 (Washing<strong>to</strong>n: International Monetary<br />
Fund).<br />
©International Monetary Fund. Not for Redistribution
162 Fiscal Policy in Commodity-Exporting Countries: Stability and Growth<br />
Blanchard, O., and F. Giavazzi, 2003, “Improving <strong>the</strong> Stability and Growth Pact Through<br />
Proper Accounting <strong>of</strong> Public Investment,” CEPR Discussion Paper No. 4220 (London:<br />
Centre for Economic and Policy Research).<br />
Blejer, M., and M.S. Khan, 1984. “Government Policy and Private Investment in Developing<br />
Countries,” IMF Staff Papers, Vol. 31, No. 2, pp. 379–403.<br />
Bornhorst, F., S. Gupta, and J. Thorn<strong>to</strong>n, 2009, “<strong>Natural</strong> Resource Endowments and <strong>the</strong><br />
Domestic Revenue Effort,” European Journal <strong>of</strong> Political Economy, Vol. 25, No. 4, pp. 439–46.<br />
Brautigam, D., O.-H. Fjeldstad, and M. Moore, 2008, Taxation and State-Building in<br />
Developing Countries: Capacity and Consent (Cambridge: Cambridge University Press).<br />
Collier, P., and B. Goderis, 2007. “Commodity Prices, Growth, and <strong>the</strong> <strong>Natural</strong> Resource<br />
Curse: Reconciling a Conundrum,” CSAE Working Paper No. 2007-15 (Oxford: Centre for<br />
<strong>the</strong> Study <strong>of</strong> African Economies, University <strong>of</strong> Oxford).<br />
Cudding<strong>to</strong>n, J., 1989, “Commodity Export Booms in Developing Countries,” World Bank<br />
Research Observer, Vol. 4, pp. 143–65.<br />
Frankel, J.A., 2011a, “The <strong>Natural</strong> Resource Curse: A Survey, 2011,” forthcoming in Export<br />
Perils, ed. by B. Shaffer (Philadelphia: University <strong>of</strong> Pennsylvania Press).<br />
———, 2011b, “A Solution <strong>to</strong> Fiscal Procyclicality: The Structural Budget Institutions<br />
Pioneered by Chile,” in Fiscal Policy and Macroeconomic Performance, ed. by L. F. Céspedes,<br />
J. Galí, and Y. Carrière-Swallow (Central Banking Analysis and Economic <strong>Policies</strong> Series)<br />
(Santiago, Central Bank <strong>of</strong> Chile).<br />
Gelb, A., and associates, 1988, Oil Windfalls: Blessing or Curse? (New York: World Bank/Oxford<br />
University Press.)<br />
Goderis, B., and S.W. Malone, 2008, “<strong>Natural</strong> Resource Booms and Inequality: Theory and<br />
Evidence,” OxCarre Working Paper No. 008 (Oxford: Oxford Centre for <strong>the</strong> Analysis <strong>of</strong><br />
Resource Rich Economies, University <strong>of</strong> Oxford).<br />
Hamil<strong>to</strong>n, K., and G. Ruta, 2008, “Wealth Accounting, Exhaustible <strong>Resources</strong> and Social<br />
Welfare,” Environmental and Resource Economics, Vol. 42, No. 1, pp. 53–64.<br />
Hartwick, J.M., 1977, “Intergenerational Equity and <strong>the</strong> Investing <strong>of</strong> Rents from Exhaustible<br />
<strong>Resources</strong>,” American Economic Review, Vol. 66, pp. 972–74.<br />
Hes<strong>to</strong>n, A., R. Summers, and B. Aten, 2009, Penn World Table, Version 6.3, online database<br />
(Philadelphia: Center for International Comparisons <strong>of</strong> Production, Income and Prices,<br />
University <strong>of</strong> Pennsylvania) http://pwt.econ.upenn.edu/php_site/pwt63/pwt63_form.php<br />
International Monetary Fund, 2009, Fiscal Rules—Anchoring Expectations for Sustainable Public<br />
Finances (Washing<strong>to</strong>n: International Monetary Fund).<br />
———, 2010a, Information Notice System (INS) (Washing<strong>to</strong>n: International Monetary Fund).<br />
———, 2010b, World Economic Outlook (WEO), Oc<strong>to</strong>ber (Washing<strong>to</strong>n: International<br />
Monetary Fund).<br />
Isham, J., L. Pritchett, M. Woolcock, and G. Busby, 2005, “The Varieties <strong>of</strong> Resource<br />
Experience: <strong>Natural</strong> Resource Export Structures and <strong>the</strong> Political Economy <strong>of</strong> Economic<br />
Growth,” World Bank Economic Review, Vol. 19, pp. 141–74.<br />
Kaminsky, G.L., C.M. Reinhart, and C.A. Vegh, 2004, “When It Rains, It Pours: Procyclical<br />
Capital Flows and Macroeconomic <strong>Policies</strong>,” NBER Macroeconomics Annual, Vol. 19,<br />
pp. 11–53.<br />
Keen, M., and M. Mansour, 2009. “Revenue Mobilization in Sub-Saharan Africa: Challenges<br />
from Globalization,” IMF Working Paper No. 09/157 (Washing<strong>to</strong>n: International Monetary<br />
Fund).<br />
Khan, M.S., 1996, “Government Investment and Economic Growth in <strong>the</strong> Developing World,”<br />
The Pakistan Development Review, Vol. 35, pp. 419–39.<br />
Marshall, M., and K. Jaggers, 2010, “Polity IV Project: Dataset Users’ Manual” (Center for<br />
Global Policy, George Mason University), published online at www.cidcm.umd.edu/polity.<br />
Mehlum, H., K. Moene, and R. Torvik, 2006, “Institutions and <strong>the</strong> Resource Curse,” Economic<br />
Journal, Vol. 116, pp. 1–20.<br />
Musgrave, R.A., 1959, The Theory <strong>of</strong> Public Finance (New York: McGraw-Hill).<br />
©International Monetary Fund. Not for Redistribution
Arezki 163<br />
Ossowski, R., M. Villafuerte, P.A. Medas, and T. Thomas, 2008, “Managing <strong>the</strong> Oil Revenue<br />
Boom: The Role <strong>of</strong> Fiscal Institutions,” IMF Occasional Paper No. 260 (Washing<strong>to</strong>n:<br />
International Monetary Fund).<br />
Persson, T., 2002, “Do Political Institutions Shape Economic Policy,” Econometrica, Vol. 70,<br />
pp. 883–905.<br />
Persson, T., and G. Tabellini, 2003, The Economic Effects <strong>of</strong> Constitutions (Cambridge: MIT<br />
Press).<br />
———, 2006, “Democracy and Development: The Devil in Detail,” American Economic<br />
Review Papers and Proceedings, Vol. 96, No. 2, pp. 319–24.<br />
Robinson, J. A., and R. Torvik, 2005, “White Elephants,” Journal <strong>of</strong> Public Economics, Vol. 89,<br />
Nos. 2–3, pp. 197–210.<br />
Ross, M.L., 2007, “How Mineral-Rich States Can Reduce Inequality,” in Escaping <strong>the</strong> Resource<br />
Curse, ed. by M. Humphreys, J.D. Sachs, and J.E. Stiglitz (New York: Columbia University<br />
Press).<br />
Subramanian, A., and X. Sala-i-Martin, 2003, “Addressing <strong>the</strong> <strong>Natural</strong> Resource Curse: An<br />
Illustration from Nigeria,” IMF Working Paper No. 03/139 (Washing<strong>to</strong>n: International<br />
Monetary Fund).<br />
World Bank, 2006, Where Is The Wealth <strong>of</strong> Nations? (Washing<strong>to</strong>n: The World Bank).<br />
———, 2011, The Changing Wealth <strong>of</strong> Nations (Washing<strong>to</strong>n: The World Bank).<br />
©International Monetary Fund. Not for Redistribution
This page intentionally left blank<br />
©International Monetary Fund. Not for Redistribution
Exchange Rates and<br />
Financial Stability<br />
PART IV<br />
©International Monetary Fund. Not for Redistribution
This page intentionally left blank<br />
©International Monetary Fund. Not for Redistribution
CHAPTER 10<br />
How Can Commodity Exporters<br />
Make Fiscal and Monetary Policy<br />
Less Procyclical?<br />
JEFFREY FRANKEL<br />
THE PROBLEM OF PROCYCLICALITY<br />
Countries dependent on exports <strong>of</strong> oil, minerals, and o<strong>the</strong>r primary commodities<br />
tend <strong>to</strong> have pronounced economic cycles. Although this cyclical variability is <strong>to</strong><br />
some extent inevitable, some <strong>of</strong> its impact can be reduced through well-chosen<br />
regimes for monetary and fiscal policy.<br />
That developing countries tend <strong>to</strong> experience larger cyclical fluctuations than<br />
industrialized countries is only partly attributable <strong>to</strong> commodities (Perry, 2009).<br />
It is also partly due <strong>to</strong> <strong>the</strong> role <strong>of</strong> fac<strong>to</strong>rs that should moderate <strong>the</strong> cycle but in<br />
practice seldom operate that way: capital flows that are procyclical, monetary and<br />
fiscal policy that is procyclical, and <strong>the</strong> related Dutch disease. Capital flows, fiscal<br />
policy, monetary policy, and sec<strong>to</strong>ral allocation each tend <strong>to</strong> be more procyclical<br />
in commodity producing countries than economists’ models <strong>of</strong>ten assume. If<br />
anything, <strong>the</strong>y tend <strong>to</strong> exacerbate booms and busts instead <strong>of</strong> moderating <strong>the</strong>m.<br />
It does not have <strong>to</strong> be this way. The hope that improved policies or institutions<br />
might reduce this procyclicality makes this one <strong>of</strong> <strong>the</strong> most potentially fruitful<br />
avenues <strong>of</strong> research in emerging market macroeconomics.<br />
The Procyclicality <strong>of</strong> Capital Flows <strong>to</strong> Developing Countries<br />
According <strong>to</strong> <strong>the</strong> <strong>the</strong>ory <strong>of</strong> intertemporal optimization, <strong>the</strong> problem <strong>of</strong> commodity<br />
volatility should be solved by international financial markets. Countries<br />
should borrow during temporary downturns <strong>to</strong> sustain consumption and investment,<br />
and <strong>the</strong>y should repay or accumulate net foreign assets during temporary<br />
Jeffrey Frankel is James W. Harpel Pr<strong>of</strong>essor <strong>of</strong> Capital Formation and Growth at <strong>the</strong> Kennedy<br />
School, Harvard University. This chapter is based on <strong>the</strong> author’s presentation at “<strong>Natural</strong> <strong>Resources</strong>,<br />
Finance, and Development: Confronting Old and New Challenges,” a high-level seminar organized<br />
by <strong>the</strong> Central Bank <strong>of</strong> Algeria and <strong>the</strong> IMF Institute, which <strong>to</strong>ok place in Algiers, on November 4<br />
and 5, 2010. The author can be contacted at Jeffrey_Frankel@harvard.edu.<br />
©International Monetary Fund. Not for Redistribution<br />
167
168 How Can Commodity Exporters Make Fiscal and Monetary Policy Less Procyclical?<br />
upturns. In practice, it does not always work this way. Capital flows are more<br />
<strong>of</strong>ten procyclical than countercyclical. (Kaminsky, Reinhart, and Vegh, 2005;<br />
Reinhart and Reinhart, 2009; Gavin, Hausmann, and Leiderman, 1996; Prasad,<br />
Rog<strong>of</strong>f, Wei, and Kose, 2006; and Mendoza and Terrones 2008). Most <strong>the</strong>ories<br />
<strong>to</strong> explain this involve imperfections in capital markets, such as asymmetric information<br />
or <strong>the</strong> need for collateral.<br />
In <strong>the</strong> commodity and emerging market boom <strong>of</strong> 2003–08, net capital flows<br />
typically went <strong>to</strong> countries with current account surpluses, especially commodity<br />
producers and Asian countries, where <strong>the</strong>y showed up in record accumulation<br />
<strong>of</strong> foreign exchange reserves. This was in contrast <strong>to</strong> <strong>the</strong> two previous cycles,<br />
1975–81 and 1990–97, when <strong>the</strong> capital flows <strong>to</strong> developing countries largely<br />
went <strong>to</strong> finance current account deficits. As developing countries evolve more<br />
market-oriented financial systems, capital inflows during <strong>the</strong> boom phase show<br />
up increasingly in prices for land and buildings, and also in prices <strong>of</strong> financial<br />
assets (Aizenman and Jinjarak,2009; Mendoza and Terrones, 2008).<br />
One interpretation <strong>of</strong> procyclical capital flows is that <strong>the</strong>y result from procyclical<br />
fiscal policy: when governments increase spending in booms, some <strong>of</strong> <strong>the</strong><br />
deficit is financed by borrowing from abroad. When <strong>the</strong>y are forced <strong>to</strong> cut spending<br />
in downturns, it is <strong>to</strong> repay some <strong>of</strong> <strong>the</strong> excessive debt that <strong>the</strong>y incurred<br />
during <strong>the</strong> upturns. Ano<strong>the</strong>r interpretation <strong>of</strong> procyclical capital flows <strong>to</strong> developing<br />
countries is that <strong>the</strong>y pertain especially <strong>to</strong> exporters <strong>of</strong> commodities. We<br />
consider procyclical fiscal policy in <strong>the</strong> next subsection, and return <strong>to</strong> <strong>the</strong> commodity<br />
cycle (Dutch disease) in <strong>the</strong> one that follows it.<br />
The Procyclicality <strong>of</strong> Fiscal Policy<br />
Many authors have documented that fiscal policy tends <strong>to</strong> be more procyclical in<br />
developing countries than in industrialized countries. (Cudding<strong>to</strong>n, 1989; Tornell<br />
and Lane, 1999; Kaminsky, Reinhart, and Vegh, 2005; Talvi and Végh, 2005;<br />
Alesina, Campante and Tabellini, 2008; Mendoza and Oviedo, 2006; Ilzetski and<br />
Vegh, 2008). Procyclicality is especially pronounced in countries that possess<br />
natural resources and where income from those resources tends <strong>to</strong> dominate <strong>the</strong><br />
business cycle (Gelb, 1986; Cudding<strong>to</strong>n, 1989; Medas and Zakharova, 2009). 1<br />
Most studies look at <strong>the</strong> procyclicality <strong>of</strong> government spending, because tax<br />
receipts are endogenous with respect <strong>to</strong> <strong>the</strong> business cycle. An important reason<br />
for procyclical spending is that government receipts from taxes or royalties rise in<br />
booms, and <strong>the</strong> government cannot resist <strong>the</strong> temptation or political pressure <strong>to</strong><br />
increase spending proportionately, or even more than proportionately.<br />
Figure 10.1, taken from Kaminsky, Reinhart, and Vegh (2005), displays each<br />
country’s correlation between government spending and GDP. They range from a<br />
correlation approaching –1 for Finland, denoting a strongly countercyclical policy,<br />
1 For commodity producers in Latin America in particular: Gavin, Hausmann, Perotti and Talvi,1997;<br />
Gavin and Perotti, 1997; Calderón and Schmidt-Hebbel, 2003; Perry, 2003; and Villafuerte, Lopez-<br />
Murphy and Ossowski, 2010.<br />
©International Monetary Fund. Not for Redistribution
Figure 10.1<br />
Cyclical correlation <strong>of</strong> government spending and GDP<br />
1<br />
0.5<br />
0<br />
-0.5<br />
-1<br />
Finland<br />
United Kingdom<br />
Switzerland<br />
France<br />
Jamaica<br />
United States<br />
Sudan<br />
Korea<br />
Austria<br />
Australia<br />
Spain<br />
Norway<br />
Swaziland<br />
El Salvador<br />
Turkey<br />
Denmark<br />
Canada<br />
Italy<br />
Mexico<br />
South Africa<br />
Greece<br />
Japan<br />
Indonesia<br />
Lao PDR<br />
New Zealand<br />
Ireland<br />
Bolivia<br />
Sri Lanka<br />
Panama<br />
Costa Rica<br />
Brazil<br />
Cape Verde<br />
Zambia<br />
Vietnam<br />
Gambia<br />
Morocco<br />
Nepal<br />
Jordan<br />
China: Main land<br />
Honduras<br />
Angola<br />
Chile<br />
Comoros<br />
Haiti<br />
Argentina<br />
Ghana<br />
Malaysia<br />
Egypt<br />
Kenya<br />
Tunisia<br />
Senegal<br />
Nigeria<br />
Pakistan<br />
Mozambique<br />
Algeria<br />
Mali<br />
Mauritania<br />
Saudi Arabia<br />
Tanzania<br />
Cent Afr Rep.<br />
Côte d'lvoire<br />
Uganda<br />
Congo, Rep<br />
Nicaragua<br />
Lebanon<br />
Belgium<br />
Portugal<br />
Togo<br />
India<br />
Mauritius<br />
Venezuela, Rep. Bol<br />
Benin<br />
Bangladesh<br />
Germany<br />
Zimbabwe<br />
Guatemala<br />
Paraguay<br />
Madagascar<br />
Philippines<br />
Uruguay<br />
Ne<strong>the</strong>rlands<br />
Colombia<br />
Source: Kaminsky, Reinhart, and Vegh, 2005.<br />
©International Monetary Fund. Not for Redistribution<br />
Myanmar<br />
Yemen, Republic <strong>of</strong><br />
Peru<br />
Syria<br />
Niger<br />
Iran<br />
SeyChelles<br />
Trinidad Tobago<br />
Cambodia<br />
Chad<br />
Sierra Leone<br />
Dominican Rep<br />
Cameroon<br />
Gabon<br />
Botswana<br />
Rwanda<br />
Oman<br />
Frankel 169
170 How Can Commodity Exporters Make Fiscal and Monetary Policy Less Procyclical?<br />
<strong>to</strong> a correlation approaching +1 for Oman, denoting a strongly procyclical policy.<br />
The interesting thing about <strong>the</strong> graph is that a heavy majority <strong>of</strong> <strong>the</strong> advanced<br />
countries, which are represented by black bars, show countercyclical spending,<br />
while a heavy majority <strong>of</strong> <strong>the</strong> o<strong>the</strong>r countries show procyclical spending. 2<br />
Two large budget items that account for much <strong>of</strong> <strong>the</strong> increased spending from<br />
commodity booms are investment projects and <strong>the</strong> government wage bill.<br />
Regarding <strong>the</strong> first budget item, investment in infrastructure can have a large longterm<br />
pay-<strong>of</strong>f if it is well designed. Too <strong>of</strong>ten in practice, however, it takes <strong>the</strong> form<br />
<strong>of</strong> white elephant projects, which are stranded without funds for completion or<br />
maintenance when commodity prices go back down (Gelb, 1986). Regarding <strong>the</strong><br />
second budget item, Medas and Zakharova (2009) point out that oil windfalls have<br />
<strong>of</strong>ten been spent on higher public-sec<strong>to</strong>r wages. They can also go <strong>to</strong> increasing <strong>the</strong><br />
number <strong>of</strong> workers employed by <strong>the</strong> government. Ei<strong>the</strong>r way, <strong>the</strong>y raise <strong>the</strong> <strong>to</strong>tal<br />
public sec<strong>to</strong>r wage bill, which is hard <strong>to</strong> reverse when oil prices go back down. 3<br />
In a boom such as that experienced in 2003–08, one does not want expansionary<br />
spending and monetary policy that exacerbate overheating, loss <strong>of</strong> competitiveness,<br />
debt, asset bubbles, and overexpansion <strong>of</strong> <strong>the</strong> construction sec<strong>to</strong>r, at <strong>the</strong><br />
expense <strong>of</strong> manufacturing and o<strong>the</strong>r non-mineral exports.<br />
The Macroeconomics <strong>of</strong> Dutch Disease<br />
Dutch disease can be viewed as an example <strong>of</strong> <strong>the</strong> procyclicality we have in mind,<br />
defined as a boom in government spending, construction, and o<strong>the</strong>r nontraded<br />
goods and services, which arises in response <strong>to</strong> a strong, but perhaps temporary,<br />
upward swing in <strong>the</strong> world price <strong>of</strong> <strong>the</strong> export commodity. The typical symp<strong>to</strong>ms<br />
include <strong>the</strong>se:<br />
• A large real appreciation in <strong>the</strong> currency (taking <strong>the</strong> form <strong>of</strong> nominal currency<br />
appreciation if <strong>the</strong> country has a floating exchange rate or <strong>the</strong> form <strong>of</strong><br />
money inflows and inflation if <strong>the</strong> country has a fixed exchange rate 4 );<br />
• An increase in spending (especially by <strong>the</strong> government, which increases<br />
spending in response <strong>to</strong> <strong>the</strong> increased availability <strong>of</strong> tax receipts or royalties);<br />
2The data in Figure 10.1 come from 1960–2003. When Carlos Vegh updates <strong>the</strong> chart through 2009,<br />
<strong>the</strong>re are some changes. Most importantly for this chapter, Chile switches from a positive correlation<br />
<strong>to</strong> a negative one.<br />
3<br />
Arezki and Ismail (2010) find that current government spending increases in boom times but is<br />
downward-sticky.<br />
4During <strong>the</strong> boom <strong>of</strong> 2001–08, examples <strong>of</strong> fixed-rate oil-producing countries where <strong>the</strong> real appreciation<br />
came via money inflows and inflation included Saudi Arabia and <strong>the</strong> Gulf emirates. Examples<br />
<strong>of</strong> floating-rate natural resource countries where <strong>the</strong> real appreciation <strong>to</strong>ok <strong>the</strong> form <strong>of</strong> nominal currency<br />
appreciation included Australia, Chile, Kazakhstan, Mexico, Norway, Russia, and South Africa.<br />
Chen and Rog<strong>of</strong>f (2003) document <strong>the</strong> sensitivity <strong>of</strong> exchange rates <strong>to</strong> commodity prices in <strong>the</strong> cases<br />
<strong>of</strong> Australia and New Zealand. Frankel (2007) documents South Africa. Admittedly, <strong>the</strong> real appreciation<br />
will take place, not just under inflation targeting or an exchange rate target, but also under my<br />
PEP or PPT proposals discussed in <strong>the</strong> third section <strong>of</strong> this chapter. Only capital controls and sterilized<br />
foreign exchange purchases have <strong>the</strong> potential <strong>to</strong> slow down <strong>the</strong> real appreciation; nei<strong>the</strong>r is<br />
likely <strong>to</strong> work for longer than a few years, if at all.<br />
©International Monetary Fund. Not for Redistribution
Frankel 171<br />
• An increase in <strong>the</strong> price <strong>of</strong> nontraded goods (goods and services such as housing<br />
that are not internationally traded) relative <strong>to</strong> traded goods (manufactures<br />
and o<strong>the</strong>r internationally traded goods o<strong>the</strong>r than <strong>the</strong> export commodity);<br />
• A resultant shift <strong>of</strong> labor, capital, and land out <strong>of</strong> non-export-commodity<br />
traded goods (pulled by <strong>the</strong> more attractive returns in <strong>the</strong> export commodity<br />
and in nontraded goods and services);<br />
• High interest rates (attracting a capital inflow); and<br />
• A current account deficit (<strong>the</strong>reby incurring international debt that may be<br />
difficult <strong>to</strong> service when <strong>the</strong> commodity boom ends5 ).<br />
When crowded-out noncommodity tradable goods are in <strong>the</strong> manufacturing sec<strong>to</strong>r,<br />
<strong>the</strong> feared effect is deindustrialization. 6 In a real trade model, <strong>the</strong> reallocation<br />
<strong>of</strong> resources across tradable sec<strong>to</strong>rs, for example from manufactures <strong>to</strong> agriculture,<br />
may be inevitable regardless <strong>of</strong> macroeconomics. But <strong>the</strong> movement in<strong>to</strong> nontraded<br />
goods is macroeconomic in origin.<br />
What makes Dutch disease a “disease?” One interpretation, particularly relevant<br />
if <strong>the</strong> complete cycle is not adequately foreseen, is that <strong>the</strong> process is all<br />
painfully reversed when <strong>the</strong> world price <strong>of</strong> <strong>the</strong> export commodity goes back<br />
down. A second interpretation is that, even if <strong>the</strong> perceived longevity <strong>of</strong> <strong>the</strong><br />
increase in world price turns out <strong>to</strong> be accurate, <strong>the</strong> crowding out <strong>of</strong> noncommodity<br />
exports is undesirable, perhaps because <strong>the</strong> manufacturing sec<strong>to</strong>r has<br />
externalities for long-run growth from learning by doing (as in van Wijnbergen,<br />
1984; Matsuyama, 1992; and Gylfason, Herbertsson, and Zoega, 1999). 7<br />
The Cyclicality <strong>of</strong> Monetary and Fiscal Policy<br />
How can monetary and fiscal policy be made more countercyclical, or at least less<br />
procyclical? The first step is <strong>to</strong> recognize <strong>the</strong> problem. That is a real challenge. At<br />
any point in time, in any country, <strong>the</strong> debate is usually between those arguing in<br />
favor <strong>of</strong> and those arguing against government expansion. It takes a longer-term<br />
perspective <strong>to</strong> frame <strong>the</strong> case in terms <strong>of</strong> <strong>the</strong> complete business cycle: less government<br />
expansion during booms, counterbalanced by more during busts. This is<br />
especially true in commodity-producing countries, where <strong>the</strong> temptation <strong>to</strong> spend<br />
<strong>the</strong> wealth at times when <strong>the</strong> world market for commodities is booming is overwhelming<br />
and where <strong>the</strong> cut-<strong>of</strong>f <strong>of</strong> funds when <strong>the</strong> market goes bust is absolute.<br />
5Manzano and Rigobon (2008) show that <strong>the</strong> negative Sachs–Warner effect <strong>of</strong> resource dependence<br />
on growth rates during 1970–1990 was mediated through international debt incurred when commodity<br />
prices were high. Arezki and Brückner (2010a) find that commodity price booms lead <strong>to</strong> increased<br />
government spending, external debt, and default risk in au<strong>to</strong>cracies, and but do not have those effects<br />
in democracies. Arezki and Brückner (2010b) find that <strong>the</strong> dicho<strong>to</strong>my extends also <strong>to</strong> <strong>the</strong> effects on<br />
sovereign bond spreads paid by au<strong>to</strong>cratic versus democratic commodity producers.<br />
6In Gylfason, Herbertsson, and Zoega (1999), <strong>the</strong> real appreciation lowers long-term growth because<br />
<strong>the</strong> primary sec<strong>to</strong>r does not experience learning by doing as <strong>the</strong> secondary sec<strong>to</strong>r does.<br />
7<br />
Nontraded goods can also have externalities, however, as Torvik (2001) and Matsen and Torvik<br />
(2005) point out.<br />
©International Monetary Fund. Not for Redistribution
172 How Can Commodity Exporters Make Fiscal and Monetary Policy Less Procyclical?<br />
Countries experiencing a commodity boom, especially those that have discovered<br />
oil or o<strong>the</strong>r resources for <strong>the</strong> first time, need <strong>to</strong> realize how many times o<strong>the</strong>r<br />
countries have been down this road before and how <strong>of</strong>ten it has ended in tears.<br />
But it is not enough just <strong>to</strong> recognize <strong>the</strong> desirability <strong>of</strong> countercyclical policy.<br />
We have learned that simply telling a country in a boom that it should<br />
take advantage <strong>of</strong> <strong>the</strong> opportunity <strong>to</strong> save won’t necessarily deliver <strong>the</strong> desired<br />
result—whe<strong>the</strong>r it is a small oil producer or <strong>the</strong> United States <strong>of</strong> America. Policymakers<br />
are, typically, already aware <strong>of</strong> <strong>the</strong> point. But politics is <strong>to</strong>o strong, including<br />
populist attitudes among <strong>the</strong> public and politicians who <strong>to</strong>o <strong>of</strong>ten get away<br />
with spending <strong>to</strong> fur<strong>the</strong>r <strong>the</strong>ir own ends while pretending <strong>to</strong> do <strong>the</strong> opposite.<br />
We need longer-term institutions that will help governments achieve countercyclicality<br />
in <strong>the</strong> long run, in <strong>the</strong> real world where short-term political pressures<br />
are strong and leaders are human. We need <strong>to</strong> set up regimes in advance that are<br />
more likely <strong>to</strong> deliver <strong>the</strong> right result, based on <strong>the</strong> facts, in a world inhabited by<br />
human beings, not angels.<br />
Where <strong>to</strong> find examples <strong>of</strong> good institutions? Until recently, <strong>the</strong> answer<br />
seemed <strong>to</strong> be that developing countries should look <strong>to</strong>ward <strong>the</strong> United States and<br />
o<strong>the</strong>r advanced countries for models <strong>of</strong> good institutions: democracy, rule <strong>of</strong> law,<br />
Anglo-American style corporate governance, securities markets, and so on. The<br />
last decade, including <strong>the</strong> global financial crisis, showed that all was not well with<br />
ei<strong>the</strong>r American or British institutions. The United States, <strong>the</strong> United Kingdom,<br />
and o<strong>the</strong>r advanced countries don’t have all <strong>the</strong> answers. Since 2007, this proposition<br />
has become familiar in such areas as corporate governance and banking. But<br />
<strong>the</strong> <strong>to</strong>pic at hand is monetary and fiscal policy. Even here, developing and emerging-market<br />
countries can no longer rely uncritically on <strong>the</strong> institutions <strong>of</strong><br />
advanced countries as <strong>the</strong>ir template.<br />
An example in <strong>the</strong> making <strong>of</strong> fiscal policy is <strong>the</strong> role <strong>of</strong> government forecasting as<br />
an input <strong>to</strong> <strong>the</strong> process. There was a time when <strong>the</strong> major advanced countries tended,<br />
on average, <strong>to</strong> follow countercyclical fiscal policy: cutting taxes and increasing spending<br />
in recessions, followed by fiscal consolidation during booms. The last decade has<br />
been very different. The United States, United Kingdom, and o<strong>the</strong>r advanced countries<br />
have forgotten how <strong>to</strong> run countercyclical fiscal policies. They failed <strong>to</strong> take<br />
advantage <strong>of</strong> <strong>the</strong> 2001–07 expansion <strong>to</strong> run budget surpluses. Instead, <strong>the</strong>y ran up a<br />
lot <strong>of</strong> debt. Thus, by 2010 <strong>the</strong>y felt constrained by that debt <strong>to</strong> launch fiscal tightening<br />
at a time when unemployment was still very high. That describes a decade <strong>of</strong><br />
fiscal policy that was procyclical, that is, destabilizing. Biased government forecasting<br />
played a major role in this policy mistake. The grossly over-optimistic budget forecasts<br />
made by <strong>the</strong> U.S. administration from January 2001 led directly <strong>to</strong> <strong>the</strong> adoption<br />
<strong>of</strong> long-term policies entailing massive tax cuts and accelerated government spending.<br />
Continental European countries have not done much better. The worst cases<br />
<strong>of</strong> destabilizing or procyclical fiscal policy countercyclicality, <strong>of</strong> course, are <strong>the</strong><br />
nations <strong>of</strong> Iceland, Greece, and Portugal. Meanwhile, in <strong>the</strong> course <strong>of</strong> <strong>the</strong> same<br />
decade, some emerging-market countries learned how <strong>to</strong> run countercyclical fiscal<br />
policy, notably China and Chile. Even many former debt-crisis sufferers (Brazil,<br />
Indonesia, Malaysia, Mexico, and South Africa) now have higher credit ratings<br />
©International Monetary Fund. Not for Redistribution
Frankel 173<br />
than some <strong>of</strong> <strong>the</strong> less fortunate advanced countries. This is part <strong>of</strong> a general his<strong>to</strong>ric<br />
role reversal between some emerging markets and advanced countries.<br />
A second specific example, in <strong>the</strong> case <strong>of</strong> monetary policy, is inflation targeting.<br />
The first countries <strong>to</strong> adopt inflation targeting were rich countries: New Zealand,<br />
Canada, Sweden, and <strong>the</strong> United Kingdom. Beginning around 1999, many<br />
middle-sized middle-income developing countries followed suit. Inflation targeting<br />
became <strong>the</strong> new conventional wisdom, favored by colleagues in monetary<br />
economics, those at <strong>the</strong> IMF, and central bankers around <strong>the</strong> world. But <strong>the</strong><br />
global financial crisis <strong>of</strong> 2007–09 pointed up some <strong>of</strong> <strong>the</strong> serious limitations <strong>of</strong><br />
inflation targeting. Some modifications may be in order, as we will see.<br />
The remainder <strong>of</strong> this chapter aims <strong>to</strong> present two proposals, one pertaining<br />
<strong>to</strong> fiscal policy and one pertaining <strong>to</strong> monetary policy, for specific regimes or<br />
institutions that might help achieve more countercyclicality. Both are designed<br />
especially for countries subject <strong>to</strong> volatile terms <strong>of</strong> trade, such as exporters <strong>of</strong> oil<br />
or minerals. The proposals can be phrased briefly.<br />
For fiscal policy: I propose that many countries could usefully emulate <strong>the</strong><br />
structural budget institutions that Chile has employed over <strong>the</strong> last decade.<br />
For monetary policy: I propose that countries that are vulnerable <strong>to</strong> high variability<br />
in <strong>the</strong>ir terms <strong>of</strong> trade should adopt a different form <strong>of</strong> inflation targeting,<br />
one that I call product price targeting or PPT.<br />
The difference between PPT and regular inflation targeting is that instead <strong>of</strong><br />
using <strong>the</strong> Consumer Price Index (CPI) as a target, central banks use a price index<br />
that emphasizes <strong>the</strong> commodities produced at home and exported. Oil producers<br />
should target a price index that gives a weight <strong>to</strong> oil commensurate with its<br />
importance in production, which will be much larger than its share in consumption,<br />
and that does not include products that it consumes solely by import.<br />
PROPOSAL TO MAKE FISCAL POLICY MORE<br />
COUNTERCYCLICAL: EMULATE CHILE’S STRUCTURAL<br />
BUDGET RULE INSTITUTIONS<br />
Chile’s economic growth since 1984, presumably related <strong>to</strong> several waves <strong>of</strong> serious<br />
reforms, has far outstripped that <strong>of</strong> its Latin American neighbors. Its income<br />
per capita rose from 10 percent <strong>of</strong> <strong>the</strong> U.S. level in 1984 <strong>to</strong> 14 percent in 2000<br />
and <strong>the</strong>n <strong>to</strong> 20 percent in 2010.<br />
Since 2000, fiscal policy in Chile has been governed by a structural budget rule<br />
that has succeeded in implementing countercyclical fiscal policy. The key innovation<br />
is that <strong>the</strong> estimates <strong>of</strong> <strong>the</strong> two most important inputs in <strong>the</strong> breakdown <strong>of</strong><br />
<strong>the</strong> budget between structural and cyclical components—trend output and <strong>the</strong><br />
trend price <strong>of</strong> copper—are computed by independent expert panels and are thus<br />
insulated from <strong>the</strong> political process. Chile’s fiscal institutions could usefully be<br />
emulated everywhere, but especially in o<strong>the</strong>r commodity-exporting countries. 8<br />
8 For more detailed information and more references see Frankel (2011).<br />
©International Monetary Fund. Not for Redistribution
174 How Can Commodity Exporters Make Fiscal and Monetary Policy Less Procyclical?<br />
Chile is not <strong>the</strong> only country <strong>to</strong> have made progress in <strong>the</strong> direction <strong>of</strong> countercyclical<br />
fiscal policy in recent years. Never<strong>the</strong>less, it is a particularly striking<br />
case, because it has beaten <strong>the</strong> curse <strong>of</strong> procyclicality through <strong>the</strong> innovation <strong>of</strong> a<br />
set <strong>of</strong> fiscal institutions that are designed <strong>to</strong> work even in a world where politicians<br />
and voters are fallible human beings ra<strong>the</strong>r than angels. The proposition<br />
that institutions are key, that is, that one is less likely <strong>to</strong> get good policies in <strong>the</strong><br />
absence <strong>of</strong> good institutions, has popped up everywhere in economics in recent<br />
years. 9 What is sometimes missing is examples <strong>of</strong> very specific institutions that<br />
countries might wisely adopt, institutions that are nei<strong>the</strong>r so loose that <strong>the</strong>ir constraints<br />
don’t bind nor so rigid that <strong>the</strong>y have <strong>to</strong> be abandoned subsequently in<br />
light <strong>of</strong> circumstances.<br />
Chile’s fiscal policy is governed by a set <strong>of</strong> rules. The first rule sets a target for<br />
<strong>the</strong> overall budget balance. The target surplus was originally set at a surplus <strong>of</strong><br />
1 percent <strong>of</strong> GDP, for three purposes: (i) <strong>to</strong> recapitalize <strong>the</strong> central bank, which<br />
inherited a negative net worth from bailing out <strong>the</strong> private banking system in <strong>the</strong><br />
1980s and from some sterilization <strong>of</strong> inflows in <strong>the</strong> 1990s, (ii) <strong>to</strong> fund some<br />
pension-related liabilities, and (iii) <strong>to</strong> service net external dollar debt (Rodríguez,<br />
Tokman, and Vega, 2007, pp. 5, 21). The target was subsequently lowered <strong>to</strong><br />
½ percent <strong>of</strong> GDP in 2007, and again lowered <strong>to</strong> 0 in 2009, since it was determined<br />
that <strong>the</strong> debt had been essentially paid <strong>of</strong>f and that a structurally balanced<br />
budget was economically appropriate. 10<br />
The Inadequacy <strong>of</strong> Budget Rules<br />
A budget-balance target may sound like <strong>the</strong> budget deficit ceilings that supposedly<br />
constrain members <strong>of</strong> <strong>the</strong> European Union (capping deficits at 3 percent <strong>of</strong><br />
GDP under <strong>the</strong> Stability and Growth Pact) or like <strong>the</strong> occasional U.S. proposals<br />
for a Balanced Budget Amendment (zero deficit). But those attempts have failed.<br />
They are <strong>to</strong>o rigid <strong>to</strong> allow <strong>the</strong> need for deficits in recessions, counterbalanced by<br />
surpluses in good times.<br />
It is not always <strong>the</strong> case that <strong>to</strong>ugher constraints on fiscal policy increase effective<br />
budget discipline. Countries <strong>of</strong>ten violate <strong>the</strong>ir constraints. In an extreme<br />
set-up, a rule that is <strong>to</strong>o rigid—so rigid that <strong>of</strong>ficial claims that it will be sustained<br />
are not credible—might even lead <strong>to</strong> looser fiscal outcomes than if a more moderate<br />
and flexible rule had been specified at <strong>the</strong> outset (Neut and Velasco, 2003). 11<br />
The case <strong>of</strong> rules that are <strong>to</strong>o onerous <strong>to</strong> last arises particularly in <strong>the</strong> s<strong>to</strong>chastic<br />
context. A target that might have been a reasonable goal in principle, such as an<br />
9<br />
In <strong>the</strong> case <strong>of</strong> fiscal policy, <strong>the</strong> importance <strong>of</strong> institutions has been emphasized by Buchanan (1967),<br />
von Hagen and Harden (1995), Alesina and Perotti (1995, 1996), Poterba (1997), Poterba and von<br />
Hagen (1999), Persson and Tabellini (2004), and Wyplosz (2005). For commodity producers more<br />
specifically: Davis and o<strong>the</strong>rs. (2001, 2003) and Ossowski and o<strong>the</strong>rs. (2008), among o<strong>the</strong>rs.<br />
10A team <strong>of</strong> three economists appointed by Finance Minister Andres Velasco recommended reducing<br />
<strong>the</strong> structural budget target.<br />
11<br />
Certainly Euro countries large and small have repeatedly violated <strong>the</strong> fiscal rules <strong>of</strong> <strong>the</strong> Stability and<br />
Growth Pact.<br />
©International Monetary Fund. Not for Redistribution
Frankel 175<br />
unconditionally balanced budget, becomes unreasonable after an unexpected<br />
shock, such as a severe fall in export prices or national output.<br />
This is true both in cases where an ex post shock renders a given ex ante budget<br />
target undesirable in a short-term economic sense (so that maintaining longterm<br />
credibility is <strong>the</strong> only economic argument for abiding by <strong>the</strong> rule) and in<br />
cases where <strong>the</strong> target may remain economically desirable in itself, but is up<br />
against predictably irresistible political pressures. Common examples <strong>of</strong> <strong>the</strong> first<br />
sort are rigid balanced budget rules that do not allow <strong>the</strong> possibility <strong>of</strong> fiscal<br />
deficits in bad times. Common examples <strong>of</strong> <strong>the</strong> second sort are provisions for<br />
special fiscal institutions that may have been written out <strong>to</strong> please <strong>the</strong> World Bank<br />
or IMF but without local elites’ taking ownership <strong>of</strong> <strong>the</strong> reforms, let alone winning<br />
public support for <strong>the</strong>m. Such institutions, which include fiscal rules and<br />
fiscal responsibility legislation, are <strong>of</strong>ten abandoned before long. 12<br />
A sensible alternative is <strong>to</strong> specify rules that mandate changes in response <strong>to</strong><br />
changed circumstances. In particular, instead <strong>of</strong> targeting an actual budget balance<br />
<strong>of</strong> zero or setting some numerical surplus, <strong>the</strong> rule can target a number for <strong>the</strong><br />
structural budget. This alternative may not work, however, if <strong>the</strong> determination<br />
whe<strong>the</strong>r a deficit is or is not structural is made within <strong>the</strong> political process. Nor<br />
does <strong>the</strong> rule necessarily succeed in imposing discipline. Politicians can always<br />
attribute a budget deficit <strong>to</strong> unexpectedly and temporarily poor economic growth.<br />
Since <strong>the</strong>re is no way <strong>of</strong> proving what an unbiased forecast <strong>of</strong> growth is, <strong>the</strong>re is no<br />
way <strong>of</strong> disproving <strong>the</strong> politicians’ claim that <strong>the</strong> shortfall is not <strong>the</strong>ir responsibility.<br />
The Case <strong>of</strong> Chile and Copper<br />
Copper accounts for approximately 16 percent <strong>of</strong> Chile’s fiscal income.<br />
Specifically, about 10 percent <strong>of</strong> income is from <strong>the</strong> revenues <strong>of</strong> <strong>the</strong> copper corporation<br />
CODELCO, which is owned by <strong>the</strong> government, and <strong>the</strong> rest (6 percent)<br />
is tax revenue from private mining companies. That <strong>the</strong> figure is only 16<br />
percent illustrates <strong>the</strong> fact that Chile’s use <strong>of</strong> copper exports has not prevented it<br />
from achieving a diversified economy. Having said that, <strong>the</strong> number understates<br />
<strong>the</strong> sensitivity <strong>of</strong> <strong>the</strong> budget <strong>to</strong> copper prices. Copper pr<strong>of</strong>its are much more<br />
volatile than <strong>the</strong> rest <strong>of</strong> GDP. Fur<strong>the</strong>rmore, <strong>the</strong> mining industry tends <strong>to</strong> have a<br />
multiplier effect on <strong>the</strong> rest <strong>of</strong> GDP. Madrid-Aris and Villena (2005) argue that<br />
copper prices drive <strong>the</strong> Chilean economy. 13 O<strong>the</strong>r mineral and agricultural commodities<br />
are also important, although <strong>the</strong>ir prices on world markets are <strong>to</strong> some<br />
extent correlated with copper.<br />
12 An econometric analysis <strong>of</strong> <strong>the</strong>se special financial institutions for oil producers by Ossowski and<br />
o<strong>the</strong>rs (2008, pp. 19, 23, 24, 38–43) finds no statistically significant effect on <strong>the</strong> actual fiscal stance.<br />
This may be partly due <strong>to</strong> econometric limitations. But it is evidently also in part due <strong>to</strong> governments<br />
that, after having adopted <strong>the</strong>se institutions, subsequently find <strong>the</strong>m <strong>to</strong>o rigid in practice and so<br />
weaken or abandon <strong>the</strong>m. Recent examples include Ecuador, Equa<strong>to</strong>rial Guinea, and Venezuela<br />
(Ossowski and o<strong>the</strong>rs, 2008, pp. 12–13, 19, 24). Also see Villafuerte, Murphy, and Ossowski (2010).<br />
13 Their econometrics are cointegration tests and <strong>the</strong>ir <strong>the</strong>ory is essentially classic Dutch disease: an<br />
increase in copper prices is transmitted <strong>to</strong> <strong>the</strong> nontradable sec<strong>to</strong>r via appreciation <strong>of</strong> <strong>the</strong> currency.<br />
©International Monetary Fund. Not for Redistribution
176 How Can Commodity Exporters Make Fiscal and Monetary Policy Less Procyclical?<br />
The central rule that makes up Chile’s structural balance regime is that <strong>the</strong><br />
government can run a deficit larger than <strong>the</strong> target <strong>to</strong> <strong>the</strong> extent that: (i) output<br />
falls short <strong>of</strong> its long-run trend, in a recession, or (ii) <strong>the</strong> price <strong>of</strong> copper is below<br />
its medium-term (10-year) equilibrium. The key institutional innovation is that<br />
<strong>the</strong>re are two panels <strong>of</strong> experts whose job each midyear is <strong>to</strong> make <strong>the</strong> judgments,<br />
respectively, concerning what is <strong>the</strong> output gap and what is <strong>the</strong> medium-term equilibrium<br />
price <strong>of</strong> copper. The experts on <strong>the</strong> copper panel are drawn from mining<br />
companies, <strong>the</strong> financial sec<strong>to</strong>r, research centers, and universities. The government<br />
<strong>the</strong>n follows a set <strong>of</strong> procedures that translates <strong>the</strong>se numbers, combined with any<br />
given set <strong>of</strong> tax and spending parameters, in<strong>to</strong> <strong>the</strong> estimated structural budget balance.<br />
If <strong>the</strong> resulting estimated structural budget balance differs from <strong>the</strong> target,<br />
<strong>the</strong>n <strong>the</strong> government adjusts spending plans until <strong>the</strong> desired balance is achieved.<br />
Already by 2006, <strong>the</strong> structural budget policy had shown clear benefits.<br />
Between 2000 and 2005, public savings rose from 2.5 percent <strong>of</strong> GDP <strong>to</strong> 7.9<br />
percent, allowing national savings <strong>to</strong> rise from 21 percent <strong>to</strong> 24 percent. As a<br />
result, central government debt fell sharply as a share <strong>of</strong> GDP (especially central<br />
bank debt) and <strong>the</strong> sovereign spread gradually declined (Rodríguez, Tokman, and<br />
Vega, 2007, pp. 27, 29–30). By 2006, Chile had achieved a sovereign debt rating<br />
<strong>of</strong> A, several notches ahead <strong>of</strong> Mexico, Brazil, and o<strong>the</strong>r Latin American peers. 14<br />
By 2007, Chile had become a net credi<strong>to</strong>r. By June 2010, its sovereign rating had<br />
climbed <strong>to</strong> A+, ahead <strong>of</strong> some advanced countries, including Israel and Korea (A),<br />
and <strong>of</strong> course far ahead <strong>of</strong> Iceland (BBB–) and Greece (BB+).<br />
The announcement <strong>of</strong> <strong>the</strong> structural surplus rule in itself appears <strong>to</strong> have<br />
improved Chile’s creditworthiness in 2000, even before it had had time <strong>to</strong> operate.<br />
15 Even this early, better access <strong>to</strong> foreign capital may have helped <strong>the</strong> country<br />
<strong>to</strong> wea<strong>the</strong>r <strong>the</strong> 2001–02 crisis more easily than <strong>the</strong> crisis <strong>of</strong> 1982–83. Public<br />
spending fluctuated much less than in past decades, and less than income helping<br />
<strong>to</strong> stabilize <strong>the</strong> business cycle (Rodríguez, Tokman, and Vega, 2007, pp. 32,<br />
33–34). According <strong>to</strong> one estimate, <strong>the</strong> structural balance policy allowed a reduction<br />
in GDP volatility <strong>of</strong> one-third in 2001–05 (Larrain and Parro, 2006).<br />
Ano<strong>the</strong>r study suggests that <strong>the</strong> policy can all but eliminate <strong>the</strong> effects <strong>of</strong> copper<br />
price fluctuations on <strong>the</strong> real economy. 16<br />
The real test <strong>of</strong> <strong>the</strong> policy came during <strong>the</strong> latter years <strong>of</strong> <strong>the</strong> copper boom <strong>of</strong><br />
2003–08. (See Figure 10.2.) As usual, <strong>the</strong>re was political pressure <strong>to</strong> declare <strong>the</strong><br />
increase in <strong>the</strong> price <strong>of</strong> copper permanent, <strong>the</strong>reby justifying spending on a par<br />
with export earnings. The expert panel ruled that most <strong>of</strong> <strong>the</strong> price increase was<br />
temporary, so most <strong>of</strong> <strong>the</strong> earnings had <strong>to</strong> be saved. This turned out <strong>to</strong> be wise.<br />
14 Standard and Poor ratings, obtained from Bloomberg.<br />
15 Rodríguez, Tokman, and Vega (2007, p. 30) report a turnaround in Chile’s sovereign spread from<br />
<strong>the</strong> date <strong>of</strong> <strong>the</strong> announcement in early 2000. Perry (2003, pp. 13–14) also sees an immediate credibility<br />
effect .<br />
16 Medina and So<strong>to</strong> (2007) find in a DSGE model that <strong>the</strong> fiscal regime is capable <strong>of</strong> reducing <strong>the</strong><br />
effect on Chile’s GDP <strong>of</strong> a 10 percent exogenous increase in <strong>the</strong> copper price from 0.70 percent <strong>to</strong><br />
0.05 percent.<br />
©International Monetary Fund. Not for Redistribution
Figure 10.2<br />
The real price <strong>of</strong> copper relative <strong>to</strong> its trend, 1959–2009<br />
Real copper price (copper<br />
price in $/US CPI)<br />
0.018<br />
0.016<br />
0.014<br />
0.012<br />
0.01<br />
0.008<br />
0.006<br />
0.004<br />
0.002<br />
0<br />
1959 1969 1979 1989 1999 2009<br />
Annual price Long-run trend 10-year MA<br />
Source: Author’s estimates.<br />
The real price <strong>of</strong> copper over 50 years<br />
Frankel 177<br />
The 2008 price spike indeed partly reversed <strong>the</strong> next year. As a result, <strong>the</strong> fiscal<br />
surplus reached almost 9 percent when copper prices were high. The country paid<br />
down its debt <strong>to</strong> a mere 4 percent <strong>of</strong> GDP and saved about 12 percent <strong>of</strong> GDP<br />
in its sovereign wealth fund. This allowed a substantial fiscal easing in <strong>the</strong> recession<br />
<strong>of</strong> 2008-09, when <strong>the</strong> stimulus was most sorely needed.<br />
Part <strong>of</strong> <strong>the</strong> credit for Chile’s structural budget rule should go <strong>to</strong> earlier governments.<br />
But <strong>the</strong> structural budget rule became a true institution under <strong>the</strong><br />
Bachelet government, which enshrined <strong>the</strong> general framework in law in 2006.<br />
Just as important, it abided by <strong>the</strong> law—and in fact <strong>to</strong>ok extra steps <strong>to</strong> make sure<br />
<strong>the</strong> copper bonanza was saved—when it was most difficult <strong>to</strong> do so politically.<br />
The tremendous approbation received in <strong>the</strong> public opinion polls in 2009 by<br />
President Bachelet and her finance minister, Andres Velasco, was in this sense a<br />
well-earned reward for having done <strong>the</strong> right thing.<br />
Econometric Findings <strong>of</strong> Systematic Over-Optimism<br />
in Government Forecasts<br />
Perhaps <strong>the</strong>re is an error in <strong>of</strong>ficials’ perceptions: A world <strong>of</strong> high commodity<br />
prices <strong>to</strong>day, during <strong>the</strong> boom, is extrapolated indefinitely far in<strong>to</strong> <strong>the</strong> future,<br />
whereas in reality <strong>the</strong> real price will eventually return <strong>to</strong> some long-run equilibrium.<br />
Or else <strong>the</strong> political process may override sober judgments, so that spending<br />
responds <strong>to</strong> booms more than a rational intertemporal optimization would dictate.<br />
I have found statistical support for hypo<strong>the</strong>ses regarding forecasts by <strong>of</strong>ficial<br />
agencies that have responsibility for formulating <strong>the</strong> budget (Frankel, 2011).<br />
(i) Official forecasts <strong>of</strong> budget deficits in a sample <strong>of</strong> 33 countries are overly<br />
optimistic on average.<br />
(ii) Official forecasts <strong>of</strong> GDP growth in <strong>the</strong> sample <strong>of</strong> 33 countries are also<br />
overly optimistic on average.<br />
©International Monetary Fund. Not for Redistribution
178 How Can Commodity Exporters Make Fiscal and Monetary Policy Less Procyclical?<br />
(iii) The bias <strong>to</strong>ward over-optimism is stronger <strong>the</strong> longer <strong>the</strong> horizon.<br />
(iv) The bias is greater among European governments that are politically subject<br />
<strong>to</strong> <strong>the</strong> budget rules in <strong>the</strong> Stability and Growth Pact. (When <strong>the</strong> budget<br />
deficit is high, <strong>of</strong>ficials are under pressure <strong>to</strong> project that it will come back<br />
down in <strong>the</strong> future, even if it won’t.)<br />
(v) The bias is greater at <strong>the</strong> extremes <strong>of</strong> <strong>the</strong> business cycle, particularly in<br />
booms, when <strong>the</strong> scope for wishful thinking is <strong>the</strong> greatest.<br />
(vi) In most countries, <strong>the</strong> real growth rate is <strong>the</strong> key macroeconomic input for<br />
budget forecasting.<br />
(vii) In Chile, <strong>the</strong> price <strong>of</strong> copper is <strong>the</strong> key macroeconomic input for budget<br />
forecasting (as illustrated in Figure 10.3).<br />
(viii) Real copper prices mean-revert in <strong>the</strong> long run, but this is not always readily<br />
perceived.<br />
(ix) Private copper forecasters do incorporate a tendency for <strong>the</strong> real price <strong>to</strong><br />
revert gradually <strong>to</strong> a long-run trend. (Figure 10.4 illustrates that when <strong>the</strong><br />
price <strong>of</strong> copper goes up, nei<strong>the</strong>r <strong>the</strong> forward rate nor <strong>the</strong> forecasts <strong>of</strong> <strong>the</strong><br />
Chilean expert panel rise fully in proportion.)<br />
(x) Chile’s <strong>of</strong>ficial budget forecasts are not overly optimistic on average. (This<br />
is presumably a major explanation <strong>of</strong> how it has achieved its structural<br />
budget targets.)<br />
Taken <strong>to</strong>ge<strong>the</strong>r, <strong>the</strong>se results tell a coherent s<strong>to</strong>ry. Among many countries, <strong>the</strong>re<br />
is a tendency <strong>to</strong>ward wishful thinking in <strong>of</strong>ficial forecasts <strong>of</strong> growth and <strong>the</strong> budget.<br />
The wishful thinking appears <strong>to</strong> take <strong>the</strong> form <strong>of</strong> unrealistic extrapolation <strong>of</strong><br />
booms three years in<strong>to</strong> <strong>the</strong> future. The bias is worse among countries that are<br />
supposedly subject <strong>to</strong> budget rules (e.g., <strong>the</strong> Stability and Growth Pact), presumably<br />
because those in <strong>the</strong> government who make <strong>the</strong> forecasts feel pressured <strong>to</strong> be<br />
able <strong>to</strong> announce that <strong>the</strong>y are on track <strong>to</strong> meet <strong>the</strong> budget targets even if <strong>the</strong>y<br />
are not. Chile is not subject <strong>to</strong> <strong>the</strong> same bias <strong>to</strong>ward over-optimism in forecasts<br />
<strong>of</strong> <strong>the</strong> budget, growth, or <strong>the</strong> all-important copper price. This evidence is consistent<br />
with <strong>the</strong> idea that <strong>the</strong> key innovation that has allowed Chile generally <strong>to</strong><br />
achieve countercyclical fiscal policy and in particular <strong>to</strong> run surpluses in booms is<br />
not just a structural budget rule in itself, but ra<strong>the</strong>r <strong>the</strong> regime that entrusts <strong>to</strong><br />
two panels <strong>of</strong> independent experts <strong>the</strong> responsibility for estimating <strong>the</strong> extent <strong>to</strong><br />
which contemporaneous copper prices and GDP have departed from <strong>the</strong>ir longrun<br />
trends.<br />
A refinement would be <strong>to</strong> give <strong>the</strong> panels formal independence, analogous<br />
<strong>to</strong> independent central banks, so that <strong>the</strong> members could not be fired. In<br />
some countries, it might be appropriate <strong>to</strong> mandate a place for foreign<br />
experts. There is nothing omniscient or magical about experts. A codified rule<br />
based on a simple 10- or 20-year moving average might do as well. The<br />
important idea is <strong>to</strong> protect budget forecasting from <strong>the</strong> inevitable political<br />
temptations.<br />
©International Monetary Fund. Not for Redistribution
Figure 10.3<br />
Chile’s budget balance forecast error vs. copper price<br />
forecast error<br />
Budget balance forecast error,<br />
% <strong>of</strong> GDP<br />
10<br />
8<br />
6<br />
4<br />
2<br />
0<br />
-2<br />
-4<br />
-6<br />
-8<br />
-10<br />
2006<br />
2004<br />
-100 -80 -60 -40 -20 0 20 40<br />
Source: Author’s estimates.<br />
PROPOSAL TO MAKE MONETARY POLICY MORE<br />
COUNTERCYCLICAL: PRODUCT PRICE TARGETING<br />
2005<br />
Frankel 179<br />
Three aspects <strong>of</strong> developing countries are particularly salient when choosing how<br />
<strong>to</strong> conduct monetary policy:<br />
• Developing countries need a strong anchor for inflation expectations, some<br />
nominal variable that <strong>the</strong> central bank commits <strong>to</strong> and can be moni<strong>to</strong>red by<br />
• They experience large supply shocks, especially fluctuations in <strong>the</strong>ir terms<br />
<strong>of</strong> trade, and<br />
2007<br />
2009<br />
2002<br />
1999 2001<br />
1997 1990 2008<br />
1994 20032000<br />
1991 1998<br />
1992 1996<br />
1995<br />
1993<br />
Deviation <strong>of</strong> 15-month copper forward price from<br />
actual year average price, % <strong>of</strong> actual price<br />
Figure 10.4<br />
Copper prices—spot, forward, and forecast, 2001–10<br />
U.S. dollar/metric <strong>to</strong>n<br />
9000<br />
8000<br />
7000<br />
6000<br />
5000<br />
4000<br />
3000<br />
2000<br />
1000<br />
0<br />
2001 2002 2003 2004 2005 2006 2007 2008 2009 2010<br />
Source: Author’s estimates.<br />
Spot price<br />
Chile <strong>of</strong>ficial forecast<br />
63-month forward price<br />
10-year moving average<br />
©International Monetary Fund. Not for Redistribution
180 How Can Commodity Exporters Make Fiscal and Monetary Policy Less Procyclical?<br />
• They cannot depend on countercyclical capital flows <strong>to</strong> smooth out trade<br />
shocks, in <strong>the</strong> way that finance <strong>the</strong>ory naively predicts.<br />
What nominal variable should be <strong>the</strong> monetary anchor, taking in<strong>to</strong> account <strong>the</strong>se<br />
considerations?<br />
The Standard List <strong>of</strong> Six Candidates for a Nominal Monetary<br />
Anchor<br />
Of <strong>the</strong> nominal variables that could potentially anchor expectations, six candidates<br />
are familiar. Two were tried in <strong>the</strong> past in many countries, two were proposed<br />
in <strong>the</strong> past but never tried, and two are popular <strong>to</strong>day.<br />
Both <strong>of</strong> those that were tried his<strong>to</strong>rically encountered serious problems and are<br />
considered <strong>to</strong> have been somewhat discredited. The pre-1914 gold standard used<br />
<strong>the</strong> price <strong>of</strong> gold as <strong>the</strong> nominal anchor. Among its drawbacks were large shifts in<br />
<strong>the</strong> world demand and supply for gold that were needlessly translated in<strong>to</strong> monetary<br />
fluctuations. Monetarism uses M1 as <strong>the</strong> nominal anchor. It was adopted by<br />
<strong>the</strong> central banks <strong>of</strong> <strong>the</strong> largest industrialized countries in <strong>the</strong> early 1980s. It was<br />
abandoned by <strong>the</strong>m when shifts in <strong>the</strong> demand for money proved <strong>to</strong>o destabilizing.<br />
Economists have made proposals <strong>to</strong> improve on each <strong>of</strong> those two regimes.<br />
A proposal <strong>to</strong> peg <strong>to</strong> a broader basket <strong>of</strong> commodities would have been more stable<br />
than pegging <strong>to</strong> gold alone (Keynes, 1938; Hall, 1985). A proposal for nominal<br />
income targeting would have avoided <strong>the</strong> velocity shocks that plagued monetarism.<br />
17 Nei<strong>the</strong>r <strong>of</strong> <strong>the</strong>se two candidates has ever been put in<strong>to</strong> practice, however,<br />
and <strong>the</strong>y are little discussed <strong>to</strong>day.<br />
That leaves <strong>the</strong> two nominal anchors that have dominated in recent years. One<br />
is <strong>the</strong> exchange rate, which remains an important option for many countries.<br />
Small open countries <strong>of</strong>ten go all <strong>the</strong> way <strong>to</strong> a fixed exchange rate or even monetary<br />
union. Middle-sized countries may follow a target zone or some o<strong>the</strong>r<br />
intermediate regime. Exchange rate targets lost some <strong>of</strong> <strong>the</strong>ir popularity, however,<br />
after <strong>the</strong> currency crises <strong>of</strong> <strong>the</strong> 1990s. The reigning champion, since that time, has<br />
been inflation targeting. Brazil, Chile, Colombia, Mexico, <strong>the</strong> Czech Republic,<br />
Poland, and South Africa all switched from exchange rate targets <strong>to</strong> inflation<br />
targeting around 1999–2000, followed by o<strong>the</strong>rs. 18<br />
There are many different variations on <strong>the</strong> regime <strong>of</strong> inflation targeting. Some<br />
proposals target <strong>the</strong> price level, and some target its rate <strong>of</strong> change. Some require<br />
<strong>the</strong> monetary authorities <strong>to</strong> pursue annual inflation targets and nothing else, while<br />
o<strong>the</strong>rs are flexible, allowing diversion from <strong>the</strong> long-run inflation goal in order <strong>to</strong><br />
17 While many eminent economists argued <strong>the</strong> case for nominal GDP targeting in <strong>the</strong> context <strong>of</strong><br />
advanced countries, McKibbin and Singh (2003) are among <strong>the</strong> few who have done so for developing<br />
countries.<br />
18 Among <strong>the</strong> authors who have examined inflation targeting specifically for developing and emerging<br />
market countries are: Debelle (2001); Fraga, Goldfajn, and Minella (2003); Mishkin (2000, 2008);<br />
Lax<strong>to</strong>n and Pesenti (2003); and many <strong>of</strong> <strong>the</strong> chapters in Loayza and So<strong>to</strong> (2002).<br />
©International Monetary Fund. Not for Redistribution
Frankel 181<br />
put some weight in <strong>the</strong> short run on stabilizing output. 19 Some make a distinction<br />
between targeting <strong>the</strong> expected CPI and targeting <strong>the</strong> actual CPI. Some target <strong>the</strong><br />
headline CPI, while some exclude <strong>the</strong> more volatile food and energy component<br />
<strong>to</strong> focus on core inflation. Regardless, what almost all <strong>of</strong> <strong>the</strong>m have in common is<br />
a focus on <strong>the</strong> CPI, ra<strong>the</strong>r than on some o<strong>the</strong>r sort <strong>of</strong> price index.<br />
The CPI may not be <strong>the</strong> best choice <strong>of</strong> price index for a country that is subject <strong>to</strong><br />
volatile terms <strong>of</strong> trade. For those countries, my proposal is <strong>to</strong> replace it with a measure<br />
<strong>of</strong> product prices. This could be an index covering major export commodities or a<br />
more comprehensive index <strong>of</strong> product prices. The important point is that it should<br />
give heavy weight <strong>to</strong> <strong>the</strong> country’s export commodities, which <strong>the</strong> CPI does not do,<br />
and it should not give much weight <strong>to</strong> imported goods, which <strong>the</strong> CPI does do.<br />
The Procyclicality <strong>of</strong> Both Exchange Rate Targeting<br />
and Inflation Targeting, under Trade Shocks<br />
The concern is that monetary policy can be procyclical under ei<strong>the</strong>r an exchangerate–target<br />
regime or a CPI-target regime, <strong>to</strong> <strong>the</strong> extent that terms <strong>of</strong> trade shocks<br />
are important. Consider first what happens under a fixed exchange rate, when a<br />
country experiences a commodity boom. Normally this means a trade surplus—<br />
whe<strong>the</strong>r <strong>the</strong> boom takes <strong>the</strong> form <strong>of</strong> an increase in supply or <strong>of</strong> an increase in <strong>the</strong><br />
dollar price <strong>of</strong> <strong>the</strong> commodity on world markets, or both. In <strong>the</strong>ory, temporary<br />
trade booms and busts should be efficiently <strong>of</strong>fset by intertemporally optimizing<br />
international capital flows. In practice, capital flows are more likely <strong>to</strong> flow in<br />
during a commodity boom than out. The overall balance <strong>of</strong> payments rises in <strong>the</strong><br />
boom phase and falls in <strong>the</strong> bust phase.<br />
In <strong>the</strong> boom phase, when reserves flow in, <strong>the</strong> result is likely <strong>to</strong> be excessive<br />
expansion <strong>of</strong> money and credit, overheating, and inflation, as <strong>the</strong> Persian Gulf<br />
countries experienced during <strong>the</strong> oil boom <strong>of</strong> 2000–08. In <strong>the</strong> bust phase, when<br />
reserves flow out, <strong>the</strong> result is <strong>of</strong>ten a currency crisis, featuring a contraction <strong>of</strong><br />
money and credit and a recession, as was experienced by Mexico, Indonesia,<br />
Nigeria, Russia, and Ecuador when oil prices fell in <strong>the</strong> 1990s. It would be better<br />
<strong>to</strong> allow some currency appreciation during export booms and some depreciation<br />
during export busts.<br />
This destabilizing nature <strong>of</strong> a fixed exchange rate in <strong>the</strong> presence <strong>of</strong> trade<br />
shocks is a familiar point raised in favor <strong>of</strong> floating exchange rates in <strong>the</strong> classic<br />
debate over exchange rate regimes. But if <strong>the</strong> exchange rate is not <strong>to</strong> be <strong>the</strong><br />
nominal anchor, <strong>the</strong>n some o<strong>the</strong>r variable must fill this role. For many countries,<br />
especially those <strong>of</strong> middle size, inflation targeting <strong>to</strong>ok <strong>the</strong> place <strong>of</strong> exchange rate<br />
targeting after <strong>the</strong> experience <strong>of</strong> <strong>the</strong> 1990s.<br />
How does inflation targeting fare in <strong>the</strong> face <strong>of</strong> terms-<strong>of</strong>-trade shocks? It <strong>to</strong>o<br />
fails <strong>to</strong> accommodate fluctuations in <strong>the</strong> world price <strong>of</strong> <strong>the</strong> export commodity.<br />
When <strong>the</strong> export commodity price goes up, it would be desirable <strong>to</strong> tighten<br />
19 Some define inflation targeting broadly this way: “choose a long run goal for inflation and be transparent.”<br />
It is hard <strong>to</strong> argue with this. But something more specific is usually implied.<br />
©International Monetary Fund. Not for Redistribution
182 How Can Commodity Exporters Make Fiscal and Monetary Policy Less Procyclical?<br />
monetary policy just enough <strong>to</strong> allow some currency appreciation, in order <strong>to</strong><br />
limit excess demand for goods (overheating that might o<strong>the</strong>rwise show up, for<br />
example, in a real estate bubble). Symmetrically, when <strong>the</strong> commodity price goes<br />
down, it would be desirable <strong>to</strong> ease monetary policy enough <strong>to</strong> allow some currency<br />
depreciation, in order <strong>to</strong> limit excess supply for goods (which might o<strong>the</strong>rwise<br />
show up, for example, in recession or a financial crisis). CPI targeting does<br />
not au<strong>to</strong>matically produce this result.<br />
To be sure, inflation targeting proponents usually admit that monetary policy<br />
should respond <strong>to</strong> movements in commodity prices or asset prices <strong>to</strong> <strong>the</strong> extent that<br />
<strong>the</strong>y indicate future inflation. But this is not good enough. One thing we should<br />
have learned from experience with <strong>the</strong> credit cycle is that excessively easy monetary<br />
policy can lead <strong>to</strong> asset bubbles and an eventual costly crash, without goods<br />
market inflation having appeared at any stage.<br />
Two kinds <strong>of</strong> adverse terms-<strong>of</strong>-trade shocks afflict small countries, and inflation<br />
targeting is insufficiently countercyclical in both cases. We have just seen that<br />
<strong>the</strong> first, a fall in <strong>the</strong> price <strong>of</strong> <strong>the</strong> export commodity, calls forth essentially no<br />
response from monetary policy. In this sense, inflation targeting is acyclical. The<br />
second kind <strong>of</strong> adverse terms-<strong>of</strong>-trade shock is an increase in <strong>the</strong> price <strong>of</strong> <strong>the</strong><br />
import commodity. Here inflation targeting is actually procyclical, or destabilizing.<br />
Consider, for example, an increase in <strong>the</strong> world price <strong>of</strong> oil or food from <strong>the</strong><br />
viewpoint <strong>of</strong> a country that must import <strong>the</strong>se commodities. Energy and food<br />
occupy a substantial share <strong>of</strong> <strong>the</strong> CPI. A strict interpretation <strong>of</strong> CPI targeting,<br />
<strong>the</strong>refore, tells <strong>the</strong> central bank that it must contract monetary policy <strong>to</strong> prevent<br />
<strong>the</strong> CPI from rising. It must contract a lot, enough so that <strong>the</strong> currency appreciates<br />
by <strong>the</strong> same percentage (in terms <strong>of</strong> dollars) as <strong>the</strong> prices <strong>of</strong> food and oil have<br />
gone up (in terms <strong>of</strong> dollars). Only <strong>the</strong>n will import prices stay flat in terms <strong>of</strong><br />
domestic currency. But appreciating <strong>the</strong> currency in response <strong>to</strong> an adverse terms<strong>of</strong>-trade<br />
shock is precisely <strong>the</strong> opposite <strong>of</strong> what is wanted; it exacerbates <strong>the</strong> economic<br />
impact <strong>of</strong> <strong>the</strong> disturbance. 20<br />
Many inflation-targeting central bankers understand well that appreciating <strong>the</strong><br />
currency in response <strong>to</strong> an import price shock is undesirable. Their response is<br />
that <strong>the</strong>y address this problem by targeting <strong>the</strong> core CPI, which excludes food and<br />
energy, in place <strong>of</strong> <strong>the</strong> headline CPI. Does core CPI solve <strong>the</strong> problem? Not really.<br />
For one thing, food and energy need not correspond <strong>to</strong> <strong>the</strong> list <strong>of</strong> imported commodities.<br />
More importantly, it is not easy for a central bank <strong>to</strong> explain <strong>to</strong> its<br />
population that it should not worry about headline inflation because <strong>the</strong> costs<br />
that are going up are “only” <strong>the</strong> costs <strong>of</strong> filling <strong>the</strong> fuel tank and putting food on<br />
<strong>the</strong> table. Finally, <strong>the</strong>re is reason <strong>to</strong> think that even those inflation-targeting central<br />
banks that talk about core CPI in fact react <strong>to</strong> an increase in <strong>the</strong> price <strong>of</strong><br />
imported oil by contracting and appreciating, perhaps because <strong>the</strong>y feel constrained<br />
by <strong>the</strong> reputational damage that would result from headline inflation.<br />
20 The instability <strong>of</strong> inflation targeting in <strong>the</strong> face <strong>of</strong> trade shocks is an instance <strong>of</strong> <strong>the</strong> broader instability<br />
in <strong>the</strong> face <strong>of</strong> supply shocks (McKibbin and Singh, 2003; Frankel, Smit, and Sturzenegger, 2008).<br />
©International Monetary Fund. Not for Redistribution
Frankel 183<br />
In South Africa, <strong>the</strong> correlation between <strong>the</strong> dollar value <strong>of</strong> <strong>the</strong> rand and <strong>the</strong><br />
dollar price <strong>of</strong> its imports is 85 percent (Frankel, 2005, Table 2). Why is this<br />
surprising? One expects a floating currency <strong>to</strong> depreciate when <strong>the</strong> price <strong>of</strong> its<br />
imports goes up, because this is an adverse change in <strong>the</strong> terms <strong>of</strong> trade. Yet <strong>the</strong><br />
exchange rate moves strongly <strong>the</strong> o<strong>the</strong>r way. Evidently, South Africa’s central bank<br />
responds <strong>to</strong> increases in <strong>the</strong> dollar price <strong>of</strong> oil by tightening monetary policy<br />
enough <strong>to</strong> appreciate <strong>the</strong> rand. Why would it do that? Because it is an inflation<br />
targeter, and it seeks <strong>to</strong> avoid an increase in <strong>the</strong> CPI even when it can be traced<br />
solely <strong>to</strong> an increase in world oil prices.<br />
Perhaps <strong>the</strong>re is some o<strong>the</strong>r explanation for <strong>the</strong> South African case. But an<br />
examination <strong>of</strong> 14 oil-importing countries in Latin America reveals an interesting<br />
pattern: every one <strong>of</strong> <strong>the</strong> inflation targeters shows correlations between dollar<br />
import prices and <strong>the</strong> dollar values <strong>of</strong> <strong>the</strong>ir currencies that are both positive<br />
during <strong>the</strong> period 2000–08 and greater than <strong>the</strong> correlations during <strong>the</strong> preinflation-targeting<br />
period (Frankel, 2010a, Table 1). The evidence supports <strong>the</strong><br />
idea that <strong>the</strong> inflation targeters—in particular, Brazil, Chile, and Peru—tended <strong>to</strong><br />
react <strong>to</strong> <strong>the</strong> adverse oil shocks <strong>of</strong> <strong>the</strong> decade by tightening monetary policy and<br />
<strong>the</strong>reby appreciating <strong>the</strong>ir currencies. The implication seems <strong>to</strong> be that <strong>the</strong> CPI<br />
which <strong>the</strong>y target does not in practice entirely exclude oil price shocks. Apparently<br />
“flexible inflation targeting” is not so flexible.<br />
Product Price Targeting<br />
For countries with terms-<strong>of</strong>-trade volatility, I have recently proposed a new alternative,<br />
which I call PPT for product price targeting. The idea can be thought <strong>of</strong> as<br />
a modification <strong>of</strong> inflation targeting, with <strong>the</strong> important difference that <strong>the</strong> price<br />
index is output-oriented ra<strong>the</strong>r than consumption-oriented. A variety <strong>of</strong> produc<strong>to</strong>riented<br />
price indices should work. The important point is that <strong>the</strong> index should<br />
give heavy weight <strong>to</strong> commodities that are produced for export and should give<br />
little weight <strong>to</strong> commodities that are imported. The CPI handles this <strong>the</strong> o<strong>the</strong>r<br />
way around.<br />
Why is <strong>the</strong> difference important? On <strong>the</strong> one hand, if <strong>the</strong> export commodity<br />
is in <strong>the</strong> index, as under PPT, <strong>the</strong>n monetary policy will au<strong>to</strong>matically accommodate<br />
fluctuations in <strong>the</strong> export price, a desirable property that CPI targeting<br />
unfortunately lacks. On <strong>the</strong> o<strong>the</strong>r hand, if <strong>the</strong> import commodity is in <strong>the</strong> index,<br />
as under CPI targeting, <strong>the</strong>n monetary policy reacts perversely <strong>to</strong> fluctuations in<br />
<strong>the</strong> import price, an undesirable property that PPT fortunately lacks. Thus PPT<br />
is more countercyclical or less procyclical than CPI targeting.<br />
One way <strong>to</strong> think <strong>of</strong> it is that PPT delivers <strong>the</strong> best <strong>of</strong> both worlds in <strong>the</strong> classic<br />
debate over exchange rate regimes: it accommodates terms-<strong>of</strong>-trade fluctuation <strong>the</strong><br />
way floating is supposed <strong>to</strong> do, 21 and yet at <strong>the</strong> same time it provides a nominal<br />
anchor, as exchange rate targeting and inflation targeting are supposed <strong>to</strong> do.<br />
21 Broda (2004) and Edwards and Yeyati (2005) support <strong>the</strong> textbook proposition that floating exchange<br />
rates stabilize <strong>the</strong> economy relative <strong>to</strong> fixed rates in <strong>the</strong> presence <strong>of</strong> trade shocks.<br />
©International Monetary Fund. Not for Redistribution
184 How Can Commodity Exporters Make Fiscal and Monetary Policy Less Procyclical?<br />
Modest and Practical Steps <strong>to</strong>ward PPT<br />
Any monetary authorities who are sufficiently worried about terms-<strong>of</strong>-trade fluctuations<br />
and government <strong>to</strong> be intrigued by <strong>the</strong> arguments for an output-based<br />
inflation target could approach <strong>the</strong> policy in a very gradual and low-risk manner.<br />
The first step for a government wishing <strong>to</strong> dip its <strong>to</strong>e in <strong>the</strong>se waters is <strong>to</strong><br />
compute an index <strong>of</strong> product prices and <strong>the</strong>n publish it. This could simply be<br />
<strong>the</strong> GDP defla<strong>to</strong>r that most countries already compute on a quarterly basis. A<br />
monthly frequency would be better, but most countries do not collect GDP<br />
accounts monthly. A monthly Wholesale Price Index or Producer Price Index<br />
(PPI) might serve. But those two indices weight sec<strong>to</strong>rs according <strong>to</strong> <strong>the</strong>ir gross<br />
sales, ra<strong>the</strong>r than value added, with <strong>the</strong> result that <strong>the</strong>y in effect <strong>of</strong>ten give more<br />
weight <strong>to</strong> inputs, including imported inputs, than is desirable. The preferred<br />
Product Price Index could ga<strong>the</strong>r its component prices, much as firms’ prices are<br />
ga<strong>the</strong>red for <strong>the</strong> Producer Price Index, but <strong>the</strong> weights on <strong>the</strong> sec<strong>to</strong>rs would be<br />
based on value added, as in <strong>the</strong> national income and product accounts. There is<br />
a need for research <strong>to</strong> develop <strong>the</strong> most suitable price index for <strong>the</strong> purpose. But<br />
<strong>the</strong> administrative and computational requirements need not be a constraint<br />
in <strong>the</strong> meantime. Any government that currently ga<strong>the</strong>rs a monthly CPI could<br />
ga<strong>the</strong>r a monthly Product Price Index, with <strong>the</strong> weights taken from measures <strong>of</strong><br />
national output ra<strong>the</strong>r than from household consumption surveys.<br />
The second step would be for <strong>the</strong> central bank <strong>to</strong> announce that it is moni<strong>to</strong>ring<br />
<strong>the</strong> index. The third step would be full product price targeting: each year <strong>the</strong> central<br />
bank would set an explicit target range for inflation, as measured by <strong>the</strong> index. It<br />
would operate like regular inflation targeting, except that <strong>the</strong>re is no need for embarrassing<br />
departures from <strong>the</strong> announced target when terms-<strong>of</strong>-trade shocks hit.<br />
Alternative Possible Product-Oriented Price Indices<br />
I have in <strong>the</strong> past put forward versions <strong>of</strong> this proposal that focused exclusively<br />
on export prices, ra<strong>the</strong>r than including <strong>the</strong> prices <strong>of</strong> all domestically produced<br />
goods and services. The simplest and earliest <strong>of</strong> <strong>the</strong>se, called peg <strong>the</strong> export price<br />
(PEP), was probably <strong>to</strong>o crude <strong>to</strong> be practical. But a brief recounting <strong>of</strong> <strong>the</strong> idea’s<br />
evolution may reinforce <strong>the</strong> intuition underlying all <strong>the</strong> proposals, because <strong>the</strong><br />
basic argument about terms-<strong>of</strong>-trade fluctuations is <strong>the</strong> same.<br />
The idea originated in <strong>the</strong> context <strong>of</strong> African gold producers. For most countries,<br />
<strong>to</strong> go on <strong>the</strong> gold standard would be <strong>to</strong> create needless volatility: monetary<br />
policy would loosen every time <strong>the</strong> world price <strong>of</strong> gold went down and tighten<br />
every time it went up. But for a country where gold constitutes most <strong>of</strong> <strong>the</strong> export<br />
revenue, this is just what is wanted. Simulations for such gold producers as<br />
Burkina Faso, Ghana, Mali, and South Africa have established <strong>the</strong> counterfactuals<br />
<strong>of</strong> what would have happened his<strong>to</strong>rically if any <strong>of</strong> <strong>the</strong>m had pegged its currency<br />
<strong>to</strong> gold, as compared <strong>to</strong> whatever exchange rate path <strong>the</strong>y in fact followed. Their<br />
currencies would have au<strong>to</strong>matically depreciated, stimulating exports, whenever<br />
<strong>the</strong> world gold market s<strong>of</strong>tened, and vice versa (Frankel, 2002).<br />
©International Monetary Fund. Not for Redistribution
Frankel 185<br />
How would <strong>the</strong> PEP proposal have worked operationally? Conceptually, one<br />
can imagine <strong>the</strong> government holding reserves <strong>of</strong> gold, and buying and selling <strong>the</strong><br />
metal whenever necessary <strong>to</strong> keep <strong>the</strong> price fixed in terms <strong>of</strong> local currency.<br />
Operationally, a more practical method would be for <strong>the</strong> central bank each day<br />
<strong>to</strong> announce an exchange rate vis-à-vis <strong>the</strong> dollar, following <strong>the</strong> rule that <strong>the</strong> day’s<br />
exchange rate target (dollars per local currency unit) moves precisely in proportion<br />
<strong>to</strong> <strong>the</strong> day’s price <strong>of</strong> gold on <strong>the</strong> London market (dollars per ounce). Then<br />
<strong>the</strong> central bank could intervene via <strong>the</strong> foreign exchange market <strong>to</strong> achieve <strong>the</strong><br />
day’s target. The dollar would be <strong>the</strong> vehicle currency for intervention—precisely<br />
as it has long been when a small country defends a peg <strong>to</strong> some non-dollar currency.<br />
Ei<strong>the</strong>r way, <strong>the</strong> effect would be <strong>to</strong> stabilize <strong>the</strong> price <strong>of</strong> gold in terms <strong>of</strong><br />
local currency. Or perhaps, since <strong>the</strong> price <strong>of</strong> gold is determined on <strong>the</strong> world<br />
market, a better way <strong>to</strong> express <strong>the</strong> same policy is stabilizing <strong>the</strong> price <strong>of</strong> local<br />
currency in terms <strong>of</strong> gold.<br />
The PEP proposal was readily extended <strong>to</strong> o<strong>the</strong>r commodity producers.<br />
Nigeria and Indonesia would peg <strong>to</strong> oil, Ethiopia and Nicaragua <strong>to</strong> c<strong>of</strong>fee,<br />
Zambia and Chile <strong>to</strong> copper, Guinea and Jamaica <strong>to</strong> bauxite, and so on (Frankel<br />
and Saiki, 2002; Frankel, 2003a). Simulations showed that under PEP, <strong>the</strong>ir currencies<br />
would have depreciated in <strong>the</strong> 1990s, when commodity prices declined.<br />
This would have been helpful. Weak commodity markets contributed <strong>to</strong> balance<strong>of</strong>-payments<br />
crises in many developing countries in <strong>the</strong> late 1990s. Many ended<br />
up eventually devaluing anyway, but only after painful losses <strong>of</strong> reserves, output,<br />
employment, wealth, and central bank credibility.<br />
Commenta<strong>to</strong>rs on <strong>the</strong> early PEP proposal pointed out that if applied literally,<br />
it would imply a lot <strong>of</strong> volatility. They were right. For an oil exporter, every time<br />
<strong>the</strong> world price <strong>of</strong> oil goes up 50 percent, PEP dictates that <strong>the</strong> currency appreciates<br />
by 50 percent. Yes, this would stabilize <strong>the</strong> price <strong>of</strong> oil in terms <strong>of</strong> domestic<br />
currency, wages, and nontraded goods; but it would also destabilize <strong>the</strong> prices<br />
<strong>of</strong> o<strong>the</strong>r tradable goods, such as manufactured products. They would have <strong>to</strong> fall<br />
50 percent in terms <strong>of</strong> domestic currency, given that oil shock. Such volatility<br />
would undermine attempts <strong>to</strong> diversify out <strong>of</strong> oil. Even if <strong>the</strong> qualitative argument<br />
is sound, <strong>the</strong> quantitative outcome is excessive.<br />
Over time, I have moderated <strong>the</strong> proposal in response <strong>to</strong> such critiques. One<br />
version arises in <strong>the</strong> context <strong>of</strong> a Persian Gulf oil exporter contemplating diversifying<br />
its peg away from a simple peg <strong>to</strong> <strong>the</strong> dollar. Kuwait, for example, decided in<br />
May 2007 <strong>to</strong> switch from a dollar peg <strong>to</strong> a currency basket. 22 It was reacting <strong>to</strong> a<br />
depreciating dollar and rising inflation. But when <strong>the</strong> price <strong>of</strong> oil rises in terms <strong>of</strong><br />
both dollars and euros, it can still face <strong>the</strong> problem <strong>of</strong> excessive monetary inflows<br />
and overheating. Gulf countries might consider pegging <strong>to</strong> a basket that puts 1/3<br />
weight on <strong>the</strong> dollar, 1/3 on <strong>the</strong> euro, and 1/3 on oil (Frankel, 2003b, 2003c,<br />
2008). That way, when <strong>the</strong> price <strong>of</strong> oil rises or falls 30 percent against major currencies,<br />
<strong>the</strong> dinar au<strong>to</strong>matically rises or falls by 10 percent against major currencies.<br />
22<br />
Like many basket peggers, Kuwait does not reveal what is in <strong>the</strong> basket. But <strong>the</strong> dollar and euro<br />
almost certainly constitute most <strong>of</strong> it.<br />
©International Monetary Fund. Not for Redistribution
186 How Can Commodity Exporters Make Fiscal and Monetary Policy Less Procyclical?<br />
Most countries are not as heavily concentrated in oil exports as <strong>the</strong> Persian Gulf<br />
producers, and even <strong>the</strong> latter wish <strong>to</strong> be more diversified. Accordingly, <strong>the</strong> next<br />
version <strong>of</strong> <strong>the</strong> proposal is <strong>to</strong> set <strong>the</strong> value <strong>of</strong> <strong>the</strong> currency in terms <strong>of</strong> a basket <strong>of</strong><br />
exports. PEPI stands for peg <strong>the</strong> export price index: set <strong>the</strong> value <strong>of</strong> <strong>the</strong> currency by<br />
reference <strong>to</strong> an index <strong>of</strong> prices <strong>of</strong> major exports (Frankel, 2005). For example, <strong>the</strong><br />
index in <strong>the</strong> case <strong>of</strong> South Africa could consist <strong>of</strong> its four leading export commodities:<br />
platinum, gold, iron ore, and coal. In that case, <strong>the</strong> index could be computed<br />
on a weekly basis, or even daily. But <strong>the</strong> spirit <strong>of</strong> diversification suggests computing<br />
as broad an index <strong>of</strong> export prices as possible, including manufactured goods as well<br />
as primary products. In that case, it would only be computed monthly. And <strong>the</strong><br />
central bank would announce a target range—just as with inflation targeting or<br />
PPT—because it is not possible <strong>to</strong> hit such an index precisely, as it is if <strong>the</strong> anchor<br />
is gold or a foreign currency. The intervention vehicle could be ei<strong>the</strong>r foreign<br />
exchange or domestic assets, as with o<strong>the</strong>r anchors.<br />
A simple <strong>the</strong>oretical model in Frankel derives parameter conditions under which<br />
PEPI delivers more stability than an exchange rate target. 23 It also derives parameter<br />
conditions under which PEPI delivers more stability than a CPI target. 24<br />
The Argument for Product Price Targeting Restated<br />
All <strong>the</strong>se versions have in common targeting a price index that puts substantial<br />
weight on <strong>the</strong> export commodity, not on <strong>the</strong> import commodity. One should not<br />
muddy <strong>the</strong> waters with <strong>to</strong>o many proposals. The most practical proposal, again,<br />
is PPT: target a comprehensive index <strong>of</strong> domestically produced goods. The argument<br />
is that PPT is more robust with respect <strong>to</strong> terms-<strong>of</strong>-trade shocks than targeting<br />
ei<strong>the</strong>r <strong>the</strong> CPI or <strong>the</strong> exchange rate.<br />
To illustrate, assume <strong>the</strong> shock <strong>of</strong> a sharp increase in world oil prices. Consider<br />
first <strong>the</strong> situation <strong>of</strong> oil exporters. Under PPT, <strong>the</strong> currency appreciates au<strong>to</strong>matically<br />
(in terms <strong>of</strong> dollars) along with <strong>the</strong> price <strong>of</strong> oil (in terms <strong>of</strong> dollars). To<br />
hit <strong>the</strong> target range may require a slowing in money growth and an increase in<br />
interest rates—fully appropriate when <strong>the</strong>re is danger <strong>of</strong> overheating from a commodity<br />
boom. That is countercyclical monetary policy. Of course, under a freefloating<br />
regime, <strong>the</strong> currency also has a tendency <strong>to</strong> appreciate during an export<br />
boom. But we know that countries need some sort <strong>of</strong> long-term anchor for expectations,<br />
<strong>to</strong> prevent chronic inflation. What is <strong>the</strong> alternative against which <strong>to</strong><br />
23 See Frankel (2010a, Appendix 2). One conclusion is that high variability in export markets makes<br />
it more likely that PEPI dominates a pegged exchange rate. Ano<strong>the</strong>r sufficient (but not necessary)<br />
condition for PEPI <strong>to</strong> dominate an exchange rate target is if <strong>the</strong> traded commodity sec<strong>to</strong>r is larger<br />
than <strong>the</strong> nontraded goods sec<strong>to</strong>r.<br />
24 See Frankel (2010a, Appendix 2). If stabilizing <strong>the</strong> CPI receives <strong>to</strong>p priority in <strong>the</strong> objective function,<br />
<strong>the</strong>n CPI targeting dominates by construction: terms <strong>of</strong> trade and exchange rate shocks hurt<br />
more under <strong>the</strong> PEPI rules than under inflation targeting. But trade shocks destabilize output in <strong>the</strong><br />
nontraded and export sec<strong>to</strong>rs under <strong>the</strong> CPI rule, while PEPI better insulates <strong>the</strong> real economy from<br />
relative price changes. Thus if <strong>the</strong> weight in <strong>the</strong> objective function on stabilizing <strong>the</strong> CPI is small,<br />
relative <strong>to</strong> <strong>the</strong> weight on stabilizing sec<strong>to</strong>ral output, <strong>the</strong>n PEPI dominates.<br />
©International Monetary Fund. Not for Redistribution
Frankel 187<br />
compare PPT? The two leading alternatives are <strong>the</strong> CPI, under inflation targeting,<br />
and <strong>the</strong> exchange rate.<br />
A fixed exchange rate has advantages. But it produces a destabilizing monetary<br />
policy in commodity booms. In response <strong>to</strong> <strong>the</strong> balance <strong>of</strong> payments surplus, <strong>the</strong><br />
central bank must allow reserves <strong>to</strong> flood in<strong>to</strong> <strong>the</strong> country. (Sometimes countries<br />
can sterilize, but this becomes increasingly difficult after a year or two.) The money<br />
supply increases. Easy liquidity boosts private spending. The result is inflation,<br />
particularly in prices <strong>of</strong> nontraded goods and services and sometimes excessive<br />
increases in <strong>the</strong> prices <strong>of</strong> assets (such as real estate) and construction. Think <strong>of</strong> <strong>the</strong><br />
Persian Gulf countries over <strong>the</strong> past decade. This is procyclical monetary policy.<br />
What about CPI targeting? If <strong>the</strong> shock is an increase in <strong>the</strong> world price <strong>of</strong> oil,<br />
and oil constitutes a small share <strong>of</strong> <strong>the</strong> CPI, <strong>the</strong>n <strong>the</strong> outcome in <strong>the</strong>ory is <strong>the</strong><br />
same as an exchange rate target. Although CPI targeting usually goes with floating,<br />
if it follows <strong>the</strong> rule <strong>the</strong> central bank will be obligated <strong>to</strong> resist what would<br />
o<strong>the</strong>rwise be a strong appreciation <strong>of</strong> <strong>the</strong> currency, because that would imply falling<br />
import prices. It must loosen monetary policy enough <strong>to</strong> prevent import<br />
prices from falling, which means enough <strong>to</strong> prevent <strong>the</strong> currency from appreciating.<br />
Thus, we get <strong>the</strong> same procyclical outcome as under a fixed exchange rate:<br />
easy liquidity, rising spending, and perhaps an asset bubble.<br />
The conclusion is that PPT may dominate targeting ei<strong>the</strong>r <strong>the</strong> CPI or<br />
exchange rate, when an oil exporter faces an increase in world oil prices.<br />
Now continue <strong>to</strong> assume that <strong>the</strong> shock is an increase in <strong>the</strong> world price <strong>of</strong> oil,<br />
but consider <strong>the</strong> situation <strong>of</strong> an oil importer. If <strong>the</strong> country is a conventional<br />
inflation targeter and takes seriously <strong>the</strong> rule <strong>to</strong> target <strong>the</strong> CPI, it will have <strong>to</strong><br />
respond <strong>to</strong> a 10 percent increase in <strong>the</strong> dollar oil price by contracting monetary<br />
policy enough <strong>to</strong> appreciate <strong>the</strong> currency 10 percent. Why? O<strong>the</strong>rwise, <strong>the</strong> price<br />
<strong>of</strong> oil will go up in terms <strong>of</strong> domestic currency, and so will <strong>the</strong> CPI. But responding<br />
<strong>to</strong> a worsening in <strong>the</strong> terms <strong>of</strong> trade by appreciating <strong>the</strong> currency is precisely<br />
<strong>the</strong> wrong direction <strong>to</strong> move. It exacerbates <strong>the</strong> adverse shock and worsens <strong>the</strong><br />
possible recession. It is procyclical. PPT, by contrast, has <strong>the</strong> advantage that<br />
because oil does not appear in <strong>the</strong> index <strong>of</strong> that country’s export prices or producer<br />
prices, no monetary contraction or appreciation is required. Thus PPT<br />
avoids <strong>the</strong> procyclicality <strong>of</strong> <strong>the</strong> CPI target.<br />
SUMMARY<br />
Volatility in developing countries arises both from foreign shocks, such as <strong>the</strong><br />
fluctuations in <strong>the</strong> price <strong>of</strong> <strong>the</strong> export commodity, and from domestic macroeconomic<br />
and political instability. Although many developing countries in <strong>the</strong> 1990s<br />
brought under control <strong>the</strong> chronic runaway budget deficits, money creation, and<br />
inflation that <strong>the</strong>y tended <strong>to</strong> experience in <strong>the</strong> preceding two decades, most are<br />
still subject <strong>to</strong> monetary and fiscal policy that is procyclical ra<strong>the</strong>r than countercyclical.<br />
Macroeconomic policies tend <strong>to</strong> be expansionary in booms and contractionary<br />
in recessions, <strong>the</strong>reby exacerbating <strong>the</strong> magnitudes <strong>of</strong> <strong>the</strong> swings. The aim<br />
should instead be <strong>to</strong> moderate <strong>the</strong> swings—<strong>the</strong> countercyclical pattern that <strong>the</strong><br />
©International Monetary Fund. Not for Redistribution
188 How Can Commodity Exporters Make Fiscal and Monetary Policy Less Procyclical?<br />
models and textbooks <strong>of</strong> <strong>the</strong> decades following <strong>the</strong> Great Depression originally<br />
hoped discretionary policy would take.<br />
This chapter has examined <strong>the</strong> pitfalls <strong>of</strong> procyclicality with respect <strong>to</strong> fiscal<br />
policy, first, and monetary policy, second. For each policy area it has proposed a<br />
specific institution or regime that might help deliver more countercyclical results:<br />
emulation <strong>of</strong> Chile’s institutions with respect <strong>to</strong> fiscal policy, and product price<br />
targeting for monetary policy.<br />
The tendency <strong>to</strong> under-save mineral wealth is pronounced during booms.<br />
The temptation <strong>to</strong> spend <strong>the</strong> windfall from high world prices is sometimes<br />
irresistible. When <strong>the</strong> price <strong>of</strong> <strong>the</strong> mineral eventually goes back down, countries<br />
are <strong>of</strong>ten left with high debt, a swollen government sec<strong>to</strong>r and nontradable sec<strong>to</strong>r,<br />
and a hollowed-out nonmineral tradable goods sec<strong>to</strong>r. They may <strong>the</strong>n be<br />
forced <strong>to</strong> cut back on government spending, completing <strong>the</strong> perverse cycle <strong>of</strong><br />
countercyclical saving. The advice <strong>to</strong> save in a boom is standard. And <strong>the</strong>re are<br />
o<strong>the</strong>r examples <strong>of</strong> governments that have had <strong>the</strong> courage <strong>to</strong> take away <strong>the</strong> fiscal<br />
punch bowl. What makes Chile’s institutions particularly worthy <strong>of</strong> study is<br />
that <strong>the</strong>y may constitute a template that o<strong>the</strong>r countries can adopt, a model that<br />
can help even in times and places where <strong>the</strong> political forces <strong>to</strong> follow procyclical<br />
fiscal policy would o<strong>the</strong>rwise be <strong>to</strong>o strong <strong>to</strong> resist.<br />
Specifically, Chile appears <strong>to</strong> have avoided a pattern common elsewhere <strong>of</strong><br />
overly optimistic forecasts from <strong>the</strong> fiscal agency in boom times. Official forecasts,<br />
if not insulated from politics, tend <strong>to</strong> be overly optimistic, and <strong>the</strong> problem<br />
can be worse when <strong>the</strong> government is formally subject <strong>to</strong> a budget rule such as<br />
<strong>the</strong> Stability and Growth Pact. The key innovation that has allowed Chile generally<br />
<strong>to</strong> achieve countercyclical fiscal policy, and in particular <strong>to</strong> run surpluses in<br />
booms, is not just <strong>the</strong> structural budget rule in itself. Ra<strong>the</strong>r, it is that Chile<br />
entrusts <strong>to</strong> panels <strong>of</strong> independent experts <strong>the</strong> responsibility for estimating <strong>the</strong><br />
extent <strong>to</strong> which contemporaneous copper prices and GDP have departed from<br />
<strong>the</strong>ir long-run averages. Even though specifics differ from country <strong>to</strong> country,<br />
<strong>the</strong>re is no reason why a version <strong>of</strong> Chile’s institutions cannot be emulated by<br />
o<strong>the</strong>r commodity-producing developing countries.<br />
Monetary policy sometimes operates procyclically in <strong>the</strong> face <strong>of</strong> terms-<strong>of</strong>-trade<br />
shocks, under ei<strong>the</strong>r <strong>of</strong> two popular regimes: an exchange rate peg or CPI targeting.<br />
Nei<strong>the</strong>r regime entails currency movements that accommodate fluctuations in <strong>the</strong><br />
world price <strong>of</strong> <strong>the</strong> export commodity. Worse, when <strong>the</strong> price <strong>of</strong> <strong>the</strong> imported commodity<br />
rises on world markets, CPI targeting requires an appreciation <strong>of</strong> <strong>the</strong><br />
domestic currency, which is <strong>the</strong> opposite <strong>of</strong> accommodating <strong>the</strong> terms <strong>of</strong> trade.<br />
The new proposals discussed in this chapter are PEPI (peg <strong>the</strong> export price<br />
index) and PPT (product price targeting). Export prices are included in <strong>the</strong> price<br />
index, so <strong>the</strong> currency appreciates during commodity booms and depreciates during<br />
commodity busts. Fur<strong>the</strong>r, <strong>the</strong>re is no pressure <strong>to</strong> appreciate when <strong>the</strong> price<br />
<strong>of</strong> <strong>the</strong> import commodity rises, because it is not in <strong>the</strong> basket. An easy first step<br />
<strong>to</strong>ward exploring <strong>the</strong>se ideas would be for monetary authorities <strong>to</strong> collect, publish,<br />
and moni<strong>to</strong>r product-oriented price indices, ra<strong>the</strong>r than relying exclusively<br />
on any version <strong>of</strong> <strong>the</strong> CPI.<br />
©International Monetary Fund. Not for Redistribution
REFERENCES<br />
Frankel 189<br />
Aizenman, J., and Y. Jinjarak, 2009, “Current Account Patterns and National Real Estate<br />
Markets,” Journal <strong>of</strong> Urban Economics, Vol. 66, No. 2, pp. 75–89 [NBER Working Paper No.<br />
13921].<br />
Alesina, A., F. Campante, and G. Tabellini, 2008, “Why Is Fiscal Policy Often Procyclical?”<br />
Journal <strong>of</strong> <strong>the</strong> European Economic Association, Vol. 6, No. 5 (September), 1006–36.<br />
Alesina, A., R. Hausmann, R. Hommes, and E. Stein, 1999, “Budget Institutions and Fiscal<br />
Performance in Latin America,” Journal <strong>of</strong> Development Economics, Vol. 59, pp. 253–73.<br />
Alesina, A., and R. Perotti, 1995, “The Political Economy <strong>of</strong> Budget Deficits,” IMF Staff Papers,<br />
Vol. 42, No. 1 (March), pp. 1–31.<br />
———, 1996, “Fiscal Discipline and <strong>the</strong> Budget Process,” American Economic Review, Vol. 86,<br />
No. 2, Papers and Proceedings (May), pp. 401–07.<br />
Arezki, R., and M. Brückner, 2010a, “International Commodity Price Shocks, Democracy, and<br />
External Debt,” IMF Working Paper 10/53 (Washing<strong>to</strong>n: International Monetary Fund).<br />
———, 2010b, “Resource Windfalls and Emerging Market Sovereign Bond Spreads: The Role<br />
<strong>of</strong> Political Institutions,” IMF Working Paper No. 10/179 (Washing<strong>to</strong>n: International<br />
Monetary Fund).<br />
Arezki, R., and K. Ismail, 2010, “Boom-Bust Cycle, Asymmetrical Fiscal Response and <strong>the</strong><br />
Dutch Disease,” IMF Working Paper No. 10/94 (Washing<strong>to</strong>n: International Monetary<br />
Fund).<br />
Broda, C., 2004, “Terms <strong>of</strong> Trade and Exchange Rate Regimes in Developing Countries,”<br />
Journal <strong>of</strong> International Economics, Vol. 63, No. 1, pp. 31–58.<br />
Buchanan, J., 1967, Public Finance in Democratic Process: Fiscal Institutions and Individual<br />
Choice (Chapel Hill: University <strong>of</strong> North Carolina Press).<br />
Calderón, C., and K. Schmidt-Hebbel, 2003, “Macroeconomic <strong>Policies</strong> and Performance<br />
in Latin America,” Journal <strong>of</strong> International Money and Finance, Vol. 22, No. 7 (December),<br />
pp. 895–923.<br />
Chen, Y.-C., and K. Rog<strong>of</strong>f, 2003, “Commodity Currencies,” Journal <strong>of</strong> International Economics,<br />
Vol. 60, No. 1 (May), pp. 133–60.<br />
Cudding<strong>to</strong>n, J., 1989, “Commodity Export Booms in Developing Countries,” World Bank<br />
Research Observer, Vol. 4, pp. 143–65.<br />
Davis, J., R. Ossowski, J. Daniel, and S. Barnett, 2001, “Oil Funds: Problems Posing as<br />
Solutions?” Finance and Development, Vol. 38, No. 4 (Washing<strong>to</strong>n: International Monetary<br />
Fund). http://www.imf.org/external/pubs/ft/fandd/2001/12/davis.htm<br />
———, 2003, “Stabilization and Savings Funds for Nonrenewable <strong>Resources</strong>: Experience and<br />
Fiscal Policy Implications,” in Fiscal Policy Formulation and Implementation in Oil-Producing<br />
Countries, ed. by J. Davis, R. Ossowski, and A. Fedelino (Washing<strong>to</strong>n: International Monetary<br />
Fund). [First published in 2001 as IMF Occasional Paper No. 205.]<br />
Debelle, G., 2001, “The Case for Inflation Targeting in East Asian Countries,” in Future<br />
Directions for Monetary <strong>Policies</strong> in East Asia, ed. by D. Gruen and J. Simon (Sydney: Reserve<br />
Bank <strong>of</strong> Australia).<br />
Edwards, S., and E.L. Yeyati, 2005, “Flexible Exchange Rates as Shock Absorbers,” European<br />
Economic Review, Vol. 49, No. 8 (November), pp. 2079–2105.<br />
Engel, E., C. Neilson, and R. Valdés, 2009, “Fiscal Rules as Social Policy,” Presentation made at<br />
<strong>the</strong> World Bank workshop, “Myths and Realities <strong>of</strong> Commodity Dependence: Policy<br />
Challenges and Opportunities for Latin America and <strong>the</strong> Caribbean,” Washing<strong>to</strong>n, DC,<br />
World Bank, September 17–18.<br />
Fraga, A., I. Goldfajn, and A. Minella, 2003, “Inflation Targeting in Emerging Market<br />
Economies,” in NBER Macro Annual 2003, ed. by K. Rog<strong>of</strong>f and M. Gertler (Cambridge:<br />
MIT Press).<br />
Frankel, J., 2002, “Should Gold-Exporters Peg Their Currencies <strong>to</strong> Gold?” Research Study No.<br />
29 (London: World Gold Council).<br />
©International Monetary Fund. Not for Redistribution
190 How Can Commodity Exporters Make Fiscal and Monetary Policy Less Procyclical?<br />
———, 2003a, “A Proposed Monetary Regime for Small Commodity-Exporters: Peg <strong>the</strong><br />
Export Price (‘PEP’),” International Finance, Vol. 6, No. 1 (Spring), pp. 61–88.<br />
———, 2003b, “A Crude Peg for <strong>the</strong> Iraqi Dinar,” Financial Times, June 13.<br />
———, 2003c, “Iraq’s Currency Solution? Tie <strong>the</strong> Dinar <strong>to</strong> Oil,” The International Economy,<br />
Fall.<br />
———, 2005, “Peg <strong>the</strong> Export Price Index: A Proposed Monetary Regime for Small Countries,”<br />
Journal <strong>of</strong> Policy Modeling, Vol. 27, No.4 (June).<br />
———, 2007, “On <strong>the</strong> Rand: Determinants <strong>of</strong> <strong>the</strong> South African Exchange Rate,” South<br />
African Journal <strong>of</strong> Economics, Vol.75, No.3 (September), pp. 425–41.<br />
———, 2008, “UAE and O<strong>the</strong>r Gulf Countries Urged <strong>to</strong> Switch Currency Peg from <strong>the</strong> Dollar<br />
<strong>to</strong> a Basket That Includes Oil,” Vox, Vol. 9 (July).<br />
———, 2010a, “A Comparison <strong>of</strong> Monetary Anchor Options, Including Product Price<br />
Targeting, for Commodity-Exporters in Latin America,” NBER Working Paper No. 16362<br />
(Cambridge: National Bureau <strong>of</strong> Economic Research).<br />
———, 2010b, “The <strong>Natural</strong> Resource Curse: A Survey,” NBER Working Paper No. 15836<br />
(Cambridge: National Bureau <strong>of</strong> Economic Research) (also <strong>to</strong> be published in Export Perils,<br />
ed. by B. Shaffer [Philadelphia: University <strong>of</strong> Pennsylvania Press, forthcoming]).<br />
———, 2011, “A Solution <strong>to</strong> Fiscal Procyclicality: The Structural Budget Institutions<br />
Pioneered by Chile,” NBER Working Paper No. 16945 (Cambridge: National Bureau <strong>of</strong><br />
Economic Research).<br />
Frankel, J., and A. Saiki, 2002, “A Proposal <strong>to</strong> Anchor Monetary Policy by <strong>the</strong> Price <strong>of</strong> <strong>the</strong><br />
Export Commodity,” Journal <strong>of</strong> Economic Integration, Vol. 17, No. 3, pp. 417–48.<br />
Frankel, J., B. Smit, and F. Sturzenegger, 2008, “Fiscal and Monetary Policy in a Commodity<br />
Based Economy,” Economics <strong>of</strong> Transition, Vol. 16, No. 4, pp. 679–713.<br />
Gavin, M., R. Hausmann, and L. Leiderman, 1996, “Macroeconomics <strong>of</strong> Capital Flows <strong>to</strong><br />
Latin America: Experience and Policy Issues,” Research Department Working Paper No. 4012<br />
(Washing<strong>to</strong>n: Inter-American Development Bank).<br />
Gavin, M., R. Hausmann, R. Perotti, and E. Talvi, 1997, “Managing Fiscal Policy in Latin<br />
America and <strong>the</strong> Caribbean: Volatility, Procyclicality, and Limited Creditworthiness,” Revista<br />
del Banco Central de Venezuela, Vol. 11.<br />
Gavin, M., and R. Perotti, 1997, “Fiscal Policy in Latin America,” NBER Macroeconomics<br />
Annual, Vol. 12, pp. 11–61.<br />
Gelb, A., 1986, “Adjustment <strong>to</strong> Windfall Gains: A Comparative Analysis <strong>of</strong> Oil-Exporting<br />
Countries,” in <strong>Natural</strong> <strong>Resources</strong> and <strong>the</strong> Macroeconomy, ed. by J.P. Neary and V.S. Wijnbergen<br />
(Cambridge: MIT Press), pp. 54–93.<br />
Gylfason, T., T.T. Herbertsson, and G. Zoega, 1999, “A Mixed Blessing: <strong>Natural</strong> <strong>Resources</strong> and<br />
Economic Growth,” Macroeconomic Dynamics, Vol. 3, pp. 204–25.<br />
Hall, R., 1985, “Monetary Policy with an Elastic Price Standard,” in Price Stability and Public<br />
Policy (Kansas City: Federal Reserve Bank <strong>of</strong> Kansas City).<br />
Ilzetski, E., and C. Vegh, 2008, “Procyclical Fiscal Policy in Developing Countries: Truth or<br />
Fiction?” NBER Working Paper No. 14191 (Cambridge: National Bureau <strong>of</strong> Economic<br />
Research).<br />
Kaminsky, G., C. Reinhart, and C. Vegh, 2005, “When It Rains, It Pours: Procyclical Capital<br />
Flows and Macroeconomic <strong>Policies</strong>,” NBER Macroeconomics Annual 2004, Vol. 19, pp.<br />
11–82.<br />
Keynes, J.M., 1938, “The Policy <strong>of</strong> Government S<strong>to</strong>rage <strong>of</strong> Foodstuffs and Raw Materials,”<br />
Economic Journal (September).<br />
Larrain, F., and F. Parro, 2006, “Chile Menos Volatil” (Santiago: Central Bank <strong>of</strong> Chile), May.<br />
Lax<strong>to</strong>n, D., and P. Pesenti, 2003, “Monetary Rules for Small, Open, Emerging Economies,”<br />
NBER Working Paper No. 9568 (Cambridge: National Bureau <strong>of</strong> Economic Research).<br />
Loayza, N., and R. So<strong>to</strong>, eds., 2002, Inflation Targeting: Design, Performance, Challenges<br />
(Santiago: Central Bank <strong>of</strong> Chile).<br />
Madrid-Aris, M., and M. Villena, 2005, “The Commoditization <strong>of</strong> <strong>the</strong> Chilean Economy:<br />
Some Stylized Facts About Its Economy,” Universidad Santa Maria, Chile.<br />
©International Monetary Fund. Not for Redistribution
Frankel 191<br />
Manzano, O., and R. Rigobon, 2008, “Resource Curse or Debt Overhang,” Economia, Vol. 9,<br />
No. 1 (Fall).<br />
Marcel, M., M. Tokman, R. Valdés, and P. Benavides, 2001, “Structural Budget Balance:<br />
Methodology and Estimation for <strong>the</strong> Chilean Central Government 1987–2001,” Series <strong>of</strong><br />
Studies on Public Finance (Santiago: Ministry <strong>of</strong> Finance, Chile), available at http://www.<br />
dipres.cl/572/propertyvalue-15408.html.<br />
Matsen, E., and R. Torvik, 2005, “Optimal Dutch Disease,” Journal <strong>of</strong> Development Economics,<br />
Vol. 78, No. 2.<br />
Matsuyama, K., 1992, “Agricultural Productivity, Comparative Advantage, and Economic<br />
Growth,” Journal <strong>of</strong> Economic Theory, Vol. 58 (December), pp. 317–34.<br />
McKibbin, W., and K. Singh, 2000, “Issues in <strong>the</strong> Choice <strong>of</strong> a Monetary Regime for India,”<br />
Australian National University, May.<br />
Medina, J.-P., and C. So<strong>to</strong>, 2007, “Copper Price, Fiscal Policy and Business Cycle in Chile,”<br />
Working Paper No. 458 (Santiago: Banco Central de Chile [Central Bank <strong>of</strong> Chile]).<br />
Meade, J., 1978, “The Meaning <strong>of</strong> Internal Balance,” Economic Journal, Vol. 91, pp. 423–35.<br />
Medas, P., and D. Zakharova, 2009, “Primer on Fiscal Analysis in Oil-Producing Countries,”<br />
IMF Working Paper 56 (Washing<strong>to</strong>n: International Monetary Fund).<br />
Mendoza, E.G., and P.M. Oviedo, 2006, “Fiscal Policy and Macroeconomic Uncertainty in<br />
Developing Countries: The Tale <strong>of</strong> <strong>the</strong> Tormented Insurer,” NBER Working Paper No.<br />
12586 (Cambridge: National Bureau <strong>of</strong> Economic Research).<br />
Mendoza, E., and M. Terrones, 2008, “An Ana<strong>to</strong>my <strong>of</strong> Credit Booms: Evidence from Macro<br />
Aggregates and Micro Data,” NBER Working Paper No. 14049 (Cambridge: National<br />
Bureau <strong>of</strong> Economic Research).<br />
Mishkin, F., 2000, “Inflation Targeting in Emerging-Market Countries,” American Economic<br />
Review, Vol. 90, No. 2, pp. 105–09, AEA Papers and Proceedings.<br />
———, 2008, “Can Inflation Targeting Work in Emerging Market Countries?” in Money,<br />
Crises, and Transition: Essays in Honor <strong>of</strong> Guillermo Calvo, ed. by C. Reinhart, C. Vegh, and<br />
A. Velasco (Cambridge: MIT Press) pp. 71–94. (Previously published as NBER Working<br />
Paper No. 10646 [Cambridge: National Bureau <strong>of</strong> Economic Research]).<br />
Neut, A., and A. Velasco, 2003, “Tough <strong>Policies</strong>, Incredible <strong>Policies</strong>?” NBER Working Paper<br />
No. 9932 (Cambridge: National Bureau <strong>of</strong> Economic Research).<br />
Ossowski, R., M. Villafuerte, P. Medas, and T. Thomas, 2008, “Managing <strong>the</strong> Oil Revenue<br />
Boom: The Role <strong>of</strong> Fiscal Institutions,” IMF Occasional Paper No. 260 (Washing<strong>to</strong>n:<br />
International Monetary Fund).<br />
Perry, G., 2003, “Can Fiscal Rules Help Reduce Macroeconomic Volatility in <strong>the</strong> Latin America<br />
and Caribbean Region?” World Bank Policy Research Working Paper No. 3080 (Washing<strong>to</strong>n:<br />
World Bank).<br />
———, 2009, “Beyond Lending: How Multilateral Banks Can Help Developing Countries<br />
Manage Volatility” (Washing<strong>to</strong>n: Center for Global Development).<br />
Persson, T., and G. Tabellini, 2004, “Constitutional Rules and Fiscal Policy Outcomes,”<br />
American Economic Review, Vol. 94, No. 1 (March), pp. 25-45.<br />
Poterba, J., 1997, “Do Budget Rules Work?” in Fiscal Policy: Lessons From Empirical Research,<br />
ed. by A. Auerbach (Cambridge: MIT Press), pp. 53–86.<br />
Poterba, J., and J. von Hagen, 1999, eds., Fiscal Institutions and Fiscal Performance (Chicago:<br />
University <strong>of</strong> Chicago Press).<br />
Prasad, E., K. Rog<strong>of</strong>f, S.-J. Wei, and M.A. Kose, 2006, “Effects <strong>of</strong> Financial Globalization on<br />
Developing Countries: Some Empirical Evidence,” in Globalization and Poverty, ed. by A.<br />
Harrison (Chicago: University <strong>of</strong> Chicago Press).<br />
Reinhart, C., and V. Reinhart, 2009, “Capital Flow Bonanzas: An Encompassing View <strong>of</strong> <strong>the</strong><br />
Past and Present,” in J. Frankel and C. Pissarides, eds., NBER International Seminar in<br />
Macroeconomics 2008 (University <strong>of</strong> Chicago Press: Chicago).<br />
Rodriguez Cabello, J., C. Tokman Ramos, and A. Vega Carvallo, 2007, “Structural Balance<br />
Policy in Chile,” Studies in Public Finance No. 7 (Santiago: Ministry <strong>of</strong> Finance, Government<br />
<strong>of</strong> Chile).<br />
©International Monetary Fund. Not for Redistribution
192 How Can Commodity Exporters Make Fiscal and Monetary Policy Less Procyclical?<br />
Talvi, E., and C. Vegh, 2005, “Tax Base Variability and Procyclicality <strong>of</strong> Fiscal Policy,” Journal<br />
<strong>of</strong> Development Economics, Vol. 78, No. 1, pp. 156–90.<br />
Tornell, A., and P. Lane, 1999, “The Voracity Effect,” American Economic Review, Vol. 89, No.<br />
1 (March), pp. 22–46.<br />
Torvik, R., 2001, “Learning by Doing and <strong>the</strong> Dutch Disease,” European Economic Review, Vol.<br />
45, pp. 285–306.<br />
Van Wijnbergen, S., 1984, “The ’Dutch Disease’: A Disease After All?” Economic Journal, Vol.<br />
94, pp. 41–55.<br />
Von Hagen, J., and I. Harden, 1995, “Budget Processes and Commitment <strong>to</strong> Fiscal Discipline,”<br />
European Economic Review, Vol. 39, Nos. 3–4 (April), pp. 771–79.<br />
Villafuerte, M., P. Lopez Murphy, and R. Ossowski, 2010, “Riding <strong>the</strong> Roller Coaster: Fiscal<br />
<strong>Policies</strong> <strong>of</strong> Nonrenewable Resource Exporters in Latin America and <strong>the</strong> Caribbean,” IMF<br />
Working Paper 10/251 (Washing<strong>to</strong>n: International Monetary Fund).<br />
Wyplosz, C., 2005, “Fiscal Policy: Institutions versus Rules,” National Institute Economic Review,<br />
Journal <strong>of</strong> <strong>the</strong> National Institute <strong>of</strong> Economic and Social Research, No 191, January, pp.<br />
64–78.<br />
©International Monetary Fund. Not for Redistribution
CHAPTER 11<br />
<strong>Natural</strong> <strong>Resources</strong> Management<br />
and Financial Stability: Evidence<br />
from Algeria<br />
MOHAMMED LAKSACI<br />
INTRODUCTION<br />
After two decades <strong>of</strong> investment efforts financed primarily through external debt<br />
and domestic bank loans, Algerian economic development has remained dependent<br />
on hydrocarbon resources. As a result <strong>of</strong> “managed” resource allocation and<br />
petroleum price volatility, <strong>the</strong> economy registered persistent financial instability<br />
through <strong>the</strong> first half <strong>of</strong> <strong>the</strong> 1990s, despite <strong>the</strong> stabilization and adjustment programs<br />
and related exceptional financing arrangements. The Algerian economy<br />
remained highly vulnerable <strong>to</strong> external shocks until <strong>the</strong> beginning <strong>of</strong> <strong>the</strong> 2000s—<br />
a period characterized by res<strong>to</strong>red macroeconomic equilibrium.<br />
Prudent macr<strong>of</strong>inancial policymaking and steering during <strong>the</strong> 2000s, based on<br />
more effective management and allocation <strong>of</strong> <strong>the</strong> resources generated by <strong>the</strong><br />
hydrocarbons sec<strong>to</strong>r, have paved <strong>the</strong> way for macr<strong>of</strong>inancial stability. Substantial<br />
public investment efforts during <strong>the</strong> past decade, supported by a new financing<br />
scheme registering surplus savings over investment, have been accompanied by<br />
financial stability and resilience against external shocks. The stability <strong>of</strong> Algeria’s<br />
banking system was decidedly confirmed during 2008–09, and in 2010 <strong>the</strong> legal<br />
framework for financial stability was streng<strong>the</strong>ned.<br />
The next section <strong>of</strong> this chapter discusses <strong>the</strong> lengthy process <strong>of</strong> financial<br />
instability that led, during <strong>the</strong> late 1980s and early 1990s, <strong>to</strong> serious domestic and<br />
external financial disequilibrium. After a brief analysis <strong>of</strong> <strong>the</strong> period <strong>of</strong> drastic<br />
economic and financial recovery, <strong>the</strong> chapter focuses on <strong>the</strong> framework for financial<br />
stability gradually and resolutely developed during <strong>the</strong> 2000s. The emphasis<br />
in this chapter is primarily on <strong>the</strong> management and allocation <strong>of</strong> <strong>the</strong> financial<br />
resources generated by <strong>the</strong> hydrocarbon sec<strong>to</strong>r.<br />
Mohammed Laksaci is governor <strong>of</strong> <strong>the</strong> Bank <strong>of</strong> Algeria. This chapter is based on <strong>the</strong> author’s presentation<br />
at “<strong>Natural</strong> <strong>Resources</strong>, Finance, and Development: Confronting Old and New Challenges,”<br />
a high-level seminar organized by <strong>the</strong> Bank <strong>of</strong> Algeria and <strong>the</strong> IMF Institute, which <strong>to</strong>ok place in<br />
Algiers, on November 4 and 5, 2010. The author can be contacted at loudini@bank-<strong>of</strong>-algeria.dz.<br />
©International Monetary Fund. Not for Redistribution<br />
193
194 <strong>Natural</strong> <strong>Resources</strong> Management and Financial Stability: Evidence from Algeria<br />
EXTERNAL SHOCKS AND FINANCIAL INSTABILITY<br />
<strong>Natural</strong> resources, substantially hydrocarbons, have played and continue <strong>to</strong> play<br />
a vital role in <strong>the</strong> Algerian economy, since <strong>the</strong> revenue generated by <strong>the</strong> exploitation<br />
<strong>of</strong> <strong>the</strong>se resources constitutes <strong>the</strong> bulk <strong>of</strong> <strong>the</strong> country’s export revenue and a<br />
substantial share <strong>of</strong> its budget revenue. Accordingly, <strong>the</strong> mechanism for managing<br />
and allocating such resources is a decisive fac<strong>to</strong>r in Algerian economic trends and<br />
development.<br />
During <strong>the</strong> 1970s, most export revenue from hydrocarbons was used <strong>to</strong> cover<br />
<strong>the</strong> substantial import component <strong>of</strong> massive public investment and end consumption,<br />
in a context <strong>of</strong> major monetary and budget expansion, managed<br />
domestic prices, and insufficient stringency in <strong>the</strong> choices and management <strong>of</strong><br />
public investment projects. Careless resource allocation and management, which<br />
was widespread until <strong>the</strong> mid-1980s, promoted <strong>the</strong> emergence <strong>of</strong> latent domestic<br />
imbalances and increased economic dependence on hydrocarbon exports. Heavily<br />
dependent on hydrocarbon resources, <strong>the</strong> Algerian economy registered a lengthy<br />
period <strong>of</strong> financial instability following <strong>the</strong> external shock <strong>of</strong> 1986, which accentuated<br />
<strong>the</strong> investment-saving imbalance.<br />
The decline in hydrocarbon exports (–39 percent) in 1986, following a 46<br />
percent drop in petroleum prices in a situation <strong>of</strong> high import propensity, began<br />
that year <strong>to</strong> generate an external current account balance <strong>of</strong> payments deficit. This<br />
deficit severely eroded <strong>the</strong> country’s foreign exchange reserves (US$0.72 billion<br />
at end-1990, as compared with US$2.5 billion at end-1985), despite increased<br />
recourse <strong>to</strong> domestic debt. In this context, outstanding external debt reached <strong>the</strong><br />
excessive level <strong>of</strong> US$26.1 billion at end-1989, as against approximately US$17<br />
billion at end-1985, with a substantial share <strong>of</strong> short-term maturities. As a result,<br />
<strong>the</strong> external debt service-<strong>to</strong>-export ratio shot up <strong>to</strong> 80 percent in 1988, as compared<br />
with 35 percent in 1985.<br />
This drastic deterioration in external debt indica<strong>to</strong>rs continued until <strong>the</strong> end<br />
<strong>of</strong> 1993, despite exceptional external financing contributions in <strong>the</strong> form <strong>of</strong><br />
balance-<strong>of</strong>-payments support from <strong>the</strong> International Monetary Fund (IMF) (<strong>the</strong><br />
1991 stand-by arrangement) and <strong>the</strong> World Bank (public enterprise and financial<br />
sec<strong>to</strong>r restructuring program) and <strong>the</strong> program <strong>to</strong> restructure some <strong>of</strong> <strong>the</strong> country’s<br />
external debt.<br />
During <strong>the</strong> first quarter <strong>of</strong> 1994, Algeria’s vulnerable external financial position<br />
peaked when its external debt-service ratio rose <strong>to</strong> 100 percent, while hydrocarbon<br />
prices underwent ano<strong>the</strong>r downward shock and <strong>the</strong> country’s foreign<br />
exchange reserves representing only 1.3 months’ worth <strong>of</strong> imports.<br />
With <strong>the</strong> backing <strong>of</strong> stabilization and structural adjustment programs (IMF and<br />
World Bank) staggered over four consecutive years (1994–98), external debt<br />
rescheduling, which had become inevitable, made it possible for Algeria <strong>to</strong> reduce<br />
its external financing constraints substantially. However, outstanding medium- and<br />
long-term external debt increased <strong>to</strong> US$33.2 billion by <strong>the</strong> end <strong>of</strong> 1996 (which<br />
equaled 71 percent <strong>of</strong> GDP), as compared with US$26.1 billion at <strong>the</strong> end <strong>of</strong> 1989<br />
(47 percent <strong>of</strong> GDP), as a result <strong>of</strong> <strong>the</strong> external debt service payment deferrals.<br />
©International Monetary Fund. Not for Redistribution
Laksaci 195<br />
Algeria’s substantial external financial instability resulting from <strong>the</strong> 1986<br />
shock led <strong>to</strong> accentuated fiscal imbalances. Petroleum tax revenue dropped by<br />
nearly 50 percent in 1986, although <strong>the</strong> rate <strong>of</strong> government expenditure<br />
remained constant. As a result, <strong>the</strong> overall budget deficit reached record levels<br />
in 1986 and again in 1988 (13 percent and 13.7 percent, respectively, as a share<br />
<strong>of</strong> GDP), financed substantially through monetary creation. Expansionary<br />
monetary policy was also fed by substantially au<strong>to</strong>matic central bank refinancing<br />
<strong>of</strong> medium-term bank loans used <strong>to</strong> finance investments planned during <strong>the</strong><br />
1970s and 1980s in a situation <strong>of</strong> structurally insufficient domestic savings.<br />
Until <strong>the</strong> beginning <strong>of</strong> <strong>the</strong> monetary reform <strong>of</strong> <strong>the</strong> 1990s, financial stability was<br />
undermined by highly accommodating monetary policy and <strong>the</strong> passive role<br />
played by <strong>the</strong> central bank.<br />
The macroeconomic policy shortcomings were so persistent that, despite <strong>the</strong><br />
1991 adjustment program (stand-by arrangement), <strong>the</strong> overall budget deficit widened<br />
once again <strong>to</strong> nearly 8.5 percent <strong>of</strong> GDP in 1993, while fiscal vulnerability <strong>to</strong><br />
hydrocarbon price volatility was substantial. Moreover, financial instability was<br />
ignored, despite <strong>the</strong> build-up <strong>of</strong> nonperforming public enterprise bank loans and<br />
<strong>the</strong> persistence in saving-investment imbalances. As a result, <strong>the</strong> vulnerabilities<br />
accumulated, particularly in <strong>the</strong> public enterprise and banking sec<strong>to</strong>rs which, at <strong>the</strong><br />
same time, also faced <strong>the</strong> repercussions <strong>of</strong> <strong>the</strong> 1991 exchange rate adjustment.<br />
In addition, <strong>the</strong> first year <strong>of</strong> <strong>the</strong> adjustment programs, which ran from 1994<br />
<strong>to</strong> 1998, was characterized by a deep devaluation <strong>of</strong> <strong>the</strong> dinar (in April 1994)<br />
followed by successive exchange rate adjustments reflecting trends in <strong>the</strong> economic<br />
fundamentals. At <strong>the</strong> same time, a substantial price liberalization was<br />
applied. As a result, previously repressed inflation surged <strong>to</strong> 29 percent and <strong>the</strong>n<br />
30 percent in 1994 and 1995, respectively.<br />
Fiscal rehabilitation in 1994–95 led <strong>to</strong> an overall budget surplus in 1996 and<br />
1997, supported by <strong>the</strong> exchange rate adjustment and contraction in <strong>the</strong> ratio <strong>of</strong><br />
capital expenditure <strong>to</strong> GDP (7.3 percent in 1997 as against 10.1 percent in<br />
1989). Simultaneously, <strong>the</strong> financial rehabilitation <strong>of</strong> public enterprises<br />
continued, in which nonperforming bank loans were bought back, primarily in<br />
connection with <strong>the</strong> bank-enterprise mechanism. In fact, as a result <strong>of</strong> <strong>the</strong> public<br />
enterprise restructuring and public bank rehabilitation program in <strong>the</strong> early<br />
1990s, <strong>the</strong> scope <strong>of</strong> efforts <strong>to</strong> restructure <strong>the</strong>se banks’ nonperforming claims<br />
broadened during <strong>the</strong> latter half <strong>of</strong> <strong>the</strong> decade, supported in particular by a monetization<br />
<strong>of</strong> <strong>the</strong> rescheduling resources. This approach helped reduce liquidity<br />
problems for some <strong>of</strong> <strong>the</strong>se public banks.<br />
Despite <strong>the</strong>se major adjustment efforts, <strong>the</strong> Algerian economy’s vulnerability<br />
<strong>to</strong> external shocks remained severe. In fact, <strong>the</strong> impact <strong>of</strong> <strong>the</strong> 1998 drop in hydrocarbon<br />
prices led <strong>to</strong> an overall balance <strong>of</strong> payments deficit <strong>of</strong> US$1.7 billion and<br />
US$2.4 billion in 1998 and 1999, respectively, once again eroding <strong>the</strong> country’s<br />
foreign exchange reserves, which declined from US$8 billion at <strong>the</strong> end <strong>of</strong> 1997<br />
<strong>to</strong> US$4.4 billion at <strong>the</strong> end <strong>of</strong> 1999.<br />
At <strong>the</strong> same time, 1998 was marked by <strong>the</strong> return <strong>of</strong> fiscal disequilibrium.<br />
After an overall budget surplus in 1996 and 1997, 1998 showed a deficit <strong>of</strong> 3.8<br />
©International Monetary Fund. Not for Redistribution
196 <strong>Natural</strong> <strong>Resources</strong> Management and Financial Stability: Evidence from Algeria<br />
percent <strong>of</strong> GDP, despite a sustained capital expenditure-<strong>to</strong>-GDP ratio <strong>of</strong> 7.5<br />
percent. Rigorous measures <strong>to</strong> balance <strong>the</strong> public accounts (such as not using part<br />
<strong>of</strong> <strong>the</strong> capital budget) and <strong>the</strong> necessary exchange rate adjustment led <strong>to</strong> a balanced<br />
budget in 1999.<br />
ADOPTION OF PRUDENT MACROECONOMIC<br />
MANAGEMENT FOR INCREASED RESOURCES<br />
Macroeconomic equilibrium was res<strong>to</strong>red in 2000. It was followed by <strong>the</strong> emergence<br />
<strong>of</strong> surplus savings over investment, which became characteristic <strong>of</strong> <strong>the</strong><br />
Algerian economy during <strong>the</strong> period 2001–08, and was supported by a substantial<br />
improvement in <strong>the</strong> terms <strong>of</strong> trade as a result <strong>of</strong> <strong>the</strong> increase in hydrocarbon<br />
prices on <strong>the</strong> international markets.<br />
The surplus savings over investment increased in relation <strong>to</strong> GDP, peaking at<br />
24.7 percent in 2006, as against 16.3 percent in 2000. In absolute value, this<br />
surplus savings peaked at US$34.45 billion in 2008, in <strong>the</strong> midst <strong>of</strong> <strong>the</strong> international<br />
financial crisis. Although <strong>the</strong> 2009 drop in hydrocarbon prices led <strong>to</strong> a<br />
sharp contraction in hydrocarbon export revenue and <strong>the</strong> first budget deficit in<br />
a decade, <strong>the</strong> country’s sound financial position, due <strong>to</strong> <strong>the</strong> prudent macroeconomic<br />
management <strong>of</strong> its increased hydrocarbon revenues, helped consolidate <strong>the</strong><br />
Algerian economy’s resilience against external shocks.<br />
In 2000, <strong>the</strong> government instituted a new rule on budget savings by establishing<br />
<strong>the</strong> revenue regulation fund (Fonds de régulation des recettes—FRR), a stabilization<br />
fund in dinars and liquid assets designed <strong>to</strong> absorb any increase in<br />
petroleum tax revenue above a benchmark price <strong>of</strong> US$19 per barrel. The same<br />
year, <strong>the</strong> overall budget surplus amounted <strong>to</strong> 9.7 percent <strong>of</strong> GDP, consolidating a<br />
sustained accumulation <strong>of</strong> financial savings for <strong>the</strong> government in order <strong>to</strong> preserve<br />
medium-term fiscal sustainability. <strong>Resources</strong> accumulated in <strong>the</strong> FRR<br />
increased sharply during <strong>the</strong> period 2001–08, with crude oil prices exceeding <strong>the</strong><br />
benchmark price despite <strong>the</strong>ir adjustment <strong>to</strong> US$37 per barrel in 2008.<br />
This prudent budget stance provided essential support for <strong>the</strong> economic recovery,<br />
which began in 2001 with <strong>the</strong> implementation <strong>of</strong> a series <strong>of</strong> substantial<br />
public investment programs (2001–04, 2005–09, and 2010–14) that had a considerable<br />
infrastructure component. Despite <strong>the</strong> relatively significant level <strong>of</strong><br />
resources absorbed in implementing <strong>the</strong>se programs, funds accumulated in <strong>the</strong><br />
FRR increased from 5.6 percent <strong>of</strong> GDP in 2000 <strong>to</strong> 24.4 percent in 2005 and <strong>to</strong><br />
43.1 percent in 2009. This s<strong>to</strong>ck <strong>of</strong> financial savings is deposited with <strong>the</strong> Bank<br />
<strong>of</strong> Algeria in a separate dinar account from <strong>the</strong> treasury current account and is<br />
subject <strong>to</strong> special moni<strong>to</strong>ring. It is a sterilization mechanism that supports monetary<br />
and financial stability. This was particularly clear in 2009 when domestic<br />
public debt represented only 8.1 percent <strong>of</strong> GDP.<br />
From <strong>the</strong> standpoint <strong>of</strong> <strong>the</strong> necessary synergies between fiscal and monetary<br />
policies, <strong>the</strong> Bank <strong>of</strong> Algeria reviewed <strong>the</strong> framework for <strong>the</strong> latter beginning in<br />
April 2002 <strong>to</strong> absorb <strong>the</strong> surplus liquidity that appeared on <strong>the</strong> money market<br />
©International Monetary Fund. Not for Redistribution
Laksaci 197<br />
during <strong>the</strong> early months <strong>of</strong> that year. This constituted a departure from <strong>the</strong><br />
lengthy period <strong>of</strong> bank refinancing requirements. It has ensured that since 2002,<br />
excess liquidity has been effectively mopped up through a flexible, orderly conduit<br />
<strong>of</strong> indirect monetary policy instruments, such as liquidity absorption mechanisms<br />
(market instruments), <strong>the</strong> marginal deposit facility, and <strong>the</strong> reserve requirement<br />
(non-market instruments). This regula<strong>to</strong>ry monetary policy framework was<br />
streng<strong>the</strong>ned in 2009 <strong>to</strong> consolidate <strong>the</strong> policy’s contribution <strong>to</strong> financial stability.<br />
Moreover, this financial stability, and <strong>the</strong>refore <strong>the</strong> economy’s resilience <strong>to</strong><br />
external shocks, were both streng<strong>the</strong>ned by <strong>the</strong> allocation <strong>of</strong> some <strong>of</strong> <strong>the</strong> accumulated<br />
budget savings <strong>to</strong> substantially reducing external public debt and <strong>to</strong> external<br />
debt relief for enterprises with financing capacities, primarily in <strong>the</strong> hydrocarbon<br />
sec<strong>to</strong>r.<br />
All things considered, <strong>the</strong> conduct <strong>of</strong> prudent macr<strong>of</strong>inancial policies based on<br />
more effective management and allocation <strong>of</strong> hydrocarbon resources during <strong>the</strong><br />
2000s broadly contributed <strong>to</strong> Algeria’s robust economic and financial performance,<br />
judging in particular from <strong>the</strong> following indica<strong>to</strong>rs:<br />
• Sustained non-hydrocarbon growth reaching <strong>the</strong> level <strong>of</strong> 9.3 percent in<br />
2009, after levels in <strong>the</strong> range <strong>of</strong> 5 <strong>to</strong> 6.3 percent during <strong>the</strong> entire period<br />
2002–08, indicative <strong>of</strong> <strong>the</strong> substantial contribution from public investment<br />
programs <strong>to</strong> this growth;<br />
• Controlled inflation, even in 2008, a year <strong>of</strong> sharp increases in world food<br />
and inputs prices;<br />
• Consecutive balance <strong>of</strong> payments surpluses, leading <strong>to</strong> a sustained accumulation<br />
<strong>of</strong> foreign exchange reserves (36 months <strong>of</strong> goods and services<br />
imports), despite <strong>the</strong> substantial reduction in medium- and long-term external<br />
debt, for which <strong>the</strong> outstanding balance as a share <strong>of</strong> GDP amounted <strong>to</strong><br />
only 2.8 percent in 2009, as against 25.1 percent <strong>of</strong> GDP in 2004 and 57.9<br />
percent in 1999; and<br />
• A sustained accumulation <strong>of</strong> resources in <strong>the</strong> FRR (43.1 percent <strong>of</strong> GDP in<br />
2009).<br />
FINANCING FOR THE ECONOMY IN A CONTEXT<br />
OF PRUDENT RESOURCE MANAGEMENT<br />
The sustained increase in domestic savings since 2000, particularly in <strong>the</strong> country’s<br />
surpluses in budget savings and hydrocarbon sec<strong>to</strong>r components, was <strong>the</strong><br />
corners<strong>to</strong>ne <strong>of</strong> <strong>the</strong> mechanism <strong>to</strong> finance <strong>the</strong> economy during <strong>the</strong> past decade.<br />
Investment Financing and Saving<br />
During <strong>the</strong> past 10 years, most investments were made by two main economic<br />
players with large financing capacities: <strong>the</strong> government and <strong>the</strong> hydrocarbon sec<strong>to</strong>r,<br />
both <strong>of</strong> which depend on hydrocarbon-sec<strong>to</strong>r revenues for <strong>the</strong>ir financing<br />
capacity.<br />
©International Monetary Fund. Not for Redistribution
198 <strong>Natural</strong> <strong>Resources</strong> Management and Financial Stability: Evidence from Algeria<br />
Beginning in 2001, <strong>the</strong> government under<strong>to</strong>ok <strong>the</strong> first public investment<br />
program (2001–04) followed by a second program that ran from 2005 <strong>to</strong> 2009.<br />
Progress in this area provided great stimulus for gross fixed capital formation, and<br />
<strong>the</strong> share <strong>of</strong> such investments in gross investment reached 47.9 percent in 2009,<br />
as against 40.8 percent in 2004. During 2005 <strong>to</strong> 2009, public investment, including<br />
economic and social infrastructure, housing, agriculture, and water systems,<br />
came <strong>to</strong> a <strong>to</strong>tal <strong>of</strong> US$96.77 billion out <strong>of</strong> US$188.13 billion in <strong>to</strong>tal gross<br />
investment, equivalent <strong>to</strong> a relative share <strong>of</strong> 51.3 percent. The level <strong>of</strong> public<br />
investment reached 18.2 percent <strong>of</strong> GDP in 2009, as against 7.5 percent in 1998,<br />
corresponding <strong>to</strong> two years <strong>of</strong> external shocks. Budget savings accumulated during<br />
this period enabled <strong>the</strong> government <strong>to</strong> self-finance all its investments, despite<br />
<strong>the</strong> extent <strong>of</strong> <strong>the</strong> 2009 external shock, which led <strong>to</strong> a 42 percent contraction in<br />
oil tax revenue.<br />
The national hydrocarbon enterprise has contributed greatly <strong>to</strong> gross fixed<br />
capital formation through <strong>the</strong> implementation <strong>of</strong> ambitious annual investment<br />
plans during recent years. In fact, investments by this enterprise increased from<br />
US$3.7 billion in 2004 <strong>to</strong> US$14.9 billion in 2009. For <strong>the</strong> past five years,<br />
investments by <strong>the</strong> national hydrocarbon enterprise averaged 21 percent <strong>of</strong> <strong>to</strong>tal<br />
gross investment, including 28.3 percent in 2009. Between 2001 and 2004, <strong>the</strong><br />
national hydrocarbon enterprise covered its investment financing largely with its<br />
own financial resources. Since 2005, <strong>the</strong> enterprise has self-financed all its investments<br />
while generating an appreciable s<strong>to</strong>ck <strong>of</strong> savings.<br />
Cycle <strong>of</strong> Credit <strong>to</strong> <strong>the</strong> Economy and Financial Stability<br />
The government’s and <strong>the</strong> national hydrocarbon enterprise’s self-financing <strong>of</strong> <strong>the</strong>ir<br />
investments during recent years has led <strong>to</strong> a <strong>to</strong>tal absence <strong>of</strong> <strong>the</strong> crowding-out effect<br />
in <strong>the</strong> rest <strong>of</strong> <strong>the</strong> economy in terms <strong>of</strong> domestic financing in <strong>the</strong> banking system.<br />
Fur<strong>the</strong>r, surplus revenues from <strong>the</strong> national hydrocarbon enterprise have yielded<br />
substantial funds that can be used for lending in <strong>the</strong> banking system, while surplus<br />
budget resources have been sterilized in support <strong>of</strong> macr<strong>of</strong>inancial stability.<br />
During <strong>the</strong> period 2005–09, <strong>the</strong> availability <strong>of</strong> substantial liquidity in <strong>the</strong><br />
banking system made it possible <strong>to</strong> finance 49.1 percent <strong>of</strong> investments in <strong>the</strong> rest<br />
<strong>of</strong> <strong>the</strong> economy, with <strong>the</strong> balance <strong>of</strong> <strong>the</strong> financing covered by <strong>the</strong>ir own resources<br />
(46.8 percent) and through bond market issues (4.1 percent). The share <strong>of</strong> cumulative<br />
investments in <strong>the</strong> economy out <strong>of</strong> <strong>to</strong>tal gross investment was 27.8 percent<br />
for <strong>the</strong> period 2005–09, with high rates <strong>of</strong> increase in investments (19.4 percent<br />
in 2008 and 11.5 percent in 2009).<br />
In general, <strong>the</strong> investment finance structure for <strong>the</strong>se years has shown a very high<br />
level <strong>of</strong> self-financing (85.2 percent), with <strong>the</strong> balance financed primarily by domestic<br />
bank loans, constituting a clear departure from earlier financing patterns.<br />
The 2000s have been characterized by strong developments in bank intermediation,<br />
from <strong>the</strong> standpoint <strong>of</strong> collecting resources, distributing credit, and<br />
modernizing payment systems. This has led <strong>to</strong> an appreciable improvement in<br />
basic banking services for clients. Credit <strong>to</strong> <strong>the</strong> economy in fact registered an<br />
©International Monetary Fund. Not for Redistribution
Laksaci 199<br />
average annual growth rate <strong>of</strong> 8.4 percent during <strong>the</strong> period 2000–09, with 21.2<br />
percent <strong>of</strong> loans going <strong>to</strong> <strong>the</strong> private sec<strong>to</strong>r and a deposit coverage rate <strong>of</strong> 135.3<br />
percent, derived largely from hydrocarbon resources.<br />
We should bear in mind that <strong>the</strong> lack <strong>of</strong> prudence in allocating and managing<br />
financial resources during <strong>the</strong> 1970s and 1980s led <strong>to</strong> a high level <strong>of</strong> outstanding<br />
debt distributed by public banks, relative <strong>to</strong> non-hydrocarbon GDP. This debt<br />
was equivalent <strong>to</strong> 80 percent <strong>of</strong> non-hydrocarbon GDP for <strong>the</strong> period 1985–90,<br />
when hydrocarbon-sec<strong>to</strong>r enterprises had little recourse <strong>to</strong> domestic credit. The<br />
high level <strong>of</strong> this ratio can be attributed <strong>to</strong> <strong>the</strong> lengthy period <strong>of</strong> monetary expansionism<br />
following <strong>the</strong> phenomenon <strong>of</strong> “financial repression” that characterized<br />
bank intermediation during <strong>the</strong>se two decades. The ratio declined steadily <strong>to</strong><br />
reach 47.6 percent in 2009, primarily as a result <strong>of</strong> operations <strong>to</strong> reschedule nonperforming<br />
bank claims on public enterprises, at an average cost <strong>of</strong> 2.6 percent <strong>of</strong><br />
GDP during <strong>the</strong> 1990s and 0.9 percent <strong>of</strong> GDP during <strong>the</strong> 2000s.<br />
Trends in credit <strong>to</strong> <strong>the</strong> economy during <strong>the</strong> 2000s were characterized by a large<br />
increase in credit <strong>to</strong> <strong>the</strong> private sec<strong>to</strong>r (private enterprises and households). The<br />
distribution <strong>of</strong> credits <strong>to</strong> this sec<strong>to</strong>r were particularly dynamic during 2000–05,<br />
reflecting a relative relaxation in lending criteria, and this led <strong>to</strong> <strong>the</strong> emergence <strong>of</strong><br />
nonperforming claims by public banks against this sec<strong>to</strong>r and <strong>to</strong> a substantial risk<br />
concentration. Accordingly, credit flows <strong>to</strong> <strong>the</strong> private sec<strong>to</strong>r decreased from 6.4<br />
percent <strong>of</strong> cumulative value added in <strong>the</strong> sec<strong>to</strong>r during 2002–05 <strong>to</strong> 4.8 percent<br />
for <strong>the</strong> period 2006–09. Beginning in 2006, <strong>the</strong> cycle <strong>of</strong> credit <strong>to</strong> private enterprises<br />
and households shows that reduced bank credit flows were accompanied by<br />
greater wealth creation in <strong>the</strong> private sec<strong>to</strong>r. It is useful <strong>to</strong> note that <strong>the</strong> nonperforming<br />
claims on <strong>the</strong> private sec<strong>to</strong>r did not involve home mortgage loans, as<br />
<strong>the</strong>re was no acceleration in <strong>the</strong> cycle for this type <strong>of</strong> loan. Home mortgage loans<br />
represented only 8.3 percent <strong>of</strong> <strong>the</strong> relevant deposits at end-2009.<br />
From <strong>the</strong> standpoint <strong>of</strong> monetary stability, during <strong>the</strong> period 2000–08 <strong>the</strong><br />
increase in credit <strong>to</strong> <strong>the</strong> economy constituted only a modest source <strong>of</strong> monetary<br />
expansion, <strong>the</strong> main source being aggregate net foreign assets. With <strong>the</strong> exception<br />
<strong>of</strong> 2009, <strong>the</strong> structural expansion in net foreign assets from hydrocarbon export<br />
revenue presented a challenge in monetary policy steering. The ratio <strong>of</strong> net foreign<br />
assets <strong>to</strong> M2 reached an unprecedented 1.473 at end-2008, stabilizing<br />
in 2009, as against 1.027 at end-2005. Very low levels <strong>of</strong> monetary growth<br />
(3.1 percent) were registered in 2009, and liquidity underwent a contraction<br />
(–14 percent) correlating with <strong>the</strong> external shock, following <strong>the</strong> high rates <strong>of</strong><br />
monetary expansion in this area during 2005–08. Accordingly, <strong>the</strong> monetary<br />
growth rate peaked at 24.2 percent in 2007, followed by a reversal in <strong>the</strong> cycle<br />
(16 percent in 2008 and 3.1 percent in 2009).<br />
Moreover, consistent with recent developments in <strong>the</strong> operational framework<br />
for monetary policy at <strong>the</strong> international level, in 2009 following <strong>the</strong><br />
financial crisis Algeria streng<strong>the</strong>ned its monetary policy framework. A new<br />
regulation from <strong>the</strong> Money and Credit Council gave <strong>the</strong> Bank <strong>of</strong> Algeria monetary<br />
instruments meeting international standards, enabling it <strong>to</strong> continue <strong>to</strong><br />
cover <strong>the</strong> structural liquidity surpluses that had prevailed since 2002 and <strong>to</strong><br />
©International Monetary Fund. Not for Redistribution
200 <strong>Natural</strong> <strong>Resources</strong> Management and Financial Stability: Evidence from Algeria<br />
contain inflationary pressures. This regula<strong>to</strong>ry framework covers bank refinancing<br />
operations, operations <strong>to</strong> mop up excess liquidity on <strong>the</strong> money market, and<br />
facilities (loans and deposits) at <strong>the</strong> banks’ initiatives. This approach reinforces<br />
<strong>the</strong> contribution <strong>of</strong> monetary policy <strong>to</strong> financial stability, with <strong>the</strong> stabilization<br />
<strong>of</strong> <strong>the</strong> real effective exchange rate for <strong>the</strong> dinar around its equilibrium level.<br />
The progress made in <strong>the</strong> area <strong>of</strong> monetary stability and <strong>the</strong> resilience <strong>of</strong> <strong>the</strong><br />
banking sec<strong>to</strong>r have fur<strong>the</strong>r consolidated financial stability. Stability has been<br />
sustained by <strong>the</strong> 2008-09 improvement in <strong>the</strong> operational framework for banking<br />
activity, which included an increase in minimum regula<strong>to</strong>ry capital, new accounting<br />
regulations meeting international standards applicable since 2010, and assessments<br />
<strong>of</strong> risk in connection with new financial instruments.<br />
Specifically, both <strong>the</strong> large increase in bank capital (DA 76 billion) during <strong>the</strong><br />
latter half <strong>of</strong> 2009, in conformity with <strong>the</strong> increase in <strong>the</strong> minimum capital level,<br />
and <strong>the</strong> upgrading <strong>of</strong> capital in certain public banks (DA 42 billion) helped consolidate<br />
<strong>the</strong> overall solvency ratio, which reached 21.78 percent in 2009, as against<br />
16.54 percent in 2008 and 12.85 percent in 2007. In terms <strong>of</strong> core capital and<br />
capital, <strong>the</strong> solvency ratios were 17 percent and 9.7 percent, respectively, in 2009.<br />
The o<strong>the</strong>r indica<strong>to</strong>rs show increased soundness in <strong>the</strong> banking system during<br />
<strong>the</strong> latter half <strong>of</strong> <strong>the</strong> 2000s. Despite <strong>the</strong> relative contraction in 2009 due <strong>to</strong> <strong>the</strong><br />
external shock, <strong>the</strong> liquidity surplus persisted, as shown by <strong>the</strong> high ratios <strong>of</strong> two<br />
indica<strong>to</strong>rs: liquid assets <strong>to</strong> <strong>to</strong>tal assets and liquid assets <strong>to</strong> short-term liabilities.<br />
Fur<strong>the</strong>r, returns on capital and reserves were still substantial, amounting <strong>to</strong> 24.8<br />
percent in 2009. The rate <strong>of</strong> return on banks’ assets was situated at 1.4 percent<br />
for 2009. This rate is similar <strong>to</strong> those registered in certain emerging countries,<br />
such as Turkey, Indonesia, Malaysia, Brazil, Chile, South Korea, and South Africa.<br />
While <strong>the</strong>se indica<strong>to</strong>rs show <strong>the</strong> stability and resilience <strong>of</strong> Algeria’s banking<br />
sec<strong>to</strong>r in light <strong>of</strong> external shocks, <strong>the</strong> level <strong>of</strong> nonperforming claims, primarily<br />
against <strong>the</strong> private sec<strong>to</strong>r, is still a challenge for public banks, which must continue<br />
<strong>to</strong> improve <strong>the</strong>ir mechanisms for credit risk management. In this context,<br />
<strong>the</strong> streng<strong>the</strong>ned financial stability that is based on progress in monetary stability<br />
primarily entails a sustained improvement in <strong>the</strong> surveillance <strong>of</strong> banks and financial<br />
institutions. To that end, microprudential supervision instruments will be<br />
streng<strong>the</strong>ned, particularly by establishing a new liquidity ratio and by intensifying<br />
<strong>of</strong>f-site and on-site supervision.<br />
STRENGTHENING THE FRAMEWORK FOR FINANCIAL<br />
STABILITY: OUTLOOK FOR THE MACROPRUDENTIAL<br />
APPROACH<br />
New legislative provisions (Order 10-04 <strong>of</strong> August 26, 2010) consolidate <strong>the</strong> legal<br />
framework governing <strong>the</strong> banking sec<strong>to</strong>r in Algeria and streng<strong>the</strong>n <strong>the</strong> legal basis<br />
for financial stability as an explicit mission <strong>of</strong> <strong>the</strong> Bank <strong>of</strong> Algeria, primarily from<br />
<strong>the</strong> standpoint <strong>of</strong> systemic risk surveillance. This approach supports <strong>the</strong> regula<strong>to</strong>ry<br />
measures applied in recent years <strong>to</strong> address certain observed vulnerabilities.<br />
©International Monetary Fund. Not for Redistribution
Laksaci 201<br />
The Bank <strong>of</strong> Algeria now has broader prerogatives <strong>to</strong> launch investigation<br />
<strong>of</strong> banks and financial institutions. This permits more effective follow-up <strong>of</strong><br />
banks and financial institutions and enhances <strong>the</strong> Bank <strong>of</strong> Algeria’s capacity <strong>to</strong><br />
detect vulnerabilities early. Intensified microprudential supervision will contribute<br />
<strong>to</strong> <strong>the</strong> orderly development <strong>of</strong> <strong>the</strong> banking system, particularly since systemic<br />
risk surveillance is derived primarily from <strong>the</strong> Bank <strong>of</strong> Algeria’s payment system<br />
surveillance. The central bank now has broader powers in this area, including in<br />
operations, surveillance, and security <strong>of</strong> payments systems.<br />
The finalization and implementation <strong>of</strong> <strong>the</strong> bank rating system during <strong>the</strong> first<br />
half <strong>of</strong> 2011, along with <strong>the</strong> effective operation <strong>of</strong> a new risk reporting center at<br />
<strong>the</strong> end <strong>of</strong> 2011, will give risk-based supervision an operational focus. In addition,<br />
<strong>the</strong> powers <strong>of</strong> <strong>the</strong> monetary authority (<strong>the</strong> Money and Credit Council) have<br />
been expanded <strong>to</strong> new areas—specifically new saving and credit instruments,<br />
production <strong>of</strong> standards, operation and security <strong>of</strong> payments systems, and rules<br />
<strong>of</strong> conduct and ethics. Fur<strong>the</strong>r, <strong>the</strong> Bank <strong>of</strong> Algeria will submit liquidity risk<br />
management regulations <strong>to</strong> <strong>the</strong> Money and Credit Council by end-2010, in<br />
accordance with <strong>the</strong> new rules <strong>of</strong> <strong>the</strong> Basel Committee.<br />
In <strong>the</strong> short term, <strong>the</strong> Bank <strong>of</strong> Algeria’s Financial Stability Committee will<br />
complete a review <strong>of</strong> financial soundness indica<strong>to</strong>rs for <strong>the</strong> 11 minimum indica<strong>to</strong>rs.<br />
This review will subsequently be expanded <strong>to</strong> fur<strong>the</strong>r proposed indica<strong>to</strong>rs.<br />
The committee will conduct fur<strong>the</strong>r analyses <strong>of</strong> <strong>the</strong> macroprudential approach <strong>to</strong><br />
address <strong>the</strong> structural liquidity surpluses that now characterize <strong>the</strong> Algerian banking<br />
system and <strong>the</strong> need <strong>to</strong> improve allocation <strong>of</strong> credit <strong>to</strong> <strong>the</strong> economy <strong>to</strong> support<br />
national economic diversification.<br />
In terms <strong>of</strong> crisis prevention and resolution, <strong>the</strong> intensification <strong>of</strong> information<br />
exchanges among <strong>the</strong> various authorities in <strong>the</strong> financial sec<strong>to</strong>r, which aims <strong>to</strong><br />
refine and streng<strong>the</strong>n knowledge <strong>of</strong> <strong>the</strong> financial system’s level <strong>of</strong> resistance <strong>to</strong><br />
cyclical phenomena, will make it possible <strong>to</strong> detect any threats against financial<br />
stability. For that purpose, <strong>the</strong> use <strong>of</strong> stress tests, in particular for periodically<br />
assessing <strong>the</strong> stability <strong>of</strong> <strong>the</strong> banking and financial system, will receive special<br />
attention.<br />
Last, <strong>the</strong> new legislative measures <strong>of</strong> August 2010 provide a legal underpinning<br />
for price stability as an explicit monetary policy objective. This approach will<br />
support <strong>the</strong> 2009 consolidation <strong>of</strong> <strong>the</strong> regula<strong>to</strong>ry framework and instruments for<br />
monetary policy, which now provide a forward-looking orientation. The contribution<br />
<strong>of</strong> monetary policy <strong>to</strong> financial stability is <strong>the</strong>refore being reinforced. In<br />
addition, prudent management <strong>of</strong> <strong>of</strong>ficial exchange reserves at a sufficient level <strong>to</strong><br />
cover any external shocks that may occur is part <strong>of</strong> <strong>the</strong> strategic objective <strong>to</strong> consolidate<br />
financial stability. Economic diversification efforts must still be intensified<br />
<strong>to</strong> sharply reduce <strong>the</strong> vulnerability inherent in <strong>the</strong> economy’s dependence on<br />
<strong>the</strong> hydrocarbon sec<strong>to</strong>r.<br />
©International Monetary Fund. Not for Redistribution
This page intentionally left blank<br />
©International Monetary Fund. Not for Redistribution
CHAPTER 12<br />
Copper, <strong>the</strong> Real Exchange Rate<br />
and Macroeconomic Fluctuations<br />
in Chile<br />
JOSÉ DE GREGORIO AND FELIPE LABBÉ<br />
INTRODUCTION<br />
Chile is rich in natural resources. The mining sec<strong>to</strong>r has been very important<br />
his<strong>to</strong>rically, and <strong>to</strong>day Chile is <strong>the</strong> largest producer <strong>of</strong> copper in <strong>the</strong> world. But<br />
while Chile reaps <strong>the</strong> benefits <strong>of</strong> abundant copper, <strong>the</strong> metal also represents many<br />
challenges for macroeconomic management and long-term growth.<br />
The abundance <strong>of</strong> natural resources has been an important area <strong>of</strong> discussion<br />
in development economics for a long time. A few decades ago it was thought that<br />
developing countries should move away from natural resources because <strong>of</strong> <strong>the</strong><br />
declining price trend. This view was argued <strong>to</strong> support a development strategy<br />
based on import substitution. The facts have shown that this view was based on<br />
a wrong assumption. Never<strong>the</strong>less, <strong>the</strong> relationship between development and<br />
natural resources has again become a highly debated issue. A large body <strong>of</strong><br />
research has examined <strong>the</strong> question <strong>of</strong> whe<strong>the</strong>r natural resources are a blessing or<br />
a curse from <strong>the</strong> point <strong>of</strong> view <strong>of</strong> economic growth. 1<br />
<strong>Natural</strong> resource abundance has also been discussed in <strong>the</strong> context <strong>of</strong> macroeconomic<br />
models <strong>of</strong> small open economies. The purpose <strong>of</strong> <strong>the</strong>se development<br />
models has been <strong>to</strong> analyze <strong>the</strong> impact <strong>of</strong> commodity price fluctuations on <strong>the</strong><br />
José De Gregorio is governor and Felipe Labbé is economic advisor <strong>to</strong> <strong>the</strong> governor, both at <strong>the</strong><br />
Central Bank <strong>of</strong> Chile. This chapter is based on <strong>the</strong> authors’ presentation at “<strong>Natural</strong> <strong>Resources</strong>,<br />
Finance, and Development: Confronting Old and New Challenges,” a high-level seminar organized<br />
by <strong>the</strong> Central Bank <strong>of</strong> Algeria and <strong>the</strong> IMF Institute, which <strong>to</strong>ok place in Algiers, on November 4<br />
and 5, 2010. The authors wish <strong>to</strong> express <strong>the</strong>ir gratitude <strong>to</strong> Pierre-Olivier Gourinchas, Enrique<br />
Mendoza, Sergio Rebelo, Claudio So<strong>to</strong>, and Tatiana Vargas, for insightful comments on previous versions<br />
<strong>of</strong> this chapter. The authors can be contacted at jdegrego@bcentral.cl and flabbe@bcentral.cl.<br />
1<br />
Interestingly, most <strong>of</strong> this research has been based on <strong>the</strong> impact <strong>of</strong> natural resource abundance on<br />
economic growth, without taking in<strong>to</strong> account that although it may slow down growth transi<strong>to</strong>rily,<br />
<strong>the</strong> increase in income makes it welfare improving (Bravo-Ortega and De Gregorio, 2006). For a<br />
classical reference on <strong>the</strong> economic consequences <strong>of</strong> natural resources abundance, see Sachs and<br />
Warner (1999). For <strong>the</strong> role <strong>of</strong> institutions and human capital on overcoming <strong>the</strong> resource curse, see<br />
Robinson, Torvik, and Verdier (2006) and Bravo-Ortega and De Gregorio (2006), respectively.<br />
©International Monetary Fund. Not for Redistribution<br />
203
204 Copper, <strong>the</strong> Real Exchange Rate and Macroeconomic Fluctuations in Chile<br />
economy, in particular <strong>the</strong> business cycle and <strong>the</strong> composition <strong>of</strong> growth. An<br />
important question <strong>the</strong>se models seek <strong>to</strong> answer is, What is <strong>the</strong> appropriate<br />
framework for monetary and fiscal policy in order <strong>to</strong> mitigate <strong>the</strong> potential costs<br />
<strong>of</strong> commodity price fluctuations?<br />
This chapter discusses <strong>the</strong> case <strong>of</strong> copper in Chile from <strong>the</strong> perspective <strong>of</strong> macroeconomic<br />
management. Although <strong>the</strong> long-run implications <strong>of</strong> Chile’s abundance<br />
<strong>of</strong> copper for <strong>the</strong> country’s economic growth are related <strong>to</strong> <strong>the</strong> impact <strong>of</strong><br />
copper on <strong>the</strong> business cycle, because a volatile business cycle may reduce growth<br />
potential, our focus is on macroeconomic performance. 2 In particular, this chapter<br />
shows that <strong>the</strong> fluctuations in copper prices have less impact than <strong>the</strong>y used <strong>to</strong> have<br />
on aggregate fluctuations in Chile and that this is <strong>the</strong> result <strong>of</strong> <strong>the</strong> macroeconomic<br />
policy regime in place. Indeed, <strong>the</strong> stability that comes from being more resilient <strong>to</strong><br />
<strong>the</strong> international environment should foster long-run economic growth.<br />
The analysis in this chapter finds that <strong>the</strong> Chilean economy is not excessively<br />
dependent on copper, as it may have been in <strong>the</strong> past. Moreover, <strong>the</strong> impact <strong>of</strong> copper<br />
on <strong>the</strong> economy has diminished over time thanks <strong>to</strong> macroeconomic policies.<br />
A recurrent concern during periods <strong>of</strong> rising commodity prices is <strong>the</strong> so-called<br />
Dutch disease, which has short- and long-term implications. The concern has been<br />
about <strong>the</strong> impact on economic performance <strong>of</strong> <strong>the</strong> exchange rate appreciation that<br />
comes with a commodity price boom. During <strong>the</strong> last decade, copper prices reached<br />
both <strong>the</strong>ir highest and lowest values since <strong>the</strong> Great Depression. Despite this volatility<br />
and o<strong>the</strong>r severe international shocks, real exchange rate (RER) fluctuations have<br />
been more moderate than what would have been expected in <strong>the</strong> past. 3<br />
The reduction in Chile’s output volatility since <strong>the</strong> 1990s and 2000s has been<br />
previously documented in De Gregorio, Betancour, and Medina (2008) and<br />
Larraín and Parro (2008). The first <strong>of</strong> <strong>the</strong>se papers shows that indeed volatility<br />
has decreased and this has been <strong>the</strong> result <strong>of</strong> <strong>the</strong> macroeconomic policies implemented<br />
in <strong>the</strong> last decade; however, <strong>the</strong> study’s estimations do not allow one <strong>to</strong><br />
separate <strong>the</strong> different components, that is, <strong>the</strong> fiscal, monetary, and exchange-rate<br />
policies applied during this period. The second paper performs regressions for<br />
volatility controlling for a dummy since <strong>the</strong> fiscal rule based on a target for <strong>the</strong><br />
structural budget was implemented <strong>to</strong>ge<strong>the</strong>r with an index <strong>of</strong> exchange rate intervention.<br />
The authors attribute about 60 percent <strong>of</strong> <strong>the</strong> decline in volatility <strong>to</strong> <strong>the</strong><br />
fiscal rule and <strong>the</strong> flexibility <strong>of</strong> <strong>the</strong> exchange rate. In contrast <strong>to</strong> that previous<br />
research <strong>the</strong> focus <strong>of</strong> this chapter is on <strong>the</strong> changing, and diminishing, contribution<br />
that copper price fluctuations make <strong>to</strong> economic performance.<br />
Carrying out an integrated assessment <strong>of</strong> <strong>the</strong> different fac<strong>to</strong>rs reducing output<br />
volatility, in particular <strong>the</strong> role <strong>of</strong> copper price fluctuations, would require a full<br />
model describing channels through which <strong>the</strong> external conditions transmit <strong>to</strong> <strong>the</strong><br />
domestic economy. However, such a task is beyond <strong>the</strong> purpose <strong>of</strong> this chapter, and<br />
2 During <strong>the</strong> last 25 years Chile has enjoyed its highest rate <strong>of</strong> economic growth ever, and hence <strong>the</strong><br />
proposition that copper may be detrimental for economic growth is easily dismissed. For fur<strong>the</strong>r<br />
discussion, see De Gregorio (2009).<br />
3 For recent discussion on exchange rate and Dutch disease see Magud and Sosa (2010).<br />
©International Monetary Fund. Not for Redistribution
Gregorio and Labbé 205<br />
with current models it would be very difficult <strong>to</strong> undertake, since <strong>the</strong> comparison<br />
would have <strong>to</strong> be made with policy regimes that are particularly difficult <strong>to</strong><br />
formalize. We use a general equilibrium model for <strong>the</strong> last decade in <strong>the</strong> next <strong>to</strong><br />
last section (“Simulation <strong>of</strong> a Copper Price Shock”), but that model cannot be used<br />
for previous periods, because pre-2000 macroeconomic policies had many features<br />
that are complex <strong>to</strong> model, such as <strong>the</strong> exchange rate band, capital controls and a<br />
monetary policy based on setting an indexed interest rate. On <strong>the</strong> fiscal side <strong>the</strong>re<br />
was fiscal prudence but no explicit rule. For this reason, we use a more eclectic<br />
approach <strong>to</strong> focus on <strong>the</strong> impact <strong>of</strong> copper prices on Chile’s business cycle.<br />
First, we review <strong>the</strong> evidence on fiscal policy. Then we examine <strong>the</strong> determinants<br />
<strong>of</strong> both output volatility and RER. The evidence <strong>of</strong> this chapter shows that<br />
indeed <strong>the</strong> output response <strong>to</strong> copper has declined and that <strong>the</strong> RER has played<br />
a shock absorber role since <strong>the</strong> inflation target regime and <strong>the</strong> floating exchange<br />
rate policy were adopted. In addition, long-run RER volatility has recently<br />
declined slightly despite sharp copper price fluctuations.<br />
This chapter proceeds with a brief discussion <strong>of</strong> <strong>the</strong> importance <strong>of</strong> copper in<br />
Chile; <strong>the</strong> next section discusses fiscal policy, followed by a presentation <strong>of</strong> <strong>the</strong><br />
evidence on copper price fluctuations and <strong>the</strong> business cycle. It is shown that<br />
output volatility in Chile has declined substantially since <strong>the</strong> early 1990s. Both<br />
<strong>the</strong> volatility and <strong>the</strong> response <strong>of</strong> <strong>the</strong> economy <strong>to</strong> copper have declined fur<strong>the</strong>r in<br />
<strong>the</strong> last decade, which has featured a flexible inflation target and a floating<br />
exchange rate. The application <strong>of</strong> <strong>the</strong>se policies has benefited from a predictable<br />
fiscal rule. The fifth section <strong>of</strong> <strong>the</strong> chapter (“Terms <strong>of</strong> Trade Shocks”) presents<br />
evidence on <strong>the</strong> long-run RER dynamics. We show that after permanent terms<strong>of</strong>-trade<br />
shock, <strong>the</strong> RER stabilized at its long-term value more quickly during <strong>the</strong><br />
period after 1999, that is, after <strong>the</strong> implementation <strong>of</strong> <strong>the</strong> flexible exchange<br />
regime. Moreover, <strong>the</strong> effects <strong>of</strong> terms-<strong>of</strong>-trade shocks have been less persistent<br />
during <strong>the</strong> latter period. The sixth section <strong>of</strong> this chapter (“Macroeconomic<br />
Fluctuations”) presents evidence that nominal exchange rate and short-run RER<br />
volatilities have increased. However, long-run RER volatility has remained stable.<br />
In fact, nominal exchange rate and RER have played a shock absorber role in <strong>the</strong><br />
Chilean economy since <strong>the</strong> implementation <strong>of</strong> <strong>the</strong> fully flexible exchange regime.<br />
The next-<strong>to</strong>-last section <strong>of</strong> <strong>the</strong> chapter simulates <strong>the</strong> effects <strong>of</strong> a copper price<br />
shock on <strong>the</strong> Chilean economy using a standard dynamic s<strong>to</strong>chastic general equilibrium<br />
model estimated under different policy rules. The chapter closes with<br />
some concluding remarks.<br />
COPPER IN THE CHILEAN ECONOMY<br />
Chile has become increasingly important in <strong>the</strong> world copper market. Since <strong>the</strong><br />
late 1960s <strong>the</strong> Chilean economy has increased its share <strong>of</strong> global production, <strong>to</strong><br />
somewhat more than a third (Figure 12.1).<br />
The share that mining represents both in Chile’s GDP and in its exports has<br />
also been his<strong>to</strong>rically large. In <strong>the</strong> late nineteenth century, Chile was an important<br />
producer <strong>of</strong> nitrates, an industry that collapsed some decades later when cheaper<br />
©International Monetary Fund. Not for Redistribution
206 Copper, <strong>the</strong> Real Exchange Rate and Macroeconomic Fluctuations in Chile<br />
syn<strong>the</strong>tic nitrate was created. Then copper started taking <strong>of</strong>f. The mining sec<strong>to</strong>r’s<br />
share in <strong>to</strong>tal GDP declined substantially in <strong>the</strong> middle <strong>of</strong> <strong>the</strong> last century but,<br />
unsurprisingly, it has fluctuated with <strong>the</strong> price <strong>of</strong> copper since <strong>the</strong>n. Those copper<br />
prices have experienced sharp fluctuations. The previous period <strong>of</strong> very high<br />
prices was in <strong>the</strong> mid 1960s. The price <strong>of</strong> copper declined sharply in <strong>the</strong> early<br />
1990s only <strong>to</strong> again reach new his<strong>to</strong>rical highs since (Figure 12.2).<br />
Figure 12.3 shows <strong>the</strong> share <strong>of</strong> <strong>the</strong> mining industry in GDP measured at both<br />
current prices (A) and constant 2003 prices (B). With <strong>the</strong> low prices <strong>of</strong> <strong>the</strong> early<br />
2000s, <strong>the</strong> share <strong>of</strong> mining in nominal GDP was slightly above 5 percent, but<br />
with <strong>the</strong> most recent very high prices this share rose above 20 percent in 2006–<br />
07. Measured at 2003 prices, this share has declined slightly <strong>to</strong> 6 percent <strong>of</strong> GDP<br />
in 2009.<br />
Figure 12.1<br />
Chilean copper production as share <strong>of</strong> world production<br />
(production is measured in metric <strong>to</strong>ns)<br />
Percent<br />
40<br />
30<br />
20<br />
10<br />
0<br />
1890 1900 1910 1920 1930 1940 1950 1960 1970 1980 1990 2000 2010<br />
Sources: Díaz, Lüders, and Wagner (2010) and <strong>the</strong> Chilean Copper Commission<br />
(CoChilco).<br />
Note: Shares are obtained dividing Chilean production by world production; values<br />
are all expressed in metric <strong>to</strong>ns.<br />
Figure 12.2<br />
Real price <strong>of</strong> copper<br />
(U.S. cents per pound, measured at 2010 prices)<br />
400<br />
350<br />
300<br />
250<br />
200<br />
150<br />
100<br />
50<br />
0<br />
1950 1955 1960 1965 1970 1975 1980 1985 1990 1995 2000 2005 2010<br />
Source: The Chilean Copper Commission (CoChilco).<br />
©International Monetary Fund. Not for Redistribution
Gregorio and Labbé 207<br />
Given <strong>the</strong> size <strong>of</strong> <strong>the</strong> Chilean mining sec<strong>to</strong>r, <strong>the</strong>re has been serious concern<br />
about <strong>the</strong> implications <strong>of</strong> volatile copper prices for economic activity. Indeed<br />
<strong>the</strong> Chilean economy saw significant growth when copper prices were high<br />
(Figures 12.2 and 12.4). During <strong>the</strong> period <strong>of</strong> high copper prices in 1979–80,<br />
<strong>the</strong> economy grew at 8.1 on an annual basis. Similarly, during <strong>the</strong> boom <strong>of</strong><br />
1988–89 growth was 8.9 percent, and in 1995 it was 10.1 percent. However,<br />
during <strong>the</strong> most recent copper-price boom, which started in late 2005, <strong>the</strong><br />
economy grew more moderately. Indeed, in 2006–07, before <strong>the</strong> Great<br />
Recession, <strong>the</strong> economy grew at an annual rate <strong>of</strong> 4.6 percent. At <strong>the</strong> same time,<br />
<strong>the</strong> reaction <strong>of</strong> <strong>the</strong> economy <strong>to</strong> lower copper prices has also moderated. Before<br />
Figure 12.3<br />
Mining as a share <strong>of</strong> <strong>to</strong>tal GDP<br />
(percent)<br />
25<br />
20<br />
15<br />
10<br />
5<br />
0<br />
Nominal 1<br />
2010<br />
2005<br />
2000<br />
1995<br />
1990<br />
1985<br />
1980<br />
1975<br />
1970<br />
3<br />
Source: Central Bank <strong>of</strong> Chile.<br />
10<br />
8<br />
6<br />
Real 2<br />
1At current prices.<br />
2At 2003 prices.<br />
3Considers forecasts for 2010 <strong>of</strong> <strong>to</strong>tal GDP growth and Mining, included in <strong>the</strong> September Monetary<br />
Policy Report.<br />
4<br />
2<br />
0<br />
2009<br />
2008<br />
2007<br />
2006<br />
2005<br />
2000<br />
1995<br />
1990<br />
1980<br />
Figure 12.4<br />
GDP and price <strong>of</strong> copper growth, 1950–2010<br />
(percent)<br />
Real price <strong>of</strong> copper growth<br />
75<br />
50<br />
25<br />
0<br />
−25<br />
−50<br />
1950 1960 1970 1980 1990 2000 2010<br />
year<br />
Real price <strong>of</strong> copper growth GDP growth<br />
Sources: Díaz, Lüders, and Wagner (2010) and Central Bank <strong>of</strong> Chile.<br />
growth<br />
10GDP 5<br />
0<br />
−5<br />
−10<br />
©International Monetary Fund. Not for Redistribution
208 Copper, <strong>the</strong> Real Exchange Rate and Macroeconomic Fluctuations in Chile<br />
2000, <strong>the</strong> Chilean economy generally went in<strong>to</strong> recessions when <strong>the</strong> copper<br />
price collapsed. However, in <strong>the</strong> three years from 2000 <strong>to</strong> 2002, when <strong>the</strong> copper<br />
price dropped <strong>to</strong> its minimum triennial real price since <strong>the</strong> Great<br />
Depression, <strong>the</strong> economy grew at 3.3 percent. This is very suggestive evidence<br />
that <strong>the</strong> Chilean economy has become much more resilient <strong>to</strong> copper price<br />
fluctuations.<br />
Before discussing in more detail <strong>the</strong> decline in volatility <strong>of</strong> output, we would like<br />
<strong>to</strong> discuss qualitatively <strong>the</strong> direct channels through which copper prices affect <strong>the</strong><br />
economy. What we would like <strong>to</strong> show is that, in principle, <strong>the</strong>re is no reason<br />
<strong>to</strong> believe that <strong>the</strong> business cycle should be affected significantly by copper price<br />
movements.<br />
First, <strong>the</strong> mining sec<strong>to</strong>r accounts for only about 1.5 percent <strong>of</strong> <strong>to</strong>tal employment,<br />
down from 2.6 percent in <strong>the</strong> early 1980s. This is direct employment, but<br />
in <strong>the</strong> north <strong>of</strong> Chile, where most mining production takes place, a large fraction<br />
<strong>of</strong> economic activity is linked directly or indirectly <strong>to</strong> mining. However, <strong>the</strong> share<br />
<strong>of</strong> <strong>the</strong> <strong>to</strong>tal population living in <strong>the</strong> mining regions is only about 7 percent. This<br />
fact shows that <strong>the</strong> direct effect <strong>of</strong> copper activity is limited. This contrasts with<br />
agricultural commodities which, where abundant, represent a larger fraction <strong>of</strong><br />
GDP and employment.<br />
Second, about two-thirds <strong>of</strong> copper production is owned by foreign companies.<br />
4 The rest is produced by a state-owned company, CODELCO. Overall,<br />
when including taxes paid by foreign inves<strong>to</strong>rs, about half <strong>of</strong> <strong>the</strong> income from<br />
copper is foreign, and <strong>the</strong> rest is public, in <strong>the</strong> form <strong>of</strong> pr<strong>of</strong>its from CODELCO<br />
and tax revenues. But as is well known, fiscal policy in Chile operates under a rule<br />
that sets expenditure on <strong>the</strong> basis <strong>of</strong> long-term copper prices, so <strong>the</strong> fiscal impact<br />
<strong>of</strong> high copper prices is dampened significantly by <strong>the</strong> fiscal rule. 5<br />
Of course, in a Ricardian world, whe<strong>the</strong>r <strong>the</strong> income is public or private would<br />
be immaterial. However, <strong>the</strong> evidence on Ricardian equivalence is limited, in<br />
particular in a developing economy such as Chile where a large fraction <strong>of</strong> people<br />
are without full access <strong>to</strong> credit markets (Céspedes, Gali, and Fornero, 2010).<br />
Anyway, <strong>the</strong> country becomes richer with a higher copper price, and this should<br />
have some impact on private demand. However, given <strong>the</strong> improvements in <strong>the</strong><br />
Chilean policy framework, it is difficult <strong>to</strong> imagine that <strong>the</strong> effects are <strong>of</strong> such a<br />
magnitude as <strong>to</strong> induce recession when <strong>the</strong> copper price falls and acute booms<br />
4 There are important Chilean inves<strong>to</strong>rs in some mining companies, but <strong>the</strong>y are incorporated as foreign<br />
companies. There are also some small- and medium-sized companies that are owned by Chilean<br />
residents, but <strong>the</strong>y make up a small fraction <strong>of</strong> copper production.<br />
5 The copper price that enters on <strong>the</strong> fiscal rule formula corresponds <strong>to</strong> <strong>the</strong> expected copper price from<br />
t + 1 <strong>to</strong> t + 10. Therefore, <strong>the</strong>re is some impact, while very limited, <strong>of</strong> current prices on <strong>the</strong> current<br />
fiscal budget since forecasts tend <strong>to</strong> be highly persistent. In fact, Magendzo (2010) estimates that only<br />
10 percent <strong>of</strong> <strong>the</strong> last year’s copper price changes are incorporated in<strong>to</strong> <strong>the</strong> long-term copper price<br />
used in <strong>the</strong> fiscal rule.<br />
©International Monetary Fund. Not for Redistribution
Gregorio and Labbé 209<br />
when it rises, as was his<strong>to</strong>rically observed in Chile. 6 For more discussion on <strong>the</strong><br />
public finance channel, we review <strong>the</strong> role <strong>of</strong> fiscal policy in <strong>the</strong> next section.<br />
FISCAL POLICY AND COPPER<br />
It can be argued that <strong>the</strong> fiscal rule, which was launched in 2000, is what has<br />
produced <strong>the</strong> greater resilience <strong>of</strong> Chile’s economy <strong>to</strong> copper prices. Indeed, <strong>the</strong><br />
introduction <strong>of</strong> <strong>the</strong> fiscal rule was a big step <strong>to</strong>ward institutionalizing prudent<br />
fiscal policy, although fiscal prudence had been in place for a long time already.<br />
When introduced, <strong>the</strong> fiscal rule established <strong>the</strong> target <strong>of</strong> a structural surplus <strong>of</strong><br />
1 percent <strong>of</strong> GDP. The structural surplus is estimated using a cyclical adjustment<br />
for revenues and a long-term copper price. The parameters for both variables are<br />
established by two expert committees. In particular, for copper prices <strong>the</strong> experts<br />
are asked <strong>to</strong> forecast <strong>the</strong> average price for <strong>the</strong> next 10 years, and this is <strong>the</strong> price<br />
used <strong>to</strong> compute <strong>the</strong> structural revenues from copper.<br />
For 2007, <strong>the</strong> rule moved transi<strong>to</strong>rily <strong>to</strong> a target <strong>of</strong> 0.5 percent surplus <strong>of</strong><br />
GDP, <strong>the</strong>n in 2008 <strong>to</strong> a 0 percent balance, and it was changed <strong>to</strong> a deficit <strong>of</strong><br />
–1 percent during <strong>the</strong> 2009 recession. The current administration has announced<br />
that it will return <strong>to</strong> a structural deficit <strong>of</strong> –1 percent by <strong>the</strong> end <strong>of</strong> its term, in<br />
2014, amid <strong>the</strong> needs <strong>of</strong> reconstruction stemming from <strong>the</strong> earthquake <strong>of</strong> 2010.<br />
The introduction <strong>of</strong> <strong>the</strong> fiscal rule was a very important development in<br />
macroeconomic management. It provides a predictable path for fiscal policy.<br />
Monetary policy in <strong>the</strong> context <strong>of</strong> an inflation target is greatly benefited by this<br />
rule. The models that are used <strong>to</strong> forecast inflation for <strong>the</strong> policy horizon <strong>of</strong> two<br />
years take this rule in<strong>to</strong> account, and without <strong>the</strong> rule much weaker assumptions<br />
would have <strong>to</strong> be made in order <strong>to</strong> forecast inflation throughout <strong>the</strong> entire policy<br />
horizon and beyond. The adoption <strong>of</strong> this explicit rule has also contributed <strong>to</strong><br />
eliminating <strong>the</strong> uncertainty induced by fiscal revenues linked with copper price<br />
fluctuations. Therefore, it is difficult <strong>to</strong> separate <strong>the</strong> effects <strong>of</strong> <strong>the</strong> fiscal rule from<br />
<strong>the</strong> effects <strong>of</strong> <strong>the</strong> inflation target regime, because <strong>the</strong> latter has been positively<br />
influenced by <strong>the</strong> predictability and transparency <strong>of</strong> fiscal policy.<br />
The fiscal rule also played an important role in <strong>the</strong> run-up <strong>of</strong> copper prices in<br />
<strong>the</strong> last years, in particular before <strong>the</strong> subprime crisis developed. Indeed, with a<br />
copper price averaging US$3.4 per pound in 2006–07, <strong>the</strong> fiscal surplus was on<br />
average 8.2 percent <strong>of</strong> GDP. It is difficult <strong>to</strong> fathom how a windfall <strong>of</strong> such magnitude<br />
could have been saved without <strong>the</strong> rule. This allowed Chile <strong>to</strong> accumulate<br />
6 Calvo and Mendoza (1999) and Spilimbergo (1999) both report a high sensitivity <strong>of</strong> <strong>the</strong> business<br />
cycle in Chile <strong>to</strong> <strong>the</strong> copper price. However, <strong>the</strong>ir samples do not include <strong>the</strong> sharp drop <strong>of</strong> <strong>the</strong> early<br />
2000s and <strong>the</strong> later high rise, with moderate output fluctuations. Moreover, Calvo and Mendoza<br />
(1999) focus more on inflation, and <strong>the</strong>ir estimations for terms <strong>of</strong> trade use <strong>the</strong> price <strong>of</strong> copper<br />
divided by <strong>the</strong> price <strong>of</strong> oil, with <strong>the</strong> former also having important effects on <strong>the</strong> economy. In turn,<br />
Caballero (2002) argues that sensitivity <strong>of</strong> <strong>the</strong> business cycle <strong>to</strong> copper prices is due <strong>to</strong> <strong>the</strong> fact that<br />
copper is used as collateral for foreign borrowing. This channel could have been relevant when Chile<br />
had limited access <strong>to</strong> international financing.<br />
©International Monetary Fund. Not for Redistribution
210 Copper, <strong>the</strong> Real Exchange Rate and Macroeconomic Fluctuations in Chile<br />
a sovereign wealth fund that reached 19.5 percent <strong>of</strong> GDP in 2008, 7 while gross<br />
public debt was 5.2 percent that same year. The government became a net credi<strong>to</strong>r<br />
<strong>to</strong> <strong>the</strong> rest <strong>of</strong> <strong>the</strong> world (Figure 12.5), which allowed Chile <strong>to</strong> implement one <strong>of</strong> <strong>the</strong><br />
largest fiscal expansions (relative <strong>to</strong> <strong>the</strong> size <strong>of</strong> <strong>the</strong> economy) in <strong>the</strong> world during <strong>the</strong><br />
Great Recession. Toward 2010 <strong>the</strong> government’s net credi<strong>to</strong>r position declined,<br />
since it used part <strong>of</strong> its sovereign wealth fund <strong>to</strong> finance <strong>the</strong> fiscal expansion.<br />
However, <strong>to</strong> attribute a major stabilization effect solely <strong>to</strong> <strong>the</strong> introduction <strong>of</strong><br />
<strong>the</strong> fiscal rule would be questionable. Indeed, Chile had run a prudent fiscal<br />
policy since <strong>the</strong> mid-1980s. Figure 12.6 shows that from <strong>the</strong> mid-1980s <strong>to</strong> <strong>the</strong><br />
Asian crisis in <strong>the</strong> late 1990s, Chile had an effective fiscal surplus every year,<br />
although in <strong>the</strong> late 1980s <strong>the</strong>re was a deficit in structural terms. The structural<br />
surplus had been very stable until <strong>the</strong> Asian crisis, when it did become negative,<br />
and <strong>the</strong>n again when it became negative during <strong>the</strong> Great Recession. A countercyclical<br />
fiscal policy is expected <strong>to</strong> reduce a structural balance during recessions<br />
and <strong>to</strong> increase it during expansions, so most <strong>of</strong> <strong>the</strong> time <strong>the</strong> fiscal policy was<br />
fairly acyclical, except in <strong>the</strong> two recessionary periods <strong>of</strong> <strong>the</strong> last 25 years.<br />
To look more closely at <strong>the</strong> cyclical properties <strong>of</strong> fiscal policy, Figures 12.7 and<br />
12.8 present correlations <strong>of</strong> <strong>the</strong> cyclical component <strong>of</strong> government expenditure<br />
with <strong>the</strong> cyclical components <strong>of</strong> output and copper prices, respectively. Although<br />
<strong>the</strong> correlation—for ten- and twenty-year rolling windows—between <strong>the</strong> cyclical<br />
components <strong>of</strong> GDP and government expenditure is not stable, its value started<br />
declining <strong>to</strong> negative magnitudes around <strong>the</strong> early 1990s. On average, for <strong>the</strong><br />
1990s, <strong>the</strong> correlation decreases <strong>to</strong> half <strong>of</strong> its his<strong>to</strong>rical value. Despite a positive comovement<br />
<strong>to</strong>ward 1997–98, since <strong>the</strong> second half <strong>of</strong> <strong>the</strong> 1980s <strong>the</strong> correlation<br />
shows a downward-sloping trend. It is worth mentioning <strong>the</strong> dramatic decrease<br />
Figure 12.5<br />
Public debt,1999–2010<br />
(central government)<br />
Percent <strong>of</strong> GDP<br />
50<br />
40<br />
30<br />
20<br />
10<br />
0<br />
-10 10<br />
-20<br />
-30<br />
1990 1992 1994 1996 1998 2000 2002 2004 2006 2008 2010<br />
Gross Debt Net Debt<br />
Source: Budget agency, Ministry <strong>of</strong> Finance (DIPRES).<br />
Note: Gross debt corresponds <strong>to</strong> <strong>to</strong>tal financial liabilities (external and internal) <strong>of</strong><br />
<strong>the</strong> central goverment. Net debt corresponds <strong>to</strong> <strong>the</strong> gross debt minus <strong>to</strong>tal financial<br />
assets (external and internal) <strong>of</strong> <strong>the</strong> central goverment.<br />
7 Two funds were created: <strong>the</strong> reserve fund for pensions and <strong>the</strong> economic and social stabilization fund.<br />
We refer two both as <strong>the</strong> sovereign wealth fund. There are also two additional, smaller funds, <strong>the</strong> oil<br />
stabilization fund and <strong>the</strong> infrastructure fund.<br />
©International Monetary Fund. Not for Redistribution
Figure 12.6<br />
Fiscal balance and real price <strong>of</strong> copper, 1987–2008<br />
Percent <strong>of</strong> GDP<br />
9<br />
6<br />
3<br />
0<br />
-3<br />
-6<br />
1987 1990 1993 1996 1999 2002 2005 2008<br />
8<br />
6<br />
4<br />
2<br />
0<br />
-2<br />
-4<br />
Effective Structural Copper<br />
-6<br />
0<br />
1987 1989 1991 1993 1995 1997 1999 2001 2003 2005 2007 2009<br />
Effective Structural Copper<br />
Sources: The Chilean Copper Commission (CoChilco); Ministry <strong>of</strong> Finance, Chile.<br />
Gregorio and Labbé 211<br />
during <strong>the</strong> last years <strong>of</strong> <strong>the</strong> sample—close <strong>to</strong> –0.8 for <strong>the</strong> period between 2001 and<br />
2010—this is mainly associated with <strong>the</strong> fiscal expansion during <strong>the</strong> global crisis.<br />
As Frankel, Végh, and Vuletin (2011) highlight, Chile has successfully implemented<br />
a countercyclical fiscal policy since it has been able <strong>to</strong> overcome <strong>the</strong> his<strong>to</strong>rical procyclicality.<br />
For <strong>the</strong> period 2000–09 <strong>the</strong>se authors find a negative correlation close <strong>to</strong><br />
–0.7, which contrasts with <strong>the</strong> 0.3 correlation found for <strong>the</strong> period 1960–99.<br />
During <strong>the</strong> 1990s <strong>the</strong>re was no explicit rule for fiscal policy, despite <strong>the</strong> fact that<br />
<strong>the</strong> policy generated surpluses almost every year. In order <strong>to</strong> contain a large expansion<br />
<strong>of</strong> government expenditure, especially during <strong>the</strong> transition from <strong>the</strong> military<br />
regime <strong>to</strong> democracy, <strong>the</strong> budget was designed with an implicit commitment <strong>to</strong><br />
expand government expenditure no more than <strong>the</strong> expected growth in output. This<br />
may have induced some moderate procyclicality in government expenditure.<br />
What is interesting about this evidence is <strong>the</strong> negative correlation between<br />
government expenditure and copper prices. This evidence implies that fiscal policy<br />
©International Monetary Fund. Not for Redistribution<br />
350<br />
300<br />
250<br />
200<br />
150<br />
100<br />
50<br />
0<br />
350<br />
300<br />
250<br />
200<br />
150<br />
100<br />
50<br />
2005 U.S. cents per pound
212 Copper, <strong>the</strong> Real Exchange Rate and Macroeconomic Fluctuations in Chile<br />
Figure 12.7<br />
Correlation between <strong>the</strong> cyclical components <strong>of</strong> real<br />
GDP and real government expenditure<br />
10-year rolling window 20-year rolling window<br />
1<br />
1<br />
.8<br />
.8<br />
.6<br />
.6<br />
.4<br />
.4<br />
.2<br />
.2<br />
0<br />
0<br />
-.2<br />
-.2<br />
-.4<br />
-.4<br />
-.6<br />
-.6<br />
-.8<br />
-.8<br />
1970 1980 1990 2000 2010 1970 1980 1990 2000 2010<br />
Sources: Díaz, Lüders, and Wagner (2010); and IMF, World Economic Outlook (April<br />
2011).<br />
Note: For each year, <strong>the</strong> graphs show <strong>the</strong> resulting correlation with <strong>the</strong> data<br />
contained in a window bounded by <strong>the</strong> current year and <strong>the</strong> k – 1previous years,<br />
bounds included. Cyclical components are calculated by first transforming <strong>the</strong><br />
variables in log and <strong>the</strong>n subtracting <strong>the</strong> trending component which is defined by<br />
an HP filter. Real government expenditure corresponds <strong>to</strong> <strong>the</strong> nominal <strong>to</strong>tal central<br />
government expenditure deflated by <strong>the</strong> GDP defla<strong>to</strong>r. For trend estimate purposes,<br />
by using projections from <strong>the</strong> World Economic Outlook, <strong>the</strong> data is projected until<br />
2016. During <strong>the</strong> second half <strong>of</strong> <strong>the</strong> 1990s, output and <strong>to</strong>tal government expenditure<br />
have a short period <strong>of</strong> positive co-movement which attains its maximal value for<br />
<strong>the</strong> years 1997–98.<br />
leans against <strong>the</strong> wind regarding copper prices (Figure 12.8). In moments <strong>of</strong> rising<br />
copper prices, fiscal expenditure tends <strong>to</strong> slow down. This negative—or zero—correlation<br />
has been in <strong>the</strong> data even for periods prior <strong>to</strong> <strong>the</strong> 1980s, although <strong>to</strong> a<br />
lesser extent. In 1985, a copper stabilization fund was introduced in <strong>the</strong> context <strong>of</strong><br />
an IMF program that was implemented after <strong>the</strong> debt crisis. His<strong>to</strong>rically, <strong>the</strong><br />
negative correlation was oscillating—from a long-term perspective—between values<br />
from –0.4 <strong>to</strong> –0.2 until <strong>the</strong> early 1990s, and <strong>the</strong>n it becomes increasingly<br />
negative with <strong>the</strong> run-up <strong>of</strong> <strong>the</strong> copper price <strong>to</strong> its current record levels.<br />
The existing empirical evidence showing <strong>the</strong> fiscal rule’s strong stabilization<br />
effect is based on a comparison with a counterfactual exercise <strong>of</strong> a balancedbudget<br />
rule. Indeed, if <strong>the</strong>re were a balanced budget rule <strong>the</strong> business cycle would<br />
be substantially more volatile (as shown in Medina and So<strong>to</strong>, 2007a, and<br />
Céspedes, Gali, and Fornero, 2010). However, <strong>the</strong> counterfactual has never been<br />
<strong>the</strong> actual framework used for fiscal policy, and it is at odds with <strong>the</strong> negative<br />
correlation between copper prices and government expenditure.<br />
O<strong>the</strong>r evidence has used a dummy <strong>to</strong> separate <strong>the</strong> periods with <strong>the</strong> rule from<br />
those without <strong>the</strong> rule (Larraín and Parro, 2008), but <strong>the</strong> evidence on fiscal<br />
prudence reported here shows that <strong>the</strong>re was no significant break in <strong>the</strong> actual<br />
©International Monetary Fund. Not for Redistribution
Figure 12.8<br />
Correlation between <strong>the</strong> cyclical components <strong>of</strong> real<br />
price <strong>of</strong> copper and real government expenditure<br />
10-year rolling window 20-year rolling window<br />
.2<br />
.2<br />
.1<br />
.1<br />
0<br />
0<br />
-.1<br />
-.1<br />
-.2<br />
-.2<br />
-.3<br />
-.3<br />
-.4<br />
-.4<br />
-.5<br />
-.5<br />
-.6<br />
-.6<br />
-.7<br />
-.7<br />
-.8<br />
-.8<br />
-.9<br />
-.9<br />
1970 1980 1990 2000 2010 1970 1980 1990 2000 2010<br />
Sources: Díaz, Lüders, and Wagner (2010); and IMF, World Economic Outlook<br />
(April 2011).<br />
Note: For each year, <strong>the</strong> graphs show <strong>the</strong> resulting correlation with <strong>the</strong> data<br />
contained in a window bounded by <strong>the</strong> current year and <strong>the</strong> k – 1previous years,<br />
bounds included. Cyclical components are calculated by first transforming <strong>the</strong><br />
variables in log and <strong>the</strong>n subtracting <strong>the</strong> trending component which is defined by<br />
an HP filter. Real government expenditure corresponds <strong>to</strong> <strong>the</strong> nominal <strong>to</strong>tal central<br />
government expenditure deflated by <strong>the</strong> GDP defla<strong>to</strong>r. For trend estimate purposes,<br />
by using projections from <strong>the</strong> World Economic Outlook, <strong>the</strong> data is projected until<br />
2016.<br />
Gregorio and Labbé 213<br />
behavior <strong>of</strong> fiscal policy in <strong>the</strong> early years <strong>of</strong> this century. Indeed, by that time<br />
<strong>the</strong>re were also important changes in monetary policy. A full inflation target was<br />
introduced, monetary policy became instrumented with <strong>the</strong> nominal interest rate,<br />
<strong>the</strong> capital account was open, and <strong>the</strong> exchange rate was allowed <strong>to</strong> float. There<br />
were important changes in <strong>the</strong> whole macroeconomic regime.<br />
Overall, despite a his<strong>to</strong>rically conservative fiscal policy, <strong>the</strong> budget rule <strong>of</strong> <strong>the</strong><br />
2000s was central <strong>to</strong> avoid an extreme expansion associated with soaring copper<br />
prices. Fiscal revenues were, on average, 21 percent <strong>of</strong> GDP during 2000–04 and<br />
went up <strong>to</strong> 26 percent, on average, in 2007–08. At <strong>the</strong> same time, <strong>the</strong> average<br />
contribution <strong>of</strong> CODELCO <strong>to</strong> fiscal revenues was only 5 percent during 2000–04,<br />
rising <strong>to</strong> 19 percent in 2007–08. In this latter period, <strong>the</strong> contribution <strong>of</strong> private<br />
copper companies was 12 percent <strong>of</strong> <strong>to</strong>tal revenues. Thus, copper accounted for<br />
almost a third <strong>of</strong> <strong>to</strong>tal revenues. Contrary <strong>to</strong> <strong>the</strong> experience almost a hundred years<br />
ago, when most taxes were replaced by <strong>the</strong> windfall <strong>of</strong> nitrates, fiscal responsibility<br />
was reinforced with <strong>the</strong> fiscal rule applied in <strong>the</strong> last decade.<br />
ECONOMIC FLUCTUATIONS AND THE COPPER CYCLE<br />
The copper price was his<strong>to</strong>rically an important driver <strong>of</strong> <strong>the</strong> business cycle in Chile,<br />
although its effects have changed over time. It is an important component <strong>of</strong> <strong>the</strong> terms<br />
©International Monetary Fund. Not for Redistribution
214 Copper, <strong>the</strong> Real Exchange Rate and Macroeconomic Fluctuations in Chile<br />
<strong>of</strong> trade, with consequent income and substitution effects on demand, and it also plays<br />
an important role in public finances. Therefore, it remains one <strong>of</strong> <strong>the</strong> driving forces <strong>of</strong><br />
<strong>the</strong> Chilean business cycle. In <strong>the</strong> late 1980s, <strong>the</strong> Chilean economy entered in<strong>to</strong> a<br />
regime characterized by moderate fluctuations, and it is important <strong>to</strong> examine whe<strong>the</strong>r<br />
this new regime has also changed <strong>the</strong> way copper affects <strong>the</strong> economy.<br />
In this section we present empirical evidence on <strong>the</strong> relationship between copper<br />
prices and <strong>the</strong> business cycle. In particular, we show evidence on <strong>the</strong> volatility (standard<br />
deviation) <strong>of</strong> inflation, GDP, and RER. This evidence suggests that since <strong>the</strong><br />
adoption <strong>of</strong> <strong>the</strong> inflation-targeting full flexible exchange rate regime in 1999, <strong>the</strong><br />
response <strong>of</strong> <strong>the</strong> Chilean economy <strong>to</strong> copper price fluctuations has diminished.<br />
The volatility <strong>of</strong> output and inflation in <strong>the</strong> Chilean economy from a longterm<br />
perspective is presented in Table 12.1. Figure 12.9 shows volatility <strong>of</strong> GDP<br />
growth since <strong>the</strong> 1960s. The figure shows that volatility has sharply declined since<br />
TABLE 12.1<br />
Volatilities (percent)<br />
Period<br />
Inflation<br />
1950–2009 1950–1990 1990–2009<br />
Average standard deviation 102.9 119.5 6.5<br />
Average coefficient <strong>of</strong> variation<br />
GDP growth<br />
2.1 1.7 0.9<br />
Average standard deviation 5.0 5.6 3.2<br />
Average coefficient <strong>of</strong> variation<br />
GDP gap<br />
1.2 1.6 0.6<br />
Average standard deviation 5.1 5.9 2.9<br />
Average coefficient <strong>of</strong> variation -85.0 -20.3 15.2<br />
Sources: Díaz, Lüders, and Wagner (2010); and Central Bank <strong>of</strong> Chile.<br />
Figure 12.9<br />
GDP growth volatility, 1960–2010 (10-year rolling<br />
window)<br />
%<br />
9<br />
8<br />
7<br />
6<br />
5<br />
4<br />
3<br />
2<br />
1960 1965 1970 1975 1980 1985 1990 1995 2000 2005 2010<br />
Sources: Díaz, Lüders, and Wagner (2010); and Central Bank <strong>of</strong> Chile.<br />
©International Monetary Fund. Not for Redistribution
Gregorio and Labbé 215<br />
1990. That year marks <strong>the</strong> beginning <strong>of</strong> <strong>the</strong> central bank’s au<strong>to</strong>nomy and <strong>the</strong> first<br />
implementation <strong>of</strong> an inflation-targeting regime, but where <strong>the</strong> inflation target<br />
was set on an annual basis in a path consistent with reducing Chile’s his<strong>to</strong>rical<br />
two-digit inflation rates <strong>to</strong> normal international levels. In addition, during <strong>the</strong><br />
1990s <strong>the</strong> exchange rate regime was based on a band with infrequent adjustment<br />
<strong>of</strong> <strong>the</strong> central rate. For <strong>the</strong> case <strong>of</strong> inflation, its evolution may be contaminated<br />
with <strong>the</strong> very high inflation <strong>of</strong> <strong>the</strong> early 1970s, but <strong>the</strong> decline in volatility is<br />
confirmed by looking at <strong>the</strong> coefficient <strong>of</strong> variation. In addition, <strong>the</strong> decline in<br />
output volatility is also remarkable and consistent with what would be expected<br />
in a credible inflation targeting regime. It is worth highlighting <strong>the</strong> decline in<br />
volatility in <strong>the</strong> 1990s, but what we show in what follows is that <strong>the</strong> response <strong>of</strong><br />
<strong>the</strong> economy <strong>to</strong> copper prices diminished fur<strong>the</strong>r in <strong>the</strong> last decade.<br />
Volatility measures based on quarterly figures are presented in Figure 12.10.<br />
All volatilities are computed using five-year rolling windows. Due <strong>to</strong> data availability,<br />
<strong>the</strong> sample starts in 1985. This figure shows <strong>the</strong> sharp decline in inflation<br />
and GDP volatility from 1990 onwards. In addition, it shows <strong>the</strong> volatility <strong>of</strong> <strong>the</strong><br />
RER, which does not display a clear pattern during <strong>the</strong> last twenty years. This<br />
is not surprising, since a flexible exchange rate regime increases <strong>the</strong> volatility <strong>of</strong><br />
<strong>the</strong> RER in order <strong>to</strong> act as a shock absorber. Regarding copper prices, <strong>the</strong> two<br />
Figure 12.10<br />
Volatilities<br />
(percent, 5-year rolling window)<br />
Percent<br />
Percent<br />
10<br />
8<br />
6<br />
4<br />
11985:Q1<br />
11990:Q1<br />
11995:Q1<br />
2000:Q1 2<br />
22005:Q1<br />
22010:Q1<br />
2<br />
0<br />
16<br />
14<br />
12<br />
10<br />
8<br />
6<br />
4<br />
1985:Q1<br />
1990:Q1<br />
1995:Q1<br />
GDP gap<br />
RER<br />
2000:Q1<br />
2005:Q1<br />
2010:Q1<br />
10<br />
8<br />
6<br />
4<br />
2<br />
0<br />
50<br />
45<br />
40<br />
35<br />
30<br />
25<br />
20<br />
15<br />
10<br />
1985:Q1<br />
GDP growth<br />
1985:Q1 1<br />
1990:Q1 1<br />
1995:Q1 1<br />
2000:Q1 2<br />
2005:Q1 2<br />
2010:Q1 2<br />
Price <strong>of</strong> copper: growth<br />
1990:Q1<br />
1995:Q1<br />
2000:Q1<br />
2005:Q1<br />
2010:Q1<br />
10<br />
8<br />
6<br />
4<br />
2<br />
0<br />
30<br />
25<br />
20<br />
15<br />
10<br />
5<br />
1985:Q1<br />
1990:Q1<br />
Inflation<br />
1985:Q1 1<br />
1990:Q1 1<br />
1995:Q1 1<br />
2000:Q1 2<br />
2005:Q1 2<br />
2010:Q1 2<br />
Price <strong>of</strong> copper: gap<br />
Sources: Central Bank <strong>of</strong> Chile; and IMF, International Finance Statistics.<br />
Note: Gap corresponds <strong>to</strong> a percent deviation from an HP trend. Growth corresponds <strong>to</strong> 12-month percent<br />
changes. Inflation corresponds <strong>to</strong> 12-month CPI percent changes.<br />
©International Monetary Fund. Not for Redistribution<br />
1995:Q1<br />
2000:Q1<br />
2005:Q1<br />
2010:Q1
216 Copper, <strong>the</strong> Real Exchange Rate and Macroeconomic Fluctuations in Chile<br />
measures presented in Figure 12.10 show a sharp increase in volatility since <strong>the</strong><br />
mid-2000s, which coincides with <strong>the</strong> rapid rise in copper prices.<br />
Regarding GDP and inflation, <strong>the</strong> data show that <strong>the</strong> volatility <strong>of</strong> both variables<br />
declined during <strong>the</strong> 2000s, but at <strong>the</strong> end <strong>of</strong> <strong>the</strong> sample <strong>the</strong>re is a significant<br />
increase. This recent period coincides with <strong>the</strong> shock <strong>of</strong> commodity prices that<br />
started in 2007 and <strong>the</strong> subsequent slump caused by <strong>the</strong> subprime crisis.<br />
Indeed, Chile is one <strong>of</strong> <strong>the</strong> countries that experienced <strong>the</strong> sharpest increases in<br />
inflation among emerging economies in <strong>the</strong> run-up <strong>of</strong> commodity prices but also<br />
<strong>the</strong> largest decline since <strong>the</strong> crisis erupted (De Gregorio, 2010). The most remarkable<br />
component <strong>of</strong> <strong>the</strong> inflationary process <strong>of</strong> 2007–08 was how strongly <strong>the</strong><br />
increase in international food prices was transmitted domestically. Inflation rose<br />
from a year-over-year rate <strong>of</strong> 2.6 percent in December 2006 <strong>to</strong> 9.9 percent in<br />
Oc<strong>to</strong>ber 2008, and <strong>the</strong>n declined <strong>to</strong> –2.3 percent in November 2009. This was<br />
largely due <strong>to</strong> Chile’s high degree <strong>of</strong> commercial openness. There are practically<br />
no barriers <strong>to</strong> imports, no widespread protection <strong>of</strong> agriculture, or any large-scale<br />
dis<strong>to</strong>rtions in <strong>the</strong> market pricing mechanism, so changes in external prices are<br />
quickly reflected in <strong>the</strong> domestic market. In fact, at least during <strong>the</strong> greater part<br />
<strong>of</strong> 2007, growing inflation was mostly caused by increasing food prices, ra<strong>the</strong>r<br />
than by a widespread inflationary process. Then <strong>the</strong> inflationary process spread <strong>to</strong><br />
o<strong>the</strong>r prices, which subsequently fell sharply.<br />
Of course, <strong>the</strong> issue is whe<strong>the</strong>r <strong>the</strong> rise in <strong>the</strong> volatility <strong>of</strong> output and inflation<br />
<strong>to</strong>ward <strong>the</strong> end <strong>of</strong> <strong>the</strong> last decade was due <strong>to</strong> <strong>the</strong> greater volatility <strong>of</strong> copper<br />
prices or <strong>to</strong> general international conditions. To explain <strong>the</strong> inflation, it is easy<br />
<strong>to</strong> discard <strong>the</strong> impact <strong>of</strong> copper prices, but for output volatility more evidence<br />
is needed.<br />
It is immediately clear from Figure 12.4 that GDP growth and real annual<br />
copper price changes display some co-movements. Since <strong>the</strong> late 1980s, <strong>the</strong><br />
amplitude <strong>of</strong> economic activity has substantially decreased compared <strong>to</strong> <strong>the</strong> previous<br />
experience. Moreover, for similar amplitude <strong>of</strong> copper price shocks over <strong>the</strong><br />
whole sample, we observe a break in growth amplitude. In fact, as previous figures<br />
show, growth volatility started decreasing in <strong>the</strong> early 1990s.<br />
In order <strong>to</strong> explore <strong>the</strong> relationship between <strong>the</strong> price <strong>of</strong> copper and real GDP<br />
volatility, we calculated <strong>the</strong> standard deviation <strong>of</strong> annual growth over a 10-year<br />
rolling window <strong>of</strong> real GDP ( σ gy)<br />
, real price <strong>of</strong> copper ( σ Pcu ) , and U.S. real GDP<br />
US<br />
σ . Controlling for <strong>the</strong> degree <strong>of</strong> trade openness, we estimated <strong>the</strong> following<br />
( gy )<br />
equation: 8<br />
σ = β + βσ + βσ + βσ + βσ + βx + ε (1)<br />
gy, t 0 1 gy, t−1 2<br />
US<br />
gy, t 3 Poil, t 4 Pcu, t 5 t<br />
8 Using 5-year rolling volatilities does not change <strong>the</strong> results.<br />
©International Monetary Fund. Not for Redistribution
Gregorio and Labbé 217<br />
Variable x is an indica<strong>to</strong>r <strong>of</strong> openness, measured as <strong>the</strong> share <strong>of</strong> exports plus<br />
imports in GDP. 9 The regression was estimated using an expanding window that<br />
starts in 1960. This strategy allows measuring <strong>the</strong> marginal impact <strong>of</strong> years added<br />
<strong>to</strong> <strong>the</strong> sample ra<strong>the</strong>r than changes in <strong>the</strong> results due not only <strong>to</strong> new data, but also<br />
<strong>to</strong> data that are being eliminated, which belong <strong>to</strong> a period with higher volatility. 10<br />
The results for <strong>the</strong> parameter β4 are presented in Figure 12.11. It corresponds<br />
<strong>to</strong> <strong>the</strong> short-term impact <strong>of</strong> <strong>the</strong> volatility <strong>of</strong> copper prices on output volatility.<br />
The results for <strong>the</strong> long-run coefficient ( β4 /1 ( − β1)<br />
) are similar. The figure<br />
shows that indeed <strong>the</strong> fluctuations <strong>of</strong> copper prices in <strong>the</strong> 2000s have reduced<br />
<strong>the</strong>ir effects on output volatility. 11 The point estimate indicates that a 10 percent<br />
increase in copper price volatility increases output volatility by 1 percent. The<br />
increase in volatility observed more recently has <strong>the</strong> result <strong>of</strong> increasing <strong>the</strong> volatility<br />
<strong>of</strong> foreign output and oil prices, ra<strong>the</strong>r than increasing <strong>the</strong> response <strong>of</strong> <strong>the</strong><br />
business cycle <strong>to</strong> copper fluctuations. Figure 12.12 shows actual and fitted volatility<br />
<strong>of</strong> output under two alternatives. The first one uses <strong>the</strong> values estimated with<br />
<strong>the</strong> fitted regression until 1999, and <strong>the</strong> second one with <strong>the</strong> full sample. The<br />
figure shows that <strong>the</strong> implied volatility <strong>of</strong> GDP in Chile would have been much<br />
larger with <strong>the</strong> estimations before <strong>the</strong> implementation <strong>of</strong> <strong>the</strong> inflation-targeting<br />
full flexible exchange rate regime. 12<br />
Figure 12.11<br />
Impact <strong>of</strong> copper price volatility on GDP growth<br />
volatility, 1985–2010<br />
.3<br />
.2<br />
.1<br />
0<br />
−.1<br />
1985 1990 1995 2000 2005 2010<br />
end<br />
± 2 S.D.<br />
Real price <strong>of</strong> copper elasticity<br />
9<br />
O<strong>the</strong>r controls were included, such as mining GDP as a share <strong>of</strong> real GDP and real exports; results<br />
hold including <strong>the</strong>se variables. We also included <strong>the</strong> volatility <strong>of</strong> government expenditure and it was<br />
not significant.<br />
10<br />
Results using a rolling regression are very similar and do not change <strong>the</strong> conclusions.<br />
11<br />
Results are basically <strong>the</strong> same when <strong>the</strong> volatility <strong>of</strong> terms <strong>of</strong> trade is used instead <strong>of</strong> <strong>the</strong> volatility <strong>of</strong><br />
<strong>the</strong> copper price.<br />
12<br />
Larraín and Parro (2008) show that exchange rate flexibility reduces output volatility. They use an<br />
index <strong>of</strong> exchange market intervention using <strong>the</strong> change in reserves, and show that <strong>the</strong> lower this index<br />
is, <strong>the</strong> lower is output volatility.<br />
©International Monetary Fund. Not for Redistribution
218 Copper, <strong>the</strong> Real Exchange Rate and Macroeconomic Fluctuations in Chile<br />
Figure 12.12<br />
Actual and fitted output volatility, 1960–2010<br />
10<br />
8<br />
6<br />
4<br />
2<br />
1960 1970 1980<br />
year<br />
1990 2000 2010<br />
Actual output volatility Fitted values using estimates from 1960 <strong>to</strong> 1999<br />
Fitted values using estimates from1960 <strong>to</strong> 2009<br />
The evidence presented in this section suggests that after <strong>the</strong> implementation<br />
<strong>of</strong> <strong>the</strong> inflation-targeting full flexible exchange rate regime, <strong>the</strong> economy has<br />
become less volatile and more resilient <strong>to</strong> copper price fluctuations.<br />
TERMS-OF-TRADE SHOCKS, REAL EXCHANGE RATE,<br />
AND LONG-RUN DYNAMICS<br />
In t his section we study <strong>the</strong> impact <strong>of</strong> terms <strong>of</strong> trade on <strong>the</strong> RER. This price is<br />
measured as <strong>the</strong> ratio between <strong>the</strong> prices <strong>of</strong> foreign goods (in domestic currency)<br />
and <strong>the</strong> prices <strong>of</strong> domestic goods. Hence, it represents <strong>the</strong> cost <strong>of</strong> foreign goods<br />
in terms <strong>of</strong> domestic goods; a rise in this relative price is a real depreciation.<br />
Figure 12.13 shows <strong>the</strong> evolution <strong>of</strong> <strong>the</strong> price <strong>of</strong> copper, terms <strong>of</strong> trade, and <strong>the</strong><br />
RER. It is clear that <strong>the</strong> terms-<strong>of</strong>-trade shocks have been particularly sizable in <strong>the</strong><br />
last decade, mainly driven by copper price movements; while <strong>the</strong> RER has fluctuated<br />
but moderately with respect <strong>to</strong> export price shocks. 13<br />
There are many approaches for studying RER dynamics, and a model that considers<br />
<strong>the</strong> entire macroeconomic environment would be most desirable. However, here<br />
we follow an eclectic approach; we use a vec<strong>to</strong>r-error correction model introduced by<br />
Johansen (1988). This modeling strategy allows estimating a reduced-form representation<br />
<strong>of</strong> <strong>the</strong> dynamics and interactions between <strong>the</strong> RER and its fundamentals.<br />
This type <strong>of</strong> model has been used by, among o<strong>the</strong>rs, Clark and MacDonald<br />
(1998) for analyzing RER movements and misalignments from <strong>the</strong> RER’s longrun<br />
fundamentals, Céspedes and De Gregorio (1999) used a similar approach<br />
for <strong>the</strong> period before 2000. The approach supposes both a short-run and a longrun<br />
relationship between RER and a set <strong>of</strong> fundamental variables (Table 12.2).<br />
13 Over <strong>the</strong> sample period, <strong>the</strong> price <strong>of</strong> copper and terms <strong>of</strong> trade have a correlation in levels slightly<br />
above 0.9, and were equal <strong>to</strong> 0.67 in quarterly percent changes during <strong>the</strong> period post-2000.<br />
©International Monetary Fund. Not for Redistribution
TABLE 12.2<br />
Figure 12.13<br />
Real exchange rate, terms <strong>of</strong> trade, and price <strong>of</strong><br />
copper, 1977–2010<br />
Index 1996 = 100<br />
210<br />
190<br />
170<br />
150<br />
130<br />
110<br />
90<br />
70<br />
50<br />
Cointegration rank test<br />
2007:Q1<br />
2004:Q1<br />
2001:Q1<br />
1998:Q1<br />
1995:Q1<br />
1992:Q1<br />
1989:Q1<br />
1986:Q1<br />
1983:Q1<br />
1980:Q1<br />
1977:Q1<br />
Terms <strong>of</strong> trade RER Price <strong>of</strong> copper (right axis)<br />
Source: Capu<strong>to</strong>, Núñez, and Valdés, 2010.<br />
Gregorio and Labbé 219<br />
400<br />
350<br />
300<br />
250<br />
200<br />
150<br />
100<br />
50<br />
0<br />
The long-run cointegrating relationship implicit in this approach is interpreted as<br />
<strong>the</strong> fact that <strong>the</strong>se variables move <strong>to</strong>ge<strong>the</strong>r in <strong>the</strong> long run. The adjustment <strong>of</strong> <strong>the</strong><br />
RER <strong>to</strong> changes in fundamentals is gradual. The relationship implied by economic<br />
<strong>the</strong>ory does not necessarily hold at short frequencies, but in <strong>the</strong> long term<br />
RER moves according <strong>to</strong> its fundamentals.<br />
Hence, in this framework <strong>the</strong> RER is consistent with a long-run equilibrium<br />
condition on <strong>the</strong> balance <strong>of</strong> payments, which is determined by a set <strong>of</strong> fundamental<br />
variables. These fundamentals could be listed by domestic and foreign key<br />
variables. Following Faruqee (1995), <strong>the</strong>se variables can be summarized according<br />
<strong>to</strong> <strong>the</strong> two different channels through which <strong>the</strong>y affect <strong>the</strong> RER. One set <strong>of</strong><br />
fundamentals includes those related <strong>to</strong> <strong>the</strong> current account (according <strong>to</strong> trade<br />
conditions) and <strong>the</strong> o<strong>the</strong>r is related <strong>to</strong> <strong>the</strong> capital account (according <strong>to</strong> <strong>the</strong> net<br />
foreign assets position). Regarding trade, <strong>the</strong> variables are relative productivity<br />
between tradables and nontradables (according <strong>to</strong> <strong>the</strong> well-known Balassa–<br />
Samuelson effect), government expenditure, and terms <strong>of</strong> trade. Regarding <strong>the</strong><br />
capital account, <strong>the</strong> variable we use is <strong>the</strong> net foreign assets position, which summarizes<br />
<strong>the</strong> country’s propensity <strong>to</strong> be a net lender or a net deb<strong>to</strong>r.<br />
The variable TNT is <strong>the</strong> productivity ratio between <strong>the</strong> tradable and <strong>the</strong> nontradable<br />
sec<strong>to</strong>rs. This ratio summarizes <strong>the</strong> Balassa–Samuelson effect, and has a<br />
negative impact on <strong>the</strong> RER. With labor mobility, equal wages across sec<strong>to</strong>rs, and<br />
2010:Q1<br />
Null hypo<strong>the</strong>sis Eigenvalue Trace-Statistic Critical Value p-val<br />
None * 0.33 97.97 69.82 0.00<br />
At most 1 0.17 46.69 47.86 0.06<br />
At most 2 0.09 21.72 29.80 0.31<br />
At most 3 0.06 9.33 15.49 0.34<br />
At most 4 0.01 1.42 3.84 0.23<br />
Note: The VECM has no trend and an unrestricted constant, <strong>the</strong> underlying VAR has 3 lags. (*) means rejection<br />
<strong>of</strong> <strong>the</strong> null hypo<strong>the</strong>sis at 95% <strong>of</strong> confidence.<br />
©International Monetary Fund. Not for Redistribution<br />
U.S. cents per pound
220 Copper, <strong>the</strong> Real Exchange Rate and Macroeconomic Fluctuations in Chile<br />
purchasing power parity (PPP) for tradable goods, an increase in <strong>the</strong> productivity<br />
<strong>of</strong> <strong>the</strong> tradable sec<strong>to</strong>r induces an increase in wages in <strong>the</strong> nontradable sec<strong>to</strong>r (De<br />
Gregorio, Giovannini, and Wolf, 1994). This increase in wages in <strong>the</strong> nontradable<br />
sec<strong>to</strong>r leads <strong>to</strong> an increase in costs (and relative prices) in <strong>the</strong> nontradable goods.<br />
Hence, with such a mechanism <strong>the</strong> RER tends <strong>to</strong> appreciate.<br />
The variable ToT has a negative impact on <strong>the</strong> RER, that is, it generates a real<br />
appreciation. An increase in ToT produces an income effect and raises demand for<br />
both tradable and nontradable goods. Since prices <strong>of</strong> tradable goods are externally<br />
determined, an increase in <strong>the</strong> terms <strong>of</strong> trade raises <strong>the</strong> relative price <strong>of</strong> nontradable<br />
goods. The variable (G/Y) is <strong>the</strong> ratio <strong>of</strong> government expenditure <strong>to</strong> GDP,<br />
which has also a negative impact on <strong>the</strong> RER under <strong>the</strong> assumption that most <strong>of</strong><br />
government expenditure goes <strong>to</strong> nontradable goods. Finally, as a s<strong>to</strong>ck variable,<br />
we include <strong>the</strong> net foreign asset position as a percentage <strong>of</strong> GDP (F/Y). This variable<br />
has a negative impact on <strong>the</strong> RER. In fact, an increase in foreign assets is<br />
consistent, from an intertemporal point <strong>of</strong> view, with a lower sustainable level <strong>of</strong><br />
net exports, which induces an RER appreciation. Hence, we estimate <strong>the</strong> following<br />
equation:<br />
log ( RER ) = β + βTNT+ β ToT + β ( G / Y ) + β ( F / Y ) ε (2)<br />
t 0 1 2 1 3 t 4<br />
t t<br />
We follow <strong>the</strong> traditional vec<strong>to</strong>r-error correction model procedure and estimate a<br />
vec<strong>to</strong>r error correction representation with one long-run relationship and two<br />
lags, as described by this equation (3): 14<br />
p=<br />
1<br />
Δ y = c+ αβ y + ∑ δ Δ y + u<br />
(3)<br />
t t−1i t−i i<br />
i=<br />
1<br />
where yt is a vec<strong>to</strong>r, such as yt ( ToT TNT ( F / Y)( G/ Y) RER ) ′<br />
= , and all variables are<br />
in log except government expenditure and net foreign assets. We estimate <strong>the</strong><br />
system represented in equation (3) using data from 1977:Q1 <strong>to</strong> 2010:Q3. This<br />
type <strong>of</strong> reduced-form model allows us <strong>to</strong> analyze <strong>the</strong> path <strong>of</strong> <strong>the</strong> RER after a<br />
permanent terms-<strong>of</strong>-trade shock.<br />
We <strong>the</strong>n estimate equation (3) splitting up <strong>the</strong> sample period in 1999 (see<br />
Table 12.3). September this year corresponds <strong>to</strong> <strong>the</strong> beginning <strong>of</strong> <strong>the</strong> inflationtargeting<br />
full flexible exchange rate regime. By that time, <strong>the</strong> inflation-targeting<br />
framework in Chile had been operating for almost a decade, though with a yearly<br />
target, <strong>the</strong>re were capital controls, <strong>the</strong>re was a currency regime based on exchange<br />
rate bands. Since 2000 <strong>the</strong> peso has floated according <strong>to</strong> a flexible regime where<br />
interventions have occurred sporadically, according <strong>to</strong> a rule-based scheme, <strong>to</strong><br />
preserve monetary policy independence.<br />
Results presented in Figure 12.14 show <strong>the</strong> response in levels <strong>of</strong> <strong>the</strong> RER <strong>to</strong><br />
an orthogonalized permanent terms-<strong>of</strong>-trade shock. As <strong>the</strong> RER is in log and<br />
multiplied by 100, <strong>the</strong> level attained after <strong>the</strong> shock can be directly interpreted as<br />
a percent change from <strong>the</strong> initial equilibrium. The contemporaneous effect is<br />
14 For fur<strong>the</strong>r details see Appendix A.<br />
©International Monetary Fund. Not for Redistribution
TABLE 12.3<br />
VECM estimates<br />
1977:Q1–1999:Q2 1999:Q3–2010:Q3<br />
D(ToT)_t D(TNT)_t D(F/Y)_t D(G/Y)_t D(TCR)_t D(ToT)_t D(TNT)_t D(F/Y)_t D(G/Y)_t D(TCR)_t<br />
Z(t-1) -0.06 -0.06*** 0.30*** -0.03** -0.06** Z(t-1) 0.95*** 0.04 1.07** -0.13*** -0.37*<br />
(0.04) (0.02) (0.06) (0.01) (0.03) (0.26) (0.10) (0.44) (0.03) (0.22)<br />
D(ToT)_t-1 -0.22** 0.05 -0.43*** -0.02 0.12* D(ToT)_t-1 -0.44 -0.12 -1.18** 0.09*** 0.08<br />
(0.10) (0.06) (0.15) (0.04) (0.06) (0.29) (0.11) (0.48) (0.03) (0.23)<br />
D(ToT)_t-2 -0.22** 0.05 0.60*** -0.02 0.05 D(ToT)_t-2 -0.99*** 0.04 -0.07 0.07** 0.21<br />
(0.10) (0.06) (0.16) (0.04) (0.07) (0.30) (0.11) (0.50) (0.03) (0.24)<br />
D(TNT)_t-1 -0.05 -0.21** -0.43 -0.10 0.11 D(TNT)_t-1 0.41 -0.32* 0.02 -0.02 0.42<br />
(0.18) (0.10) (0.27) (0.07) (0.11) (0.43) (0.17) (0.73) (0.04) (0.35)<br />
D(TNT)_t-2 -0.03 0.15* -0.41* -0.08 -0.08 D(TNT)_t-2 -0.44 -0.20 0.10 -0.00 0.51<br />
(0.16) (0.09) (0.24) (0.06) (0.10) (0.43) (0.17) (0.73) (0.04) (0.35)<br />
D(F/Y)_t-1 -0.03 0.03 -0.30*** 0.01 0.04 D(F/Y)_t-1 0.04 0.03 0.24 -0.03** -0.08<br />
(0.08) (0.04) (0.12) (0.03) (0.05) (0.12) (0.05) (0.21) (0.01) (0.10)<br />
D(F/Y)_t-2 0.35*** -0.04 -0.12 -0.00 0.02 D(F/Y)_t-2 0.31** -0.06 0.32 -0.01 -0.08<br />
(0.07) (0.04) (0.10) (0.02) (0.04) (0.13) (0.05) (0.22) (0.01) (0.11)<br />
D(G/Y)_t-1 0.07 0.78*** -0.01 -0.60*** 0.30 D(G/Y)_t-1 -0.87 -0.99** -1.16 -0.04 -0.42<br />
(0.29) (0.17) (0.43) (0.11) (0.18) (1.24) (0.48) (2.08) (0.13) (1.01)<br />
D(G/Y)_t-2 0.52 0.10 0.30 -0.16 0.03 D(G/Y)_t-2 0.57 -0.53 2.83 0.17 -0.68<br />
(0.32) (0.19) (0.48) (0.12) (0.20) (1.22) (0.47) (2.04) (0.13) (0.99)<br />
D(TCR)_t-1 -0.18 -0.02 0.27 0.03 0.45*** D(TCR)_t-1 -0.24 0.02 -0.13 0.04* -0.05<br />
(0.18) (0.10) (0.27) (0.07) (0.11) (0.22) (0.08) (0.37) (0.02) (0.18)<br />
D(TCR)_t-2 0.38** -0.20** 0.38 -0.20*** 0.02 D(TCR)_t-2 -0.12 -0.14* 0.36 0.05** -0.41**<br />
(0.17) (0.10) (0.26) (0.06) (0.11) (0.21) (0.08) (0.35) (0.02) (0.17)<br />
Constant -0.00 0.00 -0.00 -0.00 -0.00 Constant 0.00 0.01 0.00 0.00** 0.01<br />
(0.01) (0.00) (0.01) (0.00) (0.00) (0.01) (0.00) (0.02) (0.00) (0.01)<br />
Coint vec<strong>to</strong>r 0.57 1.07 0.25 -0.50 1 Coint vec<strong>to</strong>r 3.83 -0.81 -1.57 21.17 1<br />
SE <strong>of</strong> CV 0.22 0.22 0.04 0.51 ---- SE <strong>of</strong> CV 0.54 1.22 0.22 3.01 ----<br />
N 87 87 87 87 87 N 45 45 45 45 45<br />
R2 0.36 0.44 0.48 0.56 0.39 R 2<br />
0.46 0.40 0.42 0.65 0.35<br />
Note: Z(t-1) denotes <strong>the</strong> lagged cointegration residual. CV denotes <strong>the</strong> cointegration vec<strong>to</strong>r, and SE denotes standard errors. *, **, and *** indicate significance at 5%, 10%, and 1%, respectively.<br />
©International Monetary Fund. Not for Redistribution<br />
Gregorio and Labbé 221
222 Copper, <strong>the</strong> Real Exchange Rate and Macroeconomic Fluctuations in Chile<br />
Figure 12.14<br />
Log RER response <strong>to</strong> 100 percent orthogonal<br />
terms-<strong>of</strong>-trade shock<br />
Percent<br />
0<br />
-10<br />
-20<br />
-30<br />
-40<br />
-50<br />
-60<br />
0 10 20<br />
Quarters<br />
30 40<br />
Before 1999:Q3 After 1999:Q2<br />
larger in <strong>the</strong> period post-1999; it varies from –20 <strong>to</strong> –30 percent, respectively.<br />
This result is consistent with <strong>the</strong> expected response <strong>of</strong> a flexible exchange rate<br />
regime where external shocks are directly absorbed by <strong>the</strong> nominal exchange rate.<br />
In <strong>the</strong> model with pre-1999 estimates, <strong>the</strong> RER starts appreciating sharply three<br />
quarters after <strong>the</strong> shock. After two years, <strong>the</strong> real appreciation is greater than <strong>the</strong><br />
one that resulted from <strong>the</strong> post-1999 estimates. When <strong>the</strong> effect <strong>of</strong> <strong>the</strong> shock<br />
stabilizes, <strong>the</strong> equilibrium RER reached with pre-1999 estimates is more overvalued<br />
than this one reached with post-1999 estimates.<br />
This result points out that during <strong>the</strong> period <strong>of</strong> inflation-targeting full flexible<br />
exchange rate regime, terms-<strong>of</strong>-trade permanent shocks have more immediate<br />
effects on <strong>the</strong> RER but are smaller in <strong>the</strong> long run. During <strong>the</strong> period <strong>of</strong><br />
exchange rate bands <strong>the</strong> effects <strong>of</strong> copper price shocks are more gradual, but<br />
deeper. In fact, as we can see in Table 12.3, <strong>the</strong> adjustment parameter <strong>of</strong> longrun<br />
RER disequilibrium has increased (in absolute terms) from –0.06 <strong>to</strong> –0.37<br />
during <strong>the</strong> period post-1999. That means that a higher share <strong>of</strong> lagged RER<br />
disequilibrium is corrected every period in <strong>the</strong> vec<strong>to</strong>r-error correction model<br />
system. RER fluctuations converge more quickly <strong>to</strong> <strong>the</strong> RER’s long run equilibrium<br />
after a permanent shock.<br />
These results show that in a flexible exchange rate regime, <strong>the</strong> exchange rate<br />
acts as a shock absorber. Of course, it is not free <strong>of</strong> costs when <strong>the</strong> exchange rate<br />
adjustment is faster, but <strong>the</strong> final level is less affected. This evidence points<br />
<strong>to</strong>ward a more efficient mechanism for transmission <strong>of</strong> external shocks. External<br />
shocks are primarily absorbed by <strong>the</strong> nominal exchange rate and <strong>the</strong>n directly<br />
transmitted <strong>to</strong> <strong>the</strong> RER. A fully flexible nominal exchange rate regime is sometimes<br />
associated with higher short-run volatility, although that volatility does<br />
not necessarily imply greater long-run uncertainty. Hence, nominal exchange<br />
rate flexibility need not always be associated with long-run real costs related <strong>to</strong><br />
©International Monetary Fund. Not for Redistribution
Gregorio and Labbé 223<br />
more volatility. 15 In <strong>the</strong> next section we analyze more deeply <strong>the</strong> issue <strong>of</strong> volatility<br />
<strong>of</strong> <strong>the</strong> RER at different horizons.<br />
Short-term volatility can be hedged with developed forward markets, while<br />
price signals are transmitted more quickly <strong>to</strong> <strong>the</strong> economy. Moreover, as discussed<br />
in De Gregorio and Tokman (2005), <strong>the</strong> implementation <strong>of</strong> <strong>the</strong> floating exchange<br />
rate regime has motivated <strong>the</strong> proliferation <strong>of</strong> a deeper exchange rate derivative<br />
market. At <strong>the</strong> onset <strong>of</strong> <strong>the</strong> flexible currency regime in 1999, <strong>the</strong> <strong>to</strong>tal amount <strong>of</strong><br />
both local and foreign-derivative contracts represented 1.7 times GDP, and 10<br />
years later this ratio increased <strong>to</strong> nearly 3.7. Additionally, <strong>the</strong>re has been a reduction<br />
in balance sheet vulnerabilities. The corporate sec<strong>to</strong>r has eliminated its<br />
exposure <strong>to</strong> nominal exchange rate fluctuations. A flexible exchange rate reduces<br />
financial imbalances stemming from exchange rate fluctuations.<br />
MACROECONOMIC FLUCTUATIONS AND REAL<br />
EXCHANGE RATE VOLATILITY<br />
Since <strong>the</strong> peso has been allowed <strong>to</strong> float its volatility has increased. 16 External shocks<br />
are in part directly transmitted <strong>to</strong> <strong>the</strong> Chilean economy through nominal exchange<br />
rate fluctuations which affect, among o<strong>the</strong>r variables, <strong>the</strong> RER and economic decisions.<br />
Since <strong>the</strong> RER is a relative price that in <strong>the</strong> long run leads allocation <strong>of</strong><br />
resources, it is important <strong>to</strong> examine how RER volatility has been affected.<br />
A fully flexible nominal exchange rate policy implies a rise in <strong>the</strong> speed and number<br />
<strong>of</strong> channels through which <strong>the</strong> economy is hit by external shocks. Moreover, in a<br />
sticky-prices world we can argue that a considerable part <strong>of</strong> RER fluctuations are<br />
caused by nominal exchange rate movements, at least in <strong>the</strong> short run.<br />
Nominal exchange rate flexibility contributes <strong>to</strong> smooth external fluctuations.<br />
In fact, when external shocks hit <strong>the</strong> economy this price moves freely instead <strong>of</strong><br />
staying fixed and generating imbalances, misalignments, or fur<strong>the</strong>r costly real<br />
adjustments. Thus, corrections occur through <strong>the</strong> price mechanism and not<br />
through quantities. Real effects should be reduced, as a traditional Mundell–<br />
Fleming analysis would imply.<br />
However, <strong>the</strong> RER absorbs real shocks and as a relative price it moves in order<br />
<strong>to</strong> convey information that, in part, leads <strong>to</strong> changes in <strong>the</strong> allocation <strong>of</strong> resources<br />
between <strong>the</strong> tradable and <strong>the</strong> nontradable sec<strong>to</strong>rs. In <strong>the</strong> economy, for <strong>the</strong> sake <strong>of</strong><br />
minimizing real costs, it is a crucial condition that relative prices must not be<br />
dis<strong>to</strong>rted. It is not entirely clear whe<strong>the</strong>r <strong>the</strong> increased nominal exchange<br />
rate volatility that we have been experiencing since <strong>the</strong> early 2000s is not dis<strong>to</strong>rting<br />
and inefficiently transmitted <strong>to</strong> <strong>the</strong> RER, a key relative price. To answer this<br />
15 In <strong>the</strong> context <strong>of</strong> an appreciation due <strong>to</strong> a boom in <strong>the</strong> price <strong>of</strong> natural resources, welfare costs are<br />
different across sec<strong>to</strong>rs. The stabilization <strong>of</strong> <strong>the</strong> exchange rate generates welfare gains in <strong>the</strong> tradable<br />
goods sec<strong>to</strong>rs, but with costs <strong>of</strong> inefficiency that in general may outweigh <strong>the</strong> gains. For a formal<br />
analysis and calibration <strong>of</strong> this problem see Lama and Medina (2010).<br />
16 During <strong>the</strong> 2000s, <strong>the</strong> standard deviation <strong>of</strong> four quarter percent changes has more than doubled<br />
compared with its average during <strong>the</strong> 1990s; it has increased from 2 percent <strong>to</strong> 4.6 percent.<br />
©International Monetary Fund. Not for Redistribution
224 Copper, <strong>the</strong> Real Exchange Rate and Macroeconomic Fluctuations in Chile<br />
Figure 12.15<br />
Real exchange rate, 1985–2010<br />
index, 1986 = 100<br />
115<br />
110<br />
105<br />
100<br />
95<br />
90<br />
85<br />
80<br />
75<br />
1985:Q1 1990:Q1 1995:Q1 2000:Q1 2005:Q1 2010:Q1<br />
Source: Central Bank <strong>of</strong> Chile.<br />
question, it is fundamental <strong>to</strong> understand how nominal and real shocks are transmitted<br />
<strong>to</strong> <strong>the</strong> RER. Since short- and long-run RER movements have different<br />
implications, a central question is how short- and long-run RER volatility have<br />
behaved in <strong>the</strong> face <strong>of</strong> higher nominal exchange rate volatility.<br />
For <strong>the</strong> 1990s, So<strong>to</strong> (2003), using a Blanchard–Quah approach, estimated<br />
that 30 percent <strong>of</strong> <strong>the</strong> short-run variance <strong>of</strong> RER forecast errors is explained by<br />
nominal shocks. However, it remains unanswered how short- and long-run RER<br />
volatility have been affected during <strong>the</strong> last 25 years.<br />
Short-run RER fluctuations do not have <strong>the</strong> same implications that long-run<br />
fluctuations do. In fact, short-run RER volatility induced by temporary external<br />
fluctuations would be consistent with RER playing a shock absorber role in <strong>the</strong><br />
short run. As long as fluctuations are temporary, long-run reallocations and major<br />
adjustments are not needed. Hence, it would be inefficient if in <strong>the</strong> presence <strong>of</strong><br />
temporary external real fluctuations, we observed contemporaneous increases in<br />
<strong>the</strong> long-run RER rate volatility. Consequently, this situation could be interpreted<br />
as a source <strong>of</strong> instability and welfare costs.<br />
In order <strong>to</strong> analyze this question, we need <strong>to</strong> decompose RER dynamics in<strong>to</strong> long-<br />
and short-run fluctuations. There are not many straightforward frameworks for doing<br />
this, because long- and short-run RER components are not observed variables.<br />
S<strong>to</strong>ck and Watson (2007) developed <strong>the</strong> unobserved components and s<strong>to</strong>chastic<br />
volatility framework for analyzing time-varying s<strong>to</strong>chastic volatilities <strong>of</strong> <strong>the</strong><br />
permanent and transi<strong>to</strong>ry components <strong>of</strong> inflation in <strong>the</strong> United States. This<br />
framework is well suited <strong>to</strong> studying persistent processes with s<strong>to</strong>chastic breaks.<br />
Thus, it allows modeling a variable such as <strong>the</strong> RER and decomposing it in<strong>to</strong> two<br />
unobserved variables: permanent and transi<strong>to</strong>ry components. Hence, it could<br />
help in disentangling different aspects <strong>of</strong> our question. 17<br />
17 Fur<strong>the</strong>r details <strong>of</strong> <strong>the</strong> model are explained in Appendix B.<br />
©International Monetary Fund. Not for Redistribution
Gregorio and Labbé 225<br />
The results presented in Figure 12.16 show short- and long-run s<strong>to</strong>chastic<br />
volatilities for <strong>the</strong> Chilean RER at quarterly frequency. Compared <strong>to</strong> <strong>the</strong> level<br />
experienced during <strong>the</strong> 1990s, evidence points <strong>to</strong>ward an increase <strong>of</strong> average short<br />
run volatility during <strong>the</strong> 2000s. However, long-run volatility has remained stable<br />
since <strong>the</strong> late 1980s. Hence, <strong>the</strong> increased exposition <strong>of</strong> <strong>the</strong> RER, through <strong>the</strong><br />
channel <strong>of</strong> <strong>the</strong> flexible exchange rate, has been mostly reflected by rising short-run<br />
RER fluctuations. This is consistent with <strong>the</strong> argument that in <strong>the</strong> short run <strong>the</strong><br />
floating nominal exchange rate framework has worked as a shock absorber<br />
mechanism without necessarily increasing long-run RER volatility.<br />
Moreover, it is worth noting that during <strong>the</strong> late 1970s and early 1980s both<br />
kinds <strong>of</strong> RER volatility, and especially long-run RER volatility, fluctuated more<br />
than during <strong>the</strong> recent period. In fact, <strong>the</strong> early 1980s corresponds <strong>to</strong> a period <strong>of</strong><br />
external and internal imbalances and a strong real adjustment. At this time, <strong>the</strong><br />
nominal exchange rate was fixed and RER was strongly appreciated. This generated<br />
a severe balance-<strong>of</strong>-payments and financial crisis that led <strong>to</strong> a strong devaluation<br />
with very large real losses in output and employment.<br />
Besides, during <strong>the</strong> late 1990s, early 2000s, and late 2000s, <strong>the</strong> Chilean economy<br />
was affected by worldwide turbulent episodes. During <strong>the</strong> late 1990s <strong>the</strong> Asian<br />
and Russian crisis hit emerging economies generating strong devaluations and high<br />
volatility. For <strong>the</strong> Chilean economy, <strong>the</strong>se episodes represented sizeable external<br />
shocks that generated high volatility in <strong>the</strong> nominal exchange rate. As we can see,<br />
<strong>the</strong>se shocks did not severely affect long-run RER volatility. However, short-run<br />
RER volatility stayed high for a long period during <strong>the</strong> early 2000s. To some extent,<br />
exchange rate flexibility helped absorb external shocks, minimizing <strong>the</strong> real effects<br />
by increasing short-run RER volatility.<br />
Figure 12.16<br />
Chilean RER s<strong>to</strong>chastic volatilities, 1975–2010<br />
8<br />
6<br />
4<br />
2<br />
0<br />
1975:Q1 1980:Q1 1985:Q1 1990:Q1 1995:Q1 2000:Q1 2005:Q1 2010:Q1<br />
Long-run volatility Short-run volatility<br />
Source: Author's calculations.<br />
Note: Results were obtained with a S<strong>to</strong>ck and Watson (2007) UC-SV model; for<br />
details see Appendix B.<br />
©International Monetary Fund. Not for Redistribution
226 Copper, <strong>the</strong> Real Exchange Rate and Macroeconomic Fluctuations in Chile<br />
However, in some cases excessive nominal exchange rate volatility could be incoherent<br />
with fundamentals and thus could be a source <strong>of</strong> macroeconomic instability.<br />
Therefore, even in a fully flexible exchange rate regime <strong>the</strong> central bank may intervene<br />
in <strong>the</strong> foreign exchange market. Interventions in a fully flexible exchange rate<br />
regime did occur in Chile in 2001, 2002, 2008, and 2011 (De Gregorio, 2011).<br />
Overall, <strong>the</strong> main implications we can draw from <strong>the</strong> evidence make clear that<br />
since <strong>the</strong> implementation <strong>of</strong> fiscal prudence and especially during <strong>the</strong> fully flexible<br />
exchange rate regime, long-run RER volatility has remained stable. Moreover,<br />
since <strong>the</strong> early 2000s, short-run RER volatility has fluctuated more. However, it<br />
has not reached extremely high levels in spite <strong>of</strong> systematic increases in nominal<br />
exchange rate volatility (see Figure 12.17).<br />
Along <strong>the</strong> same line, sharp external fluctuations that directly hit <strong>the</strong> Chilean<br />
economy, such as copper price shocks, have had a particular impact on <strong>the</strong> shortrun<br />
RER volatility (see Figure 12.18). However, <strong>the</strong>se recent sharp spikes do not<br />
produce excessive volatility in <strong>the</strong> RER, ei<strong>the</strong>r in <strong>the</strong> short or <strong>the</strong> long run.<br />
The evidence reported in Figures 12.17 and 12.18 shows that <strong>the</strong> macroeconomic<br />
policy framework applied in Chile has been able <strong>to</strong> mitigate both <strong>the</strong><br />
excess <strong>of</strong> volatility implied by external shocks, in particular by copper price<br />
shocks, and <strong>the</strong> effects <strong>of</strong> fluctuations in <strong>the</strong> nominal exchange rate on <strong>the</strong> volatility<br />
<strong>of</strong> <strong>the</strong> RER, and hence on competitiveness.<br />
We may conclude that <strong>the</strong> Chilean policy framework as a whole, and in particular<br />
<strong>the</strong> country’s currency regime, have operated as shock absorber devices. In<br />
fact, in <strong>the</strong> face <strong>of</strong> sharp external shocks, evidence shows that stabilizing mechanisms<br />
are at work making <strong>the</strong> Chilean economy much more resilient than in<br />
earlier periods.<br />
Figure 12.17<br />
Short-run RER and nominal exchange rate<br />
volatilities, 1985–2010<br />
NER volatility<br />
.15<br />
.1<br />
.05<br />
0<br />
1985:Q1 1990:Q1 1995:Q1 2000:Q1 2005:Q1 2010:Q1<br />
NER volatility Short-run RER volatility<br />
Note: NER volatility corresponds <strong>to</strong> <strong>the</strong> standard deviation <strong>of</strong> quarterly percent<br />
changes estimated on a 10-quarter rolling window.<br />
©International Monetary Fund. Not for Redistribution<br />
8<br />
6<br />
4<br />
2<br />
0<br />
Short-run RER volatility
Figure 12.18<br />
Short-run RER and copper price volatilities, 1980–2010<br />
Copper price volatility<br />
.3<br />
.25<br />
.2<br />
.15<br />
.1<br />
.05<br />
1980:Q1 1985:Q1 1990:Q1 1995:Q1 2000:Q1 2005:Q1 2010:Q1<br />
Copper price volatility Short-run RER volatility<br />
Note: Copper price volatility corresponds <strong>to</strong> <strong>the</strong> standard deviation <strong>of</strong><br />
quarterly percent changes estimated on a 10-quarter rolling window.<br />
SIMULATION OF A COPPER PRICE SHOCK USING<br />
A DSGE MODEL<br />
Gregorio and Labbé 227<br />
To fur<strong>the</strong>r analyze <strong>the</strong> effects <strong>of</strong> <strong>the</strong> current policy framework on economic performance<br />
after a commodity (copper) price shock, we simulate a dynamic s<strong>to</strong>chastic<br />
general equilibrium model on a small, open emerging-market economy. The model<br />
has been estimated for <strong>the</strong> Chilean economy with data from 1986 through 2007. 18<br />
The size <strong>of</strong> <strong>the</strong> temporary shock is 40 percent, which corresponds roughly <strong>to</strong><br />
<strong>the</strong> actual size <strong>of</strong> commodity-price shocks observed before <strong>the</strong> financial crisis.<br />
Three alternatives for <strong>the</strong> monetary policy are considered: (i) a Taylor policy<br />
rule under which <strong>the</strong> central bank responds <strong>to</strong> changes in output and core<br />
inflation; 19 (ii) a Taylor-type policy rule where <strong>the</strong> monetary authority not only<br />
responds <strong>to</strong> output and inflation but also <strong>to</strong> RER fluctuations; 20 and (iii) a Taylor<br />
rule like that in (i) but coupled with a successful exchange rate intervention that<br />
keeps <strong>the</strong> RER unchanged for two quarters. 21 The results <strong>of</strong> <strong>the</strong>se simulations are<br />
presented in Figure 12.19.<br />
18 For details, see Medina and So<strong>to</strong> (2007b).<br />
19 The simulations use core ra<strong>the</strong>r than CPI inflation in <strong>the</strong> policy rule in order <strong>to</strong> capture <strong>the</strong> forwardlooking<br />
behavior <strong>of</strong> <strong>the</strong> central bank in Chile. In small open economy models, like <strong>the</strong> one utilized in<br />
our exercise, it is <strong>of</strong>ten <strong>the</strong> case that a forward-looking policy rule leads <strong>to</strong> indeterminacy. To avoid<br />
this problem, we assume that <strong>the</strong> central bank considers core inflation a good predic<strong>to</strong>r <strong>of</strong> future inflation<br />
and responds <strong>to</strong> fluctuations in this variable.<br />
20 This type <strong>of</strong> rule mimics <strong>the</strong> behavior <strong>of</strong> <strong>the</strong> Central Bank <strong>of</strong> Chile during <strong>the</strong> 1990s when, alongside<br />
a target for inflation, <strong>the</strong>re was an explicit exchange rate band.<br />
21 The exchange rate intervention is modeled as a shock <strong>to</strong> <strong>the</strong> uncovered interest rate (UIP) condition<br />
in order <strong>to</strong> keep <strong>the</strong> real exchange rate fixed for two periods (quarters). The shock converges back <strong>to</strong><br />
zero with a persistence <strong>of</strong> 0.85.<br />
©International Monetary Fund. Not for Redistribution<br />
8<br />
6<br />
4<br />
2<br />
Short-run RER volatility
228 Copper, <strong>the</strong> Real Exchange Rate and Macroeconomic Fluctuations in Chile<br />
Figure 12.19<br />
Impulse-response <strong>to</strong> a copper price shock<br />
0.8<br />
0.7<br />
0.6<br />
0.5<br />
0.4<br />
0.3<br />
0.2<br />
0.1<br />
-0.1<br />
-0.2<br />
-0.3<br />
CPI Inflation Output<br />
0.9<br />
0.8<br />
0.7<br />
0.<br />
0.5<br />
0.4<br />
0.3<br />
0.0<br />
1 2 3 4 5 6 7 8 9 10 11 12 13 14 15 16 17 18 19 20<br />
Real Exchange Rate Exports<br />
0.0<br />
-0.2 1 2<br />
-0.4<br />
-0.6<br />
-0.8<br />
-1.0<br />
-1.2<br />
-1.4<br />
-1.6<br />
3 4 5 6 7 8 9 10 11 12 13 14 15 16 17 18 19 20<br />
0.2<br />
0.1<br />
0.0<br />
-0.1 1 2<br />
-0.2<br />
-0.3<br />
-0.4<br />
-0.5<br />
-0.6<br />
-0.7<br />
3 4 5 6 7 8 9 10 11 12 13 14 15 16 17 18 19 20<br />
0.3<br />
0.2<br />
0.1<br />
0.0<br />
-0.1<br />
-0.2<br />
-0.3<br />
-0.4<br />
-0.5<br />
-0.6<br />
-0.7<br />
Taylor Rule Policy rule with RER feedback Taylor Rule + RER intervention<br />
The copper price shock leads <strong>to</strong> a mild real appreciation <strong>of</strong> <strong>the</strong> currency. The<br />
extent <strong>of</strong> <strong>the</strong> appreciation is smaller than <strong>the</strong> one reported in <strong>the</strong> estimations for<br />
<strong>the</strong> long-run RER, since in this case <strong>the</strong> shock is smaller—it is only <strong>to</strong> <strong>the</strong> price<br />
<strong>of</strong> copper, which is only a part <strong>of</strong> <strong>the</strong> terms <strong>of</strong> trade. The estimations also take<br />
in<strong>to</strong> account policy reaction, and <strong>the</strong> change in <strong>the</strong> copper price is assumed <strong>to</strong> be<br />
transi<strong>to</strong>ry, contrary <strong>to</strong> cointegrating regressions that estimate <strong>the</strong> effects <strong>of</strong> permanent<br />
shocks. In addition, <strong>the</strong> small effect on <strong>the</strong> RER is explained in part by <strong>the</strong><br />
fact that <strong>the</strong> model assumes that <strong>the</strong> government follows a structural balance<br />
targeting rule, under which most <strong>of</strong> <strong>the</strong> proceeds from a higher copper price are<br />
saved. The shock also generates a fall in exports, due <strong>to</strong> <strong>the</strong> real appreciation, and<br />
a boost <strong>to</strong> o<strong>the</strong>r domestic sec<strong>to</strong>rs that leads <strong>to</strong> an increase in <strong>to</strong>tal output.<br />
The effect on inflation <strong>of</strong> <strong>the</strong> copper price shock depends crucially on <strong>the</strong><br />
monetary policy. Under <strong>the</strong> Taylor policy rule (i), although <strong>the</strong>re is an expansion<br />
in <strong>to</strong>tal output, <strong>the</strong> appreciation <strong>of</strong> <strong>the</strong> currency is such that inflation decreases<br />
marginally after <strong>the</strong> shock. On <strong>the</strong> o<strong>the</strong>r hand, when <strong>the</strong> central bank systematically<br />
responds <strong>to</strong> fluctuations in <strong>the</strong> RER—under policy rule (ii)—<strong>the</strong> real interest<br />
rate falls in response <strong>to</strong> <strong>the</strong> shock, which leads <strong>to</strong> a more muted appreciation<br />
<strong>of</strong> <strong>the</strong> currency and generates a larger expansion in output. As a result, inflation<br />
increases and <strong>the</strong> nominal policy rate rises. Notice that policy rule (ii) reduces <strong>the</strong><br />
volatility <strong>of</strong> exports, but it increases <strong>the</strong> volatility <strong>of</strong> overall output and <strong>of</strong> inflation,<br />
and <strong>the</strong>refore it reduces welfare.<br />
If <strong>the</strong> central bank is able <strong>to</strong> successfully avoid RER fluctuations in <strong>the</strong> short<br />
run (two quarters in <strong>the</strong> simulations that fade away slowly) by using an alternative<br />
instrument o<strong>the</strong>r than <strong>the</strong> policy rate (e.g., by intervening in <strong>the</strong> foreign currency<br />
0.2<br />
0.1<br />
0.0<br />
Real Monetary Policy Rate<br />
0.6<br />
0.5<br />
0.4<br />
0.3<br />
0.2<br />
0.1<br />
Nominal Monetary Policy Rate<br />
0.0<br />
1 2<br />
-0.1<br />
3 4 5 6 7 8 9 10 11 12 13 14 15 16 17 18 19 20<br />
1 2 3 4 5 6 7 8 9 10 11 12 13 14 15 16 17 18 19 20<br />
1 2 3 4 5 6 7 8 9 10 11 12 13 14 15 16 17 18 19 20<br />
©International Monetary Fund. Not for Redistribution
Gregorio and Labbé 229<br />
exchange market), <strong>the</strong> result is a more muted initial response <strong>of</strong> exports <strong>to</strong> <strong>the</strong><br />
shock and a slight increase in inflation. Contrary <strong>to</strong> <strong>the</strong> o<strong>the</strong>r policy rules, this<br />
policy results in a reduction <strong>of</strong> output in <strong>the</strong> short run due <strong>to</strong> <strong>the</strong> impact on <strong>the</strong><br />
nontradable sec<strong>to</strong>r. Notice, however, that in order <strong>to</strong> contain inflation pressures,<br />
in this case <strong>the</strong> policy rate—both nominal and real—needs <strong>to</strong> increase after some<br />
quarters. This in turn results in a delayed appreciation <strong>of</strong> <strong>the</strong> currency and precludes<br />
exports from returning quickly <strong>to</strong> <strong>the</strong>ir steady-state level.<br />
Overall, this model shows that letting <strong>the</strong> exchange rate fluctuate may result<br />
in smaller welfare losses, in particular considering that inflation falls and output<br />
rises. Of course, in this model <strong>the</strong> exchange rate intervention is assumed <strong>to</strong> be<br />
successful and <strong>the</strong> intervention is used only as a short-run stabilization <strong>to</strong>ol. In<br />
addition, this model does not allow for bubbles or extreme deviations <strong>of</strong> exchange<br />
rates that may justify certain forms <strong>of</strong> intervention (De Gregorio, 2010).<br />
CONCLUDING REMARKS<br />
The impact <strong>of</strong> natural resources on <strong>the</strong> business cycle and economic development has<br />
been an important <strong>to</strong>pic in economic research and policy. Chile is an economy that<br />
has been able <strong>to</strong> grow quickly and build a stable macroeconomic environment while<br />
at <strong>the</strong> same time it is rich in natural resources, in particular copper. Therefore, Chile<br />
has suffered from nei<strong>the</strong>r <strong>the</strong> curse <strong>of</strong> natural resources nor <strong>the</strong> excessive volatility in<br />
terms-<strong>of</strong>-trade fluctuations. Compared <strong>to</strong> o<strong>the</strong>r countries abundant in natural<br />
resources but unable <strong>to</strong> take advantage <strong>of</strong> <strong>the</strong>m, Chile has relatively strong institutions,<br />
high levels <strong>of</strong> human capital, and a stable macroeconomic environment, all <strong>of</strong><br />
which help in avoiding <strong>the</strong> natural resource curse. On <strong>the</strong> o<strong>the</strong>r hand, <strong>the</strong> reduced<br />
impact <strong>of</strong> copper price fluctuations on <strong>the</strong> business cycle is due <strong>to</strong> macroeconomic<br />
policies.<br />
This chapter has focused on how increasingly resilient <strong>the</strong> Chilean economy has<br />
been <strong>to</strong> copper price fluctuations. Trying <strong>to</strong> disentangle all <strong>of</strong> <strong>the</strong> underlying fac<strong>to</strong>rs<br />
is a difficult task and may involve subjective judgment. Indeed, even recent evidence<br />
is inconclusive about what proportion <strong>of</strong> <strong>the</strong> external conditions drives output<br />
instability in developing countries. 22 For this reason, in this chapter we use<br />
evidence from different areas <strong>to</strong> examine <strong>the</strong> impact <strong>of</strong> copper prices on economic<br />
fluctuations. The evidence shows that having a flexible exchange rate, a rule-based<br />
fiscal policy, and a flexible inflation-targeting regime have all contributed <strong>to</strong> this<br />
resilience. Chile has followed prudent fiscal policies since <strong>the</strong> mid-1980s, which is<br />
an important fac<strong>to</strong>r in explaining <strong>the</strong> reduction in <strong>the</strong> volatility <strong>of</strong> output observed<br />
since <strong>the</strong> 1990s. In addition, <strong>the</strong> fur<strong>the</strong>r decline in volatility and more limited<br />
impact <strong>of</strong> copper are due <strong>to</strong> <strong>the</strong> implementation <strong>of</strong> monetary policy with an<br />
inflation-targeting framework and a floating exchange rate.<br />
22 See for example Raddatz (2007) and Castillo and Salas (2010). While <strong>the</strong> former reports that external<br />
conditions explain a small fraction <strong>of</strong> output fluctuations on low-income economies, <strong>the</strong> latter<br />
argues for <strong>the</strong> case <strong>of</strong> Chile and Peru that <strong>the</strong> commodity price boom <strong>of</strong> <strong>the</strong> mid-2000s is a main<br />
driver <strong>of</strong> <strong>the</strong> economic expansion <strong>of</strong> recent years.<br />
©International Monetary Fund. Not for Redistribution
230 Copper, <strong>the</strong> Real Exchange Rate and Macroeconomic Fluctuations in Chile<br />
The operation <strong>of</strong> <strong>the</strong> fiscal rule since <strong>the</strong> early 2000s has provided predictability<br />
<strong>to</strong> pursue <strong>the</strong> inflation target based on a two-year horizon. Thus, fiscal and<br />
monetary policies have complemented <strong>to</strong> reduce <strong>the</strong> amplitude <strong>of</strong> <strong>the</strong> business<br />
cycle and provide sound basis for long-term growth, while reducing <strong>the</strong> dependence<br />
<strong>of</strong> Chile’s economic performance <strong>to</strong> copper price fluctuations.<br />
REFERENCES<br />
Bravo-Ortega, C., and J. De Gregorio, 2006, “The Relative Richness <strong>of</strong> <strong>the</strong> Poor? <strong>Natural</strong><br />
<strong>Resources</strong>, Human Capital and Economic Growth,” in Nei<strong>the</strong>r Curse Nor Destiny: <strong>Natural</strong><br />
<strong>Resources</strong> and Development, ed. by D. Lederman and W. Maloney (Palo Al<strong>to</strong>, California:<br />
Stanford University Press).<br />
Caballero, R., 2002, “Enfrentando la vulnerabilidad externa: un problema financiero,”<br />
Economía Chilena, Vol. 5, No. 1, pp. 11–36.<br />
Calvo, G., and E. Mendoza, 1999, “Empirical Puzzles <strong>of</strong> Chilean Stabilization Policy,” in Chile, Recent<br />
Lessons and Emerging Challenges, ed. by G. Perry and D. Leipziger (Washing<strong>to</strong>n: The World Bank).<br />
Capu<strong>to</strong>, R., M. Núñez, and R. Valdés, 2010, “A Fiscal Vaccine against Dutch Disease,” unpublished<br />
(Santiago: Central Bank <strong>of</strong> Chile).<br />
Castillo, P., and J. Salas, 2010, “The Terms <strong>of</strong> Trade as Drivers <strong>of</strong> Economic Fluctuations in<br />
Development Economies: An Empirical Study,” unpublished (Lima: Central Bank <strong>of</strong> Peru).<br />
Céspedes, L.F., and J. De Gregorio, 1999, “Tipo de cambio real, desalineamien<strong>to</strong> y devaluaciones:<br />
teoria y evidencia para Chile,” unpublished (Santiago: DII Universidad de Chile).<br />
Céspedes, L.F., J. Galí, and J. Fornero, 2010, “Non-Ricardian Aspects <strong>of</strong> Fiscal Policy in Chile,”<br />
unpublished (Santiago: Central Bank <strong>of</strong> Chile).<br />
Clark, P.B., and R. MacDonald, 1998, “Exchange Rates and Economics Fundamentals:<br />
A Methodological Comparison <strong>of</strong> BEERs and FEERs,” IMF Working Paper No. 98/67,<br />
(Washing<strong>to</strong>n: International Monetary Fund).<br />
De Gregorio, J., 2008, “The Great Moderation and <strong>the</strong> Risk <strong>of</strong> Inflation: A View from<br />
Developing Countries,” Economic Policy Paper No. 24 (Santiago: Central Bank <strong>of</strong> Chile).<br />
———, 2009, “El crecimien<strong>to</strong> en Chile y el cobre,” speech delivered at <strong>the</strong> 25th anniversary <strong>of</strong><br />
CESCO (Centro de Estudios del Cobre) on September 1, Santiago, Chile.<br />
———, 2010, “Monetary Policy and Financial Stability: An Emerging Market Perspective,”<br />
International Finance, Vol. 13, No. 1, pp. 141–56.<br />
———, 2011, “International Reserve Hoarding Emerging Economies,” Economic Policy Paper<br />
No. 40 (Santiago: Central Bank <strong>of</strong> Chile).<br />
De Gregorio, J., C. Betancour, and J.P. Medina, 2008, “The ‘Great Moderation’ and <strong>the</strong><br />
Monetary Transmission Mechanism in Chile,” BIS Papers, No. 35, pp. 159–78.<br />
De Gregorio, J., A. Giovannini, and H. Wolf, 1994, “International Evidence on Tradables and<br />
Nontradables Inflation,” European Economic Review, Vol. 38, pp. 1225–44.<br />
De Gregorio, J., and A. Tokman, 2005, “Fear <strong>of</strong> Floating and Exchange Rate Policy in Chile,”<br />
Economía Chilena, Vol. 8, No. 3, pp. 29–54.<br />
Díaz, J., R. Lüders, and G. Wagner, 2010, La República en Cifras, 2010 (Santiago: EH Clio<br />
Lab-Inciativa Científica Milenio, Pontificia Universidad Católica De Chile). http://www.<br />
economia.puc.cl/cliolab<br />
Faruqee, H., 1995, “Long-Run Determinants <strong>of</strong> <strong>the</strong> Real Exchange Rate: A S<strong>to</strong>ck-Flow<br />
Perspective,” IMF Staff Papers, Vol. 42, No. 1, pp. 80–107.<br />
Frankel, J.A., C. Végh, and G. Vuletin, 2011, “On Graduation from Procyclicality,” unpublished<br />
(Bos<strong>to</strong>n: Harvard University).<br />
Johansen, S., 1988, “Statistical Analysis <strong>of</strong> Cointegration Vec<strong>to</strong>rs,” Journal <strong>of</strong> Economic<br />
Dynamics and Control, Vol. 12, Nos. 2–3, pp. 231–54.<br />
Lama, R., and J.P. Medina, 2010, “Is Exchange Rate Stabilization Appropriate Cure for Dutch<br />
Disease?” IMF Working Paper No. 10/182 (Washing<strong>to</strong>n: International Monetary Fund).<br />
©International Monetary Fund. Not for Redistribution
Gregorio and Labbé 231<br />
Larraín, F., and F. Parro, 2008, “Chile Menos Volátil,” El Trimestre Económico, Vol. 75, No. 299,<br />
pp. 563–92.<br />
Magendzo, I., 2010, “Ciclo económico y precio de commodities en un estado exportador: el<br />
caso chileno y la minería del cobre,” unpublished (Santiago: Universidad Adolfo Ibañez).<br />
Magud, N., and S. Sosa, 2010, “When and Why Worry About Real Exchange Rate<br />
Appreciation? The Missing Link between Dutch Disease and Growth,” IMF Working Paper<br />
No. 10/271 (Washing<strong>to</strong>n: International Monetary Fund).<br />
Medina, J.P., and C. So<strong>to</strong>, 2007a, “Copper Price, Fiscal Policy and <strong>the</strong> Business Cycle,” Working<br />
Paper No. 456 (Santiago: Central Bank <strong>of</strong> Chile).<br />
———, 2007b, “The Chilean Business Cycles Through <strong>the</strong> Lens <strong>of</strong> a S<strong>to</strong>chastic General<br />
Equilibrium Model,” Working Paper No. 457 (Santiago: Central Bank <strong>of</strong> Chile).<br />
Raddatz, C., 2007, “Are External Shocks Responsible for <strong>the</strong> Instability <strong>of</strong> Output in Low-<br />
Income Countries?” Journal <strong>of</strong> Development Economics, Vol. 84, No. 1, pp. 155–87.<br />
Robinson, J., R. Torvik, and T. Verdier, 2006, “Political Foundations <strong>of</strong> <strong>the</strong> Resource Curse,”<br />
Journal <strong>of</strong> Development Economics, Vol. 79, No. 2, pp. 447–68.<br />
Sachs, J., and A. Warner, 1999, “The Big Push, <strong>Natural</strong> Resource Booms and Growth,” Journal<br />
<strong>of</strong> Development Economics, Vol. 59, No. 1, pp. 43–76.<br />
So<strong>to</strong>, C., 2003, “The Effects <strong>of</strong> Nominal and Real Shocks on <strong>the</strong> Chilean Real Exchange Rate<br />
During <strong>the</strong> Nineties,” Working Paper No. 220 (Santiago: Central Bank <strong>of</strong> Chile).<br />
Spilimbergo, A., 1999, “Copper and <strong>the</strong> Chilean economy,” IMF Working Paper No. 99/57<br />
(Washing<strong>to</strong>n: International Monetary Fund).<br />
S<strong>to</strong>ck, J.H., and M.W. Watson, 2007, “Why Has U.S. Inflation Become Harder <strong>to</strong> Forecast?”<br />
Journal <strong>of</strong> Money, Credit, and Banking, Vol. 39, pp. 3–34.<br />
©International Monetary Fund. Not for Redistribution
232 Copper, <strong>the</strong> Real Exchange Rate and Macroeconomic Fluctuations in Chile<br />
APPENDIX A<br />
We follow <strong>the</strong> traditional vec<strong>to</strong>r-error correction model literature and estimate a<br />
VAR(p) in levels in order <strong>to</strong> select <strong>the</strong> optimal lag length <strong>of</strong> <strong>the</strong> underlying unrestricted<br />
VAR. Following standard criteria, we find that three lags adequately<br />
represent <strong>the</strong> dynamics contained in <strong>the</strong> data. Traditional cointegration tests,<br />
trace, and eigenvalue statistics (see Table 12.2 in <strong>the</strong> text) and economic <strong>the</strong>ory<br />
suggest one long-run relationship among <strong>the</strong> mentioned set <strong>of</strong> variables. Then,<br />
we use a Johansen (1988) technique and estimate <strong>the</strong> following vec<strong>to</strong>r-error correction<br />
representation:<br />
p-1<br />
å<br />
D y = c+ ab y + d D y + u<br />
t t-1i t-i t<br />
i=<br />
1<br />
Where yt is a (5 × 1) vec<strong>to</strong>r such as yt ( ToT TNT ( F / Y)( G/ Y) RER ) ′<br />
= , all <strong>the</strong> variables<br />
are in log except government expenditure and net foreign assets, <strong>the</strong> matrices di<br />
(5 × 5) contain short-run parameters and b is a (1 × 5) vec<strong>to</strong>r <strong>of</strong> cointegration,<br />
a is a (5 × 1) vec<strong>to</strong>r with long-run disequilibrium coefficients, and c is a (5 × 1)<br />
vec<strong>to</strong>r with intercepts. The innovations are represented by <strong>the</strong> vec<strong>to</strong>r u t which has<br />
mean zero and a variance-covariance matrix W=SS ' which is assumed <strong>to</strong> have a<br />
structure described by a Cholesky decomposition, such as S is lower triangular<br />
and has <strong>the</strong> same ordering <strong>of</strong> exogeneity as <strong>the</strong> one shown by vec<strong>to</strong>r y t.<br />
Hence,<br />
terms-<strong>of</strong>-trade innovations are <strong>the</strong> most exogenous elements in <strong>the</strong> system, and so<br />
TABLE 12A<br />
Unit root tests<br />
Augmented Dickey-Fuller Phillips-Perron<br />
Lags Variable Zt p-val Zt p-val<br />
1 F/Y -1.21 0.67 -1.09 0.72<br />
2 F/Y -1.34 0.61 -1.15 0.69<br />
3 F/Y -1.22 0.66 -1.17 0.69<br />
1 G/Y -2.41 0.14 -3.12 0.02<br />
2 G/Y -2.02 0.28 -3.07 0.03<br />
3 G/Y -1.87 0.34 -3.00 0.03<br />
1 RER -3.09 0.03 -2.66 0.08<br />
2 RER -2.59 0.09 -2.66 0.08<br />
3 RER -2.21 0.20 -2.66 0.08<br />
1 ToT -0.73 0.84 -0.92 0.78<br />
2 ToT -0.32 0.92 -0.74 0.84<br />
3 ToT 0.06 0.96 -0.55 0.88<br />
1 TNT -1.51 0.53 -1.47 0.55<br />
2 TNT -1.56 0.50 -1.50 0.53<br />
3 TNT -1.77 0.40 -1.51 0.53<br />
Note: Tests assume that under <strong>the</strong> null hypo<strong>the</strong>sis <strong>the</strong> variables have a unit root, Zt, which represent<br />
<strong>the</strong> test statistic, and p-val corresponds <strong>to</strong> <strong>the</strong> p-value.<br />
©International Monetary Fund. Not for Redistribution<br />
(A1)
Gregorio and Labbé 233<br />
on. We estimate <strong>the</strong> system represented in equation (A1) using data from<br />
1977:Q1 <strong>to</strong> 2010:Q3 (see Table 12.3 in <strong>the</strong> text).<br />
APPENDIX B<br />
We follow <strong>the</strong> framework developed by S<strong>to</strong>ck and Watson (2007) for decomposing<br />
<strong>the</strong> RER in<strong>to</strong> a permanent component t t and a transi<strong>to</strong>ry one h t.<br />
The permanent<br />
component t , and <strong>the</strong> variances <strong>of</strong> e t<br />
t and h t follow a random walk:<br />
RER = t + h , where h = s x<br />
t = t + e , where e = s x<br />
t t t t h, t h,<br />
t<br />
t t-1 t t e, t e,<br />
t<br />
where xt = ( xh, t xe,<br />
t) iid N(0, I2)<br />
are independently distributed and s<strong>to</strong>chastic<br />
volatilities are modeled as:<br />
where u ( uh ue<br />
)<br />
lns = lns<br />
+ u<br />
lns lns<br />
u<br />
2 2<br />
h, t h, t-1 h,<br />
t<br />
2<br />
e, t =<br />
2<br />
e, t-1 + e,<br />
t<br />
t = , t , t iid N(0, I2)<br />
are independently distributed. The model is<br />
written in a state space form and can be estimated using a Kalman filter and<br />
solved numerically through a Gibbs sampler. Results are shown in Figure 12.16.<br />
©International Monetary Fund. Not for Redistribution
This page intentionally left blank<br />
©International Monetary Fund. Not for Redistribution
Governance and<br />
Institutional Aspects<br />
PART V<br />
©International Monetary Fund. Not for Redistribution
This page intentionally left blank<br />
©International Monetary Fund. Not for Redistribution
CHAPTER 13<br />
The Political Economy <strong>of</strong> Reform<br />
in Resource-Rich Countries<br />
RAGNAR TORVIK<br />
INTRODUCTION<br />
Since <strong>the</strong> 1950s and until recently, economists have argued that countries with a<br />
comparative advantage in production based on <strong>the</strong>ir natural resources would suffer<br />
from declining terms <strong>of</strong> trade. The price <strong>of</strong> raw materials relative <strong>to</strong> industrial<br />
goods would decline over time, according <strong>to</strong> <strong>the</strong> argument, making specialization<br />
in natural-resource-based production unattractive. Paradoxically, recently economists<br />
have argued that specialization in natural resources is unattractive for<br />
exactly <strong>the</strong> opposite reason: such specialization is so economically beneficial that<br />
in fact it may turn in<strong>to</strong> a curse. Led by Sachs and Warner (1995, 1997), many<br />
have argued that on average, resource-abundant countries have slower growth<br />
than resource-poor countries. But asking what <strong>the</strong> average effect <strong>of</strong> oil is in<br />
Norway and Nigeria, or <strong>the</strong> average effect <strong>of</strong> diamonds in Botswana and Sierra<br />
Leone, might not be <strong>the</strong> most interesting or most relevant question. Ra<strong>the</strong>r than<br />
<strong>the</strong> average, it is more important <strong>to</strong> understand <strong>the</strong> variation. Why has oil<br />
induced prosperity in some countries but stagnation in o<strong>the</strong>rs? In this chapter,<br />
I argue that <strong>the</strong> main reason for this is that different political incentives map in<strong>to</strong><br />
different political outcomes.<br />
Economic institutions and economic reform are <strong>the</strong> main drivers <strong>of</strong> economic<br />
and political development after <strong>the</strong> discovery <strong>of</strong> valuable natural resources. At<br />
least two questions arise: How do countries reform when <strong>the</strong>y receive resource<br />
rents? and How should countries reform when <strong>the</strong>y receive resource rents? In <strong>the</strong><br />
next section, I provide a short discussion <strong>of</strong> <strong>the</strong> first question.<br />
The second question is more difficult, being normative ra<strong>the</strong>r than positive.<br />
Never<strong>the</strong>less, <strong>to</strong> shed at least some light on that question I start out in <strong>the</strong><br />
Ragnar Torvik is pr<strong>of</strong>essor in <strong>the</strong> Department <strong>of</strong> Economics, Norwegian University <strong>of</strong> Science and<br />
Technology. This chapter is based on <strong>the</strong> author’s presentation at “<strong>Natural</strong> <strong>Resources</strong>, Finance, and<br />
Development: Confronting Old and New Challenges,” a high-level seminar organized by <strong>the</strong> Central<br />
Bank <strong>of</strong> Algeria and <strong>the</strong> IMF Institute, which <strong>to</strong>ok place in Algiers on November 4 and 5, 2010. The<br />
author wishes <strong>to</strong> thank <strong>the</strong> seminar participants and in particular Rabah Arezki and Thorvaldur<br />
Gylfason. The author can be contacted at ragnar.<strong>to</strong>rvik@svt.ntnu.no.<br />
©International Monetary Fund. Not for Redistribution<br />
237
238 The Political Economy <strong>of</strong> Reform in Resource-Rich Countries<br />
subsequent section by comparing <strong>the</strong> economic responses <strong>to</strong> resource abundance<br />
between two kinds <strong>of</strong> countries: those where institutions allow new income opportunities<br />
<strong>to</strong> benefit a broad segment <strong>of</strong> <strong>the</strong> population and those where this does not<br />
occur. As will be seen, <strong>the</strong> economic response <strong>to</strong> resource abundance can be ei<strong>the</strong>r<br />
more pessimistic or more optimistic than standard economic <strong>the</strong>ories suggest. In<br />
turn, in <strong>the</strong> fourth section I describe in more detail <strong>the</strong> kinds <strong>of</strong> differences in institutional<br />
design that can be decisive. In <strong>the</strong> fifth section I move fur<strong>the</strong>r in<strong>to</strong> details,<br />
comparing <strong>the</strong> political incentives built in<strong>to</strong> petroleum funds and <strong>the</strong> differences in<br />
performance <strong>the</strong>y have led <strong>to</strong>. The last section <strong>of</strong>fers conclusions.<br />
HOW DO COUNTRIES REFORM WHEN THEY RECEIVE<br />
RESOURCE RENTS?<br />
During development, most countries undertake reforms that substantially change<br />
<strong>the</strong> private and political incentives built in<strong>to</strong> <strong>the</strong> system. Current reforms are<br />
initiated by those with current political power. And since reform is likely <strong>to</strong><br />
change incentives—indeed this is <strong>of</strong>ten <strong>the</strong> main reason for reform—those who<br />
decide <strong>to</strong> initiate reform will face different incentives after <strong>the</strong> reform than <strong>the</strong>y<br />
did before it. In turn, this may influence <strong>the</strong> type <strong>of</strong> reform that is undertaken.<br />
When countries get new economic opportunities, such as <strong>the</strong> discovery <strong>of</strong><br />
valuable natural resources or an increase in <strong>the</strong> price <strong>of</strong> resources already known<br />
<strong>to</strong> exist, <strong>the</strong>y may reform in very different directions. If <strong>the</strong> current political system<br />
ensures that <strong>the</strong> interests <strong>of</strong> <strong>the</strong> population at large are well represented,<br />
resource abundance may generate reform that ensures that <strong>the</strong> resource wealth is<br />
managed in a way that benefits broad segments <strong>of</strong> society. On <strong>the</strong> o<strong>the</strong>r hand, if<br />
<strong>the</strong> current political system is not checked in such a way that it represents <strong>the</strong><br />
interests <strong>of</strong> <strong>the</strong> general population, reform may be undertaken with <strong>the</strong> aim <strong>of</strong><br />
preserving and streng<strong>the</strong>ning old privileges. In this way, new economic opportunities<br />
may generate types <strong>of</strong> reforms that vary greatly across countries. In turn, as<br />
we will see below, <strong>the</strong> type <strong>of</strong> reforms will decide <strong>to</strong> what extent <strong>the</strong> new opportunities<br />
increase or decrease welfare.<br />
There are many examples in which institutions have been reformed in a direction<br />
that allows <strong>the</strong> broad population <strong>to</strong> take advantage <strong>of</strong> new economic opportunities,<br />
and <strong>the</strong>y range from <strong>the</strong> 1862 Homestead Act in <strong>the</strong> United States <strong>to</strong><br />
allocate frontier land <strong>to</strong> a broad segment <strong>of</strong> <strong>the</strong> population, <strong>to</strong> <strong>the</strong> 1990 establishment<br />
<strong>of</strong> <strong>the</strong> Norwegian Petroleum Fund <strong>to</strong> manage <strong>the</strong> resource wealth <strong>of</strong> <strong>the</strong><br />
country. However, <strong>the</strong>re are also many examples in which new economic opportunities<br />
have led politicians <strong>to</strong> reform in a direction that limits <strong>the</strong> possibilities for<br />
<strong>the</strong> population <strong>to</strong> take advantage <strong>of</strong> <strong>the</strong> opportunities.<br />
Ross (2001a) shows that in countries like <strong>the</strong> Philippines, Indonesia, and<br />
Malaysia, <strong>the</strong> existence <strong>of</strong> timber from <strong>the</strong> rainforests and increased timber prices<br />
contributed <strong>to</strong> <strong>the</strong> deliberate dismantling <strong>of</strong> state institutions by politicians.<br />
The rainforests provided <strong>the</strong> basis for opportunities <strong>to</strong> pocket large sums <strong>of</strong> money<br />
through exploitation <strong>of</strong> <strong>the</strong> forest—but for this <strong>to</strong> be possible, <strong>the</strong> state institutions<br />
©International Monetary Fund. Not for Redistribution
Torvik 239<br />
established <strong>to</strong> counteract abuses and overexploitation had <strong>to</strong> be undermined.<br />
Politicians had incentives for dismantling institutions ra<strong>the</strong>r than building <strong>the</strong>m—<br />
and <strong>the</strong> reason was <strong>the</strong> abundance <strong>of</strong> valuable natural resources. Ross (2001b) also<br />
finds that countries with large oil deposits become less democratic. In such countries,<br />
democracy can represent a cost for politicians because it hinders <strong>the</strong>m from<br />
using <strong>the</strong> large public income as <strong>the</strong>y please. Large income from resources can<br />
<strong>the</strong>refore create political incentives for weakening democracy.<br />
Collier and Hoeffler (2009) show how “checks and balances,” institutional<br />
rules that limit <strong>the</strong> political abuse <strong>of</strong> power and balance political power,<br />
enhance growth. However, <strong>the</strong>y find that, particularly in countries where such<br />
rules are important—for example because <strong>the</strong> country has substantial public<br />
income from natural resources—<strong>the</strong> institutional rules are undermined by<br />
politicians.<br />
Acemoglu, Robinson, and Torvik (2011) develop a model <strong>of</strong> equilibrium<br />
checks and balances. If checks and balances limit political rents, why would voters<br />
support <strong>the</strong>ir removal, as <strong>the</strong>y have done for example in Bolivia, Ecuador, and<br />
Venezuela? The authors find that from <strong>the</strong> poor voters’ point <strong>of</strong> view, checks and<br />
balances are a double-edged sword. Although checks and balances limit political<br />
rents, <strong>the</strong>y also make it cheaper for <strong>the</strong> rich elite <strong>to</strong> influence politics through<br />
nonelec<strong>to</strong>ral means, such as bribing and lobbying. By dismantling checks and<br />
balances from <strong>the</strong> constitution, poor voters make <strong>the</strong> politicians more powerful<br />
and <strong>the</strong> elite less powerful. This is particularly advantageous for <strong>the</strong> poor when<br />
<strong>the</strong> rich are well organized, when income distribution is unequal, and when it is<br />
easy <strong>to</strong> tax. Thus, <strong>the</strong> typical characteristics <strong>of</strong> resource-abundant countries, in<br />
particular those where natural resources are stationary and <strong>the</strong>refore easily taxed,<br />
make it more likely that <strong>the</strong> equilibrium constitution does not contain checks<br />
and balances. Such countries end up with economic reform that streng<strong>the</strong>ns <strong>the</strong><br />
power <strong>of</strong> <strong>the</strong> political elite.<br />
HOW SHOULD COUNTRIES REFORM WHEN THEY<br />
RECEIVE RESOURCE RENTS?<br />
Most <strong>of</strong> <strong>the</strong> literature <strong>to</strong> date on <strong>the</strong> resource has been positive ra<strong>the</strong>r than normative,<br />
but this does not mean that <strong>the</strong> literature is without normative implications.<br />
Below I present an extremely simple positive <strong>the</strong>ory <strong>to</strong> shed light on <strong>the</strong> different<br />
effects resource abundance may have. In turn, this has normative implications for<br />
economic and political reform.<br />
A traditional argument would be that when a country accesses more natural<br />
resources, <strong>the</strong> income in <strong>the</strong> country increases, but it increases by less than <strong>the</strong><br />
isolated value <strong>of</strong> <strong>the</strong> resources, since <strong>the</strong>ir exploitation is likely <strong>to</strong> draw resources<br />
out <strong>of</strong> alternative, less pr<strong>of</strong>itable activities in <strong>the</strong> economy. Recently, however,<br />
a <strong>the</strong>oretical and empirical literature has argued that this may ei<strong>the</strong>r be a <strong>to</strong>o<br />
optimistic or a <strong>to</strong>o pessimistic prediction. Moreover, <strong>the</strong> prediction may depend<br />
on <strong>the</strong> political system in place.<br />
©International Monetary Fund. Not for Redistribution
240 The Political Economy <strong>of</strong> Reform in Resource-Rich Countries<br />
How More Can Become Less<br />
Let us consider a country with a high crime rate, widespread corruption, poor<br />
quality in <strong>the</strong> public bureaucracy, and a political system where politicians do not<br />
face checks and balances. In such a society, it will be relatively attractive for entrepreneurs<br />
<strong>to</strong> engage in political rent seeking, destructive banditry, and corruption<br />
ra<strong>the</strong>r than <strong>to</strong> establish and operate productive enterprises. For such an economy,<br />
more natural resources may make such economic activities more pr<strong>of</strong>itable, which<br />
in turn will have unfavourable general equilibrium consequences for <strong>the</strong> rest <strong>of</strong><br />
society. In fact, <strong>the</strong>se negative general equilibrium effects may outweigh <strong>the</strong> initial<br />
effect <strong>of</strong> more natural resources. The <strong>the</strong>ory presented in <strong>the</strong> following is a simplification<br />
based on Torvik (2002) and Robinson and Torvik (2010b).<br />
It seems intuitive that <strong>the</strong> higher <strong>the</strong> number <strong>of</strong> entrepreneurs who choose <strong>to</strong><br />
engage in productive activity, <strong>the</strong> higher <strong>the</strong> income <strong>of</strong> each entrepreneur will be.<br />
There are many reasons for this. More private entrepreneurs engaged in production<br />
means fewer entrepreneurs engaged in political rent seeking <strong>to</strong> transfer resources<br />
from <strong>the</strong> productive <strong>to</strong> <strong>the</strong> rent seeking part <strong>of</strong> <strong>the</strong> economy. Fewer transfers <strong>of</strong><br />
income away from <strong>the</strong> productive entrepreneurs in turn increases <strong>the</strong> pr<strong>of</strong>itability<br />
for each entrepreneur. More entrepreneurs engaged in productive activity means<br />
fewer engaged in destructive activity, and thus less crime and corruption. In turn, a<br />
reduction in crime and corruption makes it more pr<strong>of</strong>itable <strong>to</strong> engage in productive<br />
economic activity. A higher number <strong>of</strong> entrepreneurs in productive activity also<br />
yields higher production and higher income, and thus creates greater demand.<br />
Greater demand in turn increases sales and pr<strong>of</strong>itability. A higher number <strong>of</strong> entrepreneurs<br />
in productive activity gives higher tax income, greater public income, and<br />
thus better public services and infrastructure. Good public services and infrastructure<br />
in turn increase <strong>the</strong> pr<strong>of</strong>itability <strong>of</strong> private industrial activity.<br />
Figure 13.1 illustrates this relationship. We measure <strong>the</strong> number <strong>of</strong> entrepreneurs<br />
in productive activity along <strong>the</strong> horizontal axis and <strong>the</strong> income <strong>of</strong> each<br />
entrepreneur along <strong>the</strong> vertical axis. The rising curve shows that <strong>the</strong> income for<br />
Figure 13.1<br />
Income<br />
Entrepreneurs<br />
©International Monetary Fund. Not for Redistribution
Torvik 241<br />
each entrepreneur increases with <strong>the</strong> number <strong>of</strong> o<strong>the</strong>r entrepreneurs engaged in<br />
productive activity.<br />
Figure 13.2 shows how <strong>the</strong> number <strong>of</strong> entrepreneurs who choose <strong>to</strong> engage in<br />
unproductive or destructive rent-seeking activity influences <strong>the</strong> income for each and<br />
every one <strong>of</strong> <strong>the</strong>m. We measure <strong>the</strong> number <strong>of</strong> entrepreneurs in such activity from left<br />
<strong>to</strong> right, and <strong>the</strong> income for each <strong>of</strong> <strong>the</strong>m on <strong>the</strong> vertical axis. An increase in <strong>the</strong><br />
number <strong>of</strong> entrepreneurs in unproductive activity, that is, a movement from <strong>the</strong> right<br />
<strong>to</strong> <strong>the</strong> left in <strong>the</strong> figure, implies a lower income for each <strong>of</strong> <strong>the</strong> unproductive entrepreneurs.<br />
There are several reasons for this. A large number <strong>of</strong> rent seekers that aim <strong>to</strong><br />
transfer income <strong>to</strong>ward <strong>the</strong>mselves means that <strong>the</strong>re are fewer productive entrepreneurs<br />
<strong>to</strong> transfer income from and more competi<strong>to</strong>rs <strong>to</strong> share it with. In turn, this<br />
reduces <strong>the</strong> income for each rent seeker. A large number <strong>of</strong> criminal competi<strong>to</strong>rs<br />
means that more resources are used <strong>to</strong> protect oneself against o<strong>the</strong>r criminals, and less<br />
<strong>to</strong> obtain income. In turn, income is reduced for each single criminal.<br />
Figure 13.3 shows how <strong>the</strong> country’s entrepreneurs are distributed between<br />
productive and unproductive activity. Wh ere <strong>the</strong> curves intersect, <strong>the</strong> incomes for<br />
Figure 13.2<br />
Income<br />
Figure 13.3<br />
Income<br />
Entrepreneurs<br />
Income<br />
Rent-seekers<br />
Rent-seekers<br />
Entrepreneurs<br />
Rent-seekers<br />
©International Monetary Fund. Not for Redistribution
242 The Political Economy <strong>of</strong> Reform in Resource-Rich Countries<br />
entrepreneurs in productive activity and in unproductive activity are equal, and<br />
no entrepreneur has an incentive <strong>to</strong> switch between productive and unproductive<br />
activities. If <strong>the</strong> distribution <strong>of</strong> entrepreneurs is not at <strong>the</strong> intersection in <strong>the</strong><br />
figure but <strong>to</strong> <strong>the</strong> left <strong>of</strong> it, income from productive activity will be higher than<br />
income from unproductive activity. In that case, entrepreneurs will have an incentive<br />
<strong>to</strong> switch from unproductive <strong>to</strong> productive activity. The number <strong>of</strong> entrepreneurs<br />
in productive activity will <strong>the</strong>n rise, and <strong>the</strong> number in unproductive<br />
activity will decline, until we are back at <strong>the</strong> intersection.<br />
If we are in a situation <strong>to</strong> <strong>the</strong> right <strong>of</strong> <strong>the</strong> intersection, we will see <strong>the</strong> opposite<br />
movement. Here, <strong>the</strong> income <strong>of</strong> <strong>the</strong> unproductive entrepreneur is higher than <strong>the</strong><br />
income <strong>of</strong> <strong>the</strong> productive one, and entrepreneurs will switch from productive <strong>to</strong><br />
unproductive activity until we are back in <strong>the</strong> intersection, where <strong>the</strong> income <strong>of</strong> an<br />
entrepreneur is equal in unproductive and in productive activity. The intersection<br />
and <strong>the</strong> distribution <strong>of</strong> entrepreneurs between productive and unproductive activity<br />
implies, and <strong>the</strong>refore represents, a situation <strong>of</strong> stable equilibrium. In <strong>the</strong> continuation,<br />
we assume that <strong>the</strong> curve for rent seekers is steeper than <strong>the</strong> curve for productive<br />
entrepreneurs, implying that in equilibrium we have a positive number <strong>of</strong> both<br />
rent seekers and entrepreneurs. If <strong>the</strong> curve for rent seekers is less steep than <strong>the</strong><br />
curve for productive entrepreneurs we have two stable equilibria; one where all<br />
entrepreneurs are rent seekers and one where no entrepreneurs are rent seekers.<br />
The next question is how resource abundance influences <strong>the</strong> equilibrium. This<br />
is shown in Figure 13.4. Resource abundance represents improved income opportunities<br />
for those who are engaged in political rent seeking, destructive banditry,<br />
and corruption. When <strong>the</strong>re are more natural resources up for grabs, and when<br />
<strong>the</strong> political system allows such grabbing, it becomes relatively more attractive <strong>to</strong><br />
be a rent seeker. The curve that represents income opportunities in rent seeking<br />
thus shifts upward in <strong>the</strong> figure, as shown with <strong>the</strong> dotted curve in Figure 13.4.<br />
The conclusion is surprising: Better income opportunities for every entrepreneur<br />
cause <strong>the</strong> income <strong>of</strong> every entrepreneur <strong>to</strong> fall.<br />
Figure 13.4<br />
Income<br />
Entrepreneurs<br />
Income with<br />
much resources<br />
Rent-seekers’ curve shifts up<br />
Income with<br />
little resources<br />
Rent-seekers<br />
©International Monetary Fund. Not for Redistribution
Torvik 243<br />
The intuition behind this result is as follows: More natural resources make it<br />
more pr<strong>of</strong>itable <strong>to</strong> be a rent seeker, and thus more people choose rent seeking and<br />
fewer choose productive activity. The combination <strong>of</strong> a greater number <strong>of</strong> rent<br />
seekers and a smaller number <strong>of</strong> productive entrepreneurs reduces <strong>the</strong> income <strong>of</strong><br />
every productive entrepreneur. However, lower income from productive activity<br />
makes it relatively even more attractive <strong>to</strong> engage in rent seeking. This leads <strong>to</strong> a<br />
fur<strong>the</strong>r fall in <strong>the</strong> number <strong>of</strong> productive entrepreneurs, a fur<strong>the</strong>r fall in <strong>the</strong><br />
income for those who are engaged in productive activity, an even greater reduction<br />
in <strong>the</strong> number <strong>of</strong> productive people and an increase in <strong>the</strong> number <strong>of</strong> rent<br />
seekers, and so on. Resource abundance thus initiates a multiplier process—but<br />
<strong>the</strong> bad news is that <strong>the</strong> multiplier is negative. The reason this process will not<br />
continue indefinitely is that <strong>the</strong> income <strong>of</strong> rent seekers, <strong>to</strong>o, falls when <strong>the</strong>re are<br />
more rent seekers and fewer productive agents.<br />
In <strong>the</strong> new economic equilibrium, it must be <strong>the</strong> case that what at first seemed<br />
like a better income opportunity for private entrepreneurs is a disadvantage for<br />
each and every one <strong>of</strong> <strong>the</strong>m: Political systems that do not prevent rent seekers<br />
from taking advantage <strong>of</strong> resource abundance make <strong>the</strong> income <strong>of</strong> every entrepreneur<br />
go down—not up, as one might believe at first glance.<br />
How More Can Become Even More<br />
Consider now <strong>the</strong> same situation as above, but with <strong>the</strong> difference that reform has<br />
been undertaken so as <strong>to</strong> limit abuse <strong>of</strong> political power and <strong>to</strong> combat rent seeking.<br />
In such a case, an increase in natural resources does not benefit <strong>the</strong> rent<br />
seekers; on <strong>the</strong> contrary resource abundance benefits <strong>the</strong> producers in <strong>the</strong> economy,<br />
who get access <strong>to</strong> more new economic opportunities than before. Thus, as<br />
represented in Figure 13.5, <strong>the</strong> curve for producers now shifts upward. As shown,<br />
in <strong>the</strong> new equilibrium income is higher than before. However, note that <strong>the</strong><br />
increase in income is larger than <strong>the</strong> vertical shift in <strong>the</strong> curve, so <strong>the</strong> increase in<br />
income is larger than <strong>the</strong> value <strong>of</strong> <strong>the</strong> increased opportunities, which are measured<br />
by <strong>the</strong> vertical distance <strong>of</strong> <strong>the</strong> shift.<br />
Figure 13.5<br />
Income<br />
Entrepreneurs’ curve shifts up<br />
Entrepreneurs<br />
Income with<br />
little resources<br />
Income with<br />
much resources<br />
Rent-seekers<br />
©International Monetary Fund. Not for Redistribution
244 The Political Economy <strong>of</strong> Reform in Resource-Rich Countries<br />
The intuition for this is that as in <strong>the</strong> earlier case, where reform has not been<br />
undertaken, resource abundance induces a multiplier effect, but now <strong>the</strong> multiplier<br />
is positive ra<strong>the</strong>r than negative. When production becomes more valuable<br />
entrepreneurs enter in<strong>to</strong> productive activity. In turn, <strong>the</strong> lower number <strong>of</strong> entrepreneurs<br />
in unproductive activity and <strong>the</strong> higher number <strong>of</strong> entrepreneurs in<br />
productive activity mean that pr<strong>of</strong>it in productive activity increases fur<strong>the</strong>r,<br />
inducing more entrepreneurs <strong>to</strong> flow in<strong>to</strong> production, and so on. The end result<br />
<strong>of</strong> this process is that because <strong>of</strong> a more favorable allocation <strong>of</strong> talent, <strong>the</strong> increase<br />
in income is higher than <strong>the</strong> initial increase in resource abundance. Resource<br />
abundance <strong>the</strong>n stimulates ra<strong>the</strong>r than retards productive economic activity.<br />
Note that even though we have a full utilization <strong>of</strong> resources, fully flexible<br />
prices, and rational agents, we obtain a multiplier effect that resembles <strong>the</strong> one in<br />
<strong>the</strong> simplest Keynesian model. But <strong>the</strong> reason for <strong>the</strong> multiplier is different. It<br />
stems from channelling scarce fac<strong>to</strong>r inputs in<strong>to</strong> more socially productive uses<br />
ra<strong>the</strong>r than from an increased utilization <strong>of</strong> fac<strong>to</strong>r inputs.<br />
WHICH REFORMS?<br />
The model above sheds some light on why we may observe huge variations in <strong>the</strong><br />
way countries respond <strong>to</strong> resource abundance. However, due <strong>to</strong> <strong>the</strong> model’s<br />
reduced form nature, it is relatively silent on precisely which characteristics separate<br />
countries where resource abundance induces prosperity from those where<br />
resource abundance retards prosperity. Recent research has identified at least some<br />
dimensions that are decisive, and <strong>the</strong>se are discussed next.<br />
Democracy versus Au<strong>to</strong>cracy<br />
Among o<strong>the</strong>rs, Bulte and Damania (2008) find that it is especially in countries<br />
with weak democracy that resource abundance tends <strong>to</strong> generate negative outcomes.<br />
In such countries <strong>the</strong> voters’ control <strong>of</strong> politicians is weaker, in turn leading<br />
politicians <strong>to</strong> choose policies that maximize <strong>the</strong>ir own interests but put <strong>the</strong><br />
economy <strong>of</strong>f its optimal growth path from <strong>the</strong> point <strong>of</strong> view <strong>of</strong> society.<br />
Presidentialism versus Parliamentiarism<br />
Andersen and Aslaksen (2008) find <strong>the</strong> following: on average, resource abundance<br />
reduces growth in democratic countries with presidentialism, but not in<br />
democratic countries with parliamentarism. The result in Andersen and Aslaksen<br />
(2008) is a strong indication for a close connection between political incentives<br />
and <strong>the</strong> resource curse, although we still have a somewhat limited understanding<br />
<strong>of</strong> why presidential countries react less favorably <strong>to</strong> resource abundance than<br />
parliamentary ones. One hypo<strong>the</strong>sis may be that <strong>the</strong> political checks in presidential<br />
countries are weaker than in parliamentary ones. With <strong>the</strong> exception <strong>of</strong> <strong>the</strong><br />
U.S. presidential system, many presidential systems around <strong>the</strong> world feature<br />
strong presidential power that is checked by parliament only <strong>to</strong> a limited degree.<br />
Indeed, as argued by Robinson and Torvik (2010a), <strong>the</strong> growing incidence <strong>of</strong><br />
©International Monetary Fund. Not for Redistribution
Torvik 245<br />
presidential rule in many developing countries has been associated with fewer and<br />
not more checks and balances. For instance, most African countries started <strong>of</strong>f<br />
with a parliamentary system at independence. Today, nearly all <strong>the</strong>se countries<br />
have since changed <strong>the</strong>ir constitutions <strong>to</strong> a presidential system. A challenge with<br />
<strong>the</strong>se systems is <strong>to</strong> ensure that <strong>the</strong>y do not concentrate power within an economic<br />
and political elite but instead allow greater economic opportunities <strong>to</strong> be<br />
utilized by a broad segment <strong>of</strong> society.<br />
Institutional Quality<br />
Several authors, such as Mehlum, Moene, and Torvik (2006) and Boschini,<br />
Pettersson, and Roine (2007), have shown that when economic and political<br />
institutions feature checks on politicians and secure property rights, <strong>the</strong>n resource<br />
abundance stimulates growth. But with limited checks and balances and unsecure<br />
property rights, resource abundance retards growth. In <strong>the</strong>se latter cases, resource<br />
abundance stimulates grabber activity, in turn crowding out productive activity.<br />
Again we note <strong>the</strong> key role <strong>of</strong> incentives: <strong>the</strong> institutions matter because <strong>the</strong>y<br />
affect <strong>the</strong> incentives that political and private agents face when a new income<br />
opportunity arises.<br />
Type <strong>of</strong> <strong>Resources</strong><br />
Boschini, Pettersson, and Roine (2007) produced what is probably <strong>the</strong> most<br />
detailed study on how different types <strong>of</strong> natural resources affect growth and how<br />
this is linked <strong>to</strong> <strong>the</strong> quality <strong>of</strong> institutions. These authors use four different measures<br />
<strong>of</strong> resources and find that crucial for growth implications is <strong>the</strong> combination<br />
<strong>of</strong> institutional quality and <strong>the</strong> “lootability” <strong>of</strong> resources. The worst possible<br />
growth effect from natural resources stems from <strong>the</strong> combination <strong>of</strong> diamonds in<br />
countries with weak institutions.<br />
Offshore versus Onshore Oil<br />
There are some indications that countries with <strong>of</strong>fshore oil fare better than countries<br />
with onshore oil. For instance, Lujala (2010) finds that onshore oil increases<br />
<strong>the</strong> risk <strong>of</strong> violent conflict in a country, but that <strong>of</strong>fshore oil has no effect on <strong>the</strong><br />
risk <strong>of</strong> conflict onset. This finding may reflect <strong>the</strong> fact that onshore oil represents<br />
different incentives and opportunities for rebel groups than <strong>of</strong>fshore oil. Offshore<br />
oil installations are easier <strong>to</strong> protect, and <strong>the</strong> operations <strong>of</strong> an <strong>of</strong>fshore oil field can<br />
be more or less independent from activities onshore. Onshore oil provides different<br />
ac<strong>to</strong>rs with better possibilities for using violence and predation <strong>to</strong> grab part<br />
<strong>of</strong> <strong>the</strong> oil resources, which in turn may be socially destabilizing.<br />
Early versus Late Industrialization<br />
Entering <strong>the</strong> 1900s, Norway was (<strong>to</strong>ge<strong>the</strong>r with Ireland) one <strong>of</strong> poorest countries <strong>of</strong><br />
Europe. Today Norway is one <strong>of</strong> <strong>the</strong> richest countries in <strong>the</strong> world. This remarkable<br />
©International Monetary Fund. Not for Redistribution
246 The Political Economy <strong>of</strong> Reform in Resource-Rich Countries<br />
transition has been driven by <strong>the</strong> exploitation <strong>of</strong> natural resources. It started with fish,<br />
timber, and minerals, continued with hydroelectric power, and since <strong>the</strong> 1970s has<br />
developed oil and natural gas as key sec<strong>to</strong>rs. It is obvious that natural resources have<br />
been a blessing for Norway. Economic his<strong>to</strong>rians, in particular Gavin Wright (see e.g.<br />
David and Wright, 1997), have pointed out that looking back in time resource abundance<br />
has been a main driver <strong>of</strong> growth ra<strong>the</strong>r than being <strong>the</strong> opposite. For example,<br />
in Finland, Sweden, Norway, Australia, Canada, and <strong>the</strong> United States <strong>the</strong>re is little<br />
doubt that resources have his<strong>to</strong>rically promoted growth and industrialization.<br />
Contrasting <strong>the</strong> literature in economic his<strong>to</strong>ry with <strong>the</strong> literature on <strong>the</strong> resource<br />
curse, one is led <strong>to</strong> question whe<strong>the</strong>r <strong>the</strong> effect <strong>of</strong> resource abundance has changed<br />
over time—and if it has, <strong>the</strong>n why?<br />
One hypo<strong>the</strong>sis is that an eventual change in <strong>the</strong> growth effect <strong>of</strong> natural<br />
resources has been found because countries with different degrees <strong>of</strong> institutional<br />
quality industrialized at different times. As shown by Acemoglu, Johnson, and<br />
Robinson (2001, 2002) <strong>the</strong> countries that industrialized first were those with <strong>the</strong> best<br />
quality <strong>of</strong> institutions. Therefore, <strong>the</strong> countries that industrialized early had an institutional<br />
apparatus in place that prevented <strong>the</strong> negative growth effects <strong>of</strong> resources,<br />
while those that first utilized <strong>the</strong>ir resources at a later stage did not have such institutions<br />
in place. Karl (1997) was an early proponent <strong>of</strong> <strong>the</strong> view that a resource discovery<br />
is worse for a country that has not yet developed its institutions.<br />
Taking S<strong>to</strong>ck<br />
Most dimensions where <strong>the</strong> successful resource-abundant countries differ from<br />
<strong>the</strong> less successful resource-abundant countries can be linked <strong>to</strong> differences in<br />
economic and political incentives. Moreover, <strong>the</strong> design and reform <strong>of</strong> institutions<br />
<strong>to</strong> deal with resource incomes will <strong>the</strong>mselves be shaped by <strong>the</strong> initial<br />
political incentives. This may create massive economic and political divergence.<br />
Countries with strong institutions reform those institutions fur<strong>the</strong>r <strong>to</strong> take advantage<br />
<strong>of</strong> <strong>the</strong> new economic opportunities, while countries with weak institutions<br />
may reform in directions not conducive <strong>to</strong> prosperity.<br />
But <strong>the</strong>re are also interesting lessons <strong>to</strong> draw from within <strong>the</strong> group <strong>of</strong> countries<br />
that are resource-abundant and have strong institutions. A key element in economic<br />
reform here is <strong>the</strong> establishment <strong>of</strong> petroleum funds. These funds, however, have<br />
been set up in different ways within this group <strong>of</strong> countries. Such differences in<br />
design have created differences in political incentives, in turn explaining differences<br />
in performance. To shed light on this, below I compare <strong>the</strong> design <strong>of</strong> three petroleum<br />
funds where initial institutions were strong, and discuss how <strong>the</strong> different<br />
political incentives built in<strong>to</strong> <strong>the</strong> funds explain <strong>the</strong>ir differences in performance.<br />
THE DESIGN OF PETROLEUM FUNDS AND POLITICAL<br />
INCENTIVES<br />
In general petroleum funds may or may not assist in <strong>the</strong> challenges that<br />
resource-abundant countries face. When institutions do not place strong checks<br />
©International Monetary Fund. Not for Redistribution
Torvik 247<br />
on politicians, petroleum funds may simply make <strong>the</strong> problem worse, because<br />
<strong>the</strong> funds concentrate <strong>the</strong> resource income. In turn, such concentration may<br />
make it easier for <strong>the</strong> political elite <strong>to</strong> monopolize <strong>the</strong> property rights <strong>to</strong> <strong>the</strong><br />
resource wealth.<br />
When institutions do place strong checks on politicians, however, petroleum<br />
funds may contribute <strong>to</strong> a socially beneficial development. Petroleum funds may<br />
help ensure a sustainable use <strong>of</strong> <strong>the</strong> petroleum wealth and efficient management<br />
<strong>of</strong> that wealth, and that payments out <strong>of</strong> <strong>the</strong> fund are allocated <strong>to</strong> socially efficient<br />
projects. However, even in easy places <strong>the</strong> design <strong>of</strong> petroleum funds is difficult.<br />
This can be seen by comparing <strong>the</strong> experiences <strong>of</strong> three petroleum funds in<br />
Alberta, Alaska, and Norway.<br />
The institutional design <strong>of</strong> a petroleum fund differs along three main<br />
dimensions:<br />
• The inflow <strong>of</strong> resources in<strong>to</strong> <strong>the</strong> fund<br />
• The management <strong>of</strong> <strong>the</strong> fund, and<br />
• The payments out <strong>of</strong> <strong>the</strong> fund.<br />
In <strong>the</strong> next subsections, we describe and contrast <strong>the</strong> three petroleum funds<br />
with a special emphasis on <strong>the</strong>se dimensions and discuss <strong>the</strong> political incentives<br />
and <strong>the</strong> political outcomes <strong>the</strong>se designs have led <strong>to</strong>.<br />
The Alberta Heritage Savings Trust Fund<br />
Alberta is <strong>the</strong> fourth largest <strong>of</strong> <strong>the</strong> Canadian provinces with a population <strong>of</strong> about<br />
3 million. Two-thirds <strong>of</strong> <strong>the</strong> province is publicly owned land, and about 80 percent<br />
<strong>of</strong> <strong>the</strong> oil and natural gas extraction takes place on this public land. In connection<br />
with <strong>the</strong> OPEC-1 oil price shock in 1973, it became clear that <strong>the</strong><br />
province would receive substantial incomes from its petroleum sec<strong>to</strong>r. As a<br />
response, in 1974 it was proposed <strong>to</strong> establish a savings fund. The Heritage Fund<br />
was established in 1976, with three main objectives:<br />
• Save for <strong>the</strong> future<br />
• Streng<strong>the</strong>n or diversify <strong>the</strong> economy, and<br />
• Improve <strong>the</strong> quality <strong>of</strong> life <strong>of</strong> Albertans.<br />
Up until 1983, 30 percent <strong>of</strong> <strong>the</strong> petroleum incomes were channelled in<strong>to</strong> <strong>the</strong><br />
fund. In <strong>the</strong> period 1984–87 this was reduced <strong>to</strong> 15 percent, before <strong>the</strong> payments<br />
in<strong>to</strong> <strong>the</strong> fund went down <strong>to</strong> zero. Since <strong>the</strong>n <strong>the</strong>re have been no additional payments<br />
in<strong>to</strong> <strong>the</strong> fund.<br />
The Heritage Fund is managed within <strong>the</strong> provincial government bureaucracy by<br />
an investment committee with members from Alberta’s Legislative Assembly. Many <strong>of</strong><br />
<strong>the</strong> investments made by <strong>the</strong> fund have been within <strong>the</strong> province, and <strong>to</strong> a large<br />
degree in publicly owned companies. This strategy has been debated. Mumey and<br />
Ostermann (1990) note that at <strong>the</strong> same time as politicians decide how much revenue<br />
is <strong>to</strong> be taken out from <strong>the</strong> companies, <strong>the</strong>y also decide how much in subsidies should<br />
be allocated <strong>to</strong> <strong>the</strong> same companies. The result <strong>of</strong> <strong>the</strong> political investment and subsidy<br />
decisions has been that many <strong>of</strong> <strong>the</strong> investments have been in companies that are<br />
©International Monetary Fund. Not for Redistribution
248 The Political Economy <strong>of</strong> Reform in Resource-Rich Countries<br />
unpr<strong>of</strong>itable, and according <strong>to</strong> Mumey and Ostermann (1990) <strong>the</strong> value <strong>of</strong> <strong>the</strong>se<br />
firms estimated by <strong>the</strong> Heritage Fund has been 10 percent above <strong>the</strong>ir actual value.<br />
Moreover, <strong>the</strong> fund has provided preferential treatment loans <strong>to</strong> o<strong>the</strong>r provinces with<br />
interest rates below market rates.<br />
There are no fixed rules for payments out <strong>of</strong> this fund. The payments are<br />
discretionary decisions made by <strong>the</strong> politicians. With <strong>the</strong> establishment <strong>of</strong> <strong>the</strong><br />
fund, <strong>the</strong> intention was <strong>to</strong> use a maximum <strong>of</strong> 5 percent <strong>of</strong> <strong>the</strong> value <strong>of</strong> <strong>the</strong> fund<br />
each year. In <strong>the</strong> first years <strong>of</strong> <strong>the</strong> fund this intention was more than fulfilled, in<br />
that no payments at all were made out <strong>of</strong> <strong>the</strong> fund until 1983. During <strong>the</strong> 1980s,<br />
<strong>the</strong> politicians decided <strong>to</strong> spend more <strong>of</strong> <strong>the</strong> fund, and at <strong>the</strong> same time <strong>the</strong>y did<br />
not take in<strong>to</strong> account that <strong>the</strong> real value <strong>of</strong> <strong>the</strong> fund was eroded by using <strong>the</strong><br />
nominal returns. Even though <strong>the</strong> payments in<strong>to</strong> <strong>the</strong> fund dried up in 1987 and<br />
onwards, <strong>the</strong> politicians decided <strong>to</strong> continue spending approximately <strong>the</strong> nominal<br />
return from <strong>the</strong> fund. Until 1995, <strong>the</strong> fund invested in a variety <strong>of</strong> projects ranging<br />
from irrigation and education <strong>to</strong> facilities, art galleries, research, parks, hospitals,<br />
and <strong>the</strong>atres. During <strong>the</strong> first half <strong>of</strong> <strong>the</strong> 1990s <strong>the</strong> real value <strong>of</strong> <strong>the</strong> fund was<br />
reduced, while <strong>the</strong> nominal value <strong>of</strong> <strong>the</strong> fund was fairly stable. After 1995 <strong>the</strong><br />
policy <strong>of</strong> using <strong>the</strong> nominal return from <strong>the</strong> fund was reversed.<br />
In 1997, <strong>the</strong> fund was restructured with a gradual transition <strong>of</strong> <strong>the</strong> old portfolio<br />
<strong>to</strong> a portfolio where 35 <strong>to</strong> 65 percent would be placed in fixed-income<br />
securities and 35 <strong>to</strong> 65 percent in equities. The three primary objectives <strong>of</strong> <strong>the</strong><br />
fund were changed <strong>to</strong><br />
• Earn income <strong>to</strong> support <strong>the</strong> government’s fiscal budget<br />
• Maximize long-term returns, and<br />
• Improve <strong>the</strong> public’s understanding <strong>of</strong> <strong>the</strong> fund.<br />
A new Legislative Standing Committee, operating at arm’s length from <strong>the</strong><br />
government, was put in place <strong>to</strong> ensure that <strong>the</strong> objectives and goals <strong>of</strong> <strong>the</strong> fund<br />
were met. It seems clear that <strong>the</strong> restructuring <strong>of</strong> <strong>the</strong> fund was motivated by <strong>the</strong><br />
experiences <strong>to</strong> date, although some claim that <strong>the</strong> restructuring has limited practical<br />
importance. For instance, Warrack and Keddie (2002, p. 9) report that<br />
many Albertans question whe<strong>the</strong>r <strong>the</strong>re is substantial change <strong>to</strong> <strong>the</strong> fund.<br />
Proponents argue that <strong>the</strong> Heritage Fund is nothing more than a political lever<br />
used <strong>to</strong> implement and reinforce public policy decisions. They allude <strong>to</strong> <strong>the</strong> fact<br />
that income is transferred directly in<strong>to</strong> General Revenues, indicating that <strong>the</strong><br />
direction <strong>of</strong> <strong>the</strong> fund is dependent on <strong>the</strong> desires <strong>of</strong> <strong>the</strong> government <strong>of</strong> <strong>the</strong> day.<br />
Whatever position one may have on <strong>the</strong> 1997 restructuring <strong>of</strong> <strong>the</strong> Heritage<br />
Fund, it seems clear that <strong>the</strong>re are important lessons <strong>to</strong> draw about how <strong>the</strong> political<br />
incentives built in<strong>to</strong> <strong>the</strong> fund in <strong>the</strong> first two decades shaped policy. The<br />
objectives <strong>of</strong> <strong>the</strong> fund were unclear and may have been partly in contradiction.<br />
The objective <strong>of</strong> saving for <strong>the</strong> future can be measured by <strong>the</strong> development in <strong>the</strong><br />
value <strong>of</strong> <strong>the</strong> fund, while <strong>the</strong> objective <strong>to</strong> improve <strong>the</strong> quality <strong>of</strong> life <strong>of</strong> Albertans<br />
is not very specific and is hard <strong>to</strong> measure. In addition, this second objective may<br />
<strong>to</strong> some degree be in conflict with <strong>the</strong> objective <strong>of</strong> saving for <strong>the</strong> future. The fund<br />
©International Monetary Fund. Not for Redistribution
Torvik 249<br />
has a large degree <strong>of</strong> heterogeneity in its investments, which range from financial<br />
investments <strong>to</strong> recreation areas. The fund seems <strong>to</strong> have been much influenced by<br />
shifting political priorities, and it is hard <strong>to</strong> discriminate between those positions<br />
<strong>of</strong> <strong>the</strong> fund that should be thought <strong>of</strong> as investments and those that should be<br />
thought <strong>of</strong> as consumption spending. The 1997 restructuring <strong>of</strong> <strong>the</strong> fund was<br />
partly motivated by <strong>the</strong> need <strong>to</strong> improve <strong>the</strong> public’s understanding <strong>of</strong> it, which<br />
indicates that <strong>the</strong> initial institutional design <strong>of</strong> <strong>the</strong> fund had unclear objectives<br />
and that it was unclear how <strong>to</strong> measure its performance.<br />
The his<strong>to</strong>ry <strong>of</strong> <strong>the</strong> Alberta Heritage Fund shows <strong>the</strong> importance <strong>of</strong> political<br />
incentives when designing institutions. The decisions on payments in<strong>to</strong> <strong>the</strong> fund,<br />
<strong>the</strong> management <strong>of</strong> <strong>the</strong> fund, and <strong>the</strong> payments out <strong>of</strong> <strong>the</strong> fund were all discretionary<br />
political decisions. The strength <strong>of</strong> this is that <strong>the</strong>re is strong day-<strong>to</strong>-day<br />
democratic control <strong>of</strong> <strong>the</strong> fund. The obvious weakness is that, especially with<br />
unclear and unmeasurable objectives, <strong>the</strong> fund becomes <strong>to</strong>o short-term and insufficiently<br />
transparent. The design includes those types <strong>of</strong> political incentives that<br />
may easily produce myopic behavior and inefficiency. The payments in<strong>to</strong> <strong>the</strong><br />
fund were reduced over time and eventually s<strong>to</strong>pped. Political considerations<br />
replaced economic considerations in <strong>the</strong> fund’s investment decisions. The payments<br />
out <strong>of</strong> <strong>the</strong> fund were larger than <strong>the</strong> original objective. Warrack (2005,<br />
p. 17) is highly critical <strong>of</strong> <strong>the</strong> way <strong>the</strong> Alberta Heritage Fund developed and<br />
argues that <strong>the</strong> main problem was its institutional design: “Time has demonstrated<br />
that <strong>the</strong> governance system in place was faulty—it was not resilient <strong>to</strong><br />
changing fiscal circumstances.” According <strong>to</strong> Cowper (2007, p. 224):<br />
Over time it became clear that <strong>the</strong> AHFs’ (Alberta Heritage Fund) purpose was<br />
indistinguishable from <strong>the</strong> role <strong>of</strong> <strong>the</strong> Parliament. Not surprisingly, <strong>the</strong> ASF<br />
“invested” in social improvements and infrastructure normally paid for by <strong>the</strong><br />
provincial government. Its investments <strong>to</strong> diversify <strong>the</strong> Alberta economy were<br />
politically inspired and most <strong>of</strong> <strong>the</strong>m were conspicuous fallacies.<br />
The Alaska Permanent Fund<br />
Alaska is one <strong>of</strong> <strong>the</strong> U.S. states with <strong>the</strong> smallest populations, containing only<br />
about 600,000 people. As <strong>of</strong> 2010, about 90 percent <strong>of</strong> <strong>the</strong> state’s income stems<br />
from petroleum income. In 1969, Alaska auctioned 164 drilling rights on publicly<br />
owned land, resulting in an income large enough <strong>to</strong> fund eight years <strong>of</strong> <strong>the</strong><br />
state’s budget. The income from <strong>the</strong> auctions was soon used for investments, in<br />
particular in infrastructure. According <strong>to</strong> Warrack and Keddie (2002, p. 11),<br />
“Soon public opinion was that a significant portion <strong>of</strong> <strong>the</strong> money has been<br />
wasted.” There were widespread arguments that all inhabitants <strong>of</strong> Alaska should<br />
have a part <strong>of</strong> <strong>the</strong> future petroleum income. The Alaska Permanent Fund was<br />
initially proposed by a state legisla<strong>to</strong>r and quickly attracted public support. In<br />
1976, <strong>the</strong> citizens were asked whe<strong>the</strong>r <strong>to</strong> include <strong>the</strong> proposal “as a constitutional<br />
amendment, so as <strong>to</strong> ward <strong>of</strong>f future legislative ‘raids’ on <strong>the</strong> fund”<br />
(Cowper 2007, p. 223). Almost two-thirds <strong>of</strong> <strong>the</strong> elec<strong>to</strong>rate approved <strong>the</strong> proposal,<br />
and The Alaska Permanent Fund was established.<br />
©International Monetary Fund. Not for Redistribution
250 The Political Economy <strong>of</strong> Reform in Resource-Rich Countries<br />
The main objectives <strong>of</strong> <strong>the</strong> fund became <strong>the</strong>se: <strong>to</strong> achieve high real returns<br />
with low risk, <strong>to</strong> undertake cost-efficient management, and <strong>to</strong> <strong>of</strong>fer transparency<br />
<strong>to</strong> increase accountability. The fund is made up by two parts. The “Principal” is<br />
<strong>the</strong> main body <strong>of</strong> <strong>the</strong> fund, and it is <strong>the</strong> payments in<strong>to</strong> <strong>the</strong> Principal, <strong>the</strong> management<br />
<strong>of</strong> <strong>the</strong> Principal, and <strong>the</strong> payments out <strong>of</strong> <strong>the</strong> Principal that are contained<br />
in <strong>the</strong> constitutional amendment. The o<strong>the</strong>r body, <strong>the</strong> “Earnings Reserve,” can be<br />
unders<strong>to</strong>od as an account where remaining money not allocated <strong>to</strong> <strong>the</strong> Principal<br />
is transferred. (The next section <strong>of</strong> this chapter, after a short description <strong>of</strong> <strong>the</strong> use<br />
<strong>of</strong> <strong>the</strong> Earnings Reserve, will concentrate on <strong>the</strong> Principal and refer <strong>to</strong> that as “<strong>the</strong><br />
fund.”)<br />
Until 1980, 25 percent <strong>of</strong> <strong>the</strong> royalties from <strong>the</strong> petroleum sec<strong>to</strong>r were allocated<br />
<strong>to</strong> <strong>the</strong> Principal. (Note, however, that as pointed out by Hannesson (2001,<br />
p. 59), even if <strong>the</strong> constitution specifies that at least 25 percent <strong>of</strong> <strong>the</strong> royalties<br />
shall be allocated in<strong>to</strong> <strong>the</strong> Principal, this amounts <strong>to</strong> about 10 <strong>to</strong> 15 percent <strong>of</strong><br />
petroleum income, which also consists <strong>of</strong> various taxes). From 1980 onwards, it<br />
was decided that <strong>the</strong> share <strong>of</strong> royalties that goes in<strong>to</strong> <strong>the</strong> fund would be 50 percent<br />
(a decision that is not part <strong>of</strong> <strong>the</strong> constitution). The use <strong>of</strong> <strong>the</strong> remaining money<br />
in <strong>the</strong> Earnings Reserve is politically decided, but <strong>the</strong> politicians traditionally<br />
have decided <strong>to</strong> transfer more <strong>of</strong> <strong>the</strong> royalties in<strong>to</strong> <strong>the</strong> fund so as <strong>to</strong> keep <strong>the</strong> real<br />
value <strong>of</strong> <strong>the</strong> Principal. But again, this is a yearly discretionary decision that is<br />
not part <strong>of</strong> <strong>the</strong> constitution. The size <strong>of</strong> <strong>the</strong> fund as <strong>of</strong> Oc<strong>to</strong>ber 2010 was<br />
US$37,188,100,000 (see http://www.apfc.org).<br />
The fund is operated by a public corporation, <strong>the</strong> Alaska Permanent Fund<br />
Corporation. This is a separate and independent body managed by a board <strong>of</strong> six<br />
individuals, a majority <strong>of</strong> four being elected members <strong>of</strong> <strong>the</strong> public with an expertise<br />
in finance and business management while <strong>the</strong> Commissioner <strong>of</strong> <strong>the</strong> Revenue<br />
and an appointee <strong>of</strong> <strong>the</strong> governor’s make up <strong>the</strong> o<strong>the</strong>r two. The investment<br />
composition <strong>of</strong> <strong>the</strong> fund is currently about 18 percent invested in U.S. bonds,<br />
18 percent in U.S. s<strong>to</strong>cks, 3 percent in foreign bonds, 32 percent in foreign s<strong>to</strong>cks,<br />
10 percent in real estate, and <strong>the</strong> remainder in various o<strong>the</strong>r financial instruments.<br />
Payments out <strong>of</strong> <strong>the</strong> fund are specified in <strong>the</strong> constitution. The net return for<br />
<strong>the</strong> preceding five years is added up, and 21 percent <strong>of</strong> those returns can be spent<br />
(given that this amount does not exceed <strong>the</strong> sum <strong>of</strong> net income <strong>of</strong> <strong>the</strong> fund during<br />
<strong>the</strong> last year and what is left in <strong>the</strong> Earnings Reserve account). Normally, half <strong>of</strong><br />
what is spent has been distributed as a lump sum transfer <strong>to</strong> <strong>the</strong> inhabitants <strong>of</strong><br />
<strong>the</strong> state. Note that this is also a political decision and not part <strong>of</strong> <strong>the</strong> constitution.<br />
In 2010, <strong>the</strong> dividend paid out <strong>to</strong> each inhabitant was US$1,281.<br />
Toward <strong>the</strong> end <strong>of</strong> <strong>the</strong> 1990s, <strong>the</strong> State <strong>of</strong> Alaska got in<strong>to</strong> economic problems<br />
with <strong>the</strong> decrease in <strong>the</strong> oil price. It was debated whe<strong>the</strong>r <strong>the</strong> state should use <strong>the</strong><br />
fund <strong>to</strong> cover its budget deficit. In 1999, voters defeated such a proposal by a<br />
large majority.<br />
In recent years <strong>the</strong>re has also been a debate about changing <strong>the</strong> rules in <strong>the</strong><br />
constitution that determine <strong>the</strong> yearly spending out <strong>of</strong> <strong>the</strong> fund. In particular,<br />
three aspects have been criticized. First, it would have been better <strong>to</strong> link <strong>the</strong> payments<br />
out <strong>of</strong> <strong>the</strong> fund <strong>to</strong> <strong>the</strong> market value <strong>of</strong> <strong>the</strong> fund ra<strong>the</strong>r than <strong>to</strong> <strong>the</strong> five-year<br />
©International Monetary Fund. Not for Redistribution
Torvik 251<br />
average return. Even <strong>the</strong> five-year return may display high volatility (and possibly<br />
be procyclical). Second, an active political decision has <strong>to</strong> be taken each year <strong>to</strong><br />
transfer money in<strong>to</strong> <strong>the</strong> fund <strong>to</strong> protect its real value. Third, <strong>the</strong> inflation-pro<strong>of</strong>ing<br />
<strong>of</strong> <strong>the</strong> fund has been undertaken only for <strong>the</strong> Principal and not for <strong>the</strong><br />
Earnings Reserve.<br />
Against this background, <strong>the</strong> board suggested in 2004 <strong>to</strong> change <strong>the</strong> rules that<br />
govern <strong>the</strong> fund. Such a change must be approved by a constitutional amendment.<br />
The proposal <strong>of</strong> <strong>the</strong> board was announced as “POMV” which stands for<br />
“five percent <strong>of</strong> <strong>the</strong> Fund’s <strong>to</strong>tal market value.” According <strong>to</strong> <strong>the</strong> proposal, <strong>the</strong><br />
upper limit on how much could be spent from <strong>the</strong> fund should be changed from<br />
a limit based on returns <strong>to</strong> one based on 5 percent <strong>of</strong> <strong>the</strong> average market value <strong>of</strong><br />
<strong>the</strong> fund over <strong>the</strong> last five years. This would contribute <strong>to</strong> more stable payments<br />
out <strong>of</strong> <strong>the</strong> fund, and with a predicted real rate <strong>of</strong> return <strong>of</strong> 5 percent protecting<br />
<strong>the</strong> fund’s real value, it would become part <strong>of</strong> <strong>the</strong> constitution and would encompass<br />
<strong>the</strong> whole fund and not only <strong>the</strong> Principal.<br />
In <strong>the</strong> public debate over this, <strong>the</strong>re was concern that <strong>the</strong> proposal would have<br />
<strong>the</strong> effect <strong>of</strong> reducing <strong>the</strong> yearly dividend payments and that more <strong>of</strong> <strong>the</strong> spending<br />
from <strong>the</strong> fund would be used <strong>to</strong> cover <strong>the</strong> public deficit. Before <strong>the</strong> proposal<br />
could have been presented <strong>to</strong> <strong>the</strong> voters <strong>of</strong> Alaska it would have needed approval<br />
<strong>of</strong> a two-thirds majority in <strong>the</strong> state legislature, but it did not receive sufficient<br />
support and thus was not presented <strong>to</strong> voters. The board <strong>of</strong> <strong>the</strong> Alaska Permanent<br />
Fund Corporation is still <strong>of</strong> <strong>the</strong> opinion that <strong>the</strong> proposal should be implemented,<br />
and point out that “many Alaskans mistakenly believe that POMV will<br />
affect <strong>the</strong> dividend program.” The constitution does not include rules about <strong>the</strong><br />
dividends being paid <strong>to</strong> <strong>the</strong> inhabitants.<br />
The Norwegian Petroleum Fund<br />
Norway discovered petroleum in <strong>the</strong> 1960s and became an oil producer in 1973.<br />
The Norwegian Petroleum Fund—which is now <strong>of</strong>ficially renamed <strong>the</strong><br />
“Government Pension Fund Global”—was established in 1990, and <strong>the</strong> first<br />
deposits in<strong>to</strong> <strong>the</strong> fund where made in 1996. Compared with <strong>the</strong> funds <strong>of</strong> Alberta<br />
and Alaska, <strong>the</strong> Norwegian Petroleum Fund is better integrated in<strong>to</strong> and coordinated<br />
with <strong>the</strong> country’s overall macroeconomic policy.<br />
A major shift in Norway’s macroeconomic policy composition was undertaken<br />
in 2001 (see Norway, Ministry <strong>of</strong> Finance, 2001). Up until <strong>the</strong>n <strong>the</strong> monetary<br />
policy had formally aimed <strong>to</strong> keep <strong>the</strong> exchange rate stable, while fiscal policy had<br />
aimed <strong>to</strong> dampen fluctuations in output and employment. As in o<strong>the</strong>r countries,<br />
<strong>the</strong> experience with countercyclical fiscal policy and <strong>the</strong> fixed exchange rate regime<br />
had been mixed. In addition, with <strong>the</strong> dependence on nonrenewable resource<br />
exports, it was seen <strong>to</strong> be crucial for Norway <strong>to</strong> adopt a more long-term view <strong>of</strong><br />
fiscal policy. Thus monetary policy was given a more prominent role in short-term<br />
stabilization through <strong>the</strong> adoption <strong>of</strong> a flexible inflation target, while a new socalled<br />
rule (which is not a rule but an objective) stated that over <strong>the</strong> cycle <strong>the</strong> real<br />
return (predicted as 4 percent annually) <strong>of</strong> <strong>the</strong> petroleum fund could be spent.<br />
©International Monetary Fund. Not for Redistribution
252 The Political Economy <strong>of</strong> Reform in Resource-Rich Countries<br />
The payments in<strong>to</strong> <strong>the</strong> fund consist <strong>of</strong> <strong>the</strong> return on <strong>the</strong> fund, government petroleum<br />
income, and net financial transactions in relation <strong>to</strong> petroleum activity. In Norway<br />
all government income from <strong>the</strong> petroleum sec<strong>to</strong>r is channelled in<strong>to</strong> <strong>the</strong> fund.<br />
The management <strong>of</strong> <strong>the</strong> fund has been delegated from <strong>the</strong> Ministry <strong>of</strong> Finance <strong>to</strong><br />
a separate unit within <strong>the</strong> central bank, <strong>the</strong> Norges Bank Investment Management. 1<br />
All investments <strong>of</strong> <strong>the</strong> fund are in foreign assets, and over time <strong>the</strong> investment universe<br />
has been expanded <strong>to</strong> allow for such assets as private sec<strong>to</strong>r bonds and real estate.<br />
In 2006, <strong>the</strong> maximum share <strong>the</strong> petroleum fund could invest in one company was<br />
increased from 3 percent <strong>to</strong> 5 percent.<br />
The amount that is paid out from <strong>the</strong> fund is a yearly decision made by<br />
Parliament. This amount covers <strong>the</strong> public sec<strong>to</strong>r deficit, excluding petroleum<br />
income. The objective is that <strong>the</strong> payments out <strong>of</strong> <strong>the</strong> fund shall equal <strong>the</strong> real<br />
return <strong>of</strong> <strong>the</strong> fund, which is expected <strong>to</strong> be 4 percent on an annual basis. In<br />
Norway, this is known as <strong>the</strong> “rule for <strong>the</strong> use <strong>of</strong> petroleum money,” although this<br />
is not a binding rule. There are no formal institutional designs that limit <strong>the</strong><br />
spending out <strong>of</strong> <strong>the</strong> fund. How much <strong>to</strong> use is continuously debated, and some<br />
politicians argue that Norway should use more <strong>of</strong> <strong>the</strong> fund than it is now using.<br />
The actual use <strong>of</strong> petroleum revenues has exceeded <strong>the</strong> 4 percent objective.<br />
The rule for <strong>the</strong> use <strong>of</strong> petroleum money also includes <strong>the</strong> possibility that in<br />
economic downturns one can pursue an active fiscal policy and use more than <strong>the</strong><br />
4 percent <strong>of</strong> <strong>the</strong> fund. Thus, even if monetary policy has been given a more<br />
prominent role in macroeconomic stabilization policy, fiscal policy still has some<br />
short-term, and not only long-term, considerations.<br />
A summary <strong>of</strong> some main points in <strong>the</strong> design and management <strong>of</strong> <strong>the</strong> three<br />
petroleum funds just discussed is outlined in Table 13.1.<br />
Comparing Experiences <strong>of</strong> <strong>the</strong> Petroleum Funds<br />
We can now briefly compare how <strong>the</strong> different political incentives <strong>of</strong> <strong>the</strong> three<br />
funds just described have mapped in<strong>to</strong> different experiences in <strong>the</strong>ir operation.<br />
There are major differences between <strong>the</strong> three funds when it comes <strong>to</strong> payments<br />
in, management, and payments out <strong>of</strong> <strong>the</strong> funds.<br />
In Alberta and Alaska, a share <strong>of</strong> <strong>the</strong> public petroleum income is invested in<br />
<strong>the</strong> fund, while in Norway all government income from <strong>the</strong> petroleum sec<strong>to</strong>r is<br />
channelled in<strong>to</strong> <strong>the</strong> fund. With <strong>the</strong> exception <strong>of</strong> Alberta, <strong>the</strong> payments in<strong>to</strong> <strong>the</strong><br />
funds have been in accordance with <strong>the</strong> stated intentions.<br />
The management <strong>of</strong> <strong>the</strong> funds differs. In Alaska and Norway, <strong>the</strong> management<br />
has been delegated <strong>to</strong> bodies that are largely independent from politicians, while<br />
in Alberta politicians have had a hands-on approach. The management in Alaska<br />
and Norway must be considered successful, with acceptable rates <strong>of</strong> return and an<br />
investment policy in accordance with <strong>the</strong> intentions. The management in<br />
Alberta, on <strong>the</strong> o<strong>the</strong>r hand, must be characterized as not very successful. Unclear<br />
1 The Norges Bank Investment Management website provides much information about <strong>the</strong> institutional<br />
structure, investments, and value <strong>of</strong> <strong>the</strong> fund at www.nbim.no.<br />
©International Monetary Fund. Not for Redistribution
TABLE 13.1<br />
Design <strong>of</strong> three petroleum funds<br />
Alberta Heritage<br />
Fund<br />
Alaska Permanent<br />
Fund<br />
Norwegian<br />
Petroleum Fund<br />
Payments in Management Payments out<br />
Discretionary:<br />
30% →15%→0%<br />
Rules in constitution: At<br />
least 25% <strong>of</strong> royalties<br />
Guidelines:<br />
100%<br />
Political investment<br />
committee<br />
Independent company<br />
with a public majority<br />
on <strong>the</strong> board<br />
Separate unit under<br />
<strong>the</strong> central bank<br />
Discretionary:<br />
Objective: Cannot exceed 5%<br />
Rules in constitution:<br />
21% <strong>of</strong> net return <strong>of</strong> last five<br />
years<br />
Discretionary:<br />
Objective: Cannot exceed 4%<br />
Torvik 253<br />
and shifting political priorities have given low rates <strong>of</strong> return, uncertainty as <strong>to</strong><br />
what is <strong>the</strong> value <strong>of</strong> <strong>the</strong> fund, and “investments” that must be at least partly considered<br />
as consumption.<br />
The payments out <strong>of</strong> <strong>the</strong> fund are decided by rules in <strong>the</strong> constitution in<br />
Alaska, while <strong>the</strong>y are subject <strong>to</strong> discretionary political decisions in Alberta and<br />
Norway. In Alberta and Norway <strong>the</strong>re are guidelines for how much <strong>of</strong> <strong>the</strong> fund<br />
should be used, but <strong>the</strong> actual payments have exceeded <strong>the</strong>se guidelines (<strong>to</strong> a<br />
larger extent in Alberta than in Norway).<br />
There are interesting contrasts between <strong>the</strong> two petroleum funds in North<br />
America. While <strong>the</strong> value <strong>of</strong> <strong>the</strong> fund in Alberta has decreased due <strong>to</strong> politicians<br />
not following <strong>the</strong>ir own intentions, <strong>the</strong> Alaska fund has rules in <strong>the</strong> constitution<br />
that <strong>to</strong> a large extent decouple payments out <strong>of</strong> <strong>the</strong> fund from short-term political<br />
priorities. Warrack (2005, p. 17) concludes that<br />
Without an arms-length mechanism resilient <strong>to</strong>/from ebbs and flows <strong>of</strong> fiscal<br />
demands, it seems impossible for a political system <strong>to</strong> manage energy revenues<br />
responsibly. That is a sad lesson for Alberta, <strong>the</strong> province being far less successful<br />
than Alaska.<br />
Warrack (2005, p. 19) argues that <strong>the</strong> solution <strong>to</strong> this is <strong>to</strong> “establish armslength<br />
governance by Trustees at <strong>the</strong> outset, preferably by constitution.” The failed<br />
policy <strong>of</strong> <strong>the</strong> Alberta fund can be mitigated by adopting rules so that short-term<br />
bias in <strong>the</strong> use <strong>of</strong> petroleum wealth becomes more difficult.<br />
Although <strong>the</strong> experiences in Alaska have been favorable when it comes <strong>to</strong><br />
management and payments out <strong>of</strong> <strong>the</strong> fund, <strong>the</strong>y also make it clear that <strong>the</strong> institutional<br />
design is not without potential for improvement. The rules that govern<br />
payments out <strong>of</strong> <strong>the</strong> fund make it resilient <strong>to</strong> short-termism, but at <strong>the</strong> same time<br />
<strong>the</strong>y prevent what may seem as a more reasonable organization. The POMV<br />
proposal seems like a better rule for payments out <strong>of</strong> <strong>the</strong> fund than <strong>the</strong> current<br />
model, but <strong>the</strong> fact that <strong>the</strong> current system is part <strong>of</strong> <strong>the</strong> state constitution makes<br />
such a change difficult <strong>to</strong> establish. This illustrates how strict rules also come with<br />
costs because <strong>the</strong>y reduce flexibility.<br />
Moreover, one may argue that <strong>the</strong> relevant measure is not <strong>the</strong> fund itself but <strong>the</strong><br />
country’s (or region’s) overall macroeconomic development; if <strong>the</strong> rules in <strong>the</strong> relevant<br />
constitution are directed <strong>to</strong>ward <strong>the</strong> fund but <strong>the</strong>re are no rules regulating public<br />
©International Monetary Fund. Not for Redistribution
254 The Political Economy <strong>of</strong> Reform in Resource-Rich Countries<br />
sec<strong>to</strong>r deficit and borrowing, <strong>the</strong>n although <strong>the</strong> development <strong>of</strong> <strong>the</strong> fund may look<br />
sustainable <strong>the</strong> accumulation <strong>of</strong> public debt outside <strong>the</strong> fund may not be. Thus, a<br />
potential drawback in linking only one part <strong>of</strong> <strong>the</strong> public balance <strong>to</strong> rules in <strong>the</strong> constitution<br />
may be that <strong>the</strong> petroleum wealth in essence is used <strong>to</strong> back public<br />
borrowing.<br />
Although one may argue that a drawback <strong>of</strong> <strong>the</strong> Norwegian model when compared<br />
with <strong>the</strong> Alaskan one is that <strong>the</strong> payment out <strong>of</strong> <strong>the</strong> fund is a yearly discretionary<br />
policy decision, <strong>the</strong> Norwegian model also has some advantages.<br />
First, since <strong>the</strong> guidelines for using <strong>the</strong> Norwegian petroleum fund relate <strong>to</strong> its<br />
use in connection with <strong>the</strong> public sec<strong>to</strong>r deficit, <strong>the</strong>y put emphasis on overall<br />
macroeconomic balance. The guidelines say that <strong>the</strong> public sec<strong>to</strong>r deficit (over<br />
<strong>the</strong> cycle) excluding petroleum shall not exceed 4 percent <strong>of</strong> <strong>the</strong> petroleum<br />
fund. Thus, <strong>the</strong> payments out <strong>of</strong> <strong>the</strong> fund are used <strong>to</strong> cover <strong>the</strong> public sec<strong>to</strong>r<br />
deficit, and adhering <strong>to</strong> <strong>the</strong> guidelines also ensures that macro balances are<br />
respected.<br />
By contrast, in Alaska <strong>the</strong> public sec<strong>to</strong>r deficit is independent <strong>of</strong> <strong>the</strong> rules<br />
governing <strong>the</strong> petroleum fund. The fund is not well integrated with overall macroeconomic<br />
policy. One may ask what <strong>the</strong> rationale is for putting strict rules on<br />
part <strong>of</strong> <strong>the</strong> public balances, while <strong>the</strong>se rules in effect may be undermined by<br />
o<strong>the</strong>r parts <strong>of</strong> <strong>the</strong> budget. The political incentives created by <strong>the</strong> rule in Alaska do<br />
not cope well with <strong>the</strong> long-term fiscal balance in <strong>the</strong> public sec<strong>to</strong>r, while <strong>the</strong><br />
political incentives in <strong>the</strong> Norwegian model do not cope well with <strong>the</strong> temptation<br />
<strong>to</strong> use more <strong>of</strong> <strong>the</strong> fund in <strong>the</strong> short term than intended.<br />
Thus, it seems that we have yet <strong>to</strong> see a design <strong>of</strong> a petroleum fund that deals<br />
in a satisfac<strong>to</strong>ry way with <strong>the</strong> tendency for political decisions <strong>to</strong> have a shortterm<br />
bias.<br />
CONCLUSION<br />
Political institutions shape political incentives. This in turn helps explain why<br />
<strong>the</strong>re is such a huge variation in <strong>the</strong> experiences <strong>of</strong> resource-abundant countries.<br />
Dependent on initial institutions as well as <strong>the</strong> incentives <strong>the</strong>se create for fur<strong>the</strong>r<br />
policy reform, resource abundance may lower welfare or may strongly increase<br />
welfare. However, even when initial institutions are strong, <strong>the</strong>re may be a shortterm<br />
bias in political decisions, and investments may be made for political ra<strong>the</strong>r<br />
than economic reasons. The political incentives built in<strong>to</strong> petroleum funds are<br />
decisive for <strong>the</strong>ir success or failure. Transparency and strong macro institutions<br />
are necessary but not sufficient conditions for resource abundance <strong>to</strong> stimulate<br />
prosperity.<br />
REFERENCES<br />
Acemoglu, D., S. Johnson, and J.A. Robinson, 2001, “The Colonial Origins <strong>of</strong> Comparative<br />
Development: An Empirical Investigation,” American Economic Review, Vol. 91, pp.<br />
1369–1401.<br />
©International Monetary Fund. Not for Redistribution
Torvik 255<br />
________, 2002, “Reversal <strong>of</strong> Fortune: Geography and Institutions in <strong>the</strong> Making <strong>of</strong> <strong>the</strong><br />
Modern World Income Distribution,” Quarterly Journal <strong>of</strong> Economics, Vol. 118, pp.<br />
1231–94.<br />
Acemoglu, D., J.A. Robinson, and R. Torvik, 2011, “Equilibrium Checks and Balances,”<br />
unpublished (Cambridge, MA: Massachusetts Institute <strong>of</strong> Technology).<br />
Andersen, J.J., and S. Aslaksen, 2008, “Constitutions and <strong>the</strong> Resource Curse,” Journal <strong>of</strong><br />
Development Economics, Vol. 87, pp. 227–46.<br />
Boschini, A.D., J. Pettersson, and J. Roine, 2007, “Resource Curse or Not: A Question <strong>of</strong><br />
Appropriability,” Scandinavian Journal <strong>of</strong> Economics, Vol. 109, pp. 593–617.<br />
Bulte, E., and R. Damania, 2008, “<strong>Resources</strong> for Sale: Corruption, Democracy and <strong>the</strong> <strong>Natural</strong><br />
Resource Curse,” The B.E Journal <strong>of</strong> Economic Analysis & Policy, Vol. 8, No. 1.<br />
Collier, P., and A. Hoeffler, 2009, “Testing <strong>the</strong> Neocon Agenda: Democracy in Resource-Rich<br />
Societies,” European Economic Review, Vol. 53, pp. 293–308.<br />
Cowper, S., 2007, “A Word <strong>to</strong> <strong>the</strong> Wise: Managing Alaska’s Oil Wealth,” in J. Johnson-Calari<br />
and M. Rietveld, eds., Sovereign Wealth Management (London: Central Banking Publications).<br />
David, P.A., and G. Wright, 1997, “Increasing Returns and <strong>the</strong> Genesis <strong>of</strong> American Resource<br />
Abundance,” Industrial and Corporate Change, Vol. 6, pp. 203–45.<br />
Hannesson, R., 2001, Investing for Sustainability: The Management <strong>of</strong> Mineral Wealth (Bos<strong>to</strong>n:<br />
Kluwer Academic Publishers).<br />
Karl, T.L., 1997, The Paradox <strong>of</strong> Plenty: Oil Booms and Petro States (Berkeley: University <strong>of</strong><br />
California Press).<br />
Lujala, P., 2010, “The Spoils <strong>of</strong> Nature: Armed Civil Conflict and Rebel Access <strong>to</strong> <strong>Natural</strong><br />
<strong>Resources</strong>,” Journal <strong>of</strong> Peace Research, Vol. 47, pp. 15–28.<br />
Mehlum, H., K. Moene, and R. Torvik, 2006, “Institutions and <strong>the</strong> Resource Curse,” Economic<br />
Journal, Vol. 116, pp. 1–20.<br />
Mumey, G., and J. Ostermann, 1990, “Alberta Heritage Fund: Measuring Value and<br />
Achievement,” Canadian Public Policy, Vol. 26, No. 1, pp. 29–50.<br />
Norway, Ministry <strong>of</strong> Finance, 2001, “Report No. 29 <strong>to</strong> <strong>the</strong> S<strong>to</strong>rting—Guidelines for Economic<br />
Policy.” www.regjeringen.no/upload/kilde/fin/red/2005/0013/ddd/pdfv/260472-pmk_rap.<br />
pdf.<br />
Robinson, J.A., and R. Torvik, 2010a, “Endogenous Presidentialism,” unpublished (Cambridge,<br />
MA: Harvard University).<br />
———, 2010b, “Conditional Comparative Statics,” unpublished (Cambridge, MA: Harvard<br />
University).<br />
Ross, M.L., 1997, “Sources <strong>of</strong> Slow Growth in African Economies,” Journal <strong>of</strong> African<br />
Economies, Vol. 6, pp. 335–76.<br />
———, 2001a, Timber Booms and Institutional Breakdown in Sou<strong>the</strong>ast Asia (New York:<br />
Cambridge University Press).<br />
———, 2001b, “Does Oil Hinder Democracy?” World Politics, Vol. 53, pp. 325–61.<br />
Sachs, J.D., and A.M. Warner, 1995, “<strong>Natural</strong> Resource Abundance and Economic Growth,”<br />
NBER Working Paper No. 5398 (Cambridge, MA: National Bureau <strong>of</strong> Economic Research).<br />
Torvik, R., 2002, “<strong>Natural</strong> <strong>Resources</strong>, Rent Seeking and Welfare,” Journal <strong>of</strong> Development<br />
Economics, Vol. 67, pp. 455–70.<br />
Warrack, A.A., 2005, “Alberta Heritage Fund: Blessing Becoming Curse?” Information Bulletin<br />
No. 85 (Alberta: Western Centre for Economic Research, University <strong>of</strong> Alberta).<br />
Warrack, A.A., and R.R. Keddie, 2002, “<strong>Natural</strong> Resource Trust Funds: A Comparison <strong>of</strong><br />
Alberta and Alaska Resource Funds,” Information Bulletin No. 72 (Alberta: Western Centre<br />
for Economic Research, University <strong>of</strong> Alberta).<br />
©International Monetary Fund. Not for Redistribution
This page intentionally left blank<br />
©International Monetary Fund. Not for Redistribution
Terms <strong>of</strong> Trade and Growth<br />
<strong>of</strong> Resource Economies:<br />
Contrasting Evidence from<br />
Two African Countries<br />
CHAPTER 14<br />
AUGUSTIN KWASI FOSU AND ANTHONY OWUSU GYAPONG<br />
INTRODUCTION<br />
The potential danger that natural resources pose <strong>to</strong> <strong>the</strong> economy <strong>of</strong> developing<br />
countries has been receiving increasing attention in <strong>the</strong> literature. The previously<br />
reigning hypo<strong>the</strong>sis, especially in <strong>the</strong> 1950s and 1960s, was that natural resource<br />
richness implied economic prosperity. This was <strong>the</strong> “big push” view, so-named<br />
because such wealth would raise aggregate demand and hence income (see, for<br />
example, Murphy, Schleifer, and Vishny, 1989; Sachs and Warner, 1999). As<br />
many natural resource-rich countries in <strong>the</strong> developing world began <strong>to</strong> experience<br />
economic difficulties relative <strong>to</strong> resource-poor nations, however, a “resource<br />
curse” hypo<strong>the</strong>sis began <strong>to</strong> gain traction. 1 According <strong>to</strong> this hypo<strong>the</strong>sis, greater<br />
natural resource wealth would lead <strong>to</strong> less economic growth.<br />
Although Raol Prebisch and Hans Singer had already raised <strong>the</strong> issue that<br />
countries relying on <strong>the</strong> exports <strong>of</strong> primary commodities would experience<br />
relatively weak growth, 2 <strong>the</strong>ir argument relied primarily on <strong>the</strong> hypo<strong>the</strong>sized longrun<br />
deterioration in <strong>the</strong> terms <strong>of</strong> trade associated with primary products, especially<br />
agricultural products. The new resource-curse literature, however, is based on <strong>the</strong><br />
harmful effects <strong>of</strong> rents derivable from natural resources. According <strong>to</strong> this<br />
Augustin Kwasi Fosu is deputy direc<strong>to</strong>r at United Nations University, World Institute for Development<br />
Economics Research, and Anthony Owusu Gyapong is pr<strong>of</strong>essor at Penn State University-Abing<strong>to</strong>n.<br />
This chapter is based on <strong>the</strong> authors’ presentation at “<strong>Natural</strong> <strong>Resources</strong>, Finance, and Development:<br />
Confronting Old and New Challenges,” a high-level seminar organized by <strong>the</strong> Central Bank <strong>of</strong> Algeria<br />
and <strong>the</strong> IMF Institute, which <strong>to</strong>ok place in Algiers, on November 4 and 5, 2010. The authors can be<br />
contacted at Fosu@wider.unu.edu (Augustin Fosu) and aog1@psu.edu (Anthony Gyapong).<br />
1See, for example, Auty (2001), Baland and Francois (2000), Gelb and associates (1988), Gylfason,<br />
Herbertsson, and Zoega (1999), Lane and Tornell (1996), Sachs and Warner (1997, 1999, 2001), and<br />
Torvik (2002). Van der Ploeg (2008) provides a useful review.<br />
2See Prebisch (1950) and Singer (1950).<br />
©International Monetary Fund. Not for Redistribution<br />
257
258 Terms <strong>of</strong> Trade and Growth <strong>of</strong> Resource Economies: Contrasting Evidence from Two African Countries<br />
literature, terms-<strong>of</strong>-trade appreciation that raised natural resource rent could<br />
reduce economic growth; conversely, declining terms <strong>of</strong> trade that lowered <strong>the</strong> rent<br />
might actually increase growth, contrary <strong>to</strong> <strong>the</strong> Prebisch–Singer hypo<strong>the</strong>sis.<br />
Recent literature suggests, though, that whe<strong>the</strong>r natural resource abundance<br />
increases or decreases economic growth depends on <strong>the</strong> institutional architecture.<br />
Mehlum and o<strong>the</strong>rs (2006) and Robinson, Torvik, and Verdier (2006), for<br />
example, observe that resource-rich countries need not experience lower growth<br />
as long as <strong>the</strong>y are endowed with “good institutions.” None<strong>the</strong>less, it is still<br />
unclear what good institutions are and whe<strong>the</strong>r <strong>the</strong>se institutions may <strong>the</strong>mselves<br />
be eroded by natural resources.<br />
Africa is <strong>of</strong>ten characterized as <strong>the</strong> continent with <strong>the</strong> largest abundance <strong>of</strong><br />
natural resources. While most countries on <strong>the</strong> continent could be regarded as<br />
having significant natural resources, <strong>the</strong> IMF currently classifies one-third <strong>of</strong> sub-<br />
Saharan African countries as resource-rich. Among <strong>the</strong>se are Botswana and<br />
Nigeria, which are rich in non-oil and oil resources, respectively. As is generally<br />
well known, <strong>the</strong> development paths <strong>of</strong> <strong>the</strong>se countries have been quite different.<br />
While Botswana has succeeded in increasing its per capita GDP by an average <strong>of</strong><br />
about 7 percent annually since 1960, Nigeria’s per capita GDP growth has averaged<br />
approximately 1 percent (Fosu, 2010, table 1). Indeed, as Figure 14.1 shows,<br />
<strong>the</strong> growth rate <strong>of</strong> Botswana’s GDP has been well above Nigeria’s not just on average<br />
but every year, with few exceptions, until about 2002.<br />
Yet both countries have enjoyed substantial revenues from <strong>the</strong>ir natural<br />
resource wealth: primarily diamonds in Botswana and oil in Nigeria. In Botswana,<br />
diamonds have traditionally constituted 70 <strong>to</strong> 80 percent <strong>of</strong> export earnings and<br />
about one-half <strong>of</strong> <strong>the</strong> government’s revenues. In <strong>the</strong> case <strong>of</strong> Nigeria, oil has his<strong>to</strong>rically<br />
provided more than 90 percent <strong>of</strong> foreign exchange earnings and about<br />
Figure 14.1<br />
GDP growth, Botswana and Nigeria, 1961–2008<br />
Percent<br />
30<br />
25<br />
20<br />
15<br />
10<br />
5<br />
0<br />
-5<br />
-10<br />
-15<br />
-20<br />
1961<br />
1966<br />
1971<br />
1976<br />
Source: Data from World Bank (2010).<br />
1981<br />
1986<br />
1991<br />
Botswana Nigeria<br />
©International Monetary Fund. Not for Redistribution<br />
1996<br />
2001<br />
2006
Fosu and Gyapong 259<br />
80 percent <strong>of</strong> budgetary revenues (United States, CIA, 2010), with <strong>the</strong> country<br />
estimated <strong>to</strong> have accumulated oil revenues <strong>of</strong> about US$350 billion (at 1995<br />
prices) since 1965 (Sala-i-Martin and Subramanian, 2003). Thus, both countries<br />
may confidently be viewed as resource economies, although Nigeria seems <strong>to</strong> be<br />
more dependent on oil than Botswana is on diamonds.<br />
In <strong>the</strong> present chapter, we examine how <strong>the</strong> barter terms <strong>of</strong> trade, or simply<br />
terms <strong>of</strong> trade, may have affected economic growth in ei<strong>the</strong>r country. We use<br />
terms <strong>of</strong> trade, ra<strong>the</strong>r than income terms <strong>of</strong> trade or measures <strong>of</strong> actual revenues,<br />
as <strong>the</strong> relevant explana<strong>to</strong>ry variable. Terms <strong>of</strong> trade can reasonably be<br />
considered as exogenous for a given country, while o<strong>the</strong>r income-related measures<br />
are not. 3 Actually, terms <strong>of</strong> trade is probably one <strong>of</strong> <strong>the</strong> precious few bona<br />
fide exogenous variables at <strong>the</strong> country level, provided <strong>of</strong> course that a given<br />
country does not have monopoly power in <strong>the</strong> export or import <strong>of</strong> <strong>the</strong> commodity.<br />
In <strong>the</strong> next section <strong>of</strong> this chapter, we present a <strong>the</strong>oretical discussion<br />
on <strong>the</strong> channel through which terms <strong>of</strong> trade is expected <strong>to</strong> affect growth, with<br />
implications for <strong>the</strong> two countries <strong>of</strong> interest, Botswana and Nigeria. The third<br />
section <strong>the</strong>n presents <strong>the</strong> empirical model, which is estimated and discussed,<br />
respectively, in <strong>the</strong> fourth and fifth sections. The last section <strong>of</strong>fers some lessons<br />
and concluding observations.<br />
THEORETICAL DISCUSSION<br />
By relieving <strong>the</strong> balance-<strong>of</strong>-payments constraint and expanding <strong>the</strong> production set,<br />
improvements in a country’s terms <strong>of</strong> trade should in turn increase GDP, implying<br />
a positive effect <strong>of</strong> terms <strong>of</strong> trade on GDP. The rise in <strong>the</strong> relative price <strong>of</strong> exports<br />
expands <strong>the</strong> feasible set for purchasing greater quantities <strong>of</strong> production inputs and<br />
for investing in productivity-enhancing measures such as adopting more technologically<br />
efficient production processes. Several studies present evidence in support<br />
<strong>of</strong> this hypo<strong>the</strong>sis <strong>of</strong> a positive growth impact <strong>of</strong> terms <strong>of</strong> trade, including Basu<br />
and McLeod (1992) for 12 developing countries, most in Latin America. Dea<strong>to</strong>n<br />
(1999) and Dea<strong>to</strong>n and Miller (1996) fur<strong>the</strong>r bolster this hypo<strong>the</strong>sis for African<br />
countries generally. Based on a sample <strong>of</strong> 14 African countries, Bleaney and<br />
Greenaway (2001) provide additional support for <strong>the</strong> hypo<strong>the</strong>sis. 4<br />
An alternative hypo<strong>the</strong>sis is that <strong>of</strong> <strong>the</strong> resource curse, which implies that<br />
improvements in terms <strong>of</strong> trade from natural resources would adversely affect<br />
economic growth. One <strong>of</strong> <strong>the</strong> most potent explanations is that such improvements<br />
would create opportunities for rent seeking (Baland and Francois, 2000;<br />
Krueger, 1974). Rent-seeking activities <strong>the</strong>mselves tend <strong>to</strong> be nonproductive and<br />
inefficient, resulting in lower growth. Fur<strong>the</strong>rmore, resource rents from terms-<strong>of</strong>trade<br />
improvements would exert a corrosive effect on institutions (Isham and<br />
o<strong>the</strong>rs, 2003; Sala-i-Martin and Subramanian, 2003). Ano<strong>the</strong>r channel is <strong>the</strong><br />
3 There is also <strong>the</strong> unresolved issue <strong>of</strong> whe<strong>the</strong>r <strong>the</strong> relevant non-price variable is <strong>the</strong> income derivable<br />
from <strong>the</strong> resource exploitation or <strong>the</strong> wealth represented by <strong>the</strong> known reserves.<br />
4 Fosu (2001) presents a summary <strong>of</strong> studies on <strong>the</strong> impact <strong>of</strong> terms <strong>of</strong> trade on African economies.<br />
©International Monetary Fund. Not for Redistribution
260 Terms <strong>of</strong> Trade and Growth <strong>of</strong> Resource Economies: Contrasting Evidence from Two African Countries<br />
Dutch disease resulting from real exchange-rate appreciation, which hurts relatively<br />
growth-enhancing (manufacturing) exports (van Wijnbergen, 1984). 5<br />
Cross-country analyses are <strong>the</strong> usual basis for evaluating <strong>the</strong> resource curse<br />
hypo<strong>the</strong>sis. In addition <strong>to</strong> <strong>the</strong> usual omitted-variable and endogeneity problems<br />
plaguing such methods, <strong>the</strong> relevant studies <strong>of</strong>ten do not shed light on countryspecific<br />
or long-term effects. The latter problem is usually addressed by estimating<br />
<strong>the</strong> growth equation over a relatively long period, such as 1970–98 by<br />
Sala-i-Martin and Subramanian (2003) and 1965–90 by Mehlum and o<strong>the</strong>rs<br />
(2006). The former study also persuasively draws important inferences about<br />
Nigeria, a country <strong>of</strong> present interest. Never<strong>the</strong>less, still at issue is <strong>the</strong> inability<br />
<strong>of</strong> such studies <strong>to</strong> control for unobserved country-fixed effects, despite <strong>the</strong> use<br />
<strong>of</strong> reasonably credible instruments. Germane <strong>to</strong> this issue also is <strong>the</strong> possibility<br />
that <strong>the</strong> response <strong>of</strong> growth <strong>to</strong> natural resources may have country-specific<br />
periods <strong>of</strong> adjustment.<br />
The vec<strong>to</strong>r au<strong>to</strong>regressive models employed by Dea<strong>to</strong>n and Miller (1995),<br />
which include lagged values <strong>of</strong> commodity prices as well as au<strong>to</strong>regressive terms,<br />
represent a considerable improvement over <strong>the</strong> cross-country studies. None<strong>the</strong>less,<br />
<strong>the</strong>se models do not lend <strong>the</strong>mselves <strong>to</strong> generating long-term effects ei<strong>the</strong>r, since<br />
degrees <strong>of</strong> freedom problems militate against longer lags, nor do <strong>the</strong>y account for<br />
possible differences in periods <strong>of</strong> adjustment or in model specification across<br />
countries. 6<br />
Most recently, Collier and Goderis (2007) have advanced <strong>the</strong> empirical debate<br />
by employing a panel estimation <strong>of</strong> GDP growth and generating long-term effects<br />
<strong>of</strong> commodity prices involving <strong>the</strong> coefficient <strong>of</strong> <strong>the</strong> lagged dependent variable.<br />
While this approach represents an important improvement on <strong>the</strong> existing literature,<br />
it still does not resolve <strong>the</strong> issue <strong>of</strong> <strong>the</strong> country-specific relationship between<br />
prices and growth; after all, <strong>the</strong> same period length is used for <strong>the</strong> panel and <strong>the</strong><br />
long-term parameter is assumed <strong>to</strong> be constant across countries. 7<br />
We employ in <strong>the</strong> current paper <strong>the</strong> distributed-lag model <strong>to</strong> test <strong>the</strong> resource<br />
curse hypo<strong>the</strong>sis. Although such modeling may still suffer from deficiencies,<br />
including <strong>the</strong> possibility <strong>of</strong> inadequate degrees <strong>of</strong> freedom, it makes it feasible for<br />
us <strong>to</strong> estimate country-specific relationships by allowing both <strong>the</strong> lag length and<br />
model specification <strong>to</strong> differ across countries. We apply this model <strong>to</strong> <strong>the</strong> two<br />
countries, Botswana and Nigeria, which we hypo<strong>the</strong>size <strong>to</strong> exhibit different<br />
growth–terms <strong>of</strong> trade relationships with respect <strong>to</strong> <strong>the</strong> predictions <strong>of</strong> <strong>the</strong> resource<br />
curse hypo<strong>the</strong>sis. A critical assumption here is that higher terms <strong>of</strong> trade result in<br />
5 For an example <strong>of</strong> a study showing that countries with a greater composition <strong>of</strong> manufacturing in<br />
exports tend <strong>to</strong> experience higher growth, see Fosu (1990).<br />
6 Dea<strong>to</strong>n and Miller (1995) use 1961–87 yearly data <strong>to</strong> estimate seemingly unrelated regression (SUR)<br />
models involving commodity prices as well as <strong>the</strong> four endogenous variables: GDP, investment, consumption,<br />
and government expenditure, involving a pooled set <strong>of</strong> African countries. Each variable was<br />
lagged three years.<br />
7 See for instance equation (1) <strong>of</strong> Collier and Goderis (2007), where <strong>the</strong> long-run parameter l is<br />
specified as a constant coefficient <strong>of</strong> <strong>the</strong> lagged dependent variable.<br />
©International Monetary Fund. Not for Redistribution
Fosu and Gyapong 261<br />
larger revenues. We present below several <strong>of</strong> <strong>the</strong> channels via which <strong>the</strong> implied<br />
terms <strong>of</strong> trade effect may materialize. 8<br />
Institutions and Governance<br />
One potential adverse effect <strong>of</strong> generating public revenues from natural resources is<br />
<strong>the</strong> tendency for <strong>the</strong> revenues <strong>to</strong> promote rent seeking and <strong>to</strong> undermine government<br />
accountability (Baland and Francois, 2000; Tornell and Lane, 1999). Indeed,<br />
<strong>the</strong> revenues <strong>of</strong>ten provide <strong>the</strong> grease for <strong>the</strong> maintenance <strong>of</strong> dicta<strong>to</strong>rships<br />
(Acemoglu, Robinson, and Verdier, 2004). If this effect holds, <strong>the</strong>n unless mediated<br />
by good institutions, we should expect measures <strong>of</strong> political contestation, executive<br />
constraint, political rights, and civil liberties <strong>to</strong> be relatively low. Indeed, this might<br />
represent a channel by which institutional quality is eroded, although <strong>the</strong> present<br />
study is not intended <strong>to</strong> delineate between <strong>the</strong> two hypo<strong>the</strong>ses—that it is <strong>the</strong> initial<br />
bad institutions or that it is corroded institutions—that might cause <strong>the</strong> negative<br />
growth effect <strong>of</strong> natural resources. In Table 14.1, we present comparative values for<br />
<strong>the</strong> above institutional/governance measures for Botswana and Nigeria.<br />
As <strong>the</strong> statistics in Table 14.1 clearly indicate, and consistent with several studies<br />
(e.g., Acemoglu, Johnson, and Robinson, 2002; Robinson, 2009; Robinson<br />
and Parsons, 2006), Botswana displays good institutions that give rise <strong>to</strong> <strong>the</strong><br />
above relatively high governance measures. It is also noteworthy that <strong>the</strong> initial<br />
quality <strong>of</strong> <strong>the</strong> institutions does not appear <strong>to</strong> have been eroded over time. Thus,<br />
by this institutions channel, it is anticipated that <strong>the</strong> effect <strong>of</strong> terms <strong>of</strong> trade on<br />
GDP would be positive in Botswana; greater rents from higher terms <strong>of</strong> trade<br />
would be allocated in favor <strong>of</strong> growth due <strong>to</strong> such institutions (e.g., Knack and<br />
Keefer, 1995; Acemoglu, Johnson, and Robinson, 2001).<br />
His<strong>to</strong>rically, Nigeria stands in stark contrast with Botswana on all <strong>the</strong> governance<br />
measures presented in Table 14.1. 9 Compared with <strong>the</strong> sub-Saharan Africa<br />
average, fur<strong>the</strong>rmore, Nigeria does ra<strong>the</strong>r poorly, that is, until most recently. 10<br />
This evidence <strong>of</strong> poor governance suggests that <strong>the</strong> effect <strong>of</strong> terms <strong>of</strong> trade on<br />
GDP would be negative (or at least nonpositive). For example, terms-<strong>of</strong>-trade<br />
improvements should generate oil resource windfalls, which in turn engender rent<br />
seeking in <strong>the</strong> form <strong>of</strong> bribery and corruption (Ades and Di Tella, 1999), with<br />
negative growth consequences (Mauro, 1999). Greater revenues from higher<br />
8 The channels discussed here are not exhaustive. For example, Sala-i-Martin and Subramanian (2003)<br />
argue persuasively that <strong>the</strong> Dutch disease was not a problem in Nigeria. We have no evidence on<br />
Botswana and do not discuss this possible channel between <strong>the</strong> two countries.<br />
9 However, Nigeria’s governance measures have improved considerably in <strong>the</strong> early 21st century, with<br />
measures in <strong>the</strong> legislative index <strong>of</strong> competitiveness and executive index <strong>of</strong> elec<strong>to</strong>ral competitiveness<br />
standing at <strong>the</strong> maximum possible level <strong>of</strong> 7.0 during 2000–04 (Table 14.1).<br />
10 While Nigeria does relatively well compared <strong>to</strong> sub-Saharan Africa as a whole, on <strong>the</strong>se governance<br />
measures <strong>the</strong>re appears <strong>to</strong> have been considerable deterioration during <strong>the</strong> intervening years, that is,<br />
until most recently in <strong>the</strong> 21st century.<br />
©International Monetary Fund. Not for Redistribution
262 Terms <strong>of</strong> Trade and Growth <strong>of</strong> Resource Economies: Contrasting Evidence from Two African Countries<br />
TABLE 14.1<br />
Governance indica<strong>to</strong>rs, Botswana and Nigeria, 1975–2004<br />
1975<br />
–79<br />
terms <strong>of</strong> trade may also result in less political contestation (Acemoglu, Robinson,<br />
and Verdier, 2004), which could diminish growth. 11<br />
Civil Conflicts<br />
Botswana Nigeria SSA<br />
1995<br />
–99<br />
2000<br />
–04<br />
1975<br />
–79<br />
Political Rights 6.0 6.0 6.0 3.2 1.8 4.0 2.3 3.4 3.6<br />
Civil Liberties 5.2 6.0 6.0 4.2 2.8 3.6 2.7 3.5 3.8<br />
LIEC 6.0 7.0 7.0 1.0 1.0 7.0 2.8 5.5 5.9<br />
EIEC 6.0 7.0 7.0 2.0 2.0 7.0 2.8 5.4 5.6<br />
XCONST 5.0 6.6 7.0 2.8 2.2 5.0 2.6 3.3 3.7<br />
Note: LIEC = Legislative Index <strong>of</strong> Elec<strong>to</strong>ral Competitiveness<br />
EIEC = Executive Index <strong>of</strong> Elec<strong>to</strong>ral Competitiveness<br />
XCONST = Degree <strong>of</strong> Constraint on <strong>the</strong> Government Executive<br />
Political Rights and Civil Liberties are calculated as unweighted averages by <strong>the</strong> corresponding author using<br />
data from Freedom in <strong>the</strong> World, Freedom House, various issues. Note that <strong>the</strong> numbers, which range from<br />
1.0 <strong>to</strong> 7.0, are transposed here so that 1.0 indicates <strong>the</strong> lowest level <strong>of</strong> freedom and 7.0 <strong>the</strong> highest level.<br />
LIEC and EIEC, whose values range from 1.0 <strong>to</strong> 7.0 (highest level <strong>to</strong> lowest level <strong>of</strong> democracy), are<br />
unweighted averages using data from <strong>the</strong> Database <strong>of</strong> Political Institutions (DPI), World Bank. XCONST<br />
ranges from 0.0 <strong>to</strong> 7.0 (0.0 = perfect incoherence; 1.0 = no one regulates <strong>the</strong> authority; 7.0 = strict rules for<br />
governance) and are unweighted averages <strong>of</strong> data from <strong>the</strong> Polity IV Project. (For details regarding <strong>the</strong><br />
implications <strong>of</strong> LIEC and EIEC for growth in African countries, see Fosu, 2008a; <strong>of</strong> Political Rights and Civil<br />
Rights, see Fosu, 2011a; and <strong>of</strong> XCONST, see Fosu, 2011b.)<br />
Similarly, by financing rebel groups or by raising <strong>the</strong> expected value <strong>of</strong> terri<strong>to</strong>rial<br />
capture through war, abundant natural resources would raise <strong>the</strong> risk <strong>of</strong> civil<br />
conflicts (Collier and Hoeffler, 2004; Skaperdas, 2002), with adverse growth<br />
implications (Collier, 1999; Gyimah-Brempong and Corley, 2005). During<br />
civil war, <strong>the</strong> annual per capita growth in sub-Saharan Africa is estimated <strong>to</strong> fall<br />
by 2.2 percent (Collier, 1999). Given, fur<strong>the</strong>rmore, that per capita growth in<br />
<strong>the</strong> region has been ra<strong>the</strong>r paltry, averaging no more than 1 percent for sub-<br />
Saharan Africa generally and for Nigeria in particular, civil wars could indeed<br />
be quite economically destructive.<br />
In contrast <strong>to</strong> Botswana, where <strong>the</strong>re have been no major conflicts since independence<br />
in 1966, Nigeria has experienced a number <strong>of</strong> civil conflicts in <strong>the</strong> form<br />
<strong>of</strong> ethnic/religious clashes during its 50 years since independence. In particular,<br />
<strong>the</strong>re have been two civil wars between 1960 and 1999: one from January 1966 <strong>to</strong><br />
January 1970, and <strong>the</strong> o<strong>the</strong>r from December 1980 <strong>to</strong> January 1984. The former was<br />
11 Fosu (2008a), for instance, finds from a decadal panel <strong>of</strong> a large sample <strong>of</strong> sub-Saharan African<br />
countries that at <strong>the</strong> intermediate level <strong>of</strong> democracy, as measured by <strong>the</strong> index <strong>of</strong> elec<strong>to</strong>ral competiveness,<br />
democratization tends <strong>to</strong> be growth-inhibiting, but it tends <strong>to</strong> be growth-enhancing in<br />
advanced-level democracies. The threshold is estimated at 4.4, which is much higher than <strong>the</strong> values<br />
his<strong>to</strong>rically exhibited by Nigeria (see table 4 in Fosu, 2008a, in contrast <strong>to</strong> those for Botswana, which<br />
scores well above <strong>the</strong> threshold).<br />
1995<br />
–99<br />
2000<br />
–04<br />
1975<br />
–79<br />
1995<br />
–99<br />
©International Monetary Fund. Not for Redistribution<br />
2000<br />
–04
TABLE 14.2<br />
Public spending on education and health, Botswana and Nigeria, 1975–94<br />
Fosu and Gyapong 263<br />
Botswana Nigeria<br />
Education Health Education Health<br />
Per capita (1987 US$) 88.5 23.0 4.0 1.1<br />
Expenditure share (%) 18.7 5.2 7.6 1.9<br />
Source: Computed by authors using data from World Bank (1992, 1996, 1998/99). For details, see Fosu (2008b)<br />
and Fosu (2007).<br />
<strong>the</strong> well-known Biafran civil war, and <strong>the</strong> latter consisted <strong>of</strong> severe ethnic clashes that<br />
resulted in at least 1,000 deaths annually (Collier and Hoeffler, 2004, table 1).<br />
Elite Political Instability<br />
<strong>Natural</strong> resource abundance may also result in elite political instability in <strong>the</strong><br />
form <strong>of</strong> military coups d’etat, as various elite groups compete for power in order<br />
<strong>to</strong> extract rent from natural resources (Kimenyi and Mbaku, 2003). Moreover,<br />
elite political instability has been deleterious <strong>to</strong> growth in sub-Saharan Africa<br />
(e.g., Fosu, 1992, 2001a, 2002, 2003; Gyimah-Brempong and Traynor, 1999).<br />
Having a high level <strong>of</strong> elite political instability could reduce GDP growth by as<br />
much as 1.2 percentage points, about one-third <strong>the</strong> average growth during <strong>the</strong><br />
1960–86 sample period, for instance (Fosu, 1992).<br />
Botswana and Nigeria differ substantially in terms <strong>of</strong> <strong>the</strong>ir post-independence<br />
record <strong>of</strong> elite political instability. While Botswana had no his<strong>to</strong>ry <strong>of</strong> this kind <strong>of</strong><br />
instability—no successful or failed coups or plots—during 1956–2001, Nigeria<br />
experienced six successful coups, two failed coups, and six coup plots during <strong>the</strong><br />
same period, ranking <strong>the</strong> country seventh out <strong>of</strong> <strong>the</strong> 46 sub-Saharan African countries<br />
in a ranking <strong>of</strong> high elite political instability (McGowan, 2003; appendix C).<br />
Human Capital<br />
Ano<strong>the</strong>r argument supportive <strong>of</strong> a negative relationship between natural-resource<br />
terms <strong>of</strong> trade and economic growth pertains <strong>to</strong> <strong>the</strong> view that <strong>the</strong> higher rent<br />
from increasing terms <strong>of</strong> trade would discourage investment in innovation,<br />
particularly in education (Gylfason, 2001). The data for Nigeria, relative <strong>to</strong><br />
Botswana, seem ra<strong>the</strong>r consistent with this view. We present in Table 14.2 comparative<br />
statistics on educational expenditures for Botswana and Nigeria. Also<br />
reported are data on health spending, since <strong>the</strong> above hypo<strong>the</strong>sis may be extended<br />
<strong>to</strong> human capital more generally.<br />
We find that public expenditures on education and health are quite high for<br />
Botswana and very low for Nigeria. On a per capita basis, Nigeria’s public spending<br />
represents only about 5 percent <strong>of</strong> Botswana’s for ei<strong>the</strong>r sec<strong>to</strong>r. Fur<strong>the</strong>rmore,<br />
as a measure <strong>of</strong> budget allocation priorities, <strong>the</strong> expenditure shares are also respectively<br />
higher, more than twice as high in Botswana as in Nigeria. Thus, assuming<br />
that human capital expenditures positively affect growth (Baldacci and o<strong>the</strong>rs,<br />
2004), we should expect a negative effect <strong>of</strong> terms <strong>of</strong> trade on GDP.<br />
©International Monetary Fund. Not for Redistribution
264 Terms <strong>of</strong> Trade and Growth <strong>of</strong> Resource Economies: Contrasting Evidence from Two African Countries<br />
Openness<br />
Ano<strong>the</strong>r view about natural resource economies is that <strong>the</strong>y are more likely <strong>to</strong><br />
adopt trade restrictions (Auty, 2001). This view is underpinned by <strong>the</strong> belief that<br />
<strong>the</strong> larger resources would render governments less interested in o<strong>the</strong>r tradable<br />
products. Hence, governments would shift economic activity in <strong>the</strong> nonresource<br />
sec<strong>to</strong>r <strong>to</strong>ward domestic production that is shielded from foreign competition. We<br />
should <strong>the</strong>refore expect such economies <strong>to</strong> be less open than <strong>the</strong>ir counterparts<br />
are. To <strong>the</strong> extent that openness exerts a positive impact on growth (Sachs and<br />
Warner, 1997), it is anticipated that terms <strong>of</strong> trade would decrease growth under<br />
<strong>the</strong> resource curse hypo<strong>the</strong>sis.<br />
The data show a wide divergence in <strong>the</strong> index <strong>of</strong> openness between Botswana<br />
and Nigeria. Based on Sachs and Warner’s (1997) comprehensive measure <strong>of</strong><br />
openness, 12 Mehlum, Moene, and Torvik (2006, table 4) report <strong>the</strong> respective<br />
levels <strong>of</strong> 0.42 and 0.00 for <strong>the</strong>se countries, where 0.00 and 1.00 indicate <strong>the</strong> least<br />
and highest levels <strong>of</strong> openness, respectively.<br />
EMPIRICAL MODEL<br />
The above channels <strong>the</strong>n suggest that Nigeria is likely <strong>to</strong> conform <strong>to</strong> <strong>the</strong> resource<br />
curse hypo<strong>the</strong>sis, while Botswana is not. That is, we expect a positive impact <strong>of</strong><br />
terms <strong>of</strong> trade on GDP for Botswana, and a negative, or at least a nonpositive,<br />
effect for Nigeria. To test <strong>the</strong> resource curse hypo<strong>the</strong>sis, we estimate for each<br />
country <strong>the</strong> following distributed-lag model:<br />
J<br />
yt = a + å j= 0 bjX(<br />
t-j) + ut t = 1, 2, … , T<br />
(1)<br />
where y is GDP growth, X <strong>the</strong> growth <strong>of</strong> terms <strong>of</strong> trade, u <strong>the</strong> error term, and t is<br />
<strong>the</strong> year index; a and bj are coefficients <strong>to</strong> be estimated. Xt is nons<strong>to</strong>chastic, and<br />
ut is distributed as (0, s 2 ), for all t. Assuming a polynomial lag structure, bj can<br />
be written as<br />
b = å p d ( j) j = 0,1,2, … , l<br />
(2)<br />
k<br />
j k=<br />
0 k j<br />
Nei<strong>the</strong>r <strong>the</strong> lag length lj nor <strong>the</strong> degree <strong>of</strong> <strong>the</strong> polynomial P is known ex ante<br />
and must be selected, with <strong>the</strong> weights lk also <strong>to</strong> be determined. There are several<br />
12 The Sachs and Warner openness measure is <strong>the</strong> proportion <strong>of</strong> years that a country is open during<br />
<strong>the</strong> 1965–90 sample period. A country is considered “open” if it satisfies all <strong>the</strong> following five conditions:<br />
(1) average tariff rates below 40 percent; (2) average quota and licensing coverage <strong>of</strong> imports <strong>of</strong><br />
less than 60 percent; (3) a black market exchange rate premium <strong>of</strong> less than 20 percent; (4) no extreme<br />
controls (taxes, quotas, or state monopolies); and (5) not considered a socialist country (Sachs and<br />
Warner, 1997).<br />
©International Monetary Fund. Not for Redistribution
Fosu and Gyapong 265<br />
methods for such selection. 13 We opt here for more heuristic but relatively strict<br />
criteria as follows: for each country, equations (1) and (2) were estimated for a<br />
large number <strong>of</strong> lag lengths (maximum <strong>of</strong> 15 years) and orders <strong>of</strong> polynomial<br />
(maximum <strong>of</strong> 4). The admissible set comprises those regressions with p values <strong>of</strong><br />
at most 0.01 for <strong>the</strong> F statistic and no evidence <strong>of</strong> au<strong>to</strong>correlation. 14 Where necessary,<br />
<strong>the</strong> Akaike information and Schwartz criteria were applied <strong>to</strong> selecting <strong>the</strong><br />
optimal lag length among <strong>the</strong> admissible set.<br />
If <strong>the</strong> resource curse hypo<strong>the</strong>sis does not hold, <strong>the</strong>n we should expect <strong>the</strong> sum<br />
<strong>of</strong> <strong>the</strong> lags <strong>to</strong> be positive, that is, ∑j bj > 0; increases in terms <strong>of</strong> trade should expand<br />
<strong>the</strong> production set and hence expand output. A non-strict condition for upholding<br />
<strong>the</strong> resource curse hypo<strong>the</strong>sis, <strong>the</strong>n, is that <strong>the</strong> sum <strong>of</strong> <strong>the</strong> lags is nonpositive.<br />
Data and Estimation<br />
GDP and terms <strong>of</strong> trade data were obtained from <strong>the</strong> World Bank (2004a and<br />
2004b, respectively). The sample periods differ somewhat between <strong>the</strong> two countries<br />
(see Table 14.3) due <strong>to</strong> data availability. Both periods end in 2002, however,<br />
mainly because <strong>the</strong> data sources differ <strong>the</strong>reafter, but also because <strong>the</strong>re appears<br />
<strong>to</strong> have been some structural change that year between <strong>the</strong> two countries with<br />
respect <strong>to</strong> growth (see Chart 1). The mean values, reported in Table 14.3, show<br />
that <strong>the</strong> value for net barter terms <strong>of</strong> trade (GTOT) is much higher for Nigeria<br />
than for Botswana (nine times higher), while GDP growth was on average more<br />
than three times lower in Nigeria. Thus, casual empiricism suggests that <strong>the</strong><br />
higher growth <strong>of</strong> terms <strong>of</strong> trade, GTOT, in Nigeria, relative <strong>to</strong> Botswana, did not<br />
translate <strong>to</strong> larger GDP growth. The question <strong>of</strong> interest, though, is whe<strong>the</strong>r on<br />
an absolute basis <strong>the</strong> cumulative effect <strong>of</strong> GTOT was positive or negative for<br />
ei<strong>the</strong>r country. If negative, it would favor <strong>the</strong> resource curse hypo<strong>the</strong>sis.<br />
The results <strong>of</strong> <strong>the</strong> distributed-lag analysis are reported in Tables 14.4 and 14.5<br />
for Botswana and Nigeria, respectively. As apparent from Table 14.4, <strong>the</strong> cumulative<br />
effect <strong>of</strong> GTOT for Botswana is positive and ra<strong>the</strong>r large. The long-term<br />
effect <strong>of</strong> an increase in GTOT, estimated with a third-degree polynomial and a<br />
10-year lag, is 2.3, which is highly significant with a t ratio <strong>of</strong> 5.0. This estimate<br />
constitutes 23 percent <strong>of</strong> <strong>the</strong> mean GDP growth rate reported in Table 14.3.<br />
13 See, for instance, Trivedi and Pagan (1979) and Hendry, Pagan, and Sargan (1984). One <strong>of</strong> <strong>the</strong><br />
popular selection methods is <strong>the</strong> Pagano and Hartley (1981) procedure involving choosing first <strong>the</strong><br />
optimal lag length and <strong>the</strong>n <strong>the</strong> optimal degree <strong>of</strong> <strong>the</strong> polynomial. For details <strong>of</strong> <strong>the</strong> implementation<br />
<strong>of</strong> this procedure, see for example Azzam and Yanagida (1987). However, this method is susceptible<br />
<strong>to</strong> <strong>the</strong> existence <strong>of</strong> au<strong>to</strong>correlation (Azzam and Yanagida (1987). I opt for a more heuristic approach<br />
by estimating a large number <strong>of</strong> regressions involving different lag lengths and orders <strong>of</strong> polynomial<br />
and selecting a set that simultaneously meets <strong>the</strong> F statistic and au<strong>to</strong>correlation test criteria, as stated<br />
in <strong>the</strong> text.<br />
14 These criteria, especially that involving <strong>the</strong> F statistic, are ra<strong>the</strong>r stringent, thus omitting o<strong>the</strong>r<br />
potentially good candidates with respect <strong>to</strong> <strong>the</strong> goodness <strong>of</strong> fit. For example, a specification for Nigeria<br />
involving a second-degree polynomial with an F value <strong>of</strong> 0.027 was rejected even though <strong>the</strong> sum <strong>of</strong><br />
<strong>the</strong> lags was much more statistically significant than that reported here. However, this small risk <strong>of</strong><br />
type 1 error is meant <strong>to</strong> ensure that any selected model is highly reliable in terms <strong>of</strong> goodness <strong>of</strong> fit.<br />
©International Monetary Fund. Not for Redistribution
266 Terms <strong>of</strong> Trade and Growth <strong>of</strong> Resource Economies: Contrasting Evidence from Two African Countries<br />
TABLE 14.3<br />
Mean GDP growth and GTOT (annual average, percent), Botswana and Nigeria<br />
Botswana Nigeria<br />
Mean GTOT 0.9 6.3<br />
Mean GDP growth 10.2 3.2<br />
Sources: GDP and terms-<strong>of</strong>-trade data are from World Bank, World Development Indica<strong>to</strong>rs 2005 and World Bank<br />
Africa Database CDROM 2004, respectively.<br />
Note: GTOT is <strong>the</strong> Net Barter Terms <strong>of</strong> Trade. Data are for 1966–2002, except GTOT for Botswana, which is for<br />
1976–2002.<br />
TABLE 14.4<br />
Distributed-lag analysis: GDP growth vs. GTOT, Botswana<br />
Sum <strong>of</strong> lag coefficients (t value) = 2.26 (5.00)<br />
Number <strong>of</strong> lags = 10; Degree <strong>of</strong> polynomial = 3<br />
Sample period = 1976–2002; Adjusted sample period = 1986–2002<br />
R 2 = 0.867, Adj. R2 = 0.834<br />
F statistic [p value] = 28.4 [0.000]<br />
DW = 2.09<br />
Akaike Information Criterion = 4.16<br />
Schwartz Criterion = 4.36<br />
TABLE 14.5<br />
Distributed-lag analysis: GDP growth vs. GTOT, Nigeria<br />
Sum <strong>of</strong> lag coefficients (t value) = -0.350 (–1.70)<br />
Number <strong>of</strong> lags = 15; Degree <strong>of</strong> polynomial = 4<br />
Sample period = 1966–2002; Adjusted sample period = 1981–2002<br />
R2 = 0.513, Adj. R2 = 0.400<br />
F statistic [p value] = 4.48 [0.012]<br />
DW = 2.30<br />
Akaike Information Criterion = 5.81<br />
Schwartz Criterion = 6.06<br />
In contrast, <strong>the</strong> cumulative effect <strong>of</strong> GTOT, which is estimated using a fourthdegree<br />
polynomial and a 15-year lag, is negative for Nigeria, though with a relatively<br />
low 0.10 statistical significance level (Table 14.5). This outcome supports <strong>the</strong><br />
resource curse hypo<strong>the</strong>sis and suggests that increases in GTOT would reduce GDP<br />
growth. The cumulative effect is 0.35 percent for a 1 percent rise in GTOT, 15 representing<br />
roughly 10 percent <strong>of</strong> <strong>the</strong> mean growth rate over <strong>the</strong> sample period.<br />
15 As indicated above, ano<strong>the</strong>r set <strong>of</strong> results (a second-degree polynomial with a 15-year lag), which<br />
did not pass <strong>the</strong> selection criteria because <strong>of</strong> its relatively high p value <strong>of</strong> 0.027 for <strong>the</strong> overall goodness-<strong>of</strong>-fit<br />
F test, yielded a cumulative GTOT coefficient <strong>of</strong> 0.38 with a more statistically significant<br />
t value <strong>of</strong> –2.42.<br />
©International Monetary Fund. Not for Redistribution
Discussion <strong>of</strong> Results<br />
Fosu and Gyapong 267<br />
The above results suggest that while appreciation in terms <strong>of</strong> trade increased longrun<br />
growth in Botswana, <strong>the</strong> reverse was <strong>the</strong> case in Nigeria. We interpret <strong>the</strong>se<br />
results as indicative <strong>of</strong> <strong>the</strong> existence <strong>of</strong> a resource curse in Nigeria but not in<br />
Botswana. As is cus<strong>to</strong>mary, one must exercise caution in reaching such a conclusion.<br />
It is conceivable that fac<strong>to</strong>rs unrelated <strong>to</strong> <strong>the</strong> “curse” but omitted from <strong>the</strong><br />
model might bias our estimates <strong>of</strong> <strong>the</strong> terms-<strong>of</strong>-trade effect. 16 For example, <strong>the</strong>re<br />
is existing evidence that <strong>the</strong> volatility <strong>of</strong> terms <strong>of</strong> trade has an adverse effect on<br />
growth (Blattman, Hwang, and Williamson, 2007). Using a sample <strong>of</strong> 14 sub-<br />
Saharan African countries, including Botswana but not Nigeria, 17 Bleaney and<br />
Greenaway (2001) also find that <strong>the</strong> volatility in terms <strong>of</strong> trade negatively affected<br />
growth between 1980 and 1995, though GTOT itself had a positive effect on<br />
growth. Hence, <strong>the</strong> negative cumulative impact <strong>of</strong> GTOT obtained above for<br />
Nigeria may simply be <strong>the</strong> result <strong>of</strong> <strong>the</strong> volatility <strong>of</strong> terms <strong>of</strong> trade, that is, if<br />
terms-<strong>of</strong>-trade instability is positively correlated with GTOT. Indeed, using data<br />
for 1981–2002, 18 <strong>the</strong> standard deviation for terms <strong>of</strong> trade is computed at 26.7<br />
and 7.3 for Nigeria and Botswana, respectively. 19<br />
There are two reasons why <strong>the</strong> above omitted-variable scenario involving<br />
terms-<strong>of</strong>-trade instability need not invalidate <strong>the</strong> above conclusion in support <strong>of</strong><br />
RCH for Nigeria. First, <strong>the</strong> issue <strong>of</strong> <strong>the</strong> negative effect <strong>of</strong> terms-<strong>of</strong>-trade volatility<br />
on growth for sub-Saharan African countries is far from settled. Reviewing <strong>the</strong><br />
evidence, Fosu (2001a, p. 300) concludes: “That is, for African economies, instabilities<br />
in exports, in <strong>the</strong>ir price or in terms <strong>of</strong> trade, do not seem <strong>to</strong> explain <strong>the</strong><br />
low growth experienced in many <strong>of</strong> <strong>the</strong>se countries.” Instead, Fosu (p. 304) concludes<br />
that, “terms <strong>of</strong> trade deterioration has a substantial negative impact on<br />
growth in sub-Saharan Africa, both directly and indirectly via investment.” Thus,<br />
for sub-Saharan Africa generally, <strong>the</strong> reviewed evidence seemed <strong>to</strong> imply that it is<br />
<strong>the</strong> trend in terms <strong>of</strong> trade, and not so much its variability around trend, that<br />
apparently matters for growth.<br />
Second, and perhaps more importantly, even if terms-<strong>of</strong>-trade volatility<br />
exerted an adverse impact on growth, it may be viewed as part-and-parcel <strong>of</strong> <strong>the</strong><br />
resource curse syndrome. Specifically, high terms-<strong>of</strong>-trade volatility might result<br />
in suboptimal intertemporal allocation <strong>of</strong> revenues, characteristic <strong>of</strong> resource<br />
economies, which could be deleterious <strong>to</strong> growth. 20 In that case, however, reducing<br />
<strong>the</strong> volatility through delinking public revenues from such volatility would be<br />
16<br />
The question is whe<strong>the</strong>r o<strong>the</strong>r variables correlated with but not caused by terms <strong>of</strong> trade are omitted<br />
from <strong>the</strong> equation, in which case <strong>the</strong> estimated terms-<strong>of</strong>-trade impact would be biased.<br />
17These 14 countries are Botswana, Burkina Faso, Cameroon, Cote d’Ivoire, Gambia, Ghana, Kenya,<br />
Malawi, Mauritius, Niger, Senegal, Tanzania, Togo, and Zimbabwe.<br />
18<br />
Note that <strong>the</strong> adjusted sample periods are 1986–2002 and 1981–2002 for Botswana and Nigeria,<br />
respectively.<br />
19<br />
These estimates are based on data from World Bank (2009).<br />
20<br />
For an elaboration <strong>of</strong> this “policy syndrome” see, for instance, Collier and O’Connell (2008), Fosu<br />
(2008c), and Fosu and O’Connell (2006).<br />
©International Monetary Fund. Not for Redistribution
268 Terms <strong>of</strong> Trade and Growth <strong>of</strong> Resource Economies: Contrasting Evidence from Two African Countries<br />
<strong>the</strong> appropriate strategy for addressing <strong>the</strong> resource curse. Finally, <strong>the</strong> finding here<br />
for Nigeria is consistent with that by Sala-i-Martin and Subramanian (2003),<br />
which is based on <strong>the</strong> share <strong>of</strong> natural resources in GDP or exports ra<strong>the</strong>r than<br />
terms <strong>of</strong> trade.<br />
SOME LESSONS AND CONCLUDING OBSERVATIONS<br />
As already alluded <strong>to</strong> above, a resource curse need not occur under <strong>the</strong> right set<br />
<strong>of</strong> institutions. Mehlum and o<strong>the</strong>rs (2006), for instance, find that resource abundance<br />
actually increases growth when <strong>the</strong>re are good institutions, even though<br />
<strong>the</strong> independent effect <strong>of</strong> resource abundance is negative. What <strong>the</strong>n are good<br />
institutions?<br />
In <strong>the</strong> study by Mehlum and o<strong>the</strong>rs, institutional quality is measured by <strong>the</strong><br />
simple average <strong>of</strong> <strong>the</strong> following indexes: rule <strong>of</strong> law, bureaucratic quality, corruption<br />
in government, risk <strong>of</strong> expropriation, and government repudiation <strong>of</strong> contracts.<br />
A larger value <strong>of</strong> this average index indicates a higher institutional quality.<br />
Fur<strong>the</strong>rmore, <strong>the</strong> threshold for good institutions is computed as 0.93 over <strong>the</strong><br />
(0.0–1.0) interval (ibid., p. 13). Thus, with Botswana and Nigeria scoring 0.70<br />
and 0.31, respectively, on institutional quality (ibid., table 4), nei<strong>the</strong>r is considered<br />
<strong>to</strong> have good institutions. 21 Qualitatively speaking, though, Botswana<br />
should have less <strong>of</strong> a resource-curse risk than Nigeria.<br />
With an institutional quality score <strong>of</strong> 0.96, Norway is beyond <strong>the</strong> above estimated<br />
threshold and is thus considered, with a high degree <strong>of</strong> confidence, as one<br />
<strong>of</strong> <strong>the</strong> non-resource-curse countries. Despite detrac<strong>to</strong>rs, 22 <strong>the</strong> country is <strong>of</strong>ten<br />
cited as a case in favor <strong>of</strong> <strong>the</strong> alternative view that resource abundance is good for<br />
growth. That is, Norway has had good institutions and clever policies <strong>to</strong> prevent<br />
<strong>the</strong> resource curse (Cappelan and Mjoset, 2009). High institutional quality is<br />
likely a necessary condition for guarding against <strong>the</strong> resource curse, but is it sufficient?<br />
Probably not, for in addition <strong>to</strong> its solid institutional base, Norway<br />
under<strong>to</strong>ok steps <strong>to</strong> ensure that its revenues from petroleum exports were well<br />
managed and that <strong>the</strong> petroleum sec<strong>to</strong>r was integrated with <strong>the</strong> rest <strong>of</strong> <strong>the</strong> economy.<br />
Norway accomplished this by ensuring forward and backward linkages with<br />
<strong>the</strong> petroleum sec<strong>to</strong>r, in part by establishing <strong>the</strong> Sta<strong>to</strong>il Company in 1972.<br />
Cappelen and Mjoset (2009) write that “This state-owned company played a<br />
critical role as parts <strong>of</strong> <strong>the</strong> Norwegian manufacturing industry were transformed<br />
in<strong>to</strong> an engineering supply industry with specialized knowledge in <strong>the</strong> production<br />
21 Actually, only <strong>the</strong> developed countries qualify for this non-resource-curse status. Thus, <strong>the</strong> Mehlum,<br />
Moene, and Torvik (2006) results do not seem <strong>to</strong> adequately help <strong>to</strong> delineate between resource-curse<br />
and non-resource-curse groups among developing countries like Botswana and Nigeria.<br />
22 For example, Gylfason (2001, p. 851) argues that, “Norway’s oil exports have crowded out its nonoil<br />
exports krone by krone, leaving <strong>to</strong>tal exports stagnant relative <strong>to</strong> national income for a generation.”<br />
This argument suggests <strong>the</strong> Dutch disease in operation in Norway as well. However, <strong>the</strong> more recent<br />
evidence does not really support this view. For example, though <strong>to</strong>tal exports, as share <strong>of</strong> GDP,<br />
remained stagnant from 1981 <strong>to</strong> <strong>the</strong> mid-1990s, by 2008 exports had reached 55 percent, from<br />
37 percent in 1981 (World Bank, 2010).<br />
©International Monetary Fund. Not for Redistribution
Fosu and Gyapong 269<br />
<strong>of</strong> deep-sea oil drilling equipment, platforms, pipelines and supply ships” (p. 8).<br />
They fur<strong>the</strong>r write:<br />
One <strong>of</strong> Sta<strong>to</strong>il’s main tasks was <strong>to</strong> organise learning and technology transfers.<br />
A separate government body or direc<strong>to</strong>rate was set up <strong>to</strong> implement part <strong>of</strong><br />
government policy in <strong>the</strong> area. Some universities developed <strong>the</strong>ir education and<br />
research in areas relevant for <strong>the</strong> petroleum sec<strong>to</strong>r. Government policies were in<br />
place <strong>to</strong> ensure that linkages could develop between petroleum extraction and<br />
<strong>the</strong> supply industry. As <strong>the</strong> new manufacturing skills spread, Sta<strong>to</strong>il would<br />
place orders with a variety <strong>of</strong> old and new Norwegian firms. Crisis-ridden<br />
shipyards were restructured in<strong>to</strong> producers <strong>of</strong> oil-exploration equipment.<br />
(Cappelan and Mjoset, 2009, p. 17)<br />
Hence, Norway <strong>to</strong>ok special policy steps <strong>to</strong> ensure that its oil sec<strong>to</strong>r was well<br />
integrated in<strong>to</strong> <strong>the</strong> rest <strong>of</strong> <strong>the</strong> economy. In particular, it exploited natural linkages<br />
with <strong>the</strong> sec<strong>to</strong>r by adopting proactive and farsighted policies. “The government<br />
focused on technology transfers from foreign companies” and “Norwegian industry<br />
developed production technologies which later turned out <strong>to</strong> be quite competitive”<br />
(Cappelen and Mjoset, 2009, p. 17).<br />
Ano<strong>the</strong>r potential lesson is Norway’s establishment <strong>of</strong> <strong>the</strong> Petroleum Fund,<br />
intended <strong>to</strong> delink <strong>the</strong> economy from <strong>the</strong> vagaries <strong>of</strong> oil prices and <strong>to</strong> minimize<br />
<strong>the</strong> potential corrosive power <strong>of</strong> oil dependency. In particular, <strong>the</strong> Norway<br />
Petroleum Fund, now called <strong>the</strong> Norway Pension Fund, was established in 1990,<br />
even though <strong>the</strong> country’s oil production actually began in 1970. A key policy<br />
rule associated with <strong>the</strong> fund was that only <strong>the</strong> expected earnings from it<br />
(estimated <strong>to</strong> be 4 percent <strong>of</strong> <strong>the</strong> domestic value <strong>of</strong> <strong>the</strong> fund) would be transferred<br />
<strong>to</strong> <strong>the</strong> state budget every year, with any change in <strong>the</strong> transfer rules <strong>to</strong> be approved<br />
by parliament.<br />
In 2003, Nigeria established its Excess Crude Account, in order <strong>to</strong> save windfall<br />
revenues during periods <strong>of</strong> above-benchmark high oil prices. By 2007, <strong>the</strong><br />
amount in this account had reached US$17.3 billion from $5.1 billion in 2004. 23<br />
According <strong>to</strong> a news report, “However, permissive governance structures have<br />
allowed extensive ad hoc withdrawals, reducing <strong>the</strong> ECA balance by almost<br />
85 percent, or 16 billion dollars, in just 18 months.” 24 Unlike <strong>the</strong> case <strong>of</strong> <strong>the</strong><br />
Norway Petroleum Fund, Nigeria’s Excess Crude Account does not have a welldefined<br />
legal framework for its operation, which allows powerful political interests<br />
<strong>to</strong> prevail in its disposition. 25 The recent withdrawals might be prudent in<br />
terms <strong>of</strong> meeting unanticipated exigencies associated with <strong>the</strong> 2008–09 economic<br />
crisis; however, <strong>the</strong> process also underscores Nigeria’s weak governance.<br />
The important lesson here is that it is not sufficient just <strong>to</strong> set up a fund. The<br />
necessary legal and policy framework should complement its establishment.<br />
Indeed, <strong>the</strong>re is currently strong urging <strong>to</strong> convert <strong>the</strong> Excess Crude Account <strong>to</strong><br />
23<br />
Sovereign Wealth Fund Institute – Nigeria, website, dated 2/19/2008.<br />
24<br />
Africa News, online, July 30, 2010.<br />
25Africa News, online, July 30, 2010.<br />
©International Monetary Fund. Not for Redistribution
270 Terms <strong>of</strong> Trade and Growth <strong>of</strong> Resource Economies: Contrasting Evidence from Two African Countries<br />
a sovereign wealth fund (SWF), which would properly define <strong>the</strong> legal and policy<br />
rules for its operation, as in <strong>the</strong> case <strong>of</strong> <strong>the</strong> Norway’s fund, for example.<br />
While Botswana’s institutional quality, unlike Norway’s, is not considered<br />
good enough (according <strong>to</strong> <strong>the</strong> standards in Mehlum and o<strong>the</strong>rs, 2006), Botswana<br />
likely presents useful lessons as well. After all, its institutions were strong enough<br />
<strong>to</strong> transform its terms <strong>of</strong> trade growth <strong>to</strong> considerable economic growth. 26 It<br />
would be <strong>to</strong>o presumptuous, however, <strong>to</strong> assert that Nigeria should acquire a<br />
good-governance status similar <strong>to</strong> Botswana’s. That would be easier said than<br />
done, for Botswana’s governance status, just like Norway’s, is steeped in its<br />
political his<strong>to</strong>ry involving a relatively homogeneous, small population.<br />
This is in contrast <strong>to</strong> Nigeria, which is Africa’s most populous country and is<br />
among <strong>the</strong> most ethnically diverse countries on <strong>the</strong> continent. 27 While recent literature<br />
suggests that ethnic diversity need not be deleterious <strong>to</strong> growth, 28 it is<br />
none<strong>the</strong>less true that ethnic and religious clashes, likely related <strong>to</strong> Nigeria’s ethnic<br />
and religious configurations, have posed ongoing conflicts for <strong>the</strong> country.<br />
However, poor governance may have contributed <strong>to</strong> <strong>the</strong>se conflicts, with Easterly<br />
(2001) and Collier (2000), for example, arguing that good institutions can<br />
attenuate <strong>the</strong> risks <strong>of</strong> ethnic conflicts. If so, <strong>the</strong>n it all boils down <strong>to</strong> <strong>the</strong> attainment<br />
<strong>of</strong> good institutions. But again, what are good institutions? Unfortunately,<br />
and as alluded <strong>to</strong> above, <strong>the</strong>re is not yet an available quantitative threshold.<br />
A radical solution <strong>to</strong> Nigeria’s resource-curse problem is provided by Sala-i-<br />
Martin and Subramanian (2003): Distribute all <strong>the</strong> oil revenues <strong>to</strong> <strong>the</strong> adult citizens<br />
<strong>of</strong> Nigeria. While this proposition has some merit, <strong>the</strong> political feasibility <strong>of</strong><br />
its implementation may be dubious. Carrying out <strong>the</strong> proposal would be tantamount<br />
<strong>to</strong> requiring Nigerian politicians <strong>to</strong> vote <strong>the</strong>mselves out <strong>of</strong> <strong>of</strong>fice. After all,<br />
like many o<strong>the</strong>r politicians in <strong>the</strong> developing world, <strong>the</strong>ir interest in <strong>of</strong>fice-holding<br />
is likely <strong>to</strong> be guided, at least in great part, by <strong>the</strong>ir expected gains, which may<br />
include public revenues, whe<strong>the</strong>r legal or illegal.<br />
A less radical and perhaps more implementable proposal is suggested here:<br />
Ensure that <strong>the</strong>re are sufficient checks and balances in <strong>the</strong> system <strong>to</strong> provide<br />
transparency and accountability. Of course, politicians would be unlikely <strong>to</strong><br />
directly vote for such a proposal ei<strong>the</strong>r. A similar favourable outcome could, however,<br />
be achieved via an appropriate democratization process, one that might take<br />
26<br />
Unfortunately, though, Botswana has not succeeded in achieving a structural change despite its<br />
remarkable growth.<br />
27Nigeria’s population is about 150 million, compared with Botswana’s <strong>of</strong> only 2 million, while <strong>the</strong><br />
ethnic fractionalization scores are 0.485 and 0.885, respectively, for <strong>the</strong> two countries (Montalvo and<br />
Reynal-Querol, 2005; Appendix B).<br />
28Montalvo and Reynal-Querol (2005) argue that it is <strong>the</strong> ethnic polarization ra<strong>the</strong>r than ethnic<br />
fractionalization that matters for <strong>the</strong> risk <strong>of</strong> civil wars and, hence, for growth, ceteris paribus.<br />
Fur<strong>the</strong>rmore, <strong>the</strong>y actually report a higher ethnic polarization score <strong>of</strong> 0.650 for Botswana, compared<br />
with Nigeria’s score <strong>of</strong> 0.404, despite <strong>the</strong> latter’s higher level <strong>of</strong> ethnic fractionalization (ibid.,<br />
Appendix B). None<strong>the</strong>less, <strong>the</strong>ir results do not necessarily invalidate <strong>the</strong> Easterly and Levine (1997)<br />
finding that more ethnically fractionalized countries are more likely <strong>to</strong> adopt policies that hurt<br />
growth.<br />
©International Monetary Fund. Not for Redistribution
Fosu and Gyapong 271<br />
time <strong>to</strong> crystallize. For example, Fosu (2008a) observes that democratization in<br />
an elec<strong>to</strong>rally competitive advanced-level democracy in Africa tends <strong>to</strong> be grow<strong>the</strong>nhancing,<br />
perhaps as a result <strong>of</strong> <strong>the</strong> regime’s ability <strong>to</strong> resolve <strong>the</strong> initial political<br />
disorder engendered by <strong>the</strong> initial democratization process. 29 Such advanced-level<br />
democracy would by and large entail significant executive restraint, consistent<br />
with <strong>the</strong> observation by Alence (2004), for instance, that it is <strong>the</strong> executive<br />
restraint in democratic institutions that improves “developmental governance.” 30<br />
It is noteworthy that Nigeria’s recent improvements on both <strong>the</strong> legislative and<br />
executive indexes <strong>of</strong> elec<strong>to</strong>ral competitiveness are also associated with an increase<br />
in executive constraint (which is labeled XCONST in Table 14.1). It is also significant<br />
that Nigeria’s scores on o<strong>the</strong>r forms <strong>of</strong> governance indices, while still<br />
below <strong>the</strong> world’s respective averages, 31 have improved (Table 14.6). 32 Hence, it<br />
seems as if <strong>the</strong> relatively recent multiparty democratization dispensation, which<br />
has witnessed a transfer <strong>of</strong> authority from one civilian government <strong>to</strong> ano<strong>the</strong>r,<br />
may be bearing fruit in terms <strong>of</strong> governance improvements. The key challenge is<br />
<strong>the</strong> extent <strong>to</strong> which <strong>the</strong> momentum for <strong>the</strong> current democratization process can<br />
be maintained in Nigeria.<br />
TABLE 14.6<br />
More recent institutional/governance development, Nigeria, 1998–2008<br />
1998 2003 2008 1998–2003 2003–08 1998–2008<br />
A. Voice and accountability –1.19 –0.70 –0.60 0.49 0.10 0.59<br />
B. Political stability and absence<br />
<strong>of</strong> violence<br />
–0.98 –1.73 –2.01 –0.75 –0.28 –1.02<br />
C. Government effectiveness –1.06 –0.94 –0.98 0.12 –0.04 0.08<br />
D. Regula<strong>to</strong>ry quality –0.93 –1.19 –0.62 –0.26 0.57 0.30<br />
E. Rule <strong>of</strong> law –1.30 –1.51 –1.12 –0.21 0.39 0.18<br />
F. Control <strong>of</strong> corruption –1.17 –1.34 –0.92 –0.17 0.42 0.25<br />
Source: Kaufman and o<strong>the</strong>rs (2009) and corresponding authors’ computations.<br />
Note: The value for each measure is standardized <strong>to</strong> lie between –2.5 and 2.5, with <strong>the</strong> world mean <strong>of</strong> 0.0.<br />
29Using political and civil rights as measures <strong>of</strong> democracy corroborates this finding as well (Fosu,<br />
2011a).<br />
30<br />
Alence (2004) defines developmental governance as “economic policy coherence (free-market<br />
policies), public-service effectiveness, and limited corruption.”<br />
31<br />
In contrast, for Botswana, <strong>the</strong> governance indexes are all above <strong>the</strong> respective world averages,<br />
typically residing between 0.5 and 1.0 standard deviation above <strong>the</strong> world mean <strong>of</strong> 0.0.<br />
32All <strong>the</strong> governance measures for Nigeria, except “political stability/absence <strong>of</strong> violence,” show<br />
increases since 1998 or 2003 (see Table 14.6), with <strong>the</strong> increase (decrease) in “voice and accountability”<br />
(“political stability/absence <strong>of</strong> violence”) between 1998 and 2008 significant at <strong>the</strong> 0.10 level<br />
(Kaufman, Kraay, and Mastruzzi, 2009, table 5).<br />
©International Monetary Fund. Not for Redistribution
272 Terms <strong>of</strong> Trade and Growth <strong>of</strong> Resource Economies: Contrasting Evidence from Two African Countries<br />
REFERENCES<br />
Acemoglu, D., S. Johnson, and J.A. Robinson, 2001, “The Colonial Origins <strong>of</strong> Comparative<br />
Development: An Empirical Investigation,” American Economic Review, Vol. 91, pp. 1369–<br />
1401.<br />
———, 2002, “An African Success: Botswana,” in Analytic Development Narratives, ed. by<br />
D. Rodrik (Prince<strong>to</strong>n: Prince<strong>to</strong>n University Press).<br />
Acemoglu, D., J.A. Robinson, and T. Verdier, 2004, “Klep<strong>to</strong>cracy and Divide-and-Rule: A Theory<br />
<strong>of</strong> Personal Rule,” Journal <strong>of</strong> European Economic Association, Vol. 2, pp. 162–92.<br />
Ades, A., and R. Di Tella, 1999, “Rents, Competition, and Corruption,” American Economic<br />
Review, Vol. 89, pp. 982–93.<br />
Alence, R., 2004, “Political Institutions and Developmental Governance in sub-Saharan Africa,”<br />
Journal <strong>of</strong> Modern African Studies, Vol. 42, No. 2, pp. 163–87.<br />
Auty, R.M., 2001, Resource Abundance and Economic Development (Oxford: Oxford University<br />
Press).<br />
Azzam, A., and J.F. Yanagida, 1987, “A Cautionary Note on Polynomial Distributed Lag<br />
Formulations <strong>of</strong> Supply Response,” Western Journal <strong>of</strong> Agricultural Economics, Vol. 12, No. 1,<br />
pp. 60–64.<br />
Baland, J.-M., and P. Francois, 2000, “Rent-Seeking and Resource Booms,” Journal <strong>of</strong><br />
Development Economics, Vol. 61, pp. 527–42.<br />
Baldacci, E., B. Clements, S. Gupta, and Q. Cui, 2004, “Social Spending, Human Capital, and<br />
Growth in Developing Countries: Implications for Achieving <strong>the</strong> MDGs,” IMF Working<br />
Paper No. 04/217 (Washing<strong>to</strong>n: International Monetary Fund).<br />
Basu, P., and D. McLeod, 1992, “Terms <strong>of</strong> Trade Fluctuations and Economic Growth in<br />
Developing Economies,” Journal <strong>of</strong> Development Economics, Vol. 37, pp. 89–110.<br />
Blattman, C., J. Hwang, and J.G. Williamson, 2007, “Winners and Losers in <strong>the</strong> Commodity<br />
Lottery: The Impact <strong>of</strong> Terms <strong>of</strong> Trade Growth and Volatility in <strong>the</strong> Periphery 1870–1939,”<br />
Journal <strong>of</strong> Development Economics, Vol. 82, pp. 156–79.<br />
Bleaney, M., and D. Greenaway, 2001, “The Impact <strong>of</strong> Terms <strong>of</strong> Trade and Real Exchange Rate<br />
on Investment and Growth in Sub-Saharan Africa,” Journal <strong>of</strong> Development Economics,<br />
Vol. 65, pp. 491–500.<br />
Capellen, A., and L. Mjoset, 2009, “Can Norway Be a Role Model for <strong>Natural</strong> Resource<br />
Abundant Countries,” UNU-WIDER Research Paper No. 2009/23 (Cambridge, MA:<br />
United Nations University, World Institute for Development Economic Research).<br />
Collier, P., 1999, “On <strong>the</strong> Economic Consequences <strong>of</strong> Civil War,” Oxford Economic Papers,<br />
Vol. 51, pp. 168–83.<br />
———, 2000, “Ethnicity, Politics and Economic Performance,” Economics and Politics, Vol. 12,<br />
No. 3, pp. 229–72.<br />
Collier, P., and B. Goderis, 2007, “Commodity Prices, Growth, and <strong>the</strong> <strong>Natural</strong> Resource<br />
Curse: Reconciling a Conundrum,” CSAE Working Paper No. 2007-15 (Oxford: Centre for<br />
<strong>the</strong> Study <strong>of</strong> African Economies, University <strong>of</strong> Oxford).<br />
Collier, P. and A. Hoeffler, 2004, “Greed and Grievance in Civil War,” Oxford Economic Papers,<br />
Vol. 56, No. 4, pp. 563–95.<br />
Collier, P., and S. O’Connell, 2008, “Opportunities and Choices,” in The Political Economy <strong>of</strong><br />
Economic Growth in Africa 1960–2000, ed. by B. Ndulu, S. O’Connell, R. Bates, P. Collier,<br />
and C. Soludo (Cambridge: Cambridge University Press), pp. 76–136.<br />
Dea<strong>to</strong>n, A., 1999, “Commodity Prices and Growth in Africa,” Journal <strong>of</strong> Economic Perspectives,<br />
Vol. 13 (Summer), pp. 23–40.<br />
Dea<strong>to</strong>n, A.S., and R.I. Miller, 1995, “International Commodity Prices, Macroeconomic<br />
Performance, and Politics in sub-Saharan Africa,” Prince<strong>to</strong>n Studies in International Finance<br />
No. 79 (Prince<strong>to</strong>n: Prince<strong>to</strong>n University).<br />
———, 1996, “International Commodity Prices, Macroeconomic Performance and <strong>Policies</strong> in<br />
sub-Saharan Africa,” Journal <strong>of</strong> African Economies, Vol. 5, Supplement, pp. 99–191.<br />
©International Monetary Fund. Not for Redistribution
Fosu and Gyapong 273<br />
Easterly, W., 2001, “Can Institutions Resolve Ethnic Conflict?” Economic Development and<br />
Cultural Change, Vol. 49, No. 4, pp. 687–706.<br />
Easterly, W., and R. Levine, 1997, “Africa’s Growth Tragedy: <strong>Policies</strong> and Ethnic Divisions,”<br />
Quarterly Journal <strong>of</strong> Economics, Vol. 112, No. 4, pp. 1203–50.<br />
Fosu, A.K., 1990, “Export Composition and <strong>the</strong> Impact <strong>of</strong> Exports on Economic Growth <strong>of</strong><br />
Developing Economies,” Economics Letters, Vol. 34, No. 1, pp. 67–71.<br />
———, 1992, “Political Instability and Economic Growth: Evidence from sub-Saharan Africa,”<br />
Economic Development and Cultural Change, Vol. 40, No. 4, pp. 829–41.<br />
———, 2001a, “Political Instability and Economic Growth in Developing Economies: Some<br />
Specification Empirics,” Economics Letters, Vol. 70, No. 2, pp. 289–94.<br />
———, 2001b, “The Global Setting and African Economic Growth,” Journal <strong>of</strong> African<br />
Economies, Vol. 10, No. 3, pp. 282–310.<br />
———, 2002, “Political Instability and Economic Growth: Implications <strong>of</strong> Coup Events<br />
in sub-Saharan Africa,” American Journal <strong>of</strong> Economics and Sociology, Vol. 61, No. 1,<br />
pp. 329–48.<br />
———, 2003, “Political Instability and Export Performance in sub-Saharan Africa,” Journal <strong>of</strong><br />
Development Studies, Vol. 39, No. 4 (April), pp. 67–83.<br />
———, 2007, “Fiscal Allocation for Education in sub-Saharan Africa: Implications <strong>of</strong> <strong>the</strong><br />
External Debt Service Constraint,” World Development, Vol. 35, No. 4, pp. 702–13.<br />
———, 2008a, “Democracy and Growth in Africa: Implications <strong>of</strong> Increasing Elec<strong>to</strong>ral<br />
Competitiveness,” Economics Letters, Vol. 100, September 2008, pp. 442–44.<br />
———, 2008b, “Implications <strong>of</strong> External Debt-Servicing Constraint for Public Health<br />
Expenditure in sub-Saharan Africa,” Oxford Development Studies, Vol. 36, No. 4, pp. 363–77.<br />
———, 2008c, “Anti-Growth Syndromes in Africa: A Syn<strong>the</strong>sis <strong>of</strong> <strong>the</strong> Case Studies,” in The<br />
Political Economy <strong>of</strong> Economic Growth in Africa, 1960–2000, ed. by B. Ndulu, S.A.<br />
O’Connell, R.H. Bates, P. Collier, and C.C. Soludo (Cambridge: Cambridge University<br />
Press, 2008), pp. 137–72.<br />
———, 2010, “Africa’s Economic Future: Learning from <strong>the</strong> Past,” CESifo Forum, Vol. 11, No.<br />
1, pp. 62–71.<br />
———, 2011a, “Democracy and Growth in Africa: Evidence on <strong>the</strong> Impact <strong>of</strong> Political and<br />
Civil Rights,” Empirical Economics Letters, Vol. 10, No. 1, pp. 20–25.<br />
———, 2011b, “The African Economic Growth Record and <strong>the</strong> Roles <strong>of</strong> Policy Syndromes<br />
and Governance,” in Good Growth and Governance for Africa: Rethinking Development<br />
Strategies, ed. by A. Noman, K. Botchwey, and J. Stiglitz (Oxford: Oxford University Press,<br />
forthcoming).<br />
Fosu, A.K., and S.A. O’Connell, 2006, “Explaining African Economic Growth: The Role<br />
<strong>of</strong> Anti-Growth Syndromes,” in Annual Bank Conference on Development Economics, ed. by<br />
F. Bourguignon and B. Pleskovic (Washing<strong>to</strong>n: World Bank), pp. 31–66.<br />
Gelb, A., and Associates, 1988, Oil Windfalls: Blessing or Curse? (Oxford: World Bank/Oxford<br />
University Press).<br />
Gyimah-Brempong, K., and M.E. Corley, 2005, “Civil Wars and Economic Growth in sub-<br />
Saharan Africa,” Journal <strong>of</strong> African Economies, Vol. 14, No. 2, pp. 270–311.<br />
Gyimah-Brempong, K., and T. Traynor, 1999, “Political Instability, Investment and Economic<br />
Growth in sub-Saharan Africa,” Journal <strong>of</strong> African Economies, Vol. 8, No. 1, pp. 52–86.<br />
Gylfason, T., 2001, “<strong>Natural</strong> <strong>Resources</strong>, Education, and Economic Development,” European<br />
Economic Review, Vol. 45, Nos. 4–6, pp. 847–59.<br />
Gylfason, T., T.T. Herbertsson, and G. Zoega, 1999, “A Mixed Blessing: <strong>Natural</strong> <strong>Resources</strong> and<br />
Economic Growth,” Macroeconomic Dynamics, Vol. 3, pp. 204–25.<br />
Hendry, D.F, A.R. Pagan, and J.D. Sargan, 1984, “Dynamic Specification,” in Handbook <strong>of</strong><br />
Econometrics, ed. by Z. Griliches and M.D. Intriliga<strong>to</strong>r (Amsterdam: Elsevier Science<br />
Publishers).<br />
Isham, J., L. Pritchett, M. Woolcock, and G. Busby, 2003, “The Varieties <strong>of</strong> <strong>the</strong> Resource<br />
Experience: How <strong>Natural</strong> Resource Export Structures Affect <strong>the</strong> Political Economy <strong>of</strong><br />
Economic Growth,” unpublished (Washing<strong>to</strong>n: World Bank).<br />
©International Monetary Fund. Not for Redistribution
274 Terms <strong>of</strong> Trade and Growth <strong>of</strong> Resource Economies: Contrasting Evidence from Two African Countries<br />
Kaufmann, D., A. Kraay, and M. Mastruzzi, 2009, “Governance Matters VIII: Aggregate and<br />
Individual Governance Indica<strong>to</strong>rs 1996–2008,” World Bank Policy Research Working Paper<br />
No. 4978 (Washing<strong>to</strong>n: World Bank).<br />
Kimenyi, M.S., and J.M. Mbaku, 2003, “Rent-Seeking and Institutional Stability in Developing<br />
Countries,” Public Choice, Vol. 77, No. 2, pp 385–405.<br />
Knack, S., and P. Keefer, 1995, “Institutions and Economic Performance: Cross-Country<br />
Tests Using Alternative Institutional Measures,” Economics and Politics, Vol. 7, No. 3,<br />
pp. 207–27.<br />
Krueger, A.O., 1974, “The Political Economy <strong>of</strong> <strong>the</strong> Rent-Seeking Society,” American Economic<br />
Review 64 (June), 291–323.<br />
Lane, P.R., and A. Tornell, 1996, “<strong>Power</strong>, Growth and <strong>the</strong> Voracity Effect,” Journal <strong>of</strong> Economic<br />
Growth, Vol. 1, pp. 213–41.<br />
Mauro, P., 1999, “Corruption and Growth,” Quarterly Journal <strong>of</strong> Economics, Vol. 90, pp. 681–<br />
712.<br />
McGowan, P., 2003, “African Military Coups d’etat, 1956–2001: Frequency, Trends and<br />
Distribution,” Journal <strong>of</strong> Modern African Studies, Vol. 41, No. 3, pp. 339–70.<br />
Mehlum, H., K. Moene, and R. Torvik, 2006, “Institutions and <strong>the</strong> Resource Curse,” Economic<br />
Journal, Vol. 116, pp. 1–20.<br />
Montalvo, J.G., and M. Reynal-Querol, 2005, “Ethnic Polarization, Potential Conflict, and<br />
Civil Wars,” American Economic Review, Vol. 95, No. 3, pp. 796–816.<br />
Murphy, K., A. Schleifer, and R.W. Vishny, 1989, “Industrialization and <strong>the</strong> Big Push,” Journal<br />
<strong>of</strong> Political Economy, Vol. 97, No. 5, pp. 1003–1026.<br />
Pagano, M., and M. Hartley, 1981, “On Fitting Distributed Lag Models Subject <strong>to</strong> Polynomial<br />
Restrictions,” Journal <strong>of</strong> Econometrics, Vol. 16, No. 2, pp. 171–98.<br />
Prebisch, R., 1950, “The Economic Development <strong>of</strong> Latin America and Its Principal Problems”<br />
(Lake Success, NY: United Nations, Department <strong>of</strong> Economic Affairs) (Reprinted in<br />
Economic Bulletin for Latin America, Vol. 7 (1962), pp. 1–22).<br />
Robinson, J.A., 2009, “Botswana as a Role Model for Country Success,” UNU-WIDER<br />
Research Paper No. 2009/40 (Cambridge, MA: United Nations University, World Institute<br />
for Development Economics Research).<br />
Robinson, J.A., and Q.N. Parsons, 2006, “State Formation and Governance in Botswana,”<br />
Journal <strong>of</strong> African Economies, Vol. 15, Suppl. 1, pp. 100–40.<br />
Robinson, J.A., R. Torvik, and T. Verdier, 2006, “The Political Foundations <strong>of</strong> <strong>the</strong> Resource<br />
Curse,” Journal <strong>of</strong> Development Economics, Vol. 79, pp. 447–68.<br />
Sachs, J.D. and A.M. Warner, 1997, “Sources <strong>of</strong> Slow Growth in African Economies,” Journal<br />
<strong>of</strong> African Economies, Vol. 6, pp. 335–76.<br />
———, 1999, “The Big Push, <strong>Natural</strong> Resource Booms and Growth,” Journal <strong>of</strong> Development<br />
Economics, Vol. 59, pp. 43–76.<br />
———, 2001, “The Curse <strong>of</strong> <strong>Natural</strong> <strong>Resources</strong>,” European Economic Review, Vol. 45,<br />
pp. 827–38.<br />
Sala-i-Martin, X., and A. Subramanian, 2003. “Addressing <strong>the</strong> <strong>Natural</strong> Resource Curse: An<br />
Illustration from Nigeria,” IMF Working Paper No. 03/139 (Washing<strong>to</strong>n: International<br />
Monetary Fund).<br />
Singer, H.W., 1950, “The Distribution <strong>of</strong> Gains between Investing and Borrowing Countries,”<br />
American Economic Review, Vol. 40, pp. 473–85.<br />
Skaperdas, S., 2002, “Warlord Competition,” Journal <strong>of</strong> Peace Research, Vol. 39, pp. 435–46.<br />
Tornell, A., and P. Lane, 1999, “Voracity and Growth,” American Economic Review, Vol. 89,<br />
pp. 22–46.<br />
Torvik, R., 2002, “<strong>Natural</strong> <strong>Resources</strong>, Rent Seeking and Welfare,” Journal <strong>of</strong> Development<br />
Economics, Vol. 67, pp. 455–70.<br />
Trivedi, P.K., and A.R. Pagan, 1979, “Polynomial Distributed Lags: A United Treatment,”<br />
Economic Studies Quarterly, April, pp. 37–49.<br />
©International Monetary Fund. Not for Redistribution
Fosu and Gyapong 275<br />
United States, Central Intelligence Agency (CIA), 2010, The World Factbook (Washing<strong>to</strong>n:<br />
Central Intelligence Agency). URL: https://www.cia.gov/library/publications/<strong>the</strong>-worldfactbook/<br />
Van der Ploeg, F., 2008, “Challenges and Opportunities for Resource Rich Economies,”<br />
OxCarre Working Paper No. 005 (Oxford Centre for <strong>the</strong> Analysis <strong>of</strong> Resource Rich<br />
Economies, University <strong>of</strong> Oxford). .<br />
Van Wijnbergen, S., 1984, “The ‘Dutch Disease’: A Disease After All,” Economic Journal,<br />
Vol. 94, No. 373, pp. 41–55.<br />
World Bank, 1992, African Development Indica<strong>to</strong>rs (Washing<strong>to</strong>n: The World Bank).<br />
———, 1996, African Development Indica<strong>to</strong>rs (Washing<strong>to</strong>n: The World Bank).<br />
———, 1998/99, African Development Indica<strong>to</strong>rs (Washing<strong>to</strong>n: The World Bank).<br />
———, 2004a, Africa Database CDROM (Washing<strong>to</strong>n: The World Bank).<br />
———, 2004b, World Development Indica<strong>to</strong>rs (Washing<strong>to</strong>n: The World Bank).<br />
———, 2009, World Development Indica<strong>to</strong>rs Online (Washing<strong>to</strong>n: The World Bank).<br />
———, 2010, World Development Indica<strong>to</strong>rs Online (Washing<strong>to</strong>n: The World Bank).<br />
©International Monetary Fund. Not for Redistribution