Notes with answers - Summit Schools
Notes with answers - Summit Schools
Notes with answers - Summit Schools

You also want an ePaper? Increase the reach of your titles
YUMPU automatically turns print PDFs into web optimized ePapers that Google loves.
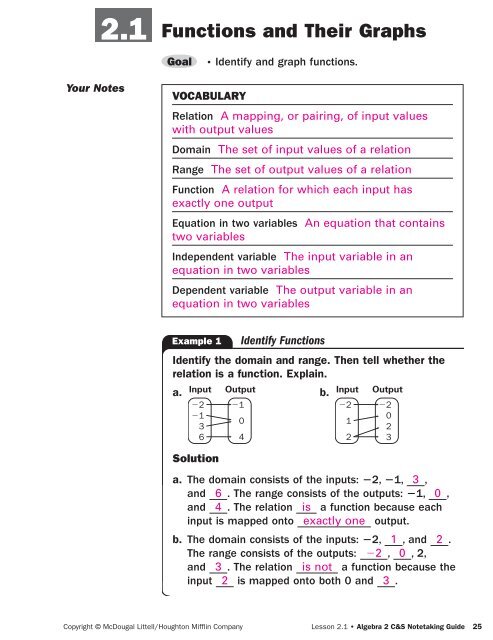
2.1<br />
Your <strong>Notes</strong><br />
Functions and Their Graphs<br />
Goal p Identify and graph functions.<br />
Vocabulary<br />
Relation A mapping, or pairing, of input values<br />
<strong>with</strong> output values<br />
Domain The set of input values of a relation<br />
Range The set of output values of a relation<br />
Function A relation for which each input has<br />
exactly one output<br />
Equation in two variables An equation that contains<br />
two variables<br />
Independent variable The input variable in an<br />
equation in two variables<br />
Dependent variable The output variable in an<br />
equation in two variables<br />
Example 1 Identify Functions<br />
Identify the domain and range. Then tell whether the<br />
relation is a function. Explain.<br />
a.<br />
Input Output<br />
22 21<br />
21<br />
3<br />
0<br />
6 4<br />
Solution<br />
b.<br />
Input Output<br />
22 22<br />
0<br />
1<br />
2<br />
2 3<br />
a. The domain consists of the inputs: 22, 21, 3 ,<br />
and 6 . The range consists of the outputs: 21, 0 ,<br />
and 4 . The relation is a function because each<br />
input is mapped onto exactly one output.<br />
b. The domain consists of the inputs: 22, 1 , and 2 .<br />
The range consists of the outputs: 22 , 0 , 2,<br />
and 3 . The relation is not a function because the<br />
input 2 is mapped onto both 0 and 3 .<br />
Copyright © McDougal Littell/Houghton Mifflin Company Lesson 2.1 • Algebra 2 C&S Notetaking Guide 25
Your <strong>Notes</strong><br />
VErTical linE TEST For FuncTionS<br />
A relation is a function if and only if no vertical line<br />
intersects the graph at more than one point .<br />
Function Not a function<br />
1<br />
O<br />
y<br />
1<br />
x<br />
Example 2 Apply the Vertical Line Test<br />
Graph the relations from Example 1. Use the vertical<br />
line test to tell whether the relations are functions.<br />
a. First, write the relation<br />
as a set of ordered<br />
pairs.<br />
(–2, –1), (–1, 0) ,<br />
(3, 0), (6, 4)<br />
Then plot the points.<br />
1<br />
O<br />
y<br />
1<br />
No vertical line<br />
contains more<br />
than one point so the<br />
relation is a function .<br />
x<br />
1<br />
O<br />
y<br />
1<br />
b. First, write the relation<br />
as a set of ordered<br />
pairs.<br />
(–2, –2) , (1, 0),<br />
(2, 2) , (2, 3)<br />
Then plot the points.<br />
1<br />
O<br />
y<br />
1<br />
The vertical line at<br />
x 5 2 contains two<br />
different points in the<br />
relation. So, the relation<br />
is not a function.<br />
26 Lesson 2.1 • Algebra 2 C&S Notetaking Guide Copyright © McDougal Littell/Houghton Mifflin Company<br />
x<br />
x
Your <strong>Notes</strong><br />
Homework<br />
GraphinG EquaTionS in Two VariablES<br />
Step 1 Make a table of values. Write the ordered pairs .<br />
Step 2 Plot enough solutions to recognize a pattern .<br />
Step 3 Connect the points <strong>with</strong> a line or a curve .<br />
Example 3 Graph an Equation<br />
Graph y 5 22x 2 2.<br />
Solution<br />
1. Make a table of values . Write the ordered pairs .<br />
Choose x 22 21 0 1 2<br />
Evaluate y 2 0 22 24 26<br />
(x, y): (22, 2 ), (21, 0 ), (0, 22 ), (1, 24 ), (2, 26 )<br />
2. Plot the points. Notice that all<br />
the points lie on a line .<br />
3. Connect the points <strong>with</strong> a<br />
line . Observe that the<br />
graph represents a function .<br />
Checkpoint Complete the following exercises.<br />
1. Graph y 5 x 1 2. 2. Graph y 5 3x 2 1.<br />
1<br />
O<br />
y<br />
1<br />
Copyright © McDougal Littell/Houghton Mifflin Company Lesson 2.1 • Algebra 2 C&S Notetaking Guide 27<br />
x<br />
1<br />
O<br />
y<br />
1<br />
1<br />
O<br />
y<br />
1<br />
x<br />
x
2.2<br />
Your <strong>Notes</strong><br />
linear Functions and Function<br />
notation<br />
Goal p Identify, evaluate, and graph linear functions.<br />
Vocabulary<br />
Linear function A function that can be written in the<br />
form y 5 mx 1 b where m and b are constants<br />
Function notation Using f(x) to represent the<br />
dependent variable of a function<br />
Example 1 Identify a Linear Function<br />
Tell whether the function is linear. Explain.<br />
a. f(x) 5 2x3 1 6 2 x b. g(x) 5 9 1 4x<br />
a. f is not a linear function because it has an<br />
x 3-term .<br />
b. g is a linear function because it can be rewritten as<br />
g(x) 5 4x 1 9 , so m 5 4 and b 5 9 .<br />
Checkpoint Tell whether the function is linear. Explain.<br />
1. f(x) 5 6x 1 10<br />
Yes; it is of the form<br />
y 5 mx 1 b.<br />
Example 2 Evaluate a Function<br />
Evaluate the function when x 5 3.<br />
2. g(x) 5 2x2 1 4x 2 1<br />
No; it is not of the<br />
form y 5 mx 1 b.<br />
a. f(x) 5 22x 1 5 b. g(x) 5 x2 2 x 2 1<br />
a. f (x) 5 22x 1 5 Write original function.<br />
f ( 3 ) 5 22( 3 ) 1 5 Substitute 3 for x.<br />
5 26 1 5 Multiply.<br />
5 21 Simplify.<br />
28 Lesson 2.2 • Algebra 2 C&S Notetaking Guide Copyright © McDougal Littell/Houghton Mifflin Company
Your <strong>Notes</strong><br />
Homework<br />
b. g (x) 5 x 2 2 x 2 1 Write original function.<br />
g( 3 ) 5 ( 3 ) 2 2 3 2 1 Substitute 3 for x.<br />
5 9 2 3 2 1 Multiply.<br />
5 5 Simplify.<br />
Checkpoint Evaluate the function when x 5 24.<br />
3. f(x) 5 2x 2 3 4. g(x) 5 2x 2 1 3x<br />
211 20<br />
Example 3 Graph a Linear Function<br />
Graph f(x) 5 2x 1 2.<br />
Solution<br />
Rewrite the function as y 5 2x 1 2. Find a point on<br />
the graph by substituting a convenient value for x .<br />
y 5 2x 1 2 Write equation.<br />
y<br />
y 5 2( 0 ) 1 2 Substitute 0 for x.<br />
y 5 2 Simplify.<br />
1<br />
O 1<br />
One point is (0, 2) . Find a second<br />
point.<br />
y 5 2(1) 1 2 Substitute 1 for x .<br />
y 5 1 Simplify.<br />
A second point is (1, 1) . Draw a line through the<br />
two points.<br />
Checkpoint Complete the following exercise.<br />
5. Graph h(x) 5 22x 1 1.<br />
Copyright © McDougal Littell/Houghton Mifflin Company Lesson 2.2 • Algebra 2 C&S Notetaking Guide 29<br />
1<br />
O<br />
y<br />
1<br />
x<br />
x
2.3<br />
Your <strong>Notes</strong><br />
When calculating<br />
the slope, be sure<br />
to subtract the<br />
x‑coordinates and<br />
the y‑coordinates<br />
in the correct order.<br />
A vertical line has<br />
“undefined slope”<br />
because for any<br />
two points, the<br />
slope formula’s<br />
denominator<br />
becomes 0, and<br />
division by 0 is<br />
undefined.<br />
Slope and rate of change<br />
Goal p Find and use the slope of a line.<br />
Vocabulary<br />
Slope For a nonvertical line, the ratio of the line’s<br />
vertical change to its horizontal change<br />
ThE SlopE oF a linE<br />
The slope m of the nonvertical line passing through<br />
the points (x1 , y1 ) and (x2 , y2 ) is given by the formula<br />
m 5 y2 2 y1 } .<br />
x2 2 x1 Example 1 Find the Slope of a Line<br />
Find the slope of the line through (1, 3) and (6, 7).<br />
Solution<br />
Let (x 1 , y 1 ) 5 (1, 3) and (x 2 , y 2 ) 5 (6, 7) .<br />
m 5 y2 2 y1 } 5<br />
x2 2 x1 7 2 3<br />
}<br />
6 2 1<br />
The slope of the line is<br />
4<br />
5 }<br />
5<br />
4<br />
} .<br />
5<br />
claSSiFyinG linES by SlopE<br />
Positive Negative Zero Undefined<br />
O<br />
y<br />
x<br />
O<br />
y<br />
Line rises from Line falls from Line is Line is<br />
left to right. left to right . horizontal . vertical .<br />
30 Lesson 2.3 • Algebra 2 C&S Notetaking Guide Copyright © McDougal Littell/Houghton Mifflin Company<br />
x<br />
O<br />
y<br />
x<br />
O<br />
y<br />
x
Your <strong>Notes</strong><br />
Example 2 Classify Lines Using Slope<br />
Without graphing, tell whether the line through the<br />
given points rises, falls, is horizontal, or is vertical.<br />
a. (26, 22), (1, 3) b. (2, 21), (2, 2)<br />
Solution<br />
a. m 5<br />
b. m 5<br />
3 2 (22)<br />
}<br />
1 2 (26)<br />
2 2 (21)<br />
}<br />
2 2 2<br />
5 5<br />
}<br />
7 Because m > 0, the line rises .<br />
5 3<br />
}<br />
0 Because m is undefined , the<br />
line is vertical .<br />
Checkpoint Complete the following exercises.<br />
1. Find the slope of the line through (4, 2) and (7, 9).<br />
7<br />
}<br />
3<br />
2. Without graphing, tell whether the line through the<br />
points (23, 2) and (1, 4) rises, falls, is horizontal, or<br />
is vertical.<br />
rises<br />
Example 3 Compare Steepness of Lines<br />
Tell which line is steeper.<br />
Line 1: through (2, 3) and (21, 4)<br />
Line 2: through (27, 22) and (24, 25)<br />
Solution<br />
Slope of line 1: m 5<br />
Slope of line 2: m 5<br />
4 2 3<br />
}<br />
21 2 2<br />
25 2 (22)<br />
}<br />
24 2 (27)<br />
5 1<br />
}<br />
23<br />
or 2 1<br />
}<br />
3<br />
5 23<br />
}<br />
3<br />
5 21<br />
Both lines have negative slope.<br />
Because |m1 | > |m2 |, line 1 is steeper than<br />
line 2 .<br />
Copyright © McDougal Littell/Houghton Mifflin Company Lesson 2.3 • Algebra 2 C&S Notetaking Guide 31
Your <strong>Notes</strong><br />
Homework<br />
Checkpoint Tell which line is steeper.<br />
3. Line 1: through (3, 5) and (6, 8)<br />
Line 2: through (22, 4) and (10, 12)<br />
line 1<br />
Example 4 Slope as a Rate of Change<br />
census The population of Smalltown was 10,000 in<br />
2001 and 12,500 in 2006. Find the average rate of<br />
change in the population.<br />
Solution<br />
Let (x1 , y1 ) 5 (2001, 10,000 ) and<br />
(x2 , y2 ) 5 ( 2006 , 12,500 ).<br />
Change in population<br />
Average rate of change 5 }}<br />
Change in time<br />
12,500 2 10,000<br />
5 }}<br />
2006 2 2001<br />
5 2500<br />
}<br />
5<br />
5 500<br />
The average rate of change is 500 people per year .<br />
Checkpoint Complete the following exercise.<br />
4. Census Suppose the population of Smalltown will be<br />
20,000 in 2011. Use the information in Example 4<br />
to find the average rate of change in the population<br />
from 2001 to 2011.<br />
1000 people per year<br />
32 Lesson 2.3 • Algebra 2 C&S Notetaking Guide Copyright © McDougal Littell/Houghton Mifflin Company
Your <strong>Notes</strong><br />
2.4 quick Graphs of linear<br />
Equations<br />
Goal p Use slope-intercept form and standard form to<br />
graph equations.<br />
Vocabulary<br />
y-intercept The y-coordinate of a point where a<br />
graph intersects the y-axis<br />
Slope-intercept form A linear equation written in the<br />
form y 5 mx 1 b where m is the slope and b is the<br />
y-intercept of the equation’s graph<br />
x-intercept The x-coordinate of a point where a<br />
graph intersects the x-axis<br />
Standard form of a linear equation A linear equation<br />
written in the form Ax 1 By 5 C where A and B are<br />
not both zero<br />
GraphinG EquaTionS in SlopE-inTErcEpT Form<br />
Step 1 Write the equation in slope-intercept form by<br />
solving for y .<br />
Step 2 Find the y-intercept and plot the<br />
corresponding point.<br />
Step 3 Find the slope and use it to plot a second<br />
point on the line.<br />
Step 4 Draw a line through the two points .<br />
Copyright © McDougal Littell/Houghton Mifflin Company Lesson 2.4 • Algebra 2 C&S Notetaking Guide 33
Your <strong>Notes</strong><br />
Example 1 Use Slope-Intercept Form to Graph a Line<br />
Graph y 1 3 } x 5 1.<br />
2<br />
solution<br />
1. Solve the equation for y by subtracting 3<br />
} x from each<br />
2<br />
side:<br />
y 5 1 2 3<br />
} x or y 5 2<br />
2 3<br />
} x 1 1<br />
2<br />
2. Find the y-intercept. Comparing y 5 2 3<br />
} x 1 1 to<br />
2<br />
y 5 mx 1 b, you can see that b 5 1 . Plot a point<br />
at ( 0 , 1 ).<br />
3. Find the slope. The slope is m 5 2 3<br />
} , so<br />
2 rise<br />
}<br />
run<br />
From (0, 1), move down 3 units and right<br />
2 units. Plot a second point at ( 2 , 22 ).<br />
4. Draw a line through the two points.<br />
1<br />
O<br />
y<br />
1<br />
x<br />
GraphinG Equations in standard Form<br />
Step 1 Write the equation in standard form .<br />
Step 2 Find the x-intercept by letting y 5 0 and<br />
solving for x . Plot the corresponding point.<br />
Step 3 Find the y-intercept by letting x 5 0 and<br />
solving for y . Plot the corresponding point.<br />
Step 4 Draw a line through the two points .<br />
5 23<br />
}<br />
2 .<br />
34 Lesson 2.4 • Algebra 2 C&S Notetaking Guide Copyright © McDougal Littell/Houghton Mifflin Company
Your <strong>Notes</strong><br />
Example 2 Draw Quick Graphs<br />
Graph 4x 1 5y 5 20.<br />
1. The equation is already in standard form .<br />
2. Find the x-intercept. 4x 1 5( 0 ) 5 20 Let y 5 0.<br />
SlopES oF parallEl and pErpEndicular linES<br />
Consider two different<br />
nonvertical lines l 1 and l 2<br />
<strong>with</strong> slopes m 1 and m 2 .<br />
Two lines are parallel if and only<br />
if they have the same slope .<br />
m 1 5 m 2<br />
Two lines are perpendicular if and<br />
only if their slopes are negative<br />
reciprocals of each other.<br />
m 1 5 2 1<br />
}<br />
m 2 or m 1 • m 2 5 –1<br />
x 5 5 Solve for x.<br />
The x-intercept is 5 , so plot the point (5, 0) .<br />
3. Find the y-intercept. 4( 0 ) 1 5y 5 20 Let x 5 0 .<br />
y 5 4 Solve for y.<br />
The y-intercept is 4 , so plot the point (0, 4) .<br />
4. Draw a line through<br />
the intercepts.<br />
Copyright © McDougal Littell/Houghton Mifflin Company Lesson 2.4 • Algebra 2 C&S Notetaking Guide 35<br />
l 1<br />
l 1<br />
1<br />
O<br />
l 2<br />
y<br />
1<br />
O<br />
1<br />
1<br />
O<br />
y<br />
y<br />
1<br />
1<br />
l 2<br />
x<br />
x<br />
x
Your <strong>Notes</strong><br />
Homework<br />
Example 3 Graph Parallel and Perpendicular Lines<br />
a. Draw the graph y 5 2x 2 3.<br />
b. Graph the line that passes through (0, 2) and is<br />
parallel to the graph of y 5 2x 2 3.<br />
c. Graph the line that passes through (0, 2) and is<br />
perpendicular to the graph of y 5 2x 2 3.<br />
Solution<br />
a. Draw the graph y 5 2x 2 3<br />
using the y-intercept 23 and<br />
slope 2 .<br />
b. Graph the point (0, 2). Any<br />
line parallel to the graph of<br />
y 5 2x 2 3 has the same<br />
slope, 2 . From (0, 2), move<br />
up 2 units and right<br />
1 unit. Plot a second point at (1, 4) . Draw a line<br />
through the two points.<br />
c. The slope of any line perpendicular to the<br />
graph of y 5 2x 2 3 is the negative reciprocal<br />
of 2, or 2 1<br />
} . So, from (0, 2), move down 1 unit<br />
2<br />
and right 2 units. Plot a second point at<br />
(2, 1) . Draw the line.<br />
Checkpoint On the same grid, draw each graph.<br />
1. y 5 2 1 }<br />
3 x 1 1<br />
2. The line parallel to<br />
y 5 2 1 }<br />
3 x 1 1 through<br />
the point (0, 4)<br />
3. The line perpendicular<br />
to y 5 2 1 }<br />
3 x 1 1 through<br />
the point (0, 4)<br />
36 Lesson 2.4 • Algebra 2 C&S Notetaking Guide Copyright © McDougal Littell/Houghton Mifflin Company<br />
c<br />
1<br />
O<br />
y<br />
1<br />
1<br />
O<br />
Ex. 3<br />
y<br />
1<br />
b<br />
Ex. 1<br />
Ex. 2<br />
x<br />
a<br />
x
Your <strong>Notes</strong><br />
2.5 writing Equations of lines<br />
Goal p Write linear equations.<br />
Vocabulary<br />
Point-slope form An equation of a line written in<br />
the form y 2 y 1 5 m(x 2 x 1 ) where the line passes<br />
through the point (x 1 , y 1 ) and has a slope of m<br />
wriTinG an EquaTion oF a linE<br />
Slope-Intercept Form Given the slope m and the<br />
y-intercept b , use slope-intercept form: y 5 mx 1 b .<br />
Point-Slope Form Given the slope m and a point<br />
(x1 , y1 ) , use point-slope form: y 2 y1 5 m(x 2 x1 ) .<br />
Example 1 Write an Equation Given Slope and y-Intercept<br />
Write an equation of the<br />
line shown.<br />
y<br />
Solution<br />
1<br />
From the graph, you can see<br />
that the slope is m 5 2<br />
O 2<br />
3<br />
}<br />
2<br />
.<br />
Because the line intersects the<br />
y-axis at ( 0, 1 ), the y-intercept<br />
is b 5 1 .<br />
Use the slope-intercept form to write an equation of<br />
the line.<br />
y 5 mx 1 b Use slope-intercept form.<br />
y 5 2 3<br />
}<br />
2<br />
x 1 1 Substitute 2 3<br />
}<br />
2<br />
for m and 1 for b.<br />
Copyright © McDougal Littell/Houghton Mifflin Company Lesson 2.5 • Algebra 2 C&S Notetaking Guide 37<br />
x
Your <strong>Notes</strong><br />
Example 2 Write an Equation Given Slope and a Point<br />
Write an equation of the line that passes through (2, 1)<br />
and has a slope of 2.<br />
Solution<br />
Because you know the slope and a point on the line,<br />
use the point-slope form <strong>with</strong> (x1 , y1 ) 5 (2, 1) and<br />
m 5 2 .<br />
y 2 y1 5 m(x 2 x1 ) Use point-slope form.<br />
y 2 1 5 2 (x 2 2 ) Substitute for m, x1 , and y1 .<br />
Rewrite the equation in slope-intercept form.<br />
y 2 1 5 2x 2 4 Distributive property<br />
y 5 2x 2 3 Slope-intercept form<br />
Checkpoint Write an equation of the line.<br />
1. y<br />
2. The line through (1, 5)<br />
1<br />
<strong>with</strong> a slope of 22<br />
O<br />
1<br />
x<br />
y 5 2<br />
}<br />
3 x 2 3 y 5 22x 1 7<br />
Example 3 Write Equations of Parallel Lines<br />
Write an equation of the line that passes through<br />
(21, 1) and is parallel to the line y 5 22x 1 3.<br />
Solution<br />
The given line has a slope of 22 . Any line parallel<br />
to this line must also have a slope of 22 . Use<br />
point-slope form <strong>with</strong> (x1 , y1 ) 5 (21, 1) and<br />
m 5 22 to write the equation of the line.<br />
38 Lesson 2.5 • Algebra 2 C&S Notetaking Guide Copyright © McDougal Littell/Houghton Mifflin Company
Your <strong>Notes</strong><br />
Homework<br />
y 2 y 1 5 m(x 2 x 1 ) Use point-slope form.<br />
y 2 1 5 22 [x 2 (21) ] Substitute 1 for y 1 , 22<br />
for m, and 21 for x 1 .<br />
y 2 1 5 22x 2 2 Distributive property<br />
y 5 22x 2 1 Slope-intercept form<br />
Example 4 Write Equations of Perpendicular Lines<br />
Write an equation of the line that passes through<br />
(23, 5) and is perpendicular to the line y 5 4x 2 1.<br />
solution<br />
The given line has a slope of 4 . The slope of any<br />
line perpendicular to this line will be the negative<br />
reciprocal of 4 , which is 2 1<br />
} .<br />
4<br />
Use point-slope form <strong>with</strong> (x1 , y1 ) 5 (23, 5) and<br />
m 5 2 1<br />
} to write the equation of the line.<br />
4<br />
y 2 y 1 5 m(x 2 x 1 ) Use point-slope form.<br />
y 2 5 5 2 1<br />
} [x 2 (23) ]<br />
4<br />
Substitute 5 for y1 , 2 1<br />
}<br />
4<br />
for m, and 23 for x1 .<br />
1<br />
y 2 5 5 2 } x 2<br />
4 3<br />
}<br />
4<br />
Distributive property<br />
1<br />
y 5 2 } x 1<br />
4 17<br />
}<br />
4<br />
Checkpoint Write an equation of the line.<br />
3. The line through<br />
(22, 3) parallel to<br />
y 5 4x 2 6<br />
y 5 4x 1 11<br />
Slope-intercept form<br />
4. The line through<br />
(22, 3) perpendicular<br />
to y 5 4x 2 6<br />
y 5 2 1<br />
} x 1<br />
4 5<br />
}<br />
2<br />
Copyright © McDougal Littell/Houghton Mifflin Company Lesson 2.5 • Algebra 2 C&S Notetaking Guide 39
Your <strong>Notes</strong><br />
2.6 direct Variation<br />
Goal p Write and graph direct variation equations.<br />
Vocabulary<br />
Direct variation Two variables x and y show direct<br />
variation provided that y 5 kx where k is a nonzero<br />
constant.<br />
Constant of variation The nonzero constant k in a<br />
direct variation equation y 5 kx<br />
Example 1 Graph a Direct Variation Equation<br />
Graph y 5 5<br />
} x.<br />
3<br />
Solution<br />
Plot a point at the origin .<br />
Find a second point by substituting<br />
a convenient value for x .<br />
y 5 5 } x<br />
3<br />
Write equation.<br />
y 5 5 } ( 3 )<br />
3<br />
Substitute 3 for x.<br />
y 5 5 Simplify.<br />
A second point is (3, 5) .<br />
Plot the second point. Then draw a line through the<br />
two points.<br />
Checkpoint Graph the equation.<br />
1. y 5 23x<br />
1<br />
O<br />
y<br />
1<br />
40 Lesson 2.6 • Algebra 2 C&S Notetaking Guide Copyright © McDougal Littell/Houghton Mifflin Company<br />
x<br />
1<br />
O<br />
y<br />
1<br />
x
Your <strong>Notes</strong><br />
The value of k is<br />
called the spring<br />
constant. This<br />
constant is unique<br />
for each spring.<br />
Example 2 Write a Direct Variation Equation<br />
physics According to Hooke’s law, the amount that a<br />
spring is stretched varies directly <strong>with</strong> the force that is<br />
applied to the spring. If 64 pounds of force F stretches<br />
a spring a distance d of 8 inches, write an equation<br />
so that F varies directly <strong>with</strong> d. How many pounds of<br />
force are needed to stretch the spring to a distance<br />
of 14 inches?<br />
Solution<br />
Find the constant of variation.<br />
F 5 kd Write a direct variation equation.<br />
64 5 k( 8 ) Substitute 64 for F and 8 for d.<br />
8 5 k Simplify.<br />
An equation is F 5 8d . To find how many pounds<br />
of force is needed to stretch the spring 14 inches,<br />
substitute 14 for d.<br />
F 5 8 ( 14 ) 5 112<br />
A force of 112 pounds will stretch the spring 14 inches.<br />
Checkpoint Complete the following exercise.<br />
2. Suppose that a force of 92 pounds is applied to<br />
the spring discussed in Example 2. How far will<br />
the spring be stretched?<br />
11.5 inches<br />
Copyright © McDougal Littell/Houghton Mifflin Company Lesson 2.6 • Algebra 2 C&S Notetaking Guide 41
Your <strong>Notes</strong><br />
Homework<br />
Example 3 Identify Direct Variation<br />
The table gives sample cell phone bills, showing the<br />
total monthly cost and the number of minutes used<br />
per month. Tell whether total cost and the number of<br />
minutes show direct variation. If so, write an equation<br />
relating c and m.<br />
Total cost, c (dollars) 35 45 80 15 28<br />
Minutes used, m 100 129 229 43 80<br />
solution<br />
Find the ratio of c to m for each data pair.<br />
35<br />
}<br />
100<br />
15<br />
}<br />
43<br />
5 0.35 45<br />
}<br />
129<br />
28<br />
< 0.35 } 5 0.35<br />
30<br />
Checkpoint Complete the following exercise.<br />
3. Tell whether the data (21, 22), (1, 2), (3, 6),<br />
(5, 10), (7, 14) show direct variation. If so, write an<br />
expression relating x and y.<br />
direct variation; y 5 2x<br />
80<br />
< 0.35 } < 0.35<br />
229<br />
The ratio of c to m in each pair is nearly the same , so<br />
the data show direct variation . Substituting 0.35<br />
for k in c 5 km gives the direct variation equation<br />
c 5 0.35 m, which relates the total cost to number of<br />
minutes used.<br />
42 Lesson 2.6 • Algebra 2 C&S Notetaking Guide Copyright © McDougal Littell/Houghton Mifflin Company
2.7<br />
Your <strong>Notes</strong><br />
Scatter plots and correlation<br />
Goal p See correlation in a scatter plot and find a<br />
best-fitting line.<br />
Vocabulary<br />
Scatter plot A graph of a set of data pairs (x, y)<br />
used to determine whether there is a relationship<br />
between the variables x and y<br />
Positive correlation A set of data pairs (x, y) for<br />
which as x increases, y tends to increase<br />
Negative correlation A set of data pairs (x, y) for<br />
which as x increases, y tends to decrease<br />
Relatively no correlation A set of data pairs (x, y) for<br />
which there is no obvious pattern between x and y<br />
Best-fitting line The line that most closely models<br />
the data shown in a scatter plot<br />
Example 1 Identify Correlation<br />
Describe the correlation shown by each plot.<br />
a. y<br />
b.<br />
1<br />
O<br />
1<br />
x<br />
Solution<br />
a. The scatter plot shows a negative correlation: as<br />
x increases, y decreases .<br />
b. The scatter plot shows a positive correlation: as<br />
x increases , y also increases .<br />
Copyright © McDougal Littell/Houghton Mifflin Company Lesson 2.7 • Algebra 2 C&S Notetaking Guide 43<br />
1<br />
O<br />
y<br />
1<br />
x
Your <strong>Notes</strong><br />
Be sure that about<br />
the same number<br />
of points lie above<br />
your best-fitting<br />
line as lie below it.<br />
approximatinG a BEst-FittinG LinE<br />
Step 1 Draw a scatter plot of the data .<br />
Step 2 Sketch a line that follows the trend of the<br />
data points.<br />
Step 3 Choose two points that appear to lie on the<br />
line, and estimate their coordinates .<br />
Step 4 Write an equation of the line that passes<br />
through the two points from Step 3. This<br />
equation gives a model for the data.<br />
Example 2 Find a Best-Fitting Line<br />
Football attendance The table gives the number of<br />
people y who attended each of the first seven football<br />
games x of the season. Approximate the best-fitting<br />
line for the data.<br />
x 1 2 3 4 5 6 7<br />
y 722 763 772 826 815 857 897<br />
solution<br />
1. Draw a scatter plot.<br />
950<br />
y<br />
2. Sketch the line that<br />
900<br />
best fits the data.<br />
850<br />
800<br />
3. Choose two points on the<br />
line. For this scatter plot you<br />
750<br />
700<br />
650<br />
might choose (1, 725) and<br />
0<br />
0 1 2 3 4 5 6 7 x<br />
( 2 , 750).<br />
Football game<br />
4. Write an equation of the line. First find the slope using<br />
the two points:<br />
750 2 725 25<br />
m 5 } 5 } 5 25<br />
2 2 1 1<br />
Now use point-slope form. Choose (x1 , y1 ) 5 (1, 725).<br />
y 2 y 1 5 m(x 2 x 1 ) Point-slope form<br />
y 2 725 5 25 (x 2 1 ) Substitute for y 1 , m, and x 1 .<br />
Number of people<br />
y 5 25x 1 700 Solve for y.<br />
44 Lesson 2.7 • Algebra 2 C&S Notetaking Guide Copyright © McDougal Littell/Houghton Mifflin Company
Your <strong>Notes</strong><br />
Homework<br />
Example 3 Use a Best-Fitting Line<br />
Use the equation of the best-fitting line from Example 2<br />
to predict the number of people that will attend the<br />
tenth football game.<br />
Solution<br />
Substitute 10 for x in the equation from Example 2.<br />
y 5 25( 10 ) 1 700 5 250 1 700 5 950<br />
You can predict that 950 people will attend the game.<br />
Checkpoint Complete the following exercises.<br />
For each scatter plot, tell whether the data show a<br />
positive correlation, negative correlation, or relatively no<br />
correlation.<br />
1. y<br />
2. y<br />
1<br />
O<br />
1<br />
positive correlation<br />
x<br />
1<br />
O<br />
1<br />
relatively no correlation<br />
3. School The table gives the average class score y on<br />
each test for the first six chapters x of the textbook.<br />
x 1 2 3 4 5 6<br />
y 84 83 86 88 87 90<br />
a. Approximate the best-fitting<br />
line for the data.<br />
y 5 2x 1 80<br />
b. Use your equation to predict<br />
the test score for the 9th test<br />
that the class will take.<br />
98<br />
Average class score<br />
90<br />
88<br />
86<br />
84<br />
82<br />
y<br />
0<br />
0 1 2 3 4 5<br />
Test<br />
Copyright © McDougal Littell/Houghton Mifflin Company Lesson 2.7 • Algebra 2 C&S Notetaking Guide 45<br />
x<br />
6<br />
x
words to review<br />
use your own words and/or an example to explain<br />
the vocabulary word.<br />
Relation<br />
A mapping, or pairing,<br />
of input values <strong>with</strong><br />
output values<br />
Range<br />
The set of output<br />
values in a relation<br />
Equation in two variables<br />
y 5 2x 2 5<br />
Dependent variable<br />
The dependent variable<br />
in the equation<br />
y 5 2x 2 5 is y.<br />
Function notation<br />
f(x) 5 2x 1 4<br />
y-intercept<br />
The y-intercept of<br />
y 5 2x 1 4 is 4.<br />
x-intercept<br />
The x-intercept of<br />
y 5 2x 1 4 is 22.<br />
Domain<br />
The set of input values<br />
in a relation<br />
Function<br />
A relation for which<br />
each input has exactly<br />
one output<br />
Independent variable<br />
The independent<br />
variable in the equation<br />
y 5 2x 2 5 is x.<br />
Linear function<br />
A function that can be<br />
written in the form<br />
y 5 mx 1 b where m<br />
and b are constants<br />
Slope<br />
The slope of the line<br />
passing through (2, 6)<br />
and (5, 9) is<br />
m 5 y 2 2 y 1<br />
}<br />
x 2 2 x 1<br />
5<br />
9 2 6<br />
}<br />
5 2 2<br />
5 3<br />
}<br />
3 5 1.<br />
Slope-intercept form<br />
y 5 2x 1 4<br />
Standard form of a linear<br />
equation<br />
2x 1 4y 5 7<br />
46 Words to Review • Algebra 2 C&S Notetaking Guide Copyright © McDougal Littell/Houghton Mifflin Company
Point-slope form<br />
y 2 1 5 2(x 2 5)<br />
Constant of variation<br />
The constant of<br />
variation in the direct<br />
variation equation<br />
y 5 6x is 6.<br />
Positive correlation<br />
This scatter plot shows<br />
a positive correlation.<br />
y<br />
Relatively no correlation<br />
This scatter plot<br />
shows relatively no<br />
correlation.<br />
y<br />
x<br />
x<br />
Direct variation<br />
y 5 6x<br />
Scatter plot<br />
A graph of a set of<br />
data pairs (x, y) used<br />
to determine whether<br />
there is a relationship<br />
between the variables<br />
x and y<br />
Negative correlation<br />
This scatter plot shows<br />
a negative correlation.<br />
y<br />
Best-fitting line<br />
The line that most<br />
closely models the data<br />
shown in a scatter plot<br />
review your notes and chapter 2 by using the<br />
chapter review on pages 115–118 of your textbook.<br />
Copyright © McDougal Littell/Houghton Mifflin Company Words to Review • Algebra 2 C&S Notetaking Guide 47<br />
x