Air to Air Refuelling in Civil Aviation, An Opportunity & A Vision Dr ...
Air to Air Refuelling in Civil Aviation, An Opportunity & A Vision Dr ...
Air to Air Refuelling in Civil Aviation, An Opportunity & A Vision Dr ...

Create successful ePaper yourself
Turn your PDF publications into a flip-book with our unique Google optimized e-Paper software.
RAeS Conference “Greener By Design” Conference<br />
“<strong>Aviation</strong> & the Environment, Where Are We Go<strong>in</strong>g”, London, 7 th Paper 9<br />
Oc<strong>to</strong>ber 2008<br />
<strong>Air</strong> <strong>to</strong> <strong>Air</strong> <strong>Refuell<strong>in</strong>g</strong> <strong>in</strong> <strong>Civil</strong> <strong>Aviation</strong>, <strong>An</strong> <strong>Opportunity</strong> & A <strong>Vision</strong><br />
<strong>Dr</strong>. R. K. Nangia<br />
BSc, PhD, CEng, AFAIAA, FRAeS<br />
Consult<strong>in</strong>g Eng<strong>in</strong>eer, Nangia Aero Research Associates<br />
WestPo<strong>in</strong>t, 78-Queens Road, BRISTOL, BS8 1QX, UK.<br />
SUMMARY<br />
Over the last 70 years, the civil aviation <strong>in</strong>dustry has focussed on a growth model: upwards, bigger,<br />
farther and faster on an economic productivity basis. With awareness of environmental issues, noise,<br />
emissions and energy / fossil fuel reserves, there is an awaken<strong>in</strong>g for explor<strong>in</strong>g ways <strong>to</strong> improve fuel<br />
efficiency. ACARE & NASA objectives call for challeng<strong>in</strong>g 50 <strong>to</strong> 80% improvements over next 20 years.<br />
As technology matures, the evolutionary ways are yield<strong>in</strong>g improvements at a very slow rate. Operational<br />
strategies need <strong>to</strong> be exploited e.g. stag<strong>in</strong>g, <strong>Air</strong>-<strong>to</strong>-<strong>Air</strong> <strong>Refuell<strong>in</strong>g</strong> (AAR), Close Formation Fly<strong>in</strong>g (CFF).<br />
This paper is concerned with AAR. It reviews the related previous work e.g. on a new set of efficiency<br />
metrics that allow a “unified” consistent efficiency theme relat<strong>in</strong>g Payload, Range, Fuel consumed.<br />
Smaller range aircraft need <strong>to</strong> be used for AAR and these imply 30 – 40% benefits <strong>in</strong> fuel usage.<br />
Assum<strong>in</strong>g fuel at $4.70/USG, the sav<strong>in</strong>gs estimates with AAR are remarkable: $175/pax for 6000nm and<br />
$320/pax for 9000nm. These translate <strong>to</strong> sav<strong>in</strong>gs $25 million per aircraft per year on long-range routes.<br />
The ma<strong>in</strong> focus is then on the consequences of adopt<strong>in</strong>g AAR. Several other features and synergistic<br />
benefits arise. The benefits afforded by AAR appear an order greater than, and <strong>in</strong> addition <strong>to</strong>, those<br />
achieved by current technology evolution. Next stage is AAR demonstration <strong>in</strong> civil context!<br />
1. INTRODUCTION<br />
Early civil jet aircraft were designed for moderate<br />
ranges with stag<strong>in</strong>g be<strong>in</strong>g the norm for long ranges.<br />
The later models of the B707 series with trans-<br />
Atlantic capabilities set the scene for achiev<strong>in</strong>g<br />
records for travell<strong>in</strong>g further, faster or higher, <strong>in</strong><br />
productivity terms (Refs.1-2). Although fuel was<br />
relatively cheap, there were still <strong>in</strong>centives <strong>to</strong><br />
produce structurally efficient aircraft <strong>to</strong> enable long<br />
ranges with adequate payloads. As a result, aircraft<br />
such as the B747 and MD 10/11 were produced.<br />
As oil resources decl<strong>in</strong>e <strong>in</strong> the long run, there is<br />
a stronger <strong>in</strong>centive <strong>to</strong> reduce fuel consumption.<br />
This assumes that current trends of air travel will be<br />
ma<strong>in</strong>ta<strong>in</strong>ed. Together with environmental concerns,<br />
this has prompted a shift <strong>in</strong> design philosophy.<br />
Whilst we strive <strong>to</strong> further improve aerodynamic<br />
and propulsive efficiency, alternative configurations<br />
and operat<strong>in</strong>g procedures need <strong>to</strong> be considered.<br />
Typical fuel burn rates for modern, efficient<br />
aircraft are of the order of 3 litres / 100 pax km (67<br />
pax miles / USG). The earlier B707-320B could<br />
carry 189 pax over a range of 4540 nm (4.6 litres /<br />
100 pax km). Derivatives of the B707 airframe are<br />
<strong>in</strong> service <strong>to</strong>day, typically as the KC-135 and cargo<br />
versions. Currently, the B747-400 can carry 420<br />
pax over 6750 nm (3.5 litres / 100 pax km). It is<br />
<strong>in</strong>terest<strong>in</strong>g <strong>to</strong> note that with more efficient eng<strong>in</strong>es<br />
the fuel burn rate of the B707 could approach that<br />
of the B747. With the <strong>in</strong>troduction of AAR <strong>in</strong><strong>to</strong><br />
civil operations, even old aircraft such as the B707<br />
could offer a competitive or better fuel burn rate<br />
than current long-range aircraft (see later).<br />
1<br />
<strong>Aviation</strong> Contribution <strong>to</strong> Environmental<br />
Concerns / Awareness<br />
There is an ever-<strong>in</strong>creas<strong>in</strong>g knowledge base on<br />
environmental concerns from civil aviation (see<br />
Refs.3-6). In the nature of such matters, not all<br />
<strong>in</strong>formation is necessarily robust or fully<br />
substantiated. We briefly mention typical facets.<br />
In general, aircraft emissions are a small<br />
proportion of the overall scene, but these are<br />
grow<strong>in</strong>g <strong>in</strong> absolute terms. CO2 and non-CO2<br />
dist<strong>in</strong>ctions have <strong>to</strong> be made.<br />
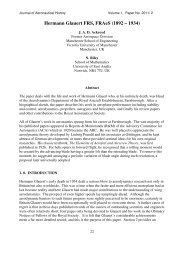
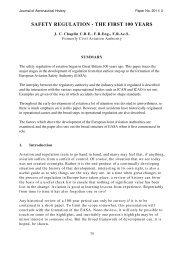
Fig.1 shows CO2 Emissions from Transport. In<br />
1990 transport was responsible for 14% <strong>to</strong> 16% of<br />
the world <strong>to</strong>tal CO2 emissions (IPCC, 1999). Of the<br />
transport contribution, 70% was attributable <strong>to</strong> road<br />
vehicles (heavy and light duty), 12% <strong>to</strong> maritime,<br />
10% <strong>to</strong> aviation and 8% <strong>to</strong> rail and <strong>in</strong>land water<br />
transport. By 2000 (Stern Report 2006) the transport<br />
contribution <strong>to</strong> world CO2 emissions rema<strong>in</strong>ed at<br />
about 14%. Of this, the <strong>Aviation</strong> contribution had<br />
risen <strong>to</strong> 12% i.e. 1.7% of World emissions.<br />
A research l<strong>in</strong>e is that currently CO2 levels are 3<br />
terra-<strong>to</strong>nnes <strong>in</strong> the Earth’s atmosphere of 5140<br />
terra-<strong>to</strong>nnes (582 parts per million by mass). A<br />
thought is that by 2050, these may be capped at 4<br />
Terra-<strong>to</strong>nnes imply<strong>in</strong>g a 2°C rise <strong>in</strong> Earth’s average<br />
temperature. <strong>Aviation</strong> is expected <strong>to</strong> contribute 4-<br />
5% of the <strong>to</strong>tal CO2 levels. The arguments get<br />
<strong>in</strong>volved as short/ long life CO2 have <strong>to</strong> be specified<br />
and we shall leave that for scientists <strong>to</strong> advise us.<br />
The non-CO2 effects are important and may be<br />
more harmful. These comprise: CH4, NOX,<br />
Contrails and Ozone changes. Currently, progress is<br />
be<strong>in</strong>g made by the OMEGA community <strong>in</strong> the UK<br />
<strong>to</strong> understand and quantify the implications.<br />
© Copyright, <strong>Dr</strong> R.K. Nangia 2008. All Rights Reserved. Published by RAeS with Permission
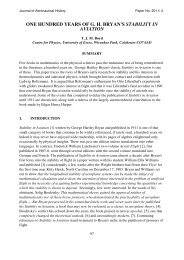
Fig.2 shows Fuel Usage (USG per 100 pax mile)<br />
aga<strong>in</strong>st Load Fac<strong>to</strong>rs <strong>in</strong> various forms of transport<br />
(based on Boe<strong>in</strong>g Studies). In this <strong>in</strong>terest<strong>in</strong>g graph,<br />
we note several significant trends. For all forms of<br />
transport, fuel consumption reduces dramatically up<br />
<strong>to</strong> 50% load fac<strong>to</strong>r. Beyond this value, fuel<br />
consumption cont<strong>in</strong>ues <strong>to</strong> fall but at a lower rate.<br />
European Inter-City tra<strong>in</strong> is the most fuel-efficient.<br />
High-speed tra<strong>in</strong>s have twice the fuel consumption.<br />
<strong>Air</strong> travel is comparable <strong>to</strong> the “Average” road<br />
vehicle. However, range for road and rail travel is<br />
limited by geographical and national boundaries. As<br />
expected, large SUV is <strong>in</strong>efficient <strong>in</strong> cities and<br />
<strong>to</strong>wns; load fac<strong>to</strong>rs are low 25 - 30%, for road<br />
vehicles. At typical load fac<strong>to</strong>rs of 70%, air travel<br />
has a fuel consumption rate comparable <strong>to</strong> highspeed<br />
tra<strong>in</strong>s at 50% typical load fac<strong>to</strong>r.<br />
Fig.3 shows the variation of fuel consumed per<br />
stage length as a fraction of the <strong>to</strong>tal fuel consumed<br />
(Ref.8). The figure also shows the variation of NOX<br />
produced per stage length as a fraction of the <strong>to</strong>tal<br />
produced. In general, the percentage NOX produced<br />
is equal <strong>to</strong> the percentage fuel consumed. NOX also<br />
depends on combustion temperature – more fuelefficient<br />
eng<strong>in</strong>es do not necessarily produce less<br />
NOX. At ranges less than 3000 km, NOX emissions<br />
are slightly less. The cumulative fuel burn is shown<br />
<strong>in</strong> Fig.4 (Ref.6). Majority of flight ranges are below<br />
6200nm. Currently 35% of air transport fuel is spent<br />
on flights above ranges of 3000nm. In future,<br />
budget airl<strong>in</strong>es may fly long ranges shift<strong>in</strong>g the<br />
balance <strong>to</strong> 50% with a 7.5% sw<strong>in</strong>g! The <strong>in</strong>dustry<br />
cont<strong>in</strong>ues <strong>to</strong> offer aircraft with 9000+ nm ranges.<br />
2. EFFICIENCY ISSUES AND METRICS<br />
2.1. Payload Range Efficiency<br />
Us<strong>in</strong>g standard texts, e.g. Refs.7-8, we beg<strong>in</strong><br />
with the range parameter X = V L/D / SFC<br />
The Breguet Equation <strong>in</strong> terms of Range R is:<br />
Z = R/X = loge [W1 / (W2] where W1 and W2<br />
signify the weights at start and end of cruise.<br />
W2 = W1 - WFBC where WFBC is the weight of<br />
the Fuel burnt dur<strong>in</strong>g cruise.<br />
W1 = MTOW - WFBS where MTOW is Take-Off<br />
weight and WFBS refers <strong>to</strong> the Fuel used for takeoff<br />
and manoeuvr<strong>in</strong>g additional <strong>to</strong> the cruise. This is<br />
about 2.2% MTOW (Ref.5).<br />
Total Block fuel is then WFB = WFBC + WFBS.<br />
A measure of aircraft efficiency is Payload Range<br />
Efficiency (PRE): See Refs.9-10.<br />
PRE = WP . R/WFB (Payload x Range/ Block Fuel ).<br />
The non-dimensional convenient form is PRE/X.<br />
From this we can derive Nangia Value efficiency<br />
parameters, Ref.10.<br />
VEOPX = (PRE/X) / (OEW/WP) = (PRE/X) (WP/OEW)<br />
VEMPX = (PRE/X) / (MTOW/WP) = (PRE/X) (WP/MTOW).<br />
VEOPX denotes the Payload Range and Fuel<br />
efficiency per structure weight per unit payload. It<br />
can be related <strong>to</strong> the purchase cost per unit payload.<br />
It also serves as a measure of approach and land<strong>in</strong>g<br />
noise. Higher values are better for lower structure<br />
weight, costs (acquisition and operat<strong>in</strong>g) and<br />
land<strong>in</strong>g noise. VEMPX denotes the Payload Range<br />
and fuel efficiency per <strong>to</strong>tal weight per unit<br />
2<br />
payload. It serves as a measure of take-off noise,<br />
emissions and hence, airport and environmental fees<br />
that may be <strong>in</strong>curred. Higher values are better for<br />
lower noise emissions and operat<strong>in</strong>g costs.<br />
Nangia (Ref.10) conducted an analysis on<br />
modern civil (jet) aircraft, dist<strong>in</strong>guish<strong>in</strong>g between<br />
maximum payload and design passenger payload<br />
(Po<strong>in</strong>ts A and D), as well as <strong>in</strong>clud<strong>in</strong>g fuel reserves.<br />
Fig.5(a-c) compares payload-range characteristics<br />
for three aircraft: a long range, large B747-400, a<br />
moderate range B757-200 and an older generation<br />
B707-320B. The Range parameters vary widely<br />
(highest for the B747). Note the differences<br />
between the usual <strong>in</strong>terpretation <strong>in</strong> (a) and the nondimensional<br />
<strong>in</strong>terpretation <strong>in</strong> terms of WP/MTOW<br />
vs Z = R/X <strong>in</strong> (b-c). L<strong>in</strong>es of PRE/X are also<br />
shown. The non-D representation is clearly more<br />
descriptive <strong>in</strong> terms of efficiency.<br />
The B757 turns out <strong>to</strong> be more fuel efficient at<br />
Pts A and D than the other two aircraft. There are<br />
other useful <strong>in</strong>terpretations. For example a combi<br />
B747 (carry<strong>in</strong>g full complement of passengers and<br />
cargo, Pt A) will be nearly as efficient as a B757<br />
operat<strong>in</strong>g at Pt D. However, the B747 can operate<br />
over longer ranges. The B757 <strong>in</strong> combi mode (Pt A)<br />
will be more efficient than a B747. Increases <strong>in</strong> X<br />
will result <strong>in</strong> correspond<strong>in</strong>g <strong>in</strong>creases <strong>in</strong> the Payload<br />
- Range capabilities <strong>in</strong> dimensional terms.<br />
Such data on various current and near-future<br />
aircraft has been analysed with cross-plots <strong>to</strong> help <strong>in</strong><br />
understand<strong>in</strong>g and establish<strong>in</strong>g credibility.<br />
The ratios, with respect <strong>to</strong> MTOW, of the ma<strong>in</strong><br />
weight variables (OEW, WFB and WP) are plotted<br />
aga<strong>in</strong>st Range R <strong>in</strong> Fig.6 for Pt D. For a given<br />
aircraft, Pt A range is shorter than that for Pt D.<br />
Fig.7 shows fuel reserves as a proportion of the<br />
payload at Pts A and D. Note the remarkably large<br />
values required for the longer range aircraft. For<br />
9000nm flight, the reserves amount <strong>to</strong> 70% of the Pt<br />
D payload. In contrast, for a 3000nm aircraft, the<br />
reserves are less than 20% of the payload.<br />
Such ratios have been correlated <strong>in</strong><strong>to</strong> reliable<br />
“first-order” non-dimensional trends <strong>in</strong> terms of<br />
PRE/X and Z. Figs.8-9 summarise the WFB/WP<br />
and PRE/X trends, dist<strong>in</strong>guish<strong>in</strong>g between A and D<br />
po<strong>in</strong>t operations. Radial l<strong>in</strong>es of constant WFB/WP<br />
are shown. In fuel efficiency terms, aircraft perform<br />
better at Pt. A and the optimum design range is<br />
about 2500 - 3500nm, depend<strong>in</strong>g on the aircraft<br />
range parameter X. From practical size and range<br />
considerations, Pt A curves extend <strong>to</strong> Z near 0.4.<br />
Fig.10 shows VEOPX and VEMPX correlations<br />
with Z us<strong>in</strong>g po<strong>in</strong>t D values. Note that the shortrange<br />
aircraft are strongly favoured.<br />
Often, aircraft do not fly at full capacity<br />
(passengers and/or cargo), <strong>in</strong>troduc<strong>in</strong>g penalties.<br />
2.2. Interpretation of the Metrics<br />
For long ranges, the take off fuel (eng<strong>in</strong>e start <strong>to</strong><br />
end of climb) is a relatively small fraction of the<br />
<strong>to</strong>tal fuel consumed. At short ranges (limited cruise<br />
duration), the take-off fuel is a significant<br />
proportion of the <strong>to</strong>tal fuel consumed. These effects<br />
give a non-l<strong>in</strong>ear nature <strong>to</strong> the trends.<br />
Peak efficiency is achieved for aircraft designed<br />
for about 3000 nm range. For longer ranges the
efficiencies drop off markedly. The high efficiency<br />
of the short range aircraft can be ma<strong>in</strong>ta<strong>in</strong>ed over<br />
the longer ranges us<strong>in</strong>g AAR.<br />
Reserve fuel policies vary between regula<strong>to</strong>ry<br />
bodies, domestic / International flights, airl<strong>in</strong>es and<br />
pilots. Pilots may opt for extra reserve fuel over and<br />
above that required by relevant regulations.<br />
Typical average values for X are 15000+ nm.<br />
The current trend is for ever-larger more<br />
powerful eng<strong>in</strong>es. Naturally, the emphasis is on<br />
<strong>in</strong>creas<strong>in</strong>g fuel efficiency for the larger units. Some<br />
of the favourable design developments can be<br />
scaled for smaller eng<strong>in</strong>es, fuel efficiencies are<br />
relatively less for the latter. Geared fans may help.<br />
The development of Prop fans may result <strong>in</strong><br />
quieter and more fuel-efficient power-plants. The<br />
effects on X values due <strong>to</strong> the result<strong>in</strong>g changes <strong>in</strong><br />
V and SFC need <strong>to</strong> be assessed.<br />
3. AIR-TO-AIR REFUELLING (AAR),<br />
CIVIL AIRCRAFT<br />
3.1. Compar<strong>in</strong>g 3000, 6000, 9000 & 12000 nm<br />
Range <strong>Air</strong>craft with and without AAR<br />
Based on Refs.8, 11 & 12, the approach is <strong>to</strong><br />
design representative aircraft <strong>to</strong> carry the same<br />
payload of 250 pax. over 3000, 6000, 9000 & 12000<br />
nm and then estimate the fuel saved by us<strong>in</strong>g the<br />
base 3000 nm range aircraft with AAR for the<br />
longer ranges. The base aircraft requires less than<br />
50,000 lbs of fuel per 3000 nm stage, dispensed<br />
fairly easily from current tankers, provided the<br />
operational tanker range is kept low. Each tanker<br />
may accomplish 3-4 operations <strong>in</strong> a mission.<br />
The relative sizes of the aircraft designed for 250<br />
passengers over the different ranges are compared<br />
<strong>in</strong> Fig.11. The fuselage size rema<strong>in</strong>s constant, the<br />
w<strong>in</strong>g area <strong>in</strong>creases rapidly <strong>to</strong> conta<strong>in</strong> fuel needed<br />
and <strong>to</strong> ma<strong>in</strong>ta<strong>in</strong> CL as design range <strong>in</strong>creases.<br />
The base aircraft weight variation over 3000 nm<br />
is shown <strong>in</strong> Fig. 12. The block fuel used <strong>to</strong> carry<br />
250 pax over this range is 46,147 lb (MTOW =<br />
261,932 lb). <strong>An</strong> aircraft designed <strong>to</strong> carry the same<br />
payload over 6000 nm, Fig. 13, uses 161,269 lb fuel<br />
(doubl<strong>in</strong>g the range has more than trebled the fuel<br />
required, MTOW = 505,438 lb). The <strong>in</strong>creased fuel,<br />
over and above that required for the doubled range,<br />
is needed for the additional aircraft weight. This<br />
arises from land<strong>in</strong>g gear / w<strong>in</strong>g structure required <strong>to</strong><br />
carry the additional fuel weight and provide the<br />
extra tank volume. Fig. 13 also compares the weight<br />
variations with range for the 6000 nm aircraft and<br />
the 3000 nm aircraft refuelled at 3000 nm. Note the<br />
fuel used and the sav<strong>in</strong>gs offered by AAR, 42%<br />
over 6000 nm (not <strong>in</strong>clud<strong>in</strong>g tanker fuel at this<br />
stage). This amounts <strong>to</strong> sav<strong>in</strong>g <strong>in</strong> fuel cost of nearly<br />
$190/pax (at $4.7/USG). With an allowance of<br />
tanker fuel, the comparable figure is about $175.<br />
Fig. 14 refers <strong>to</strong> the weight variations for 9000<br />
nm range (250 pax). <strong>An</strong> aircraft without a refuell<strong>in</strong>g<br />
option would have MTOW of 656,262 lb, and burn<br />
263,073 lb of fuel. With the 3000 nm aircraft and<br />
two AAR operations, the block fuel would be<br />
138,441 lb, a sav<strong>in</strong>g of 47% (without tanker fuel).<br />
This amounts <strong>to</strong> sav<strong>in</strong>g <strong>in</strong> fuel cost of nearly<br />
3<br />
$350/pax (at $4.7/USG). Allow<strong>in</strong>g for the tanker<br />
fuel, the comparable figure is about $320.<br />
3.2. Size. Cost & Noise Reductions Us<strong>in</strong>g Smaller<br />
<strong>Air</strong>craft<br />
Even with current technology levels, us<strong>in</strong>g the<br />
3000nm aircraft for all long ranges with AAR<br />
implies not just size reduction but also associated<br />
reductions <strong>in</strong> noise, cost, emissions, etc. We look<br />
briefly at aircraft siz<strong>in</strong>g, cost and noise trends.<br />
Fig.15 shows the span correlation aga<strong>in</strong>st<br />
MTOW for several current aircraft (www.Boe<strong>in</strong>g).<br />
Ideally, w<strong>in</strong>g Aspect Ratio and hence span should<br />
be as large as possible for aerodynamic benefits.<br />
For larger design payloads and ranges, the size and<br />
span are subject <strong>to</strong> physical / structural / airport gate<br />
limits (e,g. ICAO).<br />
Fig.16 shows the acquisition cost trend aga<strong>in</strong>st<br />
OEW (l<strong>in</strong>es C1 & C2 represent the lower and<br />
higher quoted costs). Fig.16 shows an approximate<br />
correlation aga<strong>in</strong>st range. Such trends reflect the<br />
economic situations (supply, demand, numbers built<br />
etc.) and may be somewhat hypothetical. Essentially<br />
large aircraft cost more.<br />
Fig 18 shows ICAO Stage 3 noise certification<br />
limits. Lighter aircraft have more str<strong>in</strong>gent noise<br />
requirements than heavier aircraft. In any case,<br />
smaller aircraft do tend <strong>to</strong> be quieter because of less<br />
<strong>in</strong>stalled thrust.<br />
By us<strong>in</strong>g smaller, 3000 nm range aircraft with<br />
AAR, the <strong>in</strong>creases <strong>in</strong> costs, noise and pollution<br />
associated with long-range flights can be avoided.<br />
3.3. Cruise Climb or Constant Altitude Flight<br />
It is useful <strong>to</strong> exam<strong>in</strong>e the cruise and altitude<br />
relationships with the different range aircraft.<br />
<strong>Air</strong>craft w<strong>in</strong>gs are optimised for cruise at a<br />
constant CL value of about 0.55. Assum<strong>in</strong>g start of<br />
cruise at 28,000 ft, if CL and M are held constant the<br />
3000nm aircraft would climb <strong>to</strong> 32,000ft dur<strong>in</strong>g the<br />
cruise phase. The 6000 nm aircraft climbs <strong>to</strong> about<br />
36,000ft and the 9000nm aircraft will reach<br />
39,000ft, see Fig.19.<br />
<strong>Air</strong> traffic control requires 2000 ft vertical<br />
separation between aircraft and consequently<br />
aircraft fly at constant stepped altitudes. Decreases<br />
<strong>in</strong> CL, (<strong>in</strong> spite of L/D reduction) are accompanied<br />
by a reduction <strong>in</strong> drag and thrust required. So the<br />
compromises are lessened.<br />
The long-range aircraft undergo the greatest<br />
change <strong>in</strong> altitude dur<strong>in</strong>g cruise. The fuselage has <strong>to</strong><br />
withstand an <strong>in</strong>creased pressure differential with<br />
obvious implications on stress, fatigue and <strong>in</strong>itial<br />
design weight. Short-range aircraft are naturally<br />
better balanced for altitude effects and these could<br />
be ma<strong>in</strong>ta<strong>in</strong>ed over long ranges with AAR.<br />
At constant CL, simple estimates <strong>in</strong>dicate a 2%<br />
degradation <strong>in</strong> L/D dur<strong>in</strong>g cruise for a 3000 nm<br />
range aircraft. For 6000 and 9000 nm range aircraft<br />
the degradation is of the order of 7% and 12%<br />
respectively. With 3000 nm aircraft and AAR on<br />
the long ranges, the L/D degradations can be small.<br />
With variable camber, constant CL need not be<br />
ma<strong>in</strong>ta<strong>in</strong>ed and altitude relationship become easier.<br />
3.4. Fuel Burn & Operat<strong>in</strong>g Costs Issues<br />
The variations of fuel burn and costs with design<br />
range are summarised <strong>in</strong> Fig.20. The projected fuel
urn trend us<strong>in</strong>g the 3000 nm aircraft and AAR <strong>to</strong><br />
complete the longer ranges is also shown. The fuel<br />
sav<strong>in</strong>gs with AAR can be deduced and converted<br />
<strong>in</strong><strong>to</strong> costs and economics.<br />
Oil prices rema<strong>in</strong> volatile. Fig.21 shows the fuel<br />
cost escalation (Ref. Moody, IATA & Ref.13).<br />
There has been 5.5 fold <strong>in</strong>crease <strong>in</strong> the last 4 years.<br />
Fig.22 shows the impact of doubl<strong>in</strong>g fuel costs<br />
($1.74 <strong>to</strong> $3.48 /USG) on Cash Operat<strong>in</strong>g Costs<br />
(COC) of B737 and B777 series of aircraft (Ref.14-<br />
15). This data has been super-imposed on the DOC<br />
data obta<strong>in</strong>ed from prelim<strong>in</strong>ary analyses of fuel cost<br />
us<strong>in</strong>g the 3000, 6000 and 9000nm aircraft, Fig.23.<br />
Note the rapid <strong>in</strong>crease <strong>in</strong> fuel cost proportion as<br />
fuel cost rises. For the B737, a doubl<strong>in</strong>g of fuel cost<br />
<strong>in</strong>creases the fuel cost fraction from 36% <strong>to</strong> 55% of<br />
the <strong>to</strong>tal COC. For the B777, the fuel cost fraction<br />
of COC would rise from 44% <strong>to</strong> 65%. Note the very<br />
strong leverage on cost sav<strong>in</strong>g percentages as fuel<br />
cost <strong>in</strong>creases. As fuel costs rise still further, the<br />
percentage overall costs sav<strong>in</strong>gs that can be<br />
achieved by reduc<strong>in</strong>g fuel burn (most effectively<br />
with AAR) will rise significantly.<br />
Overall the cost issues are a “form of art rather<br />
than science” and rema<strong>in</strong> subject <strong>to</strong> further<br />
scrut<strong>in</strong>y. <strong>An</strong> A320 (2500 - 3000 nm range) costs<br />
about $6000 per hour and an A330 (4500 nm range)<br />
would be about double that. Operat<strong>in</strong>g costs and<br />
productivity vary widely with range and airl<strong>in</strong>es.<br />
4. TANKERS, AAR & EFFICIENCY<br />
It is opportune <strong>to</strong> mention our previous work <strong>in</strong><br />
Refs.16-24. These also <strong>in</strong>clude Close Formation<br />
Fly<strong>in</strong>g (CFF). Some new <strong>in</strong>terpretations arise with<br />
respect <strong>to</strong> AAR.<br />
4.1. AAR Tanker Fuel Off-load Capability and<br />
Effect on Operation Fuel Efficiency<br />
A key po<strong>in</strong>t is that tankers for civil work would<br />
operate differently from military tankers. The latter,<br />
essentially, operate as a “garage <strong>in</strong> the sky”, with<br />
long endurance. The civil tankers will be more<br />
“purposeful” and shorter efficient flights are<br />
envisaged with flights planned <strong>to</strong> rendezvous with<br />
pass<strong>in</strong>g civil airl<strong>in</strong>ers, Fig. 24.<br />
We need <strong>to</strong> take <strong>in</strong><strong>to</strong> account the fuel consumed<br />
by the tanker itself dur<strong>in</strong>g AAR operations. Fig.25<br />
(Ref.12) shows the fuel sav<strong>in</strong>g (%) achieved by<br />
us<strong>in</strong>g a 3000 nm design, with AAR, over aircraft<br />
specifically designed for the 6000, 9000 and 12000<br />
nm ranges, all carry<strong>in</strong>g the same payload. It is<br />
<strong>in</strong>terest<strong>in</strong>g <strong>to</strong> note that we beg<strong>in</strong> <strong>to</strong> make fuel<br />
sav<strong>in</strong>gs with RT (ratio of fuel given <strong>to</strong> that used by<br />
the tanker) slightly less than 1 and beyond. For RT<br />
values about 3, we are close <strong>to</strong> be<strong>in</strong>g with<strong>in</strong> 5 - 7%<br />
of the max. benefit obta<strong>in</strong>able. We need <strong>to</strong> further<br />
study design ranges between 3000 – 6000nm.<br />
All this implies that reasonably efficient tank<strong>in</strong>g,<br />
with RT near 4, should be adequate. Although more<br />
efficient tank<strong>in</strong>g will help <strong>in</strong> terms of costs and<br />
operations, the enormous <strong>in</strong>centives offered <strong>in</strong> the<br />
short term do not require extensive advances <strong>in</strong><br />
tanker design. Tankers currently available will<br />
allow significant fuel sav<strong>in</strong>gs <strong>to</strong> be made for<br />
refuell<strong>in</strong>g over long ranges.<br />
4<br />
It is <strong>in</strong>terest<strong>in</strong>g <strong>to</strong> note from Fig. 26, the <strong>in</strong>crease<br />
<strong>in</strong> PRE/X achieved by the refuelled 3000 nm design<br />
aircraft over the PRE/X achieved by the designed<br />
longer range aircraft, expressed as a percentage of<br />
the PRE/X achieved by the respective long-range<br />
aircraft. The improvements are large and higher for<br />
the longer range situations. For a “reasonable” RT<br />
value of 4, we are <strong>to</strong>uch<strong>in</strong>g ga<strong>in</strong>s <strong>in</strong> PRE/X of 60%<br />
for 6000nm and 80% for 9000nm ranges, compared<br />
with the datum 3000 nm aircraft.<br />
4.2. Benefits of AAR, Price, Thrust, Noise &<br />
<strong>Air</strong>ports<br />
Fig.27 shows the effect of fuel price on sav<strong>in</strong>gs<br />
<strong>in</strong> costs us<strong>in</strong>g the 3000nm aircraft for journeys of<br />
6000 and 9000nm. It is <strong>in</strong>terest<strong>in</strong>g <strong>to</strong> note that once<br />
civil AAR is <strong>in</strong> place and cost sav<strong>in</strong>gs of say 26%<br />
(6000 nm range) and 37% (9000 nm range) are<br />
achieved, further fuel price <strong>in</strong>creases will ma<strong>in</strong>ta<strong>in</strong><br />
and possibly <strong>in</strong>crease these costs sav<strong>in</strong>gs.<br />
The variation of <strong>to</strong>tal thrust required for specific<br />
aircraft designs with range is shown <strong>in</strong> Fig.28. We<br />
note immediately that with AAR, the basic 3000 nm<br />
aircraft can operate all ranges with a constant<br />
maximum thrust available of 88,000 lb. The aircraft<br />
designed for 9000 nm requires <strong>to</strong>tal thrust of<br />
219,000 lb. The 3000 nm aircraft requires 60% less<br />
thrust. The sav<strong>in</strong>gs <strong>in</strong> eng<strong>in</strong>e size, cost and noise<br />
emissions are evident.<br />
Further reductions <strong>in</strong> take-off noise can be<br />
achieved if the aircraft takes-off very light, with<br />
only sufficient fuel on board <strong>to</strong> fly <strong>to</strong> an <strong>in</strong>itial AAR<br />
rendezvous. The aircraft would then receive more<br />
fuel <strong>to</strong> complete the first leg <strong>to</strong> the next AAR<br />
rendezvous. <strong>An</strong> additional safety advantage is that<br />
dur<strong>in</strong>g the most dangerous phase of any flight (takeoff)<br />
the aircraft is now carry<strong>in</strong>g m<strong>in</strong>imal fuel.<br />
Reductions <strong>in</strong> take-off noise would allow<br />
extended night time operations at most major<br />
airports (reliev<strong>in</strong>g congestion etc.). If the aircraft<br />
take-off lighter, then de-rated eng<strong>in</strong>e operation is<br />
possible. This will enable a prolong<strong>in</strong>g of aircraft<br />
life, <strong>in</strong>troduc<strong>in</strong>g further DOC reductions.<br />
Further expansion of large hub airports may not<br />
be necessary, as regional airports would now be<br />
capable of provid<strong>in</strong>g long haul services. Expensive<br />
airport developments, runway lengthen<strong>in</strong>g for larger<br />
planned aircraft and additional runways for<br />
<strong>in</strong>creased traffic can be diverted from the Hubs <strong>to</strong><br />
the Regional airports.<br />
4.3. Part Range Refuels & Maximum Pt A<br />
Payload<br />
We have taken as examples the B757-300<br />
(MTOW 270,000 lb) and the A330-200 (MTOW<br />
507,065 lb) <strong>to</strong> assess the effect of part-range<br />
refuell<strong>in</strong>g, fly<strong>in</strong>g with maximum Po<strong>in</strong>t A payload,<br />
maximum efficiency.<br />
The B757-300 could transport its maximum<br />
payload of 68,200 lb over a range of 2388 nm<br />
(Po<strong>in</strong>t A operation) without refuell<strong>in</strong>g. A typical<br />
weight breakdown is shown <strong>in</strong> Fig. 29(a). Fig.<br />
29(b, c & d) shows the weight breakdown start<strong>in</strong>g<br />
off with different take-off weights (Light,<br />
Intermediate and MTOW) and a s<strong>in</strong>gle refuel of<br />
47,850 lb (WFREF) at the respective ranges<br />
completed. After AAR the aircraft are at MTOW
and can complete a further 2388 nm as shown. Fig.<br />
29(e & f) shows the weight breakdown start<strong>in</strong>g off<br />
at MTOW and then refuell<strong>in</strong>g after 2388 nm with<br />
either 10% or 50% WFREF.<br />
The A330-200 could transport its maximum<br />
payload of 106,800 lb over a range of 4200 nm<br />
(Po<strong>in</strong>t A operation) without refuell<strong>in</strong>g. Fig. 30(a)<br />
shows typical weight breakdown. The above<br />
exercise is repeated for the A330-200 <strong>in</strong> Fig. 30(bf).<br />
WFREF is 113,730 lb.<br />
Fig. 31 shows the PRE / X - Z relationships for<br />
both the A330-200 and the B757-200 with AAR.<br />
For each aircraft, the lower l<strong>in</strong>e results from tak<strong>in</strong>g<br />
off at less than MTOW and then refuell<strong>in</strong>g with<br />
100% WFREF. The upper l<strong>in</strong>e results from take-off<br />
at MTOW and then refuell<strong>in</strong>g with various fractions<br />
of WFREF. Note the improvements are very<br />
substantial compared with the current PRE/X trends<br />
for Pt A and Pt D. Further work is needed on<br />
different types.<br />
4.4. Effects of AAR on Environment, <strong>Air</strong>l<strong>in</strong>es,<br />
<strong>Air</strong>ports, ATC and Design<br />
With global acceptance of AAR, greater use will<br />
be made of medium size civil aircraft <strong>in</strong> the 250<br />
pax, 3000nm range category. This will serve all<br />
medium and long-haul operations. There will be<br />
less need for very large long-range aircraft. The<br />
knock-on effects will multiply, affect<strong>in</strong>g every<br />
aviation aspect positively. Complexities also arise.<br />
Environment<br />
<strong>Aviation</strong> fuel reduces - obvious global benefits.<br />
For <strong>Air</strong>l<strong>in</strong>es<br />
Fuel costs <strong>to</strong> the airl<strong>in</strong>e will reduce.<br />
Fleet opera<strong>to</strong>rs and airl<strong>in</strong>es will benefit from a<br />
uniformity of aircraft type. This will improve<br />
ma<strong>in</strong>tenance standards and reduce costs. Crew<br />
(flight and cab<strong>in</strong>) tra<strong>in</strong><strong>in</strong>g costs will be reduced.<br />
Purchas<strong>in</strong>g large numbers of smaller aircraft<br />
should be more economical than purchas<strong>in</strong>g a few<br />
very large aircraft. The quantity of spare aircraft<br />
(ma<strong>in</strong>tenance, delays, diversions, etc) and spares <strong>in</strong><br />
general that is required for efficient daily operations<br />
can be reduced.<br />
It is unlikely that passenger or cargo trends will<br />
reduce <strong>in</strong> the future and therefore with 200 - 250<br />
seater aircraft operat<strong>in</strong>g <strong>in</strong>stead of 400 - 500 seater<br />
jumbos, additional flight crews will be required.<br />
The ratios of cab<strong>in</strong> crew and ancillary staff <strong>to</strong><br />
passengers will be ma<strong>in</strong>ta<strong>in</strong>ed (no appreciable<br />
changes <strong>in</strong> staff<strong>in</strong>g levels).<br />
<strong>Air</strong>ports, Regionals, Wakes, Night-time<br />
With Regional airports able <strong>to</strong> cope with a<br />
greater proportion of aircraft and passenger<br />
movements, pressure on the Hub airports will be<br />
reduced. Further expansion (additional and<br />
extended runways, additional or expanded<br />
term<strong>in</strong>als) at the large Hub airports will not be<br />
necessary. Congestion, <strong>in</strong> and around the Hub<br />
airports will be reduced mak<strong>in</strong>g them more<br />
convenient / attractive for passengers and freight.<br />
This will also impact on reduc<strong>in</strong>g emissions.<br />
The trail<strong>in</strong>g vortex strength K of an aircraft<br />
(elliptic load<strong>in</strong>g) is equal <strong>to</strong> 2/π CL cav. Assum<strong>in</strong>g<br />
similar values of CL for the conventional types, K<br />
becomes proportional <strong>to</strong> cav.<br />
5<br />
It is <strong>in</strong>terest<strong>in</strong>g <strong>to</strong> reflect on wake strength for<br />
different classes of aircraft. Concorde’s low speed<br />
CL was about 0.6 and its comb<strong>in</strong>ation with a large<br />
cav yielded a vortex strength very similar <strong>to</strong> that of<br />
the B747. The low aspect ratio (about 1.7)<br />
“encouraged” a strong dissipation rate <strong>in</strong> the wake.<br />
The separation of aircraft at take-off and land<strong>in</strong>g<br />
is dictated by the strength of the vortices shed by<br />
the previous (lead) aircraft. By utilis<strong>in</strong>g smaller 250<br />
seat, 3000 nm aircraft, separation times can be<br />
reduced afford<strong>in</strong>g a 50-70% <strong>in</strong>crease <strong>in</strong> actual<br />
aircraft movements at each airport. The vortices<br />
spread outwards <strong>in</strong> ground effect. Smaller aircraft<br />
imply weaker vortices and hence a reduced affect<br />
on adjacent runways. This will lead <strong>to</strong> a safer use of<br />
adjacent, parallel runways. Smaller aircraft beh<strong>in</strong>d a<br />
larger one still need longer separations.<br />
The smaller, lighter aircraft are quieter and this<br />
will allow an <strong>in</strong>crease <strong>in</strong> night-time activity. This<br />
will, aga<strong>in</strong>, reduce congestion at airports both <strong>in</strong> the<br />
air and on the ground. The possibility of aircraft<br />
tak<strong>in</strong>g-off with only a m<strong>in</strong>imum of fuel on board,<br />
sufficient for them <strong>to</strong> fly <strong>to</strong> an AAR rendezvous 250<br />
<strong>to</strong> 500 nm away or divert if necessary, will further<br />
reduce take-off noise and reduce pollution.<br />
ATC facilities<br />
Initially, as greater use is made of Regional<br />
airports, it is likely that ATC activities will reduce<br />
near the Hubs and <strong>in</strong>crease near the Regional<br />
airports. Overall, us<strong>in</strong>g smaller aircraft, ATC<br />
activity will <strong>in</strong>crease but local, high <strong>in</strong>tensity hotspots<br />
will be elim<strong>in</strong>ated result<strong>in</strong>g <strong>in</strong> a more uniform<br />
and safer level of activity.<br />
<strong>Air</strong>craft Design<br />
The current design philosophy is for an aircraft<br />
<strong>to</strong> be sized for a given payload over a certa<strong>in</strong> range<br />
with sufficient fuel and reserves. For long-range<br />
flight, the payload becomes a relatively small<br />
fraction, whilst the weight of fuel at take-off may<br />
<strong>to</strong>uch 50% of the <strong>to</strong>tal weight. The eng<strong>in</strong>es have <strong>to</strong><br />
be selected and rated accord<strong>in</strong>gly. Maximum thrust<br />
is required at take-off <strong>to</strong> accelerate the aircraft over<br />
a limited runway length and then climb <strong>to</strong> a safe<br />
height before throttl<strong>in</strong>g back. Dur<strong>in</strong>g the take-off<br />
phase the eng<strong>in</strong>es are often over-rated, a<br />
requirement that is “designed-<strong>in</strong>”. Effectively,<br />
current long-range aircraft have <strong>to</strong> be “overw<strong>in</strong>ged”<br />
and “over-powered”.<br />
With the knowledge that AAR is available,<br />
aircraft could be designed <strong>to</strong> take-off with m<strong>in</strong>imum<br />
fuel on board, sufficient <strong>to</strong> reach a first AAR<br />
rendezvous. The w<strong>in</strong>gs could be sized <strong>to</strong><br />
accommodate fuel tanks with the capacity for 3000<br />
nm cruise range fuel only, result<strong>in</strong>g <strong>in</strong> much smaller<br />
w<strong>in</strong>gs and a lighter design. The thrust required <strong>to</strong><br />
accelerate this smaller, lighter aircraft with<strong>in</strong><br />
exist<strong>in</strong>g runway lengths is significantly reduced.<br />
Smaller, lighter eng<strong>in</strong>es can therefore be specified.<br />
The requirement <strong>to</strong> over-rate the eng<strong>in</strong>es dur<strong>in</strong>g<br />
take-off and climb-out could be reduced or even<br />
elim<strong>in</strong>ated. The result is a much quieter take-off.<br />
Eng<strong>in</strong>e life can be extended.<br />
4.5. What is Demanded of the Tankers? – The<br />
Options
Fig. 32 shows possible options. Reverse tank<strong>in</strong>g<br />
(tanker beh<strong>in</strong>d the receiver) with boom and<br />
receptacle may well be the preferred option. The<br />
tanker aircraft will do all the position<strong>in</strong>g and control<br />
work whilst the receiver aircraft cont<strong>in</strong>ues on its<br />
way. There have been many recent advances <strong>in</strong><br />
AAR systems e.g. <strong>in</strong> differential GPS and<br />
au<strong>to</strong>nomous refuell<strong>in</strong>g, RARO, night vision etc. as<br />
mentioned <strong>in</strong> previous papers<br />
Fig. 33 shows various tanker capabilities (fuel<br />
off-load and radius) currently envisaged by the<br />
military. The civil <strong>in</strong>terest will be over a range of<br />
about 1000nm (radius 500nm).<br />
4.6. Phas<strong>in</strong>g <strong>in</strong> AAR<br />
This is related <strong>to</strong> the time and f<strong>in</strong>ances available.<br />
A worldwide network of bases for tanker operations<br />
can be envisaged. This would serve airl<strong>in</strong>es us<strong>in</strong>g<br />
3000 nm range aircraft equipped with AAR<br />
recep<strong>to</strong>rs. At present, opera<strong>to</strong>rs tend <strong>to</strong> fall <strong>in</strong><strong>to</strong><br />
various categories: Cargo, Passenger, Passenger and<br />
Cargo, Domestic (short haul), International (short<br />
and long haul), National (“Flag carriers”) and<br />
privately f<strong>in</strong>anced. Some diversity will exist with<br />
the <strong>in</strong>troduction of civil AAR. A small carrier,<br />
equipped with short <strong>to</strong> medium range aircraft, could<br />
buy-<strong>in</strong> AAR services and offer long-haul flights.<br />
The AAR services may operate along the same<br />
economic pr<strong>in</strong>ciples as airport and ATC services.<br />
Based on figures already <strong>in</strong>troduced, each<br />
tanker, <strong>in</strong> a day, can undertake 8 <strong>to</strong> 12 flights and<br />
service 20 <strong>to</strong> 30 aircraft. ICAO world airl<strong>in</strong>e data<br />
<strong>in</strong>dicated 1,672,000,000 passenger movements<br />
worldwide <strong>in</strong> 2000, <strong>to</strong>gether with 33,500,000 <strong>to</strong>nnes<br />
of cargo. We assume that 25% of the passenger and<br />
50% of the cargo departures were long haul (6000<br />
nm). Us<strong>in</strong>g our 3000 nm aircraft with AAR for<br />
these long haul operations we would need 3,260<br />
AAR operations daily. This equates <strong>to</strong> a global fleet<br />
of about 160 tankers. Such estimates can be further<br />
ref<strong>in</strong>ed <strong>in</strong> due course.<br />
The civil AAR operations will be phased <strong>in</strong> over<br />
a period of time. It would be prudent <strong>to</strong> commence<br />
with cargo aircraft <strong>to</strong> build up public confidence for<br />
accept<strong>in</strong>g the new procedures. Dur<strong>in</strong>g this<br />
<strong>in</strong>troduc<strong>to</strong>ry phase, AAR service suppliers would<br />
beg<strong>in</strong> <strong>to</strong> generate f<strong>in</strong>ances, thereby encourag<strong>in</strong>g<br />
f<strong>in</strong>ancial <strong>in</strong>terest.<br />
It is possible that a cargo carrier would seize the<br />
opportunity of provid<strong>in</strong>g the tanker services,<br />
especially if they already had operational /<br />
ma<strong>in</strong>tenance bases, strategically placed along the<br />
long-haul routes.<br />
The United States Transportation Command<br />
(USTRANSCOM) coord<strong>in</strong>ates the movement of<br />
materials and supplies worldwide for the US<br />
military. <strong>Air</strong>craft used for these operations <strong>in</strong>clude<br />
the C-5 and the C-17. Frequent use is made of AAR<br />
for the longer ranges. A proof of concept and <strong>in</strong>itial<br />
evaluation of AAR <strong>in</strong> civil aviation <strong>to</strong> reduce fuel<br />
consumption could be undertaken by the military.<br />
Market Forecasts<br />
Us<strong>in</strong>g the latest Boe<strong>in</strong>g Studies (Ref.15), one<br />
can conjecture with AAR, a change <strong>in</strong> the new<br />
deliveries at least, See Table 1. There is always<br />
6<br />
need for more detailed work <strong>in</strong>clud<strong>in</strong>g fuel sav<strong>in</strong>gs<br />
and costs!<br />
In the above forecasts for 2027, 3,890<br />
Freighters are <strong>in</strong>cluded. These comprise 35%<br />
standard body (80 <strong>to</strong>nnes).<br />
With AAR, the Tw<strong>in</strong>-Aisle aircraft needed will<br />
be the smaller range versions, either modified or<br />
new (more fuel efficient with <strong>in</strong>creased payloads,<br />
pax + cargo). These will affect the S<strong>in</strong>gle-aisle<br />
numbers also. About 200 Tankers will be added.<br />
_<br />
5. CASE STUDIES AND COST<br />
IMPLICATIONS<br />
We consider a set of scenarios as illustrated <strong>in</strong><br />
Fig.33. Depicted are possible routes (a, b and c) and<br />
tanker base locations.<br />
(a) Based at <strong>An</strong>chorage<br />
North America <strong>to</strong> Asia could utilise AAR<br />
operations based at <strong>An</strong>chorage. This is one of the<br />
busiest International air cargo airports, with 2.15<br />
Million Tonnes handled <strong>in</strong> 2005. This gives an idea<br />
of the scale of operations pass<strong>in</strong>g through / over<br />
<strong>An</strong>chorage. Typical distances are Tokyo <strong>to</strong><br />
<strong>An</strong>chorage, about 3000 nm and <strong>An</strong>chorage <strong>to</strong> New<br />
York, 2935 nm.<br />
(b) Europe <strong>to</strong> Australia<br />
This would allow an airl<strong>in</strong>er <strong>to</strong> depart, for<br />
example, from London with a full complement of<br />
passengers and freight and fly non-s<strong>to</strong>p <strong>to</strong> Sydney.<br />
It could take off us<strong>in</strong>g de-rated thrust, climb quickly<br />
<strong>to</strong> best cruis<strong>in</strong>g altitude and use AAR <strong>to</strong> achieve a<br />
direct flight. Avoid<strong>in</strong>g a technical s<strong>to</strong>p would help<br />
<strong>in</strong> potentially halv<strong>in</strong>g the life-cycle costs and<br />
extend<strong>in</strong>g its service life.<br />
This case follows the example of the 9000nm<br />
aircraft potentially sav<strong>in</strong>g 40% fuel.<br />
(c) US West Coast <strong>to</strong> Australia<br />
West coast USA <strong>to</strong> Australia could use the old<br />
“Fly<strong>in</strong>g Clipper” routes of PAA - Honolulu, Guam,<br />
Nadi, etc as tanker bases. Typical distances <strong>in</strong> this<br />
region are Los <strong>An</strong>geles <strong>to</strong> Honolulu, 2220 nm and<br />
Nadi <strong>to</strong> Sydney 1710 nm. The early “Fly<strong>in</strong>g<br />
Clippers” pioneered such routes.<br />
<strong>An</strong> Example with Freighters, B747F & B767F<br />
The B747-400F, operat<strong>in</strong>g close <strong>to</strong> Pt B<br />
(MTOW), can carry a payload of 123,000 lb over<br />
7,200 nm. At reduced TOW, it can carry twice that<br />
payload over 3600. The B767-300F, at Pt A, carries<br />
123,000 lb over 3,300 nm. Us<strong>in</strong>g various<br />
comb<strong>in</strong>ations of aircraft and payloads we note, <strong>in</strong><br />
Table 2, fuel sav<strong>in</strong>gs afforded by AAR. Tanker fuel<br />
has been taken <strong>in</strong><strong>to</strong> account, RT = 4.<br />
<strong>Refuell<strong>in</strong>g</strong> the B767-300F with 88,451 lb and<br />
later ‘<strong>to</strong>pp<strong>in</strong>g-up’ with 16,082 lb is not the most<br />
efficient scenario or use of tankers. Greater sav<strong>in</strong>gs<br />
could be achieved with alternative arrangements,<br />
e.g. tak<strong>in</strong>g off light and refuell<strong>in</strong>g <strong>to</strong> maximum<br />
capacity twice, or naturally, more efficient aircraft.<br />
In addition <strong>to</strong> the DOC estimates we currently<br />
employ for civil passenger aircraft, it would be<br />
useful <strong>to</strong> have some idea of two associated tanker<br />
costs. The first of these is the tanker operat<strong>in</strong>g cost<br />
per hour. This could be derived from military<br />
figures with a conversion <strong>to</strong> civil operations. The
second is the basic cost of convert<strong>in</strong>g say, an A330<br />
or B767 <strong>in</strong><strong>to</strong> a civil MRTT. The cost will be<br />
appreciable but not restrictive.<br />
The possibility of convert<strong>in</strong>g an exist<strong>in</strong>g airl<strong>in</strong>er<br />
<strong>to</strong> a pure freighter is fac<strong>to</strong>red <strong>in</strong> <strong>to</strong> the life cycle of<br />
most types. The additional cost of <strong>in</strong>clud<strong>in</strong>g AAR<br />
and tank<strong>in</strong>g facilities is actually quite a small<br />
percentage of the <strong>to</strong>tal conversion cost. Freight<br />
doors and floor strengthen<strong>in</strong>g are the costly<br />
structural items. If, by utilis<strong>in</strong>g AAR, a technical<br />
s<strong>to</strong>p can be avoided then a valuable ATC slot can be<br />
traded or sold. At London, Heathrow (LHR), at<br />
peak time, a paired departure and arrival slot would<br />
be worth about £30 million.<br />
6. AN UNCONVENTIONAL<br />
CHALLENGING CONFIGURATION<br />
We have shown that maximum fuel efficiency is<br />
achieved by aircraft designed for approximately<br />
3000 nm range. Us<strong>in</strong>g AAR, this high efficiency<br />
can be ma<strong>in</strong>ta<strong>in</strong>ed over longer ranges. Currently,<br />
the B757 is a fuel-efficient aircraft. It carries 200 <strong>to</strong><br />
220 pax (s<strong>in</strong>gle-aisle) over 3000 nm. It may not<br />
offer adequate comfort for long-range flights.<br />
It is opportune <strong>to</strong> consider possible challeng<strong>in</strong>g<br />
unconventional designs, exploit<strong>in</strong>g the 3000nm<br />
range and the advantages afforded by AAR.<br />
A current <strong>in</strong>terest is the design of moderate<br />
range aircraft, broadly <strong>in</strong> the class of the <strong>Air</strong>bus<br />
A320 series. We aim at 220 seats (as <strong>in</strong> A321) <strong>in</strong> an<br />
economy tw<strong>in</strong>-aisle cab<strong>in</strong>. This implies a shorter,<br />
stubbier, fuselage than the A321. With emphasis on<br />
fuel-efficient flight, the Range parameter (X = V.<br />
(L/D)/SFC) needs <strong>to</strong> be <strong>in</strong>creased. For conventional<br />
layouts, although near matur<strong>in</strong>g technology levels,<br />
respectable ga<strong>in</strong>s are still feasible with lighter<br />
structures etc. It is always difficult <strong>to</strong> <strong>in</strong>clude<br />
radical changes <strong>in</strong> an established l<strong>in</strong>e!<br />
It may be useful <strong>to</strong> consider unconventional<br />
types such as a Jo<strong>in</strong>ed-W<strong>in</strong>g layout enabl<strong>in</strong>g a high<br />
aspect ratio (AR) w<strong>in</strong>g <strong>to</strong> improve L/D. Many<br />
related structural issues exist as shown <strong>in</strong> Fig.35,<br />
Ref.25. The jo<strong>in</strong> is at 0.6 y/s. The power-plant<br />
location offers several choices. The immediate<br />
benefit of reduced cab<strong>in</strong> noise afforded by rearmounted<br />
eng<strong>in</strong>es is evident.<br />
Structural <strong>in</strong>tegrity of fuselage or tail-mounted<br />
eng<strong>in</strong>es requires further thought. Similarly, the<br />
effects of thrust-l<strong>in</strong>e on high mounted eng<strong>in</strong>es<br />
compared with those at the fuselage side will have a<br />
bear<strong>in</strong>g on w<strong>in</strong>g-tail location. Design considerations<br />
(structural and aero-elastics) need <strong>to</strong> <strong>in</strong>clude the<br />
height of the rear w<strong>in</strong>g and its jo<strong>in</strong> on the fuselage<br />
or vertical f<strong>in</strong>. <strong>An</strong> alternative proposal is with<br />
forward swept tips with a different set of<br />
compromises. All this will be an <strong>in</strong>terest<strong>in</strong>g future<br />
<strong>to</strong>pic. It may be useful <strong>to</strong> th<strong>in</strong>k also <strong>in</strong> terms of a<br />
strut-braced version.<br />
The ma<strong>in</strong> siz<strong>in</strong>g driver is the <strong>in</strong>tegration of a<br />
fuselage <strong>in</strong> a jo<strong>in</strong>ed-w<strong>in</strong>g layout coupled with the<br />
requirement for adequate fuel s<strong>to</strong>rage. The payload<br />
- range performance demands, therefore, lead <strong>to</strong><br />
reasonably thick aerofoils (t/c normal <strong>to</strong> the LE,<br />
between 12 and 15%) operat<strong>in</strong>g at moderately high<br />
CL values, near 0.6. Depend<strong>in</strong>g on w<strong>in</strong>g sweep,<br />
7<br />
thicker aerofoils can be adapted for hybrid lam<strong>in</strong>ar<br />
flow. Coupled with efficient propulsion, there is the<br />
prospect of 10-20% <strong>in</strong>crease <strong>in</strong> X. This <strong>in</strong> turn<br />
implies weight reductions / fuel efficiency ga<strong>in</strong>s.<br />
7. SUMMARISING, LIST FOR FIRST-<br />
LEVEL ANSWERS FROM DIFFERENT<br />
VIEWPOINTS<br />
It is useful <strong>to</strong> beg<strong>in</strong> a list emphasis<strong>in</strong>g the key<br />
features / benefits us<strong>in</strong>g AAR from different<br />
viewpo<strong>in</strong>ts. Some questions have been answered at<br />
a first level. Now is the time for <strong>in</strong>itiat<strong>in</strong>g serious<br />
studies. Most features are <strong>in</strong>ter-related. It is hoped<br />
that these will provide <strong>in</strong>sights <strong>in</strong><strong>to</strong> understand<strong>in</strong>g<br />
AAR operations / feasibility. No doubt, readers will<br />
contribute, with a positive outlook.<br />
AAR is a "multiplier" and Enabler<br />
- All efficiency improvements currently envisaged for<br />
future designs and upgrades will be enhanced<br />
- Co-exists with Close Fly<strong>in</strong>g Formations (CFF) ideas<br />
- Long range fuel consumption down 30%<br />
- Should enable Lam<strong>in</strong>ar (natural or hybrid) flow<br />
achievement (+15% say) with lesser penalties<br />
- Works naturally with Close Formation Fly<strong>in</strong>g. L/D up<br />
10%<br />
- Long range, direct flights enabled with full load, pax<br />
+ cargo. Fuel cost sav<strong>in</strong>gs: $175/pax for 6000nm<br />
with AAR, $320/pax for 9000nm with AAR<br />
(Assum<strong>in</strong>g fuel at $4.7/USG). Extend<strong>in</strong>g the sums<br />
<strong>to</strong> 250 seaters, fuel cost sav<strong>in</strong>gs are $43,750 and<br />
$80,000 for 6000nm and 9000nm flights<br />
respectively. Over a year, the sav<strong>in</strong>gs for 6000nm<br />
and 9000nm aircraft are $16 & $29 million<br />
respectively.<br />
- Life cycle costs halved<br />
- Service life extended<br />
- Costs of technical s<strong>to</strong>ps elim<strong>in</strong>ated<br />
- <strong>Air</strong>craft operate at max. payload, max. efficiency<br />
<strong>Air</strong>frame and eng<strong>in</strong>e manufacturers modify<br />
design requirements<br />
- More, smaller aircraft required (3000 nm range)<br />
- More, lower thrust and smaller eng<strong>in</strong>es<br />
- Alternative, more suitable airframe shapes may<br />
evolve (Jo<strong>in</strong>ed-w<strong>in</strong>g)<br />
Smaller (and more uniform) aircraft imply<br />
- Reduced wake strength (function of weight and span<br />
or cav, given CL)<br />
- Reduced separation time, Increased frequency of<br />
aircraft movements<br />
- Reduced lateral translation of wake (ground effect)<br />
- Improved utilisation of adjacent runways<br />
- Reduced thrust requirements, climb quickly <strong>to</strong><br />
requisite best altitude<br />
- Less eng<strong>in</strong>e noise, <strong>in</strong>crease night fly<strong>in</strong>g capability<br />
- More movements from a given airport (up by 30%)<br />
- Fire hazard less with smaller aircraft, easier on<br />
Equipment (<strong>Aviation</strong> Week, 2008)<br />
Opera<strong>to</strong>rs modify procedures<br />
- Reduced <strong>in</strong>vestment needed (smaller airframes cost<br />
less)<br />
- Operate at maximum payload for maximum<br />
efficiency
- Combi payloads of passengers and cargo, exist<strong>in</strong>g<br />
large aircraft usage, tak<strong>in</strong>g-off lighter with AAR<br />
- Noise reduction, Night Fly<strong>in</strong>g<br />
<strong>Air</strong>port Capacities (expansion or not?) - Hubs<br />
- Lots of passengers are <strong>in</strong> transit at hub airports. At<br />
LHR, 40% are <strong>in</strong> transit, cf dur<strong>in</strong>g 90’s:10%<br />
- With AAR, passengers travel direct, reduc<strong>in</strong>g the<br />
need <strong>to</strong> expand<br />
- Regional airports expand <strong>to</strong> accept more movements<br />
- Less need for extend<strong>in</strong>g runways<br />
- Reduced activity at Hub airports <strong>to</strong> more<br />
environmentally acceptable levels<br />
- Reduced traffic near Hub airports<br />
- Local airports more convenient for passengers and<br />
cargo<br />
- Current airport life extended <strong>in</strong>def<strong>in</strong>itely<br />
- Reduction <strong>in</strong> cargo flights<br />
- Probably more <strong>to</strong>tal ground staff, but more evenly<br />
distributed over many airports<br />
Tankers, tank<strong>in</strong>g operations (locations & how)<br />
- Assum<strong>in</strong>g 2-3 hours flight, a tanker could re-fuel<br />
between 20-30 aircraft dur<strong>in</strong>g a work<strong>in</strong>g day.<br />
- Tankers operate from dedicated airfields, near fuel<br />
supply but away possibly from habitation/airports<br />
Safety issues<br />
- Proximity dur<strong>in</strong>g AAR operation: Differential GPS,<br />
RARO, Au<strong>to</strong>pilots l<strong>in</strong>ked<br />
- Au<strong>to</strong>nomous <strong>Refuell<strong>in</strong>g</strong> is be<strong>in</strong>g developed by the<br />
USAF. Demonstrations are at advanced stage.<br />
- Take-off and Land<strong>in</strong>g, safer with smaller aircraft<br />
- Less <strong>in</strong>termediate s<strong>to</strong>ps but more aircraft<br />
- Safe, used <strong>to</strong> extend range of <strong>Air</strong> Force One (a<br />
Boe<strong>in</strong>g 747 200 series) for the last 20 years, Fig.36.<br />
Challenges posed by AAR <strong>to</strong> technical and<br />
bus<strong>in</strong>ess community.<br />
- Less types of aircraft needed<br />
- Investments and ever-chang<strong>in</strong>g cost scenario e.g. Fuel<br />
price volatility<br />
- As fuel prices <strong>in</strong>crease, this provides an added<br />
impetus. This is certa<strong>in</strong>ly a key.<br />
- At first sight, it may appear <strong>to</strong> be expensive, but not<br />
<strong>in</strong> long run.<br />
- Procedures, technology and much of the hardware<br />
already <strong>in</strong> place<br />
- Costs and benefits appear relatively straight-forward<br />
and conv<strong>in</strong>c<strong>in</strong>g<br />
Partnership opportunities with Military &<br />
Exist<strong>in</strong>g Commercial groups, Alliances, etc.<br />
- Increas<strong>in</strong>g the Tanker Values. In general, the military<br />
use is relatively less (
6. JUPP. J.A., “Mitigat<strong>in</strong>g the Environmental Impact of<br />
<strong>Aviation</strong>”, Presentation, AeIGT, 2006.<br />
7. FIELDING, J.P., “Introduction <strong>to</strong> <strong>Air</strong>craft Design”,<br />
Cambridge University Press, 1999.<br />
8. JENKINSON, L. R., SIMPKIN, P. & RHODES, D., “<strong>Civil</strong><br />
Jet <strong>Air</strong>craft Design”, Arnold, 1999.<br />
9. NANGIA, R.K., “Efficiency Parameters for Modern<br />
Commercial <strong>Air</strong>craft”, RAeS Aeronautical Journal, Volume<br />
110, no 1110, pp 495-510, August 2006.<br />
10. GREEN, J.E., “Kuchemann’s weight model as applied <strong>in</strong><br />
the first Greener by Design Technology Sub Group Report:<br />
A Correction, Adaptation and Commentary”, The RAeS<br />
Aero Jo., Vol.110, No. 1110, August 2006.<br />
11. NANGIA, R.K., “Operations and <strong>Air</strong>craft Design Towards<br />
“Greener” <strong>Civil</strong> aviation Us<strong>in</strong>g <strong>Air</strong>-<strong>to</strong>-<strong>Air</strong> <strong>Refuell<strong>in</strong>g</strong>”, The<br />
RAeS Aeronautical Journal, November 2006.<br />
12. NANGIA, R.K., “ “Greener" <strong>Civil</strong> <strong>Aviation</strong> Us<strong>in</strong>g <strong>Air</strong> – <strong>to</strong><br />
- <strong>Air</strong> <strong>Refuell<strong>in</strong>g</strong> - Relat<strong>in</strong>g <strong>Air</strong>craft Design Efficiency &<br />
Tanker Offload Efficiency”, The RAeS Aeronautical<br />
Journal, September 2007.<br />
Present State<br />
13. WARNER, M, Boe<strong>in</strong>g Presentation, 2008.<br />
14. VerWey, J., “Discover<strong>in</strong>g the Right Balance – Perspectives<br />
on Next-Generation Commercial Jet Eng<strong>in</strong>es”, Boe<strong>in</strong>g<br />
Presentation, September 2007.<br />
15. www.Boe<strong>in</strong>g.com<br />
Recent Lectures & Papers (AAR & CFF)<br />
16. NANGIA, R.K., “A <strong>Vision</strong> for Highly Fuel-Efficient<br />
Commercial <strong>Aviation</strong>”, EUCASS 2007, Brussels, July<br />
2007.<br />
17. NANGIA, R.K., “Highly Fuel-Efficient <strong>Civil</strong> <strong>Aviation</strong> – <strong>An</strong><br />
<strong>Opportunity</strong> for Present & <strong>Vision</strong> for Future”, CEAS 2007-<br />
264, Berl<strong>in</strong>, September 2007.<br />
18. NANGIA, R.K., “Commercial <strong>Air</strong>craft Efficiency<br />
Considerations & Meet<strong>in</strong>g Environmental Challenges us<strong>in</strong>g<br />
<strong>Air</strong>-<strong>to</strong>-<strong>Air</strong> <strong>Refuell<strong>in</strong>g</strong> & Close Formation Fly<strong>in</strong>g”, AIAA,<br />
ATIO meet<strong>in</strong>g, AIAA-2007-7720.<br />
19. NANGIA, R.K., “Highly Fuel-Efficient & Greener <strong>Aviation</strong><br />
– A Step Jump, Why & How”, Presentation <strong>to</strong> RAeS,<br />
Bris<strong>to</strong>l, 15 th Oc<strong>to</strong>ber 2007.<br />
20. NANGIA, R.K., “Highly Efficient and Greener <strong>Civil</strong><br />
<strong>Aviation</strong> - Step Jump, Why & How, <strong>An</strong> <strong>Opportunity</strong> for<br />
Present & A <strong>Vision</strong> for Future”, COIAE - AIAE, Madrid,<br />
21 st November 2007.<br />
21. NANGIA, R.K., “Highly Efficient and Greener <strong>Civil</strong><br />
<strong>Aviation</strong> - Step Jump, Why & How, <strong>An</strong> <strong>Opportunity</strong> for<br />
Present & A <strong>Vision</strong> for Future”, IAR, Cambridge<br />
University, 4 th February 2008.<br />
22. NANGIA, R.K., “Highly Efficient and Greener <strong>Civil</strong><br />
<strong>Aviation</strong> – Organis<strong>in</strong>g a Step Jump <strong>to</strong>wards ACARE Goals<br />
& How, <strong>An</strong> <strong>Opportunity</strong> for Present & A <strong>Vision</strong> for<br />
Future”, RAeS Conference “Aerospace 2008 – The Way<br />
Forward”, London, 22-24 April 2008.<br />
23. NANGIA, R.K., “Way Forward <strong>to</strong> a Step Jump for Highly<br />
Efficient & Greener <strong>Civil</strong> <strong>Aviation</strong>, <strong>An</strong> <strong>Opportunity</strong> for the<br />
Present & a <strong>Vision</strong> for Future”, Presentation <strong>to</strong> NASA<br />
Langley Research Centre, Virg<strong>in</strong>ia, USA, 11 September<br />
2008.<br />
24. NANGIA, R.K., “Achiev<strong>in</strong>g Highly Efficient <strong>Civil</strong><br />
<strong>Aviation</strong> - Why & How with <strong>Air</strong>-<strong>to</strong>-<strong>Air</strong> <strong>Refuell<strong>in</strong>g</strong>, Review<br />
& New Developments”, ICAS-2008-4.10.1. September<br />
2008.<br />
New Fuel-Efficient Types<br />
25. NANGIA, R.K., PALMER,M.E. & HYDE, L., “Exploit<strong>in</strong>g<br />
Jo<strong>in</strong>ed-W<strong>in</strong>g Layout for Efficient <strong>Civil</strong> Transport <strong>Air</strong>craft<br />
9<br />
for Moderate Ranges”. Paper 13, RAeS Applied<br />
Aerodynamics Conference: “The Aerodynamics of Novel<br />
Configurations. Capabilities & Future Requirements”,<br />
London, Oct. 2008.<br />
Useful General References<br />
26. WHITFORD, R. ”Fundamentals of <strong>Air</strong>l<strong>in</strong>er Design”, <strong>Air</strong><br />
International, July 2003<br />
27. KUCHEMANN, D. "The Aerodynamic Design of <strong>Air</strong>craft",<br />
Pergamon, 1978.<br />
28. KULFAN, B., Presentation <strong>to</strong> NRC, USA, 2001.<br />
NOMENCLATURE<br />
AAR <strong>Air</strong> <strong>to</strong> <strong>Air</strong> <strong>Refuell<strong>in</strong>g</strong><br />
AR Aspect Ratio<br />
ATC <strong>Air</strong> Traffic Control<br />
b = 2 s, W<strong>in</strong>g span<br />
c Local W<strong>in</strong>g Chord<br />
cav = cref = S/b, Mean Geometric Chord<br />
CD = D /(q S), <strong>Dr</strong>ag Coefficient<br />
CDi Lift Induced <strong>Dr</strong>ag Coefficient<br />
CL = L/(q S), Lift Coefficient<br />
Cm =m/(qS cav ), Pitch<strong>in</strong>g Moment Coeff.<br />
COC Cash Operat<strong>in</strong>g Costs<br />
D <strong>Dr</strong>ag force<br />
DOC Direct Operat<strong>in</strong>g Cost<br />
GPS Global Position<strong>in</strong>g System<br />
kt Knots, nm/hr<br />
L Lift Force<br />
L/D Lift <strong>to</strong> <strong>Dr</strong>ag Ratio<br />
m Pitch<strong>in</strong>g moment<br />
M Mach Number<br />
MTOW Maximum Take-Off Weight (=TOW)<br />
OEW Operat<strong>in</strong>g Weight Empty (also WOE)<br />
OEWR = OEW / MTOW<br />
Pax Passengers<br />
PRE Payload Range Efficiency WP*R/WFB<br />
q = 0.5 ρ V2 , Dynamic Pressure<br />
R Range<br />
s semi-span<br />
S<br />
SFC<br />
= 1/hr<br />
Reference Area (SL Lead W<strong>in</strong>g, ST Trail)<br />
Specific Fuel Consumption, lb (of fuel)/hr / lb (thrust)<br />
T/W Thrust <strong>to</strong> Weight Ratio<br />
USG US Gallon<br />
V <strong>Air</strong>stream Velocity (kt)<br />
WP Payload (WP) W F<br />
Fuel Load (Block + Reserves = Total)<br />
WFB Block Fuel<br />
WFREF Maximum Refuel Load<br />
WFT Tanker Fuel<br />
x,y,z Orthogonal Co-ord<strong>in</strong>ates, x along body<br />
X = V L/D / SFC, Range Parameter<br />
Z = R / X, Non-Dimensional Range<br />
α AoA, <strong>An</strong>gle of Attack<br />
λ Taper Ratio, c t/c r<br />
Λ LE Sweep <strong>An</strong>gle<br />
η = y/s, Non-dimensional spanwise distance<br />
ρ <strong>Air</strong> Density<br />
© Copyright, <strong>Dr</strong> R.K. Nangia 2008. All Rights Reserved. Published by RAeS with Permission
-------------------------------------------------------------------------------------------------------------------------------<br />
In service New Deliveries With AAR<br />
2007 2027 By 2027 By 2027<br />
747 & Larger 910 1,340 980 200 (Possibly Less)<br />
Tw<strong>in</strong>-Aisle 3,480 8,290 6,750 7,000 (But Smaller Range Versions)<br />
S<strong>in</strong>gle-Aisle 11,450 23,540 18,100 20,000 (say)<br />
Regional Jets 3,160 2,630 2,510<br />
Totals 19,000 35,800 29,400<br />
------------------------------------------------------------------------------------------------------------------------------<br />
Table 1 MARKET FORECASTS (Boe<strong>in</strong>g) & EFFECT OF AAR<br />
<strong>Air</strong>craft Payload<br />
(lb)<br />
Range<br />
(nm)<br />
Fuel<br />
(lb)<br />
Tanker<br />
Fuel (lb)<br />
Total<br />
Fuel (lb)<br />
% Fuel<br />
Sav<strong>in</strong>g<br />
A B747-400F 123,000 7,200 338,016 - 338,016 Current Long-Range -<br />
B B747-400F 246,000 3,600 190,043 - 190,043 95% MTOW, WPA -<br />
C B767-300F 123,000 3,300 88,451 - 88,451 Current Po<strong>in</strong>t A -<br />
D B747-400F 246,000 7,200 2 x 338,016 - 676032 Requires 2 x a/c -<br />
E B747-400F 246,000 7,200 2 x 190,043 47,500 427,586 1 x a/c Pt A + AAR 36.8 cf D<br />
F B767-300F 123,000 7,200 2 x 88,451<br />
+ 16,082<br />
8%<br />
10%<br />
12%<br />
Fig.1 CO2 EMISSIONS FROM TRANSPORT<br />
26,133 219,117 1 x a/c Pt A + AAR 35.2 cf A<br />
Table 2 EXAMPLE WITH AAR ON FREIGHTERS<br />
USG/100<br />
pax.<br />
miles<br />
Fig. 2 FUEL CONSUMPTION PER 100 PAX MILES v LOAD<br />
FACTOR<br />
10<br />
lt/100<br />
paxkm<br />
8<br />
6<br />
4<br />
2
© Copyr<br />
B747-400<br />
Max Payload<br />
B757-200<br />
WP/MTOW<br />
Fig.3 DISTRIBUTION OF STAGE LENGTH, FUEL<br />
BURN & NOX EMISSION<br />
B707-320B<br />
WP lb<br />
A<br />
B,D<br />
(a) Usual<br />
0.20<br />
0.15<br />
0.10<br />
A<br />
B757-200<br />
0.234<br />
Z = R/X<br />
0.181<br />
A<br />
B,D<br />
A<br />
B, D<br />
R 1000 nm<br />
WP/MTOW<br />
New<br />
Designs<br />
B777<br />
B747<br />
B787<br />
A380<br />
A350XWB<br />
WP/MTOW<br />
B747-400<br />
0.15<br />
0.10<br />
B757-200<br />
B747-400<br />
(c) Non-D with PRE/X l<strong>in</strong>es<br />
11<br />
0.187<br />
-<br />
0.123<br />
Current<br />
65%<br />
Fig.4 CUMULTIVE WORLD FUEL BURN vs<br />
STAGE LENGTH<br />
B757-200<br />
B707-320B<br />
(b) Compar<strong>in</strong>g Non-D Versions<br />
WP/MTOW<br />
7.5% shift<br />
Future 50% !<br />
B747-400<br />
B707-320B<br />
0.15<br />
0.10<br />
New<br />
Designs<br />
B777<br />
B747<br />
B787<br />
A380<br />
A350XWB<br />
Stage Length<br />
Z = R/X<br />
PRE/X<br />
0.163<br />
Z = R/X Z = R/X<br />
FIG. 5 PAYLOAD - RANGE DIAGRAMS, USUAL & NON-D INTERPRETATION<br />
B757-200 X=13,646nm, B747-400 X=14,473nm, B707-320B X=9,493nm<br />
B707-320B<br />
0.097
Ratio <strong>to</strong><br />
MTOW<br />
HBP<br />
HBP<br />
HBP<br />
HBP<br />
Fig. 6 DERIVED WEIGHT RATIO TRENDS<br />
WFB / WP<br />
Refs at<br />
3000nm<br />
RANGE R<br />
28%<br />
44%<br />
R nm<br />
51%<br />
Pt A<br />
Curve<br />
Range R<br />
61%<br />
Sum=1<br />
OEW+WP<br />
Z = R/X<br />
OEW<br />
WFB<br />
Payload<br />
Reserves<br />
X nm<br />
Fig. 8 WFB / WP vs Z = R/X, Pt A & Pt D<br />
Note: Parallel Scales of R Implied for Different X Values<br />
Refs at<br />
3000<br />
nm<br />
VEMPX<br />
Fuel<br />
Reserves<br />
Ratio<br />
WFR/WP<br />
Increases<br />
with With Range<br />
Range<br />
12<br />
A321 - 100<br />
PRE / X<br />
1.0<br />
Refs at<br />
3000nm<br />
1.0<br />
A300 -600<br />
28%<br />
Pt A<br />
A310 - 300<br />
R nm<br />
Pt D<br />
Pt A<br />
WFB/WP<br />
51%<br />
44%<br />
Pt D<br />
Fig. 7 FUEL RESERVES RATIO WFR/WP<br />
61%<br />
Z = R/X<br />
X<br />
2.0<br />
RANGE R 1000 nm<br />
3.0<br />
70%WP<br />
A340 -500<br />
PRE<br />
nm<br />
X nm<br />
Fig. 9 PRE/X vs Z = R/X, Pt A & Pt D<br />
Note: Parallel Scales of PRE Implied for Different X<br />
VEMPX= PRE/X*WP/MTOW<br />
VEOPX=PRE/X*WP/OEW<br />
VEOPX<br />
Fig. 10 CIVIL AIRCRAFT, NON-DIMENSIONAL EFFICENCY<br />
PARAMETERS VEMPX & VEOPX<br />
Z = R/X<br />
Fuel Reserves<br />
4.5% MTOW
3000nm<br />
MTOW 261932 lb<br />
W<strong>in</strong>g Area 1943 sq ft<br />
WEIGHT lb<br />
MTOW = 261932 lb<br />
6000nm<br />
MTOW 505438 lb<br />
W<strong>in</strong>g Area 3750 sq ft<br />
13<br />
9000nm<br />
MTOW 656262 lb<br />
W<strong>in</strong>g Area 4868 sq ft<br />
Fig. 11 COMPARING AIRCRAFT DESIGNED FOR DIFFERENT RANGES, 250 Pax.<br />
WFB = 46147<br />
WFR = 11506<br />
WP = 52360<br />
DIstance nm<br />
Fig. 12 AIRCRAFT WEIGHT VARIATION WITH<br />
DISTANCE FOR 3000 nm RANGE NO REFUELLING, 250<br />
PAX., OEWR = 0.58, X = 15077 nm<br />
WEIGHT lb<br />
W<strong>in</strong>g Area 1943 sq ft<br />
MTOW = 656262 lb<br />
MTOW = 261932 lb (3000 nm) [38%]<br />
WEIGHT lb<br />
MTOW = 505438 lb<br />
MTOW = 261932 lb<br />
12000nm<br />
MTOW 860445 lb<br />
W<strong>in</strong>g Area 6383 sq ft<br />
WFB = 161269<br />
WFR = 24943<br />
WP = 52360<br />
WFB Saved = 65975 [ 43% ]<br />
Tanker Fuel = 9000 [4% ]<br />
Total Sav<strong>in</strong>g = 37%<br />
WFB = 92294<br />
Distance nm<br />
Fig. 13 AIRCRAFT WEIGHT VARIATION WITH DISTANCE FOR<br />
6000 nm RANGE AIRCRAFT, REFUELLED ONCE cf AIRCRAFT<br />
WITHOUT AAR, OEWR = 0.528, 250 PAX. 3750 ft 2 , X = 15077 nm<br />
Distance nm<br />
250 pax, 9000nm<br />
MTOW 656262 lb<br />
W<strong>in</strong>g Area 4868 sq ft<br />
WFB = 263073<br />
WFR = 32387<br />
WP = 52360<br />
WFB Saved = 124632 [ 47% ]<br />
Tanker Fuel = 18000 [6% ]<br />
Total Sav<strong>in</strong>g = 41%<br />
WFB = 138441<br />
Fig.14 AIRCRAFT WEIGHT VARIATION WITH DISTANCE FOR 9000 nm RANGE AIRCRAFT (X = 15077nm)<br />
REFUELLED TWICE cf AIRCRAFT WITHOUT REFUELLING, OEWR = 0.47, 250 PAX., S = 4968 ft 2 , X = 16897
$Usm/pax<br />
42<br />
40<br />
38<br />
36<br />
34<br />
32<br />
30<br />
28<br />
26<br />
24<br />
22<br />
20<br />
$Usm/lb<br />
Ref<br />
+48<br />
+80<br />
Fig.15 SPAN vs MTOW<br />
Fig.17 ACQUISITION COST INCREASES<br />
WITH DESIGN RANGE<br />
Altitude<br />
kft<br />
Re.s at<br />
3000nm<br />
9000 nm<br />
6000 nm<br />
A380<br />
Range<br />
Fig.19 ALTITUDE ATTAINED AT END OF<br />
CONSTANT CL CLIMB CRUISE<br />
EPNdB<br />
Take-off<br />
14<br />
350<br />
300<br />
250<br />
200<br />
150<br />
100<br />
50<br />
upper<br />
lower<br />
A<br />
O<br />
0<br />
0 100000 200000 300000 400000 500000 600000 700000<br />
+10%<br />
Ref.<br />
+7%<br />
TOW <strong>to</strong>ns<br />
ICAO Stage 3, Jets & Transports<br />
Fig.18 ICAO STAGE 3 NOISE<br />
REGULATIONS REFLECT THE MTOW<br />
3000 nm<br />
<strong>Air</strong>craft<br />
start<br />
0.4 0.5 0.6 0.7 0.8 0.9 1<br />
W2/MTOW<br />
5000<br />
4000<br />
3000<br />
FUEL lb<br />
2000<br />
1000<br />
0<br />
US$ millions<br />
Ref. at<br />
3000nm<br />
Fig.16 COST vs OEW<br />
Without AAR<br />
Side - l<strong>in</strong>e,<br />
Approach<br />
+3%<br />
Ref.<br />
+6%<br />
TOW <strong>to</strong>ns<br />
B747-400<br />
396.9 <strong>to</strong>ns<br />
Noise Measur<strong>in</strong>g Po<strong>in</strong>ts<br />
Total Fuel<br />
(<strong>in</strong>clud<strong>in</strong>g reserves)<br />
AAR<br />
Block<br />
3000 6000 9000 12000<br />
Range (nm)<br />
Fig. 20 FUEL SAVED WHEN FLYING 6000 or 9000 nm,<br />
USING AAR ON 3000nm AIRCRAFT, INCLUDING TANKER<br />
CHARACTERISTICS, 250 Pax<br />
C1<br />
C2
45%Fue 36%Fue<br />
B777-300ER<br />
65%Fue<br />
$0.8/USG<br />
$4.3 /USG<br />
M. Warner, Boe<strong>in</strong>g<br />
July 2008<br />
Oil Prices Volatility, 5.5 Fold <strong>in</strong>crease <strong>in</strong> 4 years!<br />
15<br />
2001-04<br />
level<br />
Fig. 21 FUEL COST ESCALATION FROM 2001 (Moody, IATA & Ref.13)<br />
B737-800<br />
55%Fue<br />
l<br />
FIG. 22 IMPACT OF FUEL COSTS ON AIRCRAFT<br />
CASH OPERATING COSTS, 737 & 777 SERIES (Ref.10)<br />
Refuel<br />
Operations<br />
3-4, 5-6, 7-8<br />
0.6<br />
0.5<br />
0.4<br />
0.3<br />
0.2<br />
0.1<br />
Tanker Weight & Range<br />
0<br />
Fuel cost/Total cost<br />
COC<br />
777-300ER<br />
COC<br />
737-800<br />
Fig. 24 TYPICAL CIVIL AAR TANKER OPERATING SCENARIO<br />
Settle ?<br />
DOC Ref &<br />
Others<br />
$/USG<br />
$/USG<br />
0 0.5 1 1.5 2 2.5 3 3.5 4 4.5<br />
Fig. 23 FUEL COST AS A FRACTION OF TOTAL COST,<br />
FRACTION INCREASES WITH FUEL PRICE (COC & DOC)
60<br />
40<br />
20<br />
0<br />
0 2 4 6 8 10<br />
-20<br />
-40<br />
-60<br />
Thrust<br />
35000<br />
30000<br />
25000<br />
20000<br />
% Sav<strong>in</strong>g <strong>in</strong> Fuel<br />
RT = Fuel Given / Tanker Fuel used<br />
Fig. 25 SAVING IN TOTAL FUEL CONSUMED<br />
3x11000<br />
4x75000<br />
2x110000<br />
0<br />
-0.1<br />
-0.2<br />
-0.3<br />
-0.4<br />
-0.5<br />
12000<br />
9000<br />
6000<br />
nm<br />
0 1 2 3 4 5<br />
Fractional<br />
Change<br />
16<br />
% GAIN IN PRE / X<br />
160<br />
140<br />
120<br />
12000<br />
100<br />
9000<br />
80<br />
6000<br />
60<br />
nm<br />
40<br />
Us<strong>in</strong>g a<br />
20<br />
3000nm<br />
0<br />
<strong>Air</strong>craft<br />
-20 0<br />
-40<br />
2 4 6 8 10<br />
-60<br />
RT = Fuel Given / Tanker Fuel used<br />
Fig. 26 % IMPROVEMENT IN PRE / X USING a 3000 nm<br />
AIRCRAFT WITH AAR,<br />
VARIATION WITH TANKER FUEL OFF-LOAD<br />
$/USG<br />
6000 nm<br />
9000 nm<br />
Fig. 27 30-40% SAVINGS IN COST USING 3000 nm AIRCRAFT FOR<br />
6000 & 9000 nm RANGES WITH AAR<br />
169 klb<br />
219 klb<br />
NO AAR<br />
15000<br />
10000<br />
2x45000<br />
88 klb<br />
88 klb<br />
AAR<br />
5000<br />
0<br />
0 2000 4000 6000 8000<br />
Range nm<br />
10000 12000<br />
Thrust Required Increases WITHOUT AAR<br />
287klb<br />
0 3000 6000 9000 12000<br />
0<br />
-10<br />
-20<br />
-30<br />
-40<br />
-50<br />
-60<br />
-70<br />
-80<br />
$USG<br />
Thrust Reduction Proportion us<strong>in</strong>g the 3000 nm aircraft<br />
Noise also reduces<br />
Fig. 28 VARIATION OF AIRCRAFT THRUST REQUIREMENT WITH DESIGN RANGE,<br />
WITHOUT AND WITH AAR AVAILABLE<br />
Range nm
Fig. 29 VARIATION OF WEIGHT WITH DIFFERENT REFUELLING OPTIONS ON B757-300, One Refuel, 47,850 lb<br />
lb<br />
lb<br />
270,000<br />
507,065<br />
230,000<br />
TOW lb<br />
250,000<br />
400,000 450,000<br />
17<br />
270,000<br />
507,065<br />
270,000<br />
(a) (b)<br />
(c)<br />
(d) (e) (f)<br />
Ranges (1000nm)<br />
TOW lb<br />
Ranges (1000nm)<br />
MTOW = 270,000 lb<br />
MTOW = 507,065 lb<br />
507,065<br />
270,000<br />
(a) (b) (c) (d) (e) (f)<br />
507,065 lb<br />
(a) (b)<br />
(c)<br />
(e)<br />
(f)<br />
Fig. 30 VARIATION OF WEIGHT WITH DIFFERENT REFUELLING OPTIONS ON A330-200, One Refuel, 113,730 lb<br />
PRE/X<br />
Pt A Curve<br />
MTOW<br />
35%<br />
85%<br />
With AAR<br />
B757-200<br />
Lighter<br />
Pt D Curve<br />
A330-200<br />
Z= R/ X<br />
125% benefit<br />
Fig. 31 PRE/X – Z, CURRENT A & D POINT TRENDS (Fig.5) AND<br />
VARIATION WITH DIFFERENT REFUELLING OPTIONS FOR A330-200 and B757-300<br />
Note the Benefits with respect <strong>to</strong> PT A & Pt D Curves<br />
P
Fuel Offload<br />
1000 lb<br />
300<br />
250<br />
200<br />
150<br />
100<br />
50<br />
0<br />
Tanker Above<br />
Receiver<br />
Receiver<br />
<strong>Civil</strong> Interest<br />
Receiver<br />
Alternative<br />
Fig. 32 POSSIBLE CENTRAL RECEIVER OPTIONS<br />
0 1000 2000 3000 4000 5000<br />
18<br />
“Conventional”<br />
Raise a Telescopic Boom<br />
Short Probe<br />
Tanker Below<br />
Lower Fuselage<br />
Receptacle<br />
Tanker Above<br />
Lower a Telescopic Boom<br />
Short Probe<br />
F<strong>in</strong> Top<br />
Receptacle<br />
KC135<br />
R KC-10<br />
A310<br />
B-767<br />
A330<br />
BWB1<br />
BWB2<br />
Fig. 33 DIFFERENT TANKERS<br />
CAPABILITIES. Note <strong>Civil</strong> Interest<br />
(a) <strong>An</strong>chorage as a Base (b) Europe <strong>to</strong> Australia (c) USA West Coast <strong>to</strong> Australia<br />
PAA “Fly<strong>in</strong>g Clipper” routes<br />
Fig. 34 DIFFERENT ROUTES SCENARIOS
Forward<br />
Swept Tip<br />
19<br />
210 Seats, Typical Tw<strong>in</strong>-Aisle<br />
Useful !<br />
Alternative Arrangements<br />
FIG. 35 POSSIBLE JOINED-WING CONFIGURATIONS BASED ON A321-100 PARAMETERS<br />
FIG. 36 AAR IS CONSIDERED SAFE FOR US PRESIDENT & HIS MEN !