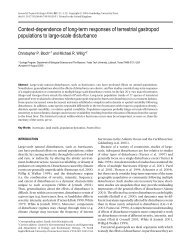
Tadpole shrimp structure macroinvertebrate communities in playa ...
Tadpole shrimp structure macroinvertebrate communities in playa ...
Tadpole shrimp structure macroinvertebrate communities in playa ...

You also want an ePaper? Increase the reach of your titles
YUMPU automatically turns print PDFs into web optimized ePapers that Google loves.
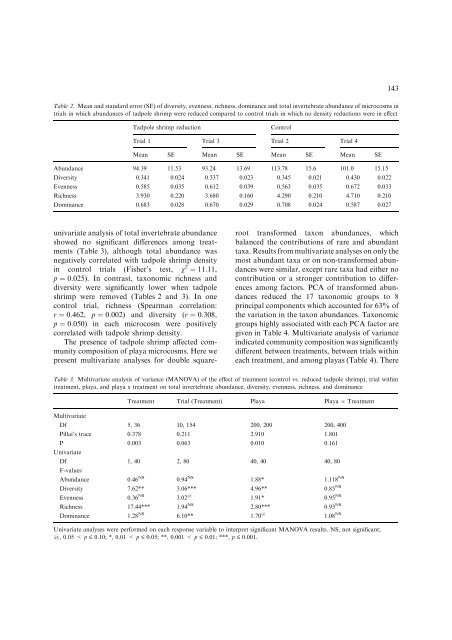
Table 2. Mean and standard error (SE) of diversity, evenness, richness, dom<strong>in</strong>ance and total <strong>in</strong>vertebrate abundance of microcosms <strong>in</strong><br />
trials <strong>in</strong> which abundances of tadpole <strong>shrimp</strong> were reduced compared to control trials <strong>in</strong> which no density reductions were <strong>in</strong> effect<br />
<strong>Tadpole</strong> <strong>shrimp</strong> reduction Control<br />
Trial 1 Trial 3 Trial 2 Trial 4<br />
Mean SE Mean SE Mean SE Mean SE<br />
Abundance 94.39 11.53 93.24 13.69 113.78 15.6 101.0 15.15<br />
Diversity 0.341 0.024 0.337 0.023 0.345 0.021 0.430 0.022<br />
Evenness 0.585 0.035 0.612 0.039 0.563 0.035 0.672 0.033<br />
Richness 3.930 0.220 3.680 0.160 4.290 0.210 4.710 0.210<br />
Dom<strong>in</strong>ance 0.683 0.028 0.670 0.029 0.708 0.024 0.587 0.027<br />
univariate analysis of total <strong>in</strong>vertebrate abundance<br />
showed no significant differences among treatments<br />
(Table 3), although total abundance was<br />
negatively correlated with tadpole <strong>shrimp</strong> density<br />
<strong>in</strong> control trials (Fisher’s test, v 2 ¼ 11.11,<br />
p ¼ 0.025). In contrast, taxonomic richness and<br />
diversity were significantly lower when tadpole<br />
<strong>shrimp</strong> were removed (Tables 2 and 3). In one<br />
control trial, richness (Spearman correlation:<br />
r ¼ 0.462, p ¼ 0.002) and diversity (r ¼ 0.308,<br />
p ¼ 0.050) <strong>in</strong> each microcosm were positively<br />
correlated with tadpole <strong>shrimp</strong> density.<br />
The presence of tadpole <strong>shrimp</strong> affected community<br />
composition of <strong>playa</strong> microcosms. Here we<br />
present multivariate analyses for double square-<br />
root transformed taxon abundances, which<br />
balanced the contributions of rare and abundant<br />
taxa. Results from multivariate analyses on only the<br />
most abundant taxa or on non-transformed abundances<br />
were similar, except rare taxa had either no<br />
contribution or a stronger contribution to differences<br />
among factors. PCA of transformed abundances<br />
reduced the 17 taxonomic groups to 8<br />
pr<strong>in</strong>cipal components which accounted for 63% of<br />
the variation <strong>in</strong> the taxon abundances. Taxonomic<br />
groups highly associated with each PCA factor are<br />
given <strong>in</strong> Table 4. Multivariate analysis of variance<br />
<strong>in</strong>dicated community composition was significantly<br />
different between treatments, between trials with<strong>in</strong><br />
each treatment, and among <strong>playa</strong>s (Table 4). There<br />
Table 3. Multivariate analysis of variance (MANOVA) of the effect of treatment (control vs. reduced tadpole <strong>shrimp</strong>), trial with<strong>in</strong><br />
treatment, <strong>playa</strong>, and <strong>playa</strong> x treatment on total <strong>in</strong>vertebrate abundance, diversity, evenness, richness, and dom<strong>in</strong>ance<br />
Treatment Trial (Treatment) Playa Playa Treatment<br />
Multivariate<br />
Df 5, 36 10, 154 200, 200 200, 400<br />
Pillai’s trace 0.378 0.211 2.910 1.801<br />
P<br />
Univariate<br />
0.003 0.063 0.010 0.161<br />
Df<br />
F-values<br />
1, 40 2, 80 40, 40 40, 80<br />
Abundance 0.46 NS<br />
0.94 NS<br />
1.88* 1.118 NS<br />
Diversity 7.62** 3.06*** 4.96** 0.85 NS<br />
Evenness 0.36 NS<br />
3.02 @<br />
1.91* 0.95 NS<br />
Richness 17.44*** 1.94 NS<br />
2.80*** 0.93 NS<br />
Dom<strong>in</strong>ance 1.28 NS<br />
6.10** 1.70 @<br />
1.08 NS<br />
Univariate analyses were performed on each response variable to <strong>in</strong>terpret significant MANOVA results. NS, not significant;<br />
@, 0.05 < p £ 0.10; *, 0.01 < p £ 0.05; **, 0.001 < p £ 0.01; ***, p £ 0.001.<br />
143