experimental assessment of several population estimation ...
experimental assessment of several population estimation ...
experimental assessment of several population estimation ...

You also want an ePaper? Increase the reach of your titles
YUMPU automatically turns print PDFs into web optimized ePapers that Google loves.
EXPERIMENTAL ASSESSMENT OF SEVERAL POPULATION<br />
ESTIMATION TECHNIQUES ON AN INTRODUCED<br />
POPULATION OF EASTERN CHIPMUNKS<br />
ABSTRACT.-An <strong>experimental</strong> <strong>population</strong> <strong>of</strong> eastern chipmunks (Tamias striatus)<br />
composed <strong>of</strong> 85 individuals <strong>of</strong> known age and sex was released on a 9.4-ha island<br />
previously devoid <strong>of</strong> chipmunks. Three commonly used mark-recapture techniques<br />
(Lincoln-Petersen, Schnabel, and Schumacher-Eschmeyer methods) and the Least<br />
Squares Removal Method were used to estimate the size <strong>of</strong> the <strong>population</strong>. With the<br />
exception <strong>of</strong> equal catchability, the experiment was designed to satisfy the assumptions<br />
<strong>of</strong> the above methods. Point estimates always underestimated the true <strong>population</strong> size,<br />
and only the confidence intervals <strong>of</strong> the Lincoln-Petersen Method consistently includ-<br />
ed the actual <strong>population</strong> value. Least squares regression analyses suggest that the<br />
<strong>experimental</strong> <strong>population</strong> is composed <strong>of</strong> two groups <strong>of</strong> animals: those easily trapped<br />
and those hesitant to enter traps. As such, all <strong>population</strong> <strong>estimation</strong> methods estimate<br />
the easily captured portion <strong>of</strong> the <strong>population</strong> and underestimate the true <strong>population</strong><br />
size. The mathematically simple Lincoln-Petersen Method was more robust than the<br />
other methods; when unequal trappability is suspected, it is more accurate than the<br />
other methods (although some precision is sacrificed). Caution is suggested in making<br />
inter- or intraspecific statistical comparisons <strong>of</strong> <strong>population</strong> size when close adherence<br />
to the assumptions <strong>of</strong> the models utilized is not demonstrable; otherwise, statistical<br />
differences may be spurious.<br />
Determination <strong>of</strong> the number <strong>of</strong> individuals comprising a <strong>population</strong> is one <strong>of</strong> the<br />
basic necessities in any <strong>population</strong> study, and yet one <strong>of</strong> <strong>population</strong> biology's most<br />
intractable problems. In some studies, it is possible to census animals directly because<br />
they are confined to a small area, are large and easy to see, or are gregarious and<br />
cluster together in easily censused aggregations. Generally, however, the field biol-<br />
ogist must estimate how many organisms inhabit a particular habitat patch or geo-<br />
graphic area. At present there are many <strong>population</strong> <strong>estimation</strong> methods available to<br />
researchers, but these <strong>of</strong>ten are based on assumptions that have not been tested ad-<br />
equately under field conditions (Petersen, 1896; Lincoln, 1930; Dice, 1938, 1941;<br />
Cahalane, 1941; Stickel, 1946, 1948; Calhoun, 1948; Hayne, 194%; Zippin, 1958;<br />
Jolly, 1963; Yang et al., 1970; Seber, 1973; Smith et al., 1975; Eberhardt, 1978).<br />
Part <strong>of</strong> the problem with methodological studies on <strong>population</strong> estimates is that it<br />
is inherently difficult to control for immigration, emigration, birth, and death in natural<br />
<strong>population</strong>s. For terrestrial vertebrates, it is only possible to control these variables<br />
under certain <strong>experimental</strong> conditions. For example, investigators have attempted to<br />
livetrap a large area heavily, and subsequently conduct snap-trapping within a small<br />
portion <strong>of</strong> the previously studied site to test the efficiency <strong>of</strong> snap traps and their<br />
effectiveness in sampling a <strong>population</strong> (Stickel, 1946, 1948; Pelikan and Zejda, 1962).<br />
Other workers have employed heroic efforts at direct censusing <strong>of</strong> a <strong>population</strong> after<br />
first trapping the area, and then compared the results from the two techniques (Ed-<br />
wards and Eberhardt, 1967; Strandgaard, 1967). Edwards and Eberhardt (1967) intro-<br />
duced a large <strong>population</strong> <strong>of</strong> cottontail rabbits into a 40-acre enclosure and then em-<br />
ployed mark-release trapping to compare various <strong>population</strong> estimates to the known<br />
<strong>population</strong> size. Studies <strong>of</strong> this nature, however, are rare.<br />
In this paper, we report data from a <strong>population</strong> <strong>of</strong> 85 chipmunks introduced onto an<br />
island that lacked chipmunks (Tamias striatus), although it appeared to <strong>of</strong>fer adequate<br />
J. Mamm., 62(2):315-328, 1981 315
316 JOURNAL OF MAMMALOGY Vol. 62, No. 2<br />
food and shelter for them. The island is one <strong>of</strong> many such islands lying within the<br />
Pymatuning Reservoir and its apparently fortuitous lack <strong>of</strong> a resident chipmunk pop-<br />
ulation made it an ideal "field laboratory" for testing <strong>population</strong> <strong>estimation</strong> tech-<br />
niaues.<br />
Because the <strong>population</strong> <strong>of</strong> chipmunks was introduced onto an island, there was little<br />
chance <strong>of</strong> either immigration or emigration affecting the results. Few or no natural<br />
predators were seen or known to occur on that island during the period <strong>of</strong> this study,<br />
so chipmunk deaths should have been minimal. Although 19 animals were not cap-<br />
tured during the removal phase <strong>of</strong> the experiment, we were subsequently able to<br />
remove additional chipmunks and are confident that mortality during the experiment<br />
did not affect our results. The study was conducted over a short time so that repro-<br />
duction was also an unimportant factor. Finally, because the island possessed discrete<br />
boundaries, we knew exactly how large an area was being sampled and the exact<br />
density <strong>of</strong> animals in that area. Thus, the common problem <strong>of</strong> marginal residents or<br />
transients occurring within the study area was eliminated (Dice, 1938, 1941; Blair,<br />
1940; Stickel, 1946, 1948).<br />
We used live-trapping techniques to test some <strong>of</strong> the most popular and widely<br />
accepted mark-release <strong>population</strong> estimates-the Lincoln-Petersen Index (Lincoln,<br />
1930), the Schumacher-Eschmeyer Technique (Schumacher and Eschmeyer, 1943),<br />
and the Schnabel Method (Schnabel, 1938). In addition, we examined the widely-<br />
used technique <strong>of</strong> removing animals from an area, calculating a regression line and<br />
estimating the total <strong>population</strong> on the area (the Removal Method, Zippin, 1958).<br />
Field work was conducted on Whaley Island, located in the Pymatuning Reservoir near Lines-<br />
ville, Pennsylvania (41°38'N. lat., 80025'W. lotig.), during a 3-week period in June and July, 1978.<br />
Three distinct macrohabitats comprised the bulk <strong>of</strong> the 9.4-ha island. A planted, mature stand<br />
<strong>of</strong> evergreens consisting mainly <strong>of</strong> Norway spruce (Picea abies) with interspersed red pine (Pinus<br />
resinosa) covered 25% <strong>of</strong> the island area! The most extensive macrohabitat (-55% <strong>of</strong> the island's<br />
area) was a mature stand <strong>of</strong> deciduous trees dominated by blaek cherry runus us serotina), al-<br />
though sizable remnant <strong>population</strong>s <strong>of</strong> tamarack (Larix laricina), scattered maples (Acer spp.),<br />
and oaks (Quercus spp.) were also present. The remaining 20% <strong>of</strong> the island was occupied by<br />
a mixed coniferous-deciduous ecotonal zone characterized by a relatively open canopy and nu-<br />
merous climbing vines (Parthenocissus quinquefolia, Vitis spp., and Rhus radicans). Ground-<br />
cover was well developed in the mixed vegetation zone, present but less prominent in the<br />
deciduous stand, and sparse or absent under the conifers. Finally, there was a narrow strip <strong>of</strong><br />
thick shrubby vegetation consisting <strong>of</strong> dogwoods (Cornus spp.), willows (Salix spp.), and north-<br />
ern arrowwood (Viburnum recogniturn) along the perimeter <strong>of</strong> the island.<br />
Census trapping in 1975 and 1977, and preliminary trapping in 1978 indicated that the small<br />
mammal fauna on Whaley Island was depauperate. Prior to the introduction <strong>of</strong> the <strong>experimental</strong><br />
<strong>population</strong> <strong>of</strong> eastern chipmunks (Tamias striatus), the fauna was limited to red squirrels (Tam-<br />
iasciurus hudsonicus), white-footed mice (Peromyscus leucopus), meadow voles (Microtus penn-<br />
syluanicus) and short-tailed shrews (Blarina breuicauda). No predators were resident on the<br />
island, although raccoons (Procyon lotor) may occasionally swim <strong>several</strong> hundred meters from<br />
the mainland or cross over the frozen lake in winter. Weasels (Mustela frenata), skunks (Mephitis<br />
mephitis), and foxes (Vulpes vulpes and Urocyon cinereoargenteus), are also capable <strong>of</strong> crossing<br />
the lake in the winter and are common on the nearby mainland.<br />
Experimental Animals<br />
Chipmunks were trapped, marked by toe-clipping, and removed from three mainland decid-<br />
uous forest sites. All chipmunks captured at the three sites were used in the experiment, with<br />
no attempt made to equalize age and sex categories, so that the introduced <strong>population</strong> might<br />
approximate the natural situation. Forty-eight <strong>of</strong> the 85 chipmunks trapped were from the Py-
May 1981 MARES ET AL.-EXPERIMENTAL POPULATION ESTIMATION 317<br />
matuning Laboratory <strong>of</strong> Ecology (PLE) site, and 34 were from the Western Pennsylvania Con-<br />
servancy (WPC) site. These sites correspond, respectively, to the "lab" and "farm" sites <strong>of</strong> Tryon<br />
and Snyder (1973) and are extensively described in that report. Three chipmunks were also<br />
trapped at the University <strong>of</strong> Pittsburgh housing site.<br />
Based upon previous exposure to traps, the <strong>experimental</strong> <strong>population</strong> <strong>of</strong> 82 chipmunks consisted<br />
<strong>of</strong> two distinct sub<strong>population</strong>s. The WPC sub<strong>population</strong> (14A6 6, 1256 6, 9A 0 0, 12J P 9) in-<br />
cluded chipmunks from both the, WPC removal site and the University <strong>of</strong> Pittsburgh housing<br />
site, because all <strong>of</strong> these individuals had no previous exposure to traps. The PLE chipmunk<br />
sub<strong>population</strong> (12A6 6, 456 6, 14AP 9, 5J P 9) was restricted to the PLE removal site animals<br />
because these had been involved in a mark-recapture experiment and exposed to traps for at<br />
least 6 weeks. We suspected that this differential exposure to traps might cause the animals to<br />
differ in their response to traps and thus demonstrate unequal catchability. Individuals were<br />
also categorized by age and sex in order to isolate age- or sex-related trends within the subpop-<br />
ulations and the entire <strong>experimental</strong> <strong>population</strong>. All chipmunks were released on 28 June 1978<br />
at the same spot on Whaley Island.<br />
Trapping Procedures<br />
A grid system with 20-m spacing was established to encompass the entire island. Each <strong>of</strong> the<br />
194 trap stations had one hardware cloth live trap (Tryon and Snyder, 1973) baited with sunflower<br />
seeds. The traps were generally opened at 0800 h and checked at noon and 1600 h. Traps were<br />
not in operation on days with heavy rain in order to minimize mortality due to exposure. We<br />
utilized mark-release trapping during the first phase <strong>of</strong> the study and removal trapping during<br />
the second phase to compare these two techniques <strong>of</strong> small mammal <strong>estimation</strong>.<br />
Mark-release.-The grid was operated for 8 days: 29 June to 1July; 4 to 7 July; and 9 July. On<br />
1and 4 July the traps were checked only in the morning; on 9 July the traps were open all day,<br />
but checked only in the afternoon as this was also the first day <strong>of</strong> removal trapping.<br />
Chipmunk number and trap location were recorded for each captured individual, followed by<br />
release at the point <strong>of</strong> capture. These data were then examined to test the assumption <strong>of</strong> equal<br />
catchability (Orians, 1958; Seber, 1973), and were also used to calculate <strong>population</strong> estimates<br />
based on the three most widely used <strong>estimation</strong> techniques: Chapman's Modified Lincoln-Pe-<br />
tersen Estimate; the Schumacher-Eschmeyer Technique; and the Schnabel Binomial Method<br />
(Seber, 1973, pp. 59-64, 139, 140, 142). In determining confidence limits, we used the 95%<br />
limits, rather than the 90% limits recommended by Smith et al. (1975), because our study was<br />
designed to provide the best possible test <strong>of</strong> the accuracy and/or precision <strong>of</strong> the three methods<br />
by eliminating confounding natural factors.<br />
Removal.-Trapping occurred on 5 days, 9 to 13 July. Traps were open throughout the day<br />
and checked at 1600 h. Every individual captured was removed from the island. Least squares<br />
regression lines (Zippin, 1958; Sokal and Rohlf, 1969) were then computed by plotting daily<br />
captures against cumulative captures for (1)the <strong>experimental</strong> <strong>population</strong> as a whole, (2) each <strong>of</strong><br />
the two sub<strong>population</strong>s defined by previous trap exposure (PLE and WPC), (3) sex and age<br />
classes without regard to sub<strong>population</strong>, and (4) sex and age classes within each sub<strong>population</strong>.<br />
Statistical Methodology<br />
Mark-recapture.-Numerous techniques exist for estimating the actual <strong>population</strong> size (N) <strong>of</strong><br />
a species, but little information is available concerning recommendations for their usage under<br />
field conditions. We decided to examine the accuracy <strong>of</strong> three commonly used mark-recapture<br />
techniques under conditions where the actual <strong>population</strong> being estimated is fixed and known.<br />
The validity <strong>of</strong> <strong>population</strong> estimates generated by the Lincoln-Petersen, Schumacher-Esch-<br />
meyer, and Schnabel methods requires satisfying <strong>several</strong> basic assumptions (Seber, 1973): 1)<br />
<strong>population</strong> size must remain constant and therefore may not be affected by the natural processes<br />
<strong>of</strong> emigration, immigration, recruitment, and mortality; 2) marking may not affect catchability;<br />
3) marks may not be lost or go unreported upon recapture; 4) individuals must be equally<br />
catchable; 5) captured animals must be a random sample <strong>of</strong> the <strong>population</strong>. A detailed mathe-<br />
matical description <strong>of</strong> mark-recapture techniques is presented in Seber (1973); herein, we at-<br />
tempt to define each technique briefly and show its derivation and relation to other methods.<br />
Those more concerned with the actual mathematical derivations should consult original sources<br />
or Seber (1973).
318 JOURNAL OF MAMMALOGY Vol. 62, No. 2<br />
The Lincoln-Petersen Estimate, expressed in its most general form, is given by<br />
where n, is the number <strong>of</strong> individuals captured in sample i; m, is the number <strong>of</strong> marked animals<br />
captured in sample i; and M, equals the number <strong>of</strong> marked animals in the <strong>population</strong> during<br />
sample i. When the previously mentioned underlying assumptions are satisfied, the conditional<br />
distribution <strong>of</strong> m,, given n,, and Mi is the hypergeometric distribution and is defined by the<br />
quantity<br />
Chapman (1951) shows that N (the Lincoln-Petersen <strong>population</strong> estimate) is only a good estimate<br />
<strong>of</strong> N (the actual <strong>population</strong> size) if N asymptotically approaches infinity; biases are large when<br />
n, is small. When the sum <strong>of</strong> n, and Mi is greater than or equal to N, which is never actually<br />
known in natural field experiments, an exactly unbiased estimate for N is given by<br />
Because the sum <strong>of</strong> n, and Mi was greater than or nearly equal to N for most samples beyond the<br />
sixth period, we chose N* as the best estimate <strong>of</strong> N in this experiment. N* has an asymptotically<br />
normal distribution as N approaches infinity; as such<br />
N* * 1.96JV'j-<br />
is an approximate 95% confidence limit for N, where V* is the variance <strong>of</strong> the estimator N*.<br />
Because the introduced <strong>population</strong> <strong>of</strong> chipmunks (N) was not very large, the normal approxi-<br />
mation is not a satisfactory method for defining the confidence limits <strong>of</strong> N. Hence, we used a<br />
conservative binomial approximation in conjunction with the Clopper-Pearson charts (Pearson<br />
and Hartley, 1966) as suggested by Adams (1951) and Seber (1973). This may, on occasion, yield<br />
asymmetric confidence intervals.<br />
The Schnabel Method (Schnabel, 1938) is conceptually a refinement <strong>of</strong> the Lincoln-Petersen<br />
Method that incorporates information from a number <strong>of</strong> consecutive samples before amving at<br />
a <strong>population</strong> estimate. Like the Lincoln-Petersen Technique, the Schnabel Method is based upon<br />
a generalized hypergeometric model which may be approximated by the binomial distribution<br />
if the complications <strong>of</strong> sampling without replacement can be avoided. Schnabel's Binomial<br />
Estimate is nothing more than a weighted average <strong>of</strong> a number <strong>of</strong> separate Lincoln-Petersen<br />
estimates and is given by<br />
where s is the total number <strong>of</strong> sampling periods. A number <strong>of</strong> methods for determining the<br />
confidence limits for this technique exist, depending upon the value <strong>of</strong> the parameters Mi,<br />
n,, m,, and N. We chose to define our confidence intervals based upon the sum <strong>of</strong> binomial<br />
variances (Seber, 1973) because it follows analogously from our rationale <strong>of</strong> taking a weighted<br />
average <strong>of</strong> individual Lincoln-Petersen estimates. Hence,<br />
where 6 = xS<br />
niM,/ANJ, and A = xS<br />
i=2 i=2<br />
niMi.<br />
N' is, however, quite sensitive to departures from underlying assumptions, especially those<br />
referring to the random behavior <strong>of</strong> marked animals. In such cases, a mean Lincoln-Petersen<br />
Estimate [N = 9 Ni*/(S- I)], whose variance is given by<br />
i=2<br />
is a more robust estimate <strong>of</strong> N (Seber, 1973). More refined methods exist, however, to overcome<br />
the problematic randomness assumptions.
May I981 MARES ET AL.-EXPERIMENTAL POPULATION ESTIMATION 319<br />
The Schumacher-Eschmeyer Method (Schumacher and Eschmeyer, 1943) is another popular<br />
<strong>population</strong> <strong>estimation</strong> technique recommended for use when departures from randomness<br />
are probable. It is actually a least squares refinement <strong>of</strong> the binomial model used by Schnabel,<br />
where<br />
This methodology was also popularized by Hayne (1949b). Following DeLury's (1947) sug-<br />
gestion, the 100(1 - a) confidence interval for N is given by the quantity:<br />
Zmi2/ni-A<br />
(z:zir](s - 2)-I. This model is also purported to be robust with respect<br />
to deviations from the underlying assumptions.<br />
Removal method.-The Removal Method is a <strong>population</strong> <strong>estimation</strong> technique based on the<br />
assumption that the size <strong>of</strong> a sample (n,) from a <strong>population</strong> is proportional to the amount <strong>of</strong> effort<br />
put into taking the sample (Seber, 1973). In other words, a fixed trapping regime is assumed to<br />
catch a fixed proportion <strong>of</strong> the <strong>population</strong>, regardless <strong>of</strong> the size <strong>of</strong> the <strong>population</strong>. If trapping<br />
and removal is done in a sequential fashion, the yield per trap period should decrease in a linear<br />
fashion but the rate <strong>of</strong> removal should remain constant. Hjort and Ottestad (1933) first used this<br />
technique to estimate bear <strong>population</strong>s in Norway in 1914. Our study was designed to ensure<br />
a fixed trapping regime: the total number <strong>of</strong> traps and the amount <strong>of</strong> time traps remained open<br />
per trapping period remained constant throughout the removal phase.<br />
Hayne (1949b) elaborated upon the model and has shown that if the probability <strong>of</strong> capture (p)<br />
remains constant, then the expected value <strong>of</strong> ni, given that xi individuals were previously re-<br />
moved from the <strong>population</strong>, is given by<br />
As a result, plots <strong>of</strong> n, versus xi should be linear, and the x intercept provides a graphical estimate<br />
<strong>of</strong> N. Least squares linear regression techniques yield estimates for both p (probability <strong>of</strong> capture<br />
or removal rate) and N, and are given by:<br />
and<br />
N = x + (do).<br />
These <strong>population</strong> estimates derived from the Least Squares Linear Regression Method should<br />
be accurate if three basic conditions are met: 1)<strong>population</strong> size is not modified by emigration,<br />
immigration, recruitment, or mortality during the removal period; 2) each individual is equally<br />
catchable during the same period; 3) the probability <strong>of</strong> capture is constant between sampling<br />
periods. This experiment was designed to satisfy the first condition while the properties <strong>of</strong> the<br />
regression line indicate whether or not the third condition has been met. Least squares regression<br />
fits a line to the data points such that a maximum amount <strong>of</strong> variance is explained by the equation<br />
<strong>of</strong> the straight line. The correlation coefficient (r) indicates a good fit (a value <strong>of</strong> 1.00 is a perfect<br />
fit) while the coefficient <strong>of</strong> determination (r2) measures the percent <strong>of</strong> variation in the dependent<br />
variable explained by variation in the independent variable. When regression analyses are per-<br />
formed rather than correlations, analysis <strong>of</strong> variance may be used to determine the statistical<br />
significance <strong>of</strong> the regression (i.e., tests the null hypothesis that the slope <strong>of</strong> the regression line<br />
is equal to 0).If the F ratio in the test is significant, and rZis high, then it is safe to assume that<br />
the individuals being captured are being removed from the <strong>population</strong> at an equal rate estimated<br />
by the slope <strong>of</strong> the line. The validity <strong>of</strong> the second assumption can only be ascertained if the<br />
actual <strong>population</strong> size is known; this is rare in natural systems but an a priori fact in this exper-<br />
iment.<br />
The unit <strong>of</strong> effort expended in obtaining n, individuals in each sample was constant, hence,<br />
if the nis approach a normal distribution, then one can obtain 100(1- a) percent confi-<br />
dence intervals for N (t+ d, 3 N 3 f + d,) by solving for the real roots <strong>of</strong> the quadratic equation:
320 JOURNAL OF MAMMALOGY Vol.62, No. 2<br />
TABLE1.-Trapping data and <strong>population</strong> estimates for a <strong>population</strong> <strong>of</strong> 82 chipmunks.<br />
Sampling<br />
period<br />
(i) nta mib Mt" N*~ N'* Af<br />
- -<br />
1 11 0 - - - -<br />
2 4 1 11 29.00 44.00 44.00<br />
3 20 3 14 77.75 81.00 83.09<br />
4 15 6 31 72.14 78.90 78.74<br />
5 5 2 40 81.00 82.42 84.07<br />
6 19 12 43 66.69 75.25 74.19<br />
7 23 16 50 71.00 73.90 73.06<br />
8 19 15 57 71.50 73.44 72.76<br />
9 23 21 61 66.64 71.61 70.74<br />
10 11 11 63 63.00 70.52 69.54<br />
11 23 2 1 63 68.82 70.22 69.42<br />
12 22 18 65 78 89 71.54 71.10<br />
13 37 34 69 75.00 72.29 72.11<br />
anl= number <strong>of</strong> lndlvlduals captured In sample I, bm,= number <strong>of</strong> marked lndlvlduals captured In sample I, CM,=<br />
number <strong>of</strong> marked lndlv~duals In the populahon dunng sample 1, dN*= Chapman's Modlfied Llncoln-Petersen Estlmate =<br />
{[(n, + l)(M,+ l)/(m, + 1)l- I}, 'N' = Schnabel Blnomlal Eshmate = (n,~,)/$ m,, 'N = Schumacher-Eschmeyer Estl-<br />
mate = C MiPnliC m,M,<br />
i=*<br />
where<br />
,=2 1-2<br />
a2= S(n, - xi)Z - Eni(xi- X)]21~(~i<br />
- i)2{~211. -<br />
More detailed treatments are available in Leslie and Davis (19391, DeLury (1947), Chapman<br />
(1954), and Seber (1973).<br />
Mark-recapture.-Seventy-five <strong>of</strong> the 85 chipmunks released on Whaley Island<br />
were captured at least once during the mark-recapture phase; a total <strong>of</strong> 232 captures<br />
was recorded (Table 1). Three chipmunks died or were removed from the island<br />
during the study; these individuals are not included in Table 1 and were not consid-<br />
ered in the calculations <strong>of</strong> <strong>population</strong> estimates.<br />
The <strong>experimental</strong> design satisfied or closely approximated the first three previously-<br />
mentioned assumptions necessary for the proper application <strong>of</strong> mark-release tech-<br />
niques; catchability however, is a property <strong>of</strong> individual chipmunks and is impossible<br />
to control in natural <strong>population</strong>s. Leslie's test for equal catchability (Orians, 1958) was<br />
utilized to determine whether or not individuals demonstrated differential trap re-<br />
sponse (Table 2). As suspected, the <strong>experimental</strong> <strong>population</strong> was composed <strong>of</strong> animals<br />
exhibiting heterogeneous catchability ( x2= 159.43; d.f. = 81; P 6 .005).<br />
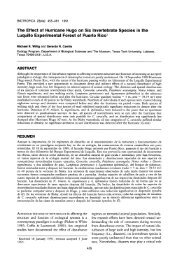
The point estimates and 95% confidence intervals for each mark-recapture popu-<br />
lation <strong>estimation</strong> method during all sample periods are shown in Fig. 1.For any mark-<br />
recapture technique, successive estimates <strong>of</strong> <strong>population</strong> size from period 2 to period<br />
13 are correlated. This serial correlation is not a problem in an <strong>experimental</strong> analysis<br />
such as this because we wish to show the precision and accuracy <strong>of</strong> each period as if<br />
it were an isolated analysis. The temporal sequence is important, however, when one<br />
wishes to know how intense a sampling regime should be before estimating popula-<br />
tion size. In general, point estimates were similar within a sample period and confi-<br />
dence intervals were large during early samples. The large initial confidence intervals<br />
may be attributed in part to small sample size and low initial recapture rates.<br />
Point estimates <strong>of</strong> <strong>population</strong> size determined by the Schnabel Method consistently
May 1981 MARES ET AL.-EXPERIMENTAL POPULATION ESTIMATION 321<br />
TABLE2.-The observed frequency distribution <strong>of</strong> recaptures for the <strong>experimental</strong> eastern<br />
chipmunk <strong>population</strong>.*<br />
Number <strong>of</strong> Observed number <strong>of</strong><br />
captures (x) individuals (fx) xfx<br />
0<br />
1<br />
2<br />
3<br />
4<br />
5<br />
6<br />
7<br />
8<br />
9<br />
10<br />
11<br />
12<br />
13<br />
Total (2)<br />
* Leslie's Test for Equal Catchability<br />
freedom:(%-1 = 81, P < ,005.<br />
degrees <strong>of</strong><br />
underestimated the true <strong>population</strong> density <strong>of</strong> chipmunks on Whaley Island. The<br />
precision <strong>of</strong> the confidence intervals for these estimates increased with sample inter-<br />
val, although the last five intervals (9 through 13) failed to include the true <strong>population</strong><br />
size.<br />
In all but two cases (samples 3 and 5), the Schumacher-Eschmeyer point estimates<br />
were also less than the <strong>population</strong>'s true size. The precision <strong>of</strong> these estimates in-<br />
creased from sample 3 to 7, after which they remained more or less constant in mag-<br />
nitude. The confidence interval for the estimate associated with sample 2 is mathe-<br />
matically undefined and not included in the analysis. The last seven confidence<br />
intervals (samples 7 to 13) did not include the <strong>population</strong>'s true density, and in fact,<br />
deviated from it more than the other two methods.<br />
The Lincoln-Petersen procedure, like the previous two methods, produced point<br />
estimates below the true <strong>population</strong> value. The confidence intervals were large for<br />
the estimates from early samples (samples 2 to 5) and leveled <strong>of</strong>f appreciably there-<br />
after. In all cases, the Lincoln-Petersen Method had larger confidence intervals than<br />
the other methods; more importantly, however, its confidence intervals included the<br />
true <strong>population</strong> value <strong>of</strong> 82 individuals.<br />
The mean Lincoln-Petersen estimate was determined by first utilizing all sampling<br />
periods, and then by only utilizing periods with five or more captures (periods 3<br />
through 13). In the first case, the 95% confidence interval for <strong>population</strong> size is given<br />
by 68 & 8.6 individuals, while in the latter case, it is given by 72.0 + 3.8. Clearly,<br />
neither point estimate is an improvement over estimates <strong>of</strong> the other methods. In both<br />
cases, the confidence intervals fail to include the true <strong>population</strong> value and as such<br />
appear to be less robust than the Lincoln-Petersen Method.<br />
Removal method.-Sixty-three <strong>of</strong> the 82 chipmunks on Whaley Island were cap-<br />
tured during 5 days <strong>of</strong> removal trapping (Table 3). The <strong>population</strong> estimate deter-<br />
mined by the Least Squares Linear Regression Method considerably underestimated<br />
the actual <strong>population</strong> size and consistently underestimated the numbers <strong>of</strong> chipmunks<br />
in both the WPC and PLE sub<strong>population</strong>s and in the various sex and age classes<br />
(Table 4). Under<strong>estimation</strong> was not a function <strong>of</strong> removal rate because the removal<br />
rates (actually rates <strong>of</strong> <strong>population</strong> change are reported, hence the negative slope)<br />
ranged from -0.682 for juveniles (e.g., juveniles were removed at a 68% rate each
JOURNAL OF MAMMALOGY Vol. 62. No. 2<br />
.-I-<br />
*-+-I<br />
I........*........I<br />
----I--<br />
I-*--4<br />
I...................... I
May 1981 MARES ET AL.-EXPERIMENTAL POPULATION ESTIMATION 323<br />
TABLE3.-Removal-trapping data for eastern chipmunks on Whaley Island by site, sex, and<br />
age.<br />
WPC site* PLE site<br />
Males Females Males Females<br />
Day Adults Juv. Adults Juv. Adults Juv. Adults Juv. Total<br />
1<br />
2<br />
3<br />
4<br />
5<br />
3<br />
3<br />
1<br />
1<br />
0<br />
1<br />
0<br />
0<br />
0<br />
0<br />
5<br />
3<br />
1<br />
1<br />
0<br />
2<br />
0<br />
1<br />
1<br />
1<br />
Total 8 1 10 5 11 11 6 11 63<br />
* See Methods for details on sources <strong>of</strong> the animals placed in the <strong>experimental</strong> <strong>population</strong><br />
period) to -0.426 for the WPC sub<strong>population</strong>, but percent under<strong>estimation</strong>s were<br />
similar for both groups (17-27%). The age and sex classes within the WPC subpop-<br />
ulation had similar removal rates, ranging from -0.419 to -0.440, and the percent<br />
under<strong>estimation</strong>s ranged from 17.1 to 39.4% (Table 5); the two most underestimated<br />
classes were also the smallest. The PLE sub<strong>population</strong> had highly variable removal<br />
rates among the different age and sex categories (-0.523 to -0.821), although the<br />
percent under<strong>estimation</strong>s were generally lower than those in the equivalent WPC<br />
classes (Table 5).<br />
The high values for the correlation coefficient within each group (Tables 4 and 5)<br />
indicate that the individuals within those categories were removed from the popula-<br />
tion at approximately equal rates throughout the removal period. However, the re-<br />
moval rates varied greatly between groups (0.421 to 0.821), but not enough to produce<br />
a low correlation coefficient for data from the entire <strong>population</strong>.<br />
The 95% confidence intervals for N were determined only for the entire <strong>population</strong>,<br />
and are given by 61.02 s N G 65.76, with a point estimate <strong>of</strong> 63.30 individuals.<br />
Within any natural <strong>population</strong>, there probably exists a continuum <strong>of</strong> degrees <strong>of</strong><br />
catchability. However, within the bounds <strong>of</strong> this study, there appears to be two bio-<br />
statistically important groups. Chipmunks that were captured more frequently during<br />
the mark-recapture phase were also, on the average, removed earlier during the re-<br />
moval phase (37 individuals removed on day one had an average <strong>of</strong> 4.03 previous<br />
captures; 14 individuals removed on day two had an average <strong>of</strong> 2.43 previous captures;<br />
6 individuals removed on day three had an average <strong>of</strong> 2.67 previous captures; 5 in-<br />
dividuals removed on day four had an average <strong>of</strong> 1.80 previous captures; 1individual<br />
removed on day five was never previously captured). It therefore appears that the<br />
chipmunk <strong>population</strong> contained two types <strong>of</strong> animals-those that were relatively easy<br />
to capture (and contribute to the high r2in regression analysis), and others that rarely<br />
entered traps. The removal rates referred to in Tables 4 and 5, then, are the removal<br />
rates for that group <strong>of</strong> chipmunks within each category that is relatively easy to trap;<br />
hence, the removal method underestimates the size <strong>of</strong> the various sub<strong>population</strong>s as<br />
well as the <strong>population</strong> as a whole. Five days <strong>of</strong> removal trapping were apparently<br />
FIG. 1.-Point <strong>population</strong> estimates and 95% confidence intervals for the Lincoln-Petersen<br />
(solid line), Schnabel (dotted line), and Schumacher-Eschmeyer (dashed line) methods. The<br />
actual <strong>population</strong> size (82 individuals) is indicated by a solid horizontal line. In general, confi-<br />
dence limits decrease with increased sampling; only the confidence intervals generated by the<br />
Lincoln-Petersen Method consistently include the actual <strong>population</strong> size.<br />
5<br />
3<br />
1<br />
2<br />
0<br />
7<br />
2<br />
2<br />
0<br />
0<br />
5<br />
1<br />
0<br />
0<br />
0<br />
9<br />
2<br />
0<br />
0<br />
0<br />
37<br />
14<br />
6<br />
5<br />
1
324 JOURNAL OF MAMMALOGY Vol. 62, No. 2<br />
TABLE4.-Least squares linear regression analyses for the entire eastern chipmunk popu-<br />
lation and its constituent classes.<br />
Site Sex Age<br />
Entire<br />
<strong>population</strong> PLE WPC Male Female Adult Juv.<br />
Correlation coefficient -0.997 -0.999 -0.993 -0.996 -0.996 -0.989 -0.992<br />
Removal rate (slope) -0.576 -0.662 -0.426 -0.496 -0.660 -0.504 -0.682<br />
Population estimate 63.26 38.99 25.48 32.31 31.29 36.28 27.22<br />
Actual <strong>population</strong> size 82 47 35 42 40 49 33<br />
Percent underestimate 22.9 17.0 27.2 23.1 21.8 26.0 17.5<br />
adequate to remove the easily trapped animals from the island. The tendency to<br />
underestimate the number <strong>of</strong> chipmunks in each group occurred because 5 days <strong>of</strong><br />
removal trapping were insufficient to trap significant numbers <strong>of</strong> individuals from the<br />
hard-to-capture portion <strong>of</strong> the <strong>population</strong>. The inability <strong>of</strong> the removal method to<br />
define accurately the true <strong>population</strong> size is not so much attributable to sex, age, or<br />
site differences among the component individuals in the <strong>experimental</strong> <strong>population</strong> as<br />
it is to the fact that all categories contain difficult-to-trap animals; this deflates the<br />
final estimate in the removal method.<br />
All <strong>of</strong> the mark-release <strong>population</strong> estimates utilized in this study possess the prop-<br />
erty <strong>of</strong> having smaller confidence limits with increasing sample size. Thus, the pre-<br />
cision <strong>of</strong> the estimate increases with increasing trapping effort, although this does not<br />
necessarily mean that the accuracy <strong>of</strong> the various techniques increases in like manner.<br />
In fact, all <strong>of</strong> the point estimates calculated during the later phases <strong>of</strong> the study for<br />
the three methods were within 25%<strong>of</strong> the actual <strong>population</strong> size. Nevertheless, there<br />
are important differences among the techniques. Our data allow us to compare their<br />
accuracy and precision and to make recommendations as to which method is the most<br />
desirable.<br />
The Schumacher-Eschmeyer Method yielded point estimates comparable to those<br />
<strong>of</strong> the other techniques, but because it is the most mathematically elaborate <strong>of</strong> the<br />
three, its confidence intervals are the narrowest and tended not to include the known<br />
<strong>population</strong> size at the 95%level. The Schnabel Binomial Technique, intermediate in<br />
mathematical sophistication between the other two methods, also possessed 95%con-<br />
TABLE5.-Least squares linear regression for WPC and PLE sub<strong>population</strong>s <strong>of</strong> the eastern<br />
chipmunk by sex and age.<br />
WPC site PLE site<br />
Sex Age Sex Age<br />
Males Females Adult Juv. Males Females Adult Juv.<br />
Correlation<br />
coefficient -0.976 -0.976 -0.976 -0.732 -0.995 -0.999 -0.990 -0.999<br />
Removal rate<br />
(slope) -0.440 -0.419 -0.440 -0.429 -0.523 -0.821 -0.582 -0.721<br />
Population<br />
estimate 9.69 15.75 19.38 5.8 22.62 17.14 17.04 22.10<br />
Actual popu-<br />
lation size 16 19 26 9 26 21 23 24<br />
Percent<br />
underestimate 39.4 17.1 25.5 35.6 13.0 18.4 25.9 7.9
May 1981 MARES ET AL.-EXPERIMENTAL POPULATION ESTIMATION 325<br />
fidence limits <strong>of</strong> intermediate width, but they too generally excluded the actual pop-<br />
ulation size. All three mark-release point estimates tended to underestimate the<br />
known <strong>population</strong> size by about 15% in the later stages <strong>of</strong> the study, and only the<br />
Lincoln-Petersen Estimate (mathematically the least complicated <strong>of</strong> the three meth-<br />
ods) always included the actual <strong>population</strong> size within its broader 95% confidence<br />
limits.<br />
Examination <strong>of</strong> Fig. 1in some detail yields a number <strong>of</strong> points. At the sixth sampling<br />
period, the Lincoln-Petersen Index gave a point estimate <strong>of</strong> 68 chipmunks, with the<br />
95% confidence interval spanning 41 to 113 animals. By the thirteenth sampling pe-<br />
riod, the point estimate had risen to 75 chipmunks, with confidence limits ranging<br />
from 70 to 88. This last estimate is exceedingly accurate and precise, but it should be<br />
noted that there is daily variation in both the point estimates and their confidence<br />
limits. Thus, the Lincoln-Petersen estimate for the twelfth sampling period was 79<br />
chipmunks, with the 95% confidence limits ranging from 68 to 108 animals. This<br />
estimate is only marginally superior to that obtained as early as the sixth sampling<br />
period. Nonetheless, it is evident that, on the average, confidence limits for the Lin-<br />
coln-Petersen Index were narrower during the later sampling periods, while point<br />
estimates approximated the known <strong>population</strong> size.<br />
Of the three techniques we examined, the Chapman Modification <strong>of</strong> the Lincoln-<br />
Petersen Index was the best technique to estimate the known <strong>population</strong> size <strong>of</strong><br />
chipmunks. It is also the simplest estimate to calculate and requires the fewest as-<br />
sumptions about the organisms in question. We feel that it is precisely this lack <strong>of</strong><br />
biological and mathematical complexity that makes this technique the most robust. In<br />
our <strong>experimental</strong> design we were able to control for immigration, emigration, repro-<br />
duction, and death; we also were able to eliminate edge effects from animals in other<br />
habitats and neighboring <strong>population</strong>s. However, we were not able to control for catch-<br />
ability, and, indeed, we determined that our <strong>experimental</strong> <strong>population</strong> was composed<br />
<strong>of</strong> individuals that were differentially trappable. Further, this unequal catchability<br />
was apparently not related to previous exposure to traps, but rather seemed to be an<br />
individual trait appearing throughout the <strong>population</strong>. It appears then that the as-<br />
sumption <strong>of</strong> equal catchability, which is a prerequisite <strong>of</strong> most mark-release tech-<br />
niques, would seldom if ever be met in a large <strong>population</strong>. Even with this assumption<br />
being violated, however, the Lincoln-Petersen Index was still able to provide an<br />
acceptable estimate <strong>of</strong> the actual <strong>population</strong> size.<br />
Of the various assumptions necessary in mark-release studies, we would suppose<br />
that immigration and emigration would be fairly well balanced over a short time<br />
period. Similarly, the processes <strong>of</strong> birth and death should be negligible over such<br />
time periods. The two remaining critical assumptions are catchability and random<br />
sampling <strong>of</strong> the <strong>population</strong>. Obviously these assumptions are not independent and a<br />
violation <strong>of</strong> one perforce indicates a violation <strong>of</strong> the other. Our field experience with<br />
many species <strong>of</strong> small mammals leads us to suggest that differential trappability is<br />
probably widespread in nature, and there is some support for this idea in the literature<br />
(Geis, 1955; Eberhardt et al., 1963; Edwards and Eberhardt, 1967; Nixon et al., 1967;<br />
Strandgaard, 1967; Gliwicz, 1970; Andrzejewski and Rajska, 1972; Perry et al., 1977;<br />
and others). Thus, this may be an important factor that is overlooked in many popu-<br />
lation studies; because <strong>of</strong> this, <strong>population</strong> <strong>estimation</strong> techniques whose precision is<br />
generated by rigorous adherence to assumptions <strong>of</strong> randomness <strong>of</strong> capture are doomed<br />
to yield results whose apparent precision is illusory.<br />
It is particularly important to recognize the unrefined nature <strong>of</strong> <strong>population</strong> esti-<br />
mation techniques that utilize mark-release data when <strong>population</strong> sizes are compared<br />
over time. For example, using the Lincoln-Petersen Technique in the current inves-<br />
tigation, we were 95% certain that the actual <strong>population</strong> size for the twelfth sampling
326 JOURNAL OF MAMMALOGY Vol. 62, No. 2<br />
period lay somewhere between 68 and 108 chipmunks. Given this broad range <strong>of</strong><br />
possibilities, it would be exceedingly difficult to discern trends <strong>of</strong> <strong>population</strong> change<br />
with any statistical reliability. Unfortunately, statistical comparisons <strong>of</strong> <strong>population</strong><br />
sizes are probably <strong>of</strong>ten based upon estimates whose underlying assumptions have<br />
been violated, thus invalidating any further analyses <strong>of</strong> these estimates. We suppose<br />
there is a tendency to choose a particular <strong>population</strong> <strong>estimation</strong> technique because it<br />
seems to yield answers <strong>of</strong> great precision which then lend themselves to further<br />
statistical comparison with <strong>estimation</strong>s obtained for other <strong>population</strong>s. However, the<br />
use <strong>of</strong> such estimates could lead to incorrect conclusions regarding the actual popu-<br />
lation sizes in two or more areas or in different time periods. The great precision <strong>of</strong><br />
the Schumacher-Eschmeyer Method, for example, could result in estimates suggesting<br />
significant differences between <strong>population</strong> sizes when, in fact, the <strong>population</strong>s do not<br />
differ in size. Utilizing the Lincoln-Petersen Index with its broader confidence limits<br />
would be more conservative, tending to make the detection <strong>of</strong> subtle differences in<br />
<strong>population</strong> size difficult.<br />
Because <strong>of</strong> the great probability <strong>of</strong> violating one or more <strong>of</strong> the underlying assump-<br />
tions that are necessary for an accurate determination <strong>of</strong> <strong>population</strong> size, we suggest<br />
that broader confidence limits are the only means <strong>of</strong> ensuring an acceptable concord-<br />
ance between the estimate and the actual <strong>population</strong> size. While this implies that<br />
small differences among estimates will be undetectable, this fact appears to be un-<br />
avoidable in studies whose accuracy depends upon numerous uncontrolled variables<br />
and unrealistic assumptions. We believe that the tenuous nature <strong>of</strong> <strong>population</strong> esti-<br />
mates must be taken into account by any investigator attempting to compare popu-<br />
lation sizes or to explain apparent, but perhaps not real, differences.<br />
Edwards and Eberhardt (1967) found that the Lincoln-Petersen Method was the<br />
most accurate <strong>estimation</strong> <strong>of</strong> a known <strong>population</strong> <strong>of</strong> cottontail rabbits, while both the<br />
Schnabel and Schumacher-Eschmeyer methods "grossly underestimated" the sample<br />
<strong>population</strong>; neither <strong>of</strong> the latter two methods included the actual <strong>population</strong> size<br />
within their 95% confidence limits. Strandgaard (1967) suggested that it was necessary<br />
to mark at least 66% <strong>of</strong> a <strong>population</strong> <strong>of</strong> roe-deer before the Lincoln-Petersen Method<br />
yielded a reliable estimate <strong>of</strong> <strong>population</strong> size. In this study, we had captured 77% <strong>of</strong><br />
the chipmunks by the ninth sampling period, whereas 88% <strong>of</strong> the <strong>population</strong> had<br />
been captured by the end <strong>of</strong> the study. Relatively good estimates were obtained by<br />
the Lincoln-Petersen Technique for all <strong>of</strong> the later periods. The percentages <strong>of</strong> ani-<br />
mals caught during sampling periods 6, 7, and 8 were 61, 70, and 74, respectively.<br />
Although the point estimate during each <strong>of</strong> these periods was comparable to that<br />
obtained during later periods, the precision <strong>of</strong> the technique at this time was low<br />
because the confidence limits were large. Thus we did not begin to get a relatively<br />
accurate and precise estimate <strong>of</strong> the <strong>population</strong> size until about 75% <strong>of</strong> the animals<br />
had been captured at least once. This fact supports the suggestion <strong>of</strong> Strandgaard<br />
(1967) that it is necessary to capture a large portion <strong>of</strong> the <strong>population</strong> under study in<br />
order to arrive at a realistic <strong>assessment</strong> <strong>of</strong> its actual size. This result also points out<br />
the need for avoiding sampling periods <strong>of</strong> very short duration during which only a<br />
small percentage <strong>of</strong> the entire <strong>population</strong> can be captured. In <strong>population</strong>s composed<br />
largely <strong>of</strong> individuals that are difficult to trap, it may not be possible to obtain a precise<br />
or accurate estimate <strong>of</strong> the <strong>population</strong> size via mark-release techniques. The length<br />
<strong>of</strong> the trapping period must be increased in order to capture a larger percentage <strong>of</strong><br />
animals; this causes the probability <strong>of</strong> violating one or more <strong>of</strong> the assumptions re-<br />
garding mortality, natality, immigration, or emigration to increase. Given such a pop-<br />
ulation, other techniques <strong>of</strong> <strong>population</strong> <strong>estimation</strong> might have to be developed or<br />
employed.<br />
Because <strong>of</strong> differences in the trappability <strong>of</strong> chipmunks within the <strong>experimental</strong>
May 1981 MARES ET AL.-EXPERIMENTAL POPULATION ESTIMATION 327<br />
<strong>population</strong>, the Removal Method <strong>of</strong> sampling was the least accurate technique we<br />
examined. The readily-trapped animals were removed early in the study, and the<br />
remaining fraction, largely composed <strong>of</strong> hard-to-catch individuals, only gradually ap-<br />
peared in the later trapping periods. Thus regression lines based on these data tended<br />
to underestimate the <strong>population</strong>. More importantly, this method yielded small con-<br />
fidence intervaIs because the readily-trapped animals were equally easily captured<br />
(i.e., there was small deviation from the calculated regression line). This resulted in<br />
the most inaccurate estimate <strong>of</strong> all the methods examined, one whose ostensive pre-<br />
cision was meaningless.<br />
In conclusion, our results suggest the following points. (1)The Removal Method <strong>of</strong><br />
<strong>population</strong> <strong>estimation</strong> should be avoided because its results are inaccurate and mis-<br />
leadingly precise. (2)The Schumacher-Eschmeyer Technique should not be used for<br />
<strong>population</strong>s <strong>of</strong> small mammals whose homogeneity <strong>of</strong> capture response is undefined.<br />
Great caution should be exercised in making statistical comparisons <strong>of</strong> <strong>population</strong><br />
estimates determined by this method because its precision may mask its lack <strong>of</strong> ac-<br />
curacy. (3) The Schnabel Technique suffers from the same limitations as the Schu-<br />
macher-Eschmeyer Method and should not be used for any species that must be<br />
enticed into entering traps. (4)The Lincoln-Petersen Index was the easiest and most<br />
accurate method <strong>of</strong> <strong>population</strong> <strong>estimation</strong> in this study. The unrefined nature <strong>of</strong> this<br />
technique contributes to its accuracy but precludes the detection <strong>of</strong> subtle differences<br />
between estimates. (5)The <strong>estimation</strong> <strong>of</strong> abundance in natural <strong>population</strong>s is subject<br />
to great inaccuracy because <strong>of</strong> the failure <strong>of</strong> mathematical assumptions to account<br />
adequately for the dynamic variability characteristic <strong>of</strong> animal <strong>population</strong>s. The ap-<br />
proximate nature <strong>of</strong> most estimates should be recognized by investigators, and great<br />
care exercised in drawing conclusions whose validity is based on the necessity <strong>of</strong><br />
obtaining a determination <strong>of</strong> abundance that is both accurate and precise. (6) Estimation<br />
techniques that incorporate variable trap response by animals need to be de-<br />
veloped before one can compare <strong>population</strong> estimates with confidence.<br />
This study would not have been possible without the tireless and "willing" help <strong>of</strong> K. Hannan,<br />
P. Schechter, P. Woo, B. Albaugh, R. Kyshakevych, A. Edwards, D. Dolhi, L. Savarese, B. Mow-<br />
der, G. Robinson, Sr. R. Romeo, and H. Hart.<br />
Special thanks are due Dr. R. T. Hartman. The McKinley Fund <strong>of</strong> the Pittsburgh Foundation<br />
supported K. E. Streilein and M. R. Willig's research time and we are particularly grateful for<br />
this assistance.<br />
LITERATURECITED<br />
ADAMS,L. 1951. Confidence limits for the Pe- tions to zoological censuses. Univ. California<br />
tersen or Lincoln index used in animal <strong>population</strong><br />
studies. J. Wildl. Mgrnt., 15:13-19.<br />
Publ. Stat., 1:131-160.<br />
-. 1954. The <strong>estimation</strong> <strong>of</strong> bioiogical<br />
ANDRZEJEWSKI,<br />
R., AND E. RAJSKA.1972. <strong>population</strong>s. Ann. Math. Stat., 25:l-15.<br />
Trappability <strong>of</strong> bank vole in pitfalls and line DELURY, D. B. 1947. On the <strong>estimation</strong> <strong>of</strong><br />
traps. Acta Theriol., 17:41-56.<br />
BLAIR, W. F. 1940. A study <strong>of</strong> prairie deerbiological<br />
<strong>population</strong>s. Biometrics, 3:145-<br />
167.<br />
mouse <strong>population</strong>s in southern Michigan. DICE, L. R. 1938. Some census methods for<br />
Amer. Midland Nat., 24:273-305.<br />
CAHALANE,V. H. 1941. A trap-removal cenmammals.<br />
J. Wildl. Mgmt., 2:119-130.<br />
-. 1941. Methods for estimating populasus<br />
study <strong>of</strong> small mammals. J. Wildl. Mgmt.,<br />
5:42-67.<br />
CALHOUN, J. B. 1948. Announcement <strong>of</strong> protions<br />
<strong>of</strong> mammaIs. J. Wildl. Mgmt., 5:398-<br />
407.<br />
EBERHARDT, L. L. 1978. Appraising variabilgram.<br />
North American census <strong>of</strong> small mammals.<br />
Rodent Ecol. Proj. Johns Hopkins<br />
Univ., 1: 1-8. (mimeo.)<br />
CHAPMAN,D. G. 1951. Some properties <strong>of</strong> the<br />
ity in <strong>population</strong> studies. J. Wildl. Mgmt.,<br />
42307-238.<br />
EBERHARDT, L., T. J. PETERLE, AND R. SCHO-<br />
FIELD. 1963. Problems in a rabbit populahypergeometric<br />
distribution with applica- tion study. Wildl. Monogr., 10:l-51.
328 JOURNAL OF MAMMALOGY Vol. 62, No. 2<br />
EDWARDS,W. R., AND L. EBERHARDT. 1967. PETERSEN, C. G. J. 1896. The yearly immi-<br />
Estimating cottontail abundance from live- gration <strong>of</strong> young plaice into the Limfjord<br />
trapping data. J. Wildl. Mgmt., 31:87-96. from the German Sea. Rept. Danish Biol.<br />
GEIS, A. D. 1955. Trap response <strong>of</strong> the cotton- Sta. for 1895, 6:l-77.<br />
tail rabbit and its effect on censusing. J.<br />
Wildl. Mgmt., 19:466472.<br />
SCHNABEL, Z. E. 1938. The <strong>estimation</strong> <strong>of</strong> the<br />
total fish <strong>population</strong> <strong>of</strong> a lake. Amer. Math.<br />
GLIWICZ, J. 1970. Relation between trappability<br />
and age <strong>of</strong> individuals in a <strong>population</strong><br />
Mon., 45:348-352.<br />
SCHUMACHER,<br />
<strong>of</strong> the bank vole. Acta Theriol., 15:15-23.<br />
HAYNE, D. W. 1949a. An examination <strong>of</strong> the<br />
1943. The <strong>estimation</strong> <strong>of</strong> fish <strong>population</strong>s in<br />
lakes and ponds. J. Tennessee Acad. Sci.,<br />
strip census method for estimating animal 18:228-249.<br />
-.<br />
<strong>population</strong>s. J. Wildl. Mgmt., 13:145-156.<br />
1949b. Two methods for estimating<br />
SEBER, G. A. F. 1973. The <strong>estimation</strong> <strong>of</strong> animal<br />
abundance. Hafner, New York, 506 pp.<br />
<strong>population</strong>s from trapping records. J. Mamm., SMITH, M. H., ET AL. 1975. Density estima-<br />
30:399411.<br />
tions <strong>of</strong> small mammal <strong>population</strong>s. Pp. 25-<br />
HJORT, J. G., AND P. OTTESTAD. 1933. The 72, in Small mammals: their productivity<br />
optimum catch. Hvalradets Skrifter, Oslo, and <strong>population</strong> dynamics (F. B. Golley, K.<br />
7:92-127.<br />
Petrusewicz, and L. Ryszkowski, eds.). Cam-<br />
JOLLY, G. M. 1963. Estimates <strong>of</strong> <strong>population</strong> bridge Univ. Press, Cambridge, 451 pp.<br />
parameters from multiple recapture data<br />
with both death and dilution-deterministic<br />
model. Biometrika, 50:113-128.<br />
SOKAL, R. R., AND F. J. ROHLF. 1969. Biometry.<br />
W. H. Freeman and Company, 776 pp.<br />
STICKEL,L. F. 1946. Experimental analysis <strong>of</strong><br />
LESLIE, P. H., AND D. H. S. DAVIS. 1939. An methods for measuring small mammal popattempt<br />
to determine the absolute number <strong>of</strong><br />
rats <strong>of</strong> a given area. J. Anim. Ecol., 8:94-113. -.<br />
ulations. J. Wildl. Mgmt., 10: 150-159.<br />
1948. The trap line as a measure <strong>of</strong><br />
LINCOLN, F. C. 1930. Calculating waterfowl small mammal <strong>population</strong>s. J. Wildl. Mgmt.,<br />
abundance on the basis <strong>of</strong> banding returns. 12:153-161.<br />
U.S. Dept. Agric. Circ., 118:14.<br />
STRANDGAARD, H. 1967. Reliability <strong>of</strong> the Pe-<br />
NIXON, C. M., W. R. EDWARDS, AND L. EBER-<br />
HARDT. 1967. Estimating squirrel abundance<br />
from livetrapping data. J. Wildl.<br />
tersen method tested on a roe-deer <strong>population</strong>.<br />
1. Wildl. Mgmt., 31543-651.<br />
TRYON, C. A., AND D. P. SNYDER. 1973. Bi-<br />
Mgmt., 31:96-101.<br />
ology <strong>of</strong> the eastern chipmunk, Tamias stria-<br />
OWNS, G. H. 1958. A capture-recapture anal- tus: life tables, age distributions, and trends<br />
ysis <strong>of</strong> a shearwater <strong>population</strong>. J. Anim. in <strong>population</strong> numbers. J. Mamm., 54:145-<br />
Ecol., 27:71-86.<br />
PEARSON,E. S., AND H. 0. HARTLEY.1966.<br />
168.<br />
YANG, K.-C, C. J. KREBS, AND B. L. KELLER.<br />
Biometrika tables for statisticians, Vol. 1. 1970. Sequential live-trapping and snap-<br />
Third ed. Cambridge Univ. Press.<br />
trapping studies <strong>of</strong> Microtus <strong>population</strong>s. J.<br />
PELIKAN, J., AND J. ZEJDA. 1962. Comparison<br />
<strong>of</strong> two methods <strong>of</strong> estimating small mammal<br />
<strong>population</strong>s. Zoologicke Listy., 11:227-242.<br />
Mamm., 51:517-526.<br />
ZIPPIN, C. 1958. The removal method <strong>of</strong> <strong>population</strong><br />
<strong>estimation</strong>. J. Wildl. Mgmt., 22:82-<br />
PERRY, H. R., JR., G. B. PARDUE, F. S. BAR-<br />
KALOW, JR., AND R. J. MONROE. 1977. Factors<br />
affecting trap responses <strong>of</strong> the gray<br />
squirrel. J. Wildl. Mgmt., 41:135-143.<br />
90.<br />
F. X., AND R. W. ESCHMEYER.<br />
Department <strong>of</strong> Biological Sciences, University <strong>of</strong> Pittsburgh, Pittsburgh, PA 15260, and Py-<br />
matuning Laboratory <strong>of</strong> Ecology, Linesville, PA 16424. Submitted 17 January 1980. Accepted<br />
26 July 1980.