Journal of Tropical Ecology (2006) - USDA Forest Service
Journal of Tropical Ecology (2006) - USDA Forest Service Journal of Tropical Ecology (2006) - USDA Forest Service
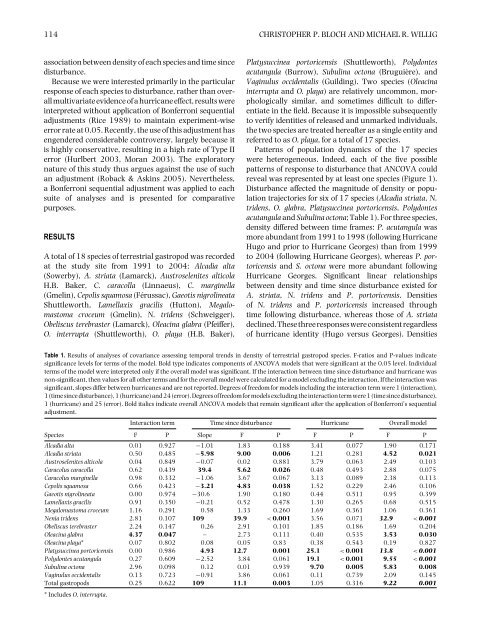
114 CHRISTOPHER P. BLOCH AND MICHAEL R. WILLIG association between density of each species and time since disturbance. Because we were interested primarily in the particular response of each species to disturbance, rather than overall multivariate evidence of a hurricane effect, results were interpreted without application of Bonferroni sequential adjustments (Rice 1989) to maintain experiment-wise error rate at 0.05. Recently, the use of this adjustment has engendered considerable controversy, largely because it is highly conservative, resulting in a high rate of Type II error (Hurlbert 2003, Moran 2003). The exploratory nature of this study thus argues against the use of such an adjustment (Roback & Askins 2005). Nevertheless, a Bonferroni sequential adjustment was applied to each suite of analyses and is presented for comparative purposes. RESULTS A total of 18 species of terrestrial gastropod was recorded at the study site from 1991 to 2004: Alcadia alta (Sowerby), A. striata (Lamarck), Austroselenites alticola H.B. Baker, C. caracolla (Linnaeus), C. marginella (Gmelin), Cepolis squamosa (Férussac), Gaeotis nigrolineata Shuttleworth, Lamellaxis gracilis (Hutton), Megalomastoma croceum (Gmelin), N. tridens (Schweigger), Obeliscus terebraster (Lamarck), Oleacina glabra (Pfeiffer), O. interrupta (Shuttleworth), O. playa (H.B. Baker), Platysuccinea portoricensis (Shuttleworth), Polydontes acutangula (Burrow), Subulina octona (Bruguière), and Vaginulus occidentalis (Guilding). Two species (Oleacina interrupta and O. playa) are relatively uncommon, morphologically similar, and sometimes difficult to differentiate in the field. Because it is impossible subsequently to verify identities of released and unmarked individuals, the two species are treated hereafter as a single entity and referred to as O. playa, for a total of 17 species. Patterns of population dynamics of the 17 species were heterogeneous. Indeed, each of the five possible patterns of response to disturbance that ANCOVA could reveal was represented by at least one species (Figure 1). Disturbance affected the magnitude of density or population trajectories for six of 17 species (Alcadia striata, N. tridens, O. glabra, Platysuccinea portoricensis, Polydontes acutangula and Subulina octona; Table 1). For three species, density differed between time frames: P. acutangula was more abundant from 1991 to 1998 (following Hurricane Hugo and prior to Hurricane Georges) than from 1999 to 2004 (following Hurricane Georges), whereas P. portoricensis and S. octona were more abundant following Hurricane Georges. Significant linear relationships between density and time since disturbance existed for A. striata, N. tridens and P. portoricensis. Densities of N. tridens and P. portoricensis increased through time following disturbance, whereas those of A. striata declined.Thesethreeresponseswereconsistentregardless of hurricane identity (Hugo versus Georges). Densities Table 1. Results of analyses of covariance assessing temporal trends in density of terrestrial gastropod species. F-ratios and P-values indicate significance levels for terms of the model. Bold type indicates components of ANCOVA models that were significant at the 0.05 level. Individual terms of the model were interpreted only if the overall model was significant. If the interaction between time since disturbance and hurricane was non-significant, then values for all other terms and for the overall model were calculated for a model excluding the interaction. If the interaction was significant, slopes differ between hurricanes and are not reported. Degrees of freedom for models including the interaction term were 1 (interaction), 1 (time since disturbance), 1 (hurricane) and 24 (error). Degrees of freedom for models excluding the interaction term were 1 (time since disturbance), 1 (hurricane) and 25 (error). Bold italics indicate overall ANCOVA models that remain significant after the application of Bonferroni’s sequential adjustment. Interaction term Time since disturbance Hurricane Overall model Species F P Slope F P F P F P Alcadia alta 0.01 0.927 −1.01 1.83 0.188 3.41 0.077 1.90 0.171 Alcadia striata 0.50 0.485 −5.98 9.00 0.006 1.21 0.281 4.52 0.021 Austroselenites alticola 0.04 0.849 −0.07 0.02 0.881 3.79 0.063 2.49 0.103 Caracolus caracolla 0.62 0.439 39.4 5.62 0.026 0.48 0.493 2.88 0.075 Caracolus marginella 0.98 0.332 −1.06 3.67 0.067 3.13 0.089 2.38 0.113 Cepolis squamosa 0.66 0.423 −3.21 4.83 0.038 1.52 0.229 2.46 0.106 Gaeotis nigrolineata 0.00 0.974 −30.6 1.90 0.180 0.44 0.511 0.95 0.399 Lamellaxis gracilis 0.91 0.350 −0.21 0.52 0.478 1.30 0.265 0.68 0.515 Megalomastoma croceum 1.16 0.291 0.58 1.33 0.260 1.69 0.361 1.06 0.361 Nenia tridens 2.81 0.107 109 39.9 < 0.001 3.56 0.071 32.9 < 0.001 Obeliscus terebraster 2.24 0.147 0.26 2.91 0.101 1.85 0.186 1.69 0.204 Oleacina glabra 4.37 0.047 – 2.73 0.111 0.40 0.535 3.53 0.030 Oleacina playa∗ 0.07 0.802 0.08 0.05 0.83 0.38 0.543 0.19 0.827 Platysuccinea portoricensis 0.00 0.986 4.93 12.7 0.001 25.1 < 0.001 13.8 < 0.001 Polydontes acutangula 0.27 0.609 −2.52 3.84 0.061 19.1 < 0.001 9.55 < 0.001 Subulina octona 2.96 0.098 0.12 0.01 0.939 9.70 0.005 5.83 0.008 Vaginulus occidentalis 0.13 0.723 −0.91 3.86 0.061 0.11 0.739 2.09 0.145 Total gastropods 0.25 0.622 109 11.1 0.003 1.05 0.316 9.22 0.001 ∗ Includes O. interrupta.
Long-term responses of snails to disturbance 115 Response variable Response variable Response variable Response variable Response variable (a) (b) (c) (d) (e) Time Time Time Time Time Density (individuals/ha) Density (individuals/ha) Density (individuals/ha) Density (individuals/ha) Variance of log density 3000 2500 2000 1500 1000 500 0 200 160 120 80 40 0 3500 3000 2500 2000 1500 1000 500 0 250 200 150 100 50 0 2.5 2.0 1.5 1.0 0.5 0.0 Gaeotis nigrolineata 1991 1992 1991 1992 1991 1992 1991 1992 1991 1992 1993 1994 1993 1994 1993 1994 1993 1994 1993 1994 1995 1996 1995 1996 1995 1996 1995 1996 1995 1996 1997 1998 Polydontes acutangula Nenia tridens Platysuccinea portoricensis Nenia tridens Figure 1. Idealized representations of possible statistical outcomes of population responses to disturbance by two hurricanes (left column), with an example of each for terrestrial gastropods on the LFDP (right column). Potential patterns are: (a) no response to disturbance (i.e. non-significant ANCOVA model), (b) mean of response variable differs between disturbances after accounting for time since disturbance (significant effect of hurricane identity), (c) consistent linear response to both disturbances (significant effect of time since disturbance), (d) both b and c simultaneously, and (e) trajectory of response depends on hurricane identity (significant interaction term). Slopes and differences in magnitude of response variables between hurricanes may be positive or negative. Error bars represent 1 SE about the mean. 1997 1998 1997 1998 1997 1998 1997 1998 Year 1999 2000 1999 2000 1999 2000 1999 2000 1999 2000 2001 2002 2001 2002 2001 2002 2001 2002 2001 2002 2003 2004 2003 2004 2003 2004 2003 2004 2003 2004
- Page 1 and 2: Journal of Tropical Ecology (2006)
- Page 3: Long-term responses of snails to di
- Page 7 and 8: Long-term responses of snails to di
- Page 9 and 10: Long-term responses of snails to di
- Page 11 and 12: Long-term responses of snails to di
114 CHRISTOPHER P. BLOCH AND MICHAEL R. WILLIG<br />
association between density <strong>of</strong> each species and time since<br />
disturbance.<br />
Because we were interested primarily in the particular<br />
response <strong>of</strong> each species to disturbance, rather than overall<br />
multivariate evidence <strong>of</strong> a hurricane effect, results were<br />
interpreted without application <strong>of</strong> Bonferroni sequential<br />
adjustments (Rice 1989) to maintain experiment-wise<br />
error rate at 0.05. Recently, the use <strong>of</strong> this adjustment has<br />
engendered considerable controversy, largely because it<br />
is highly conservative, resulting in a high rate <strong>of</strong> Type II<br />
error (Hurlbert 2003, Moran 2003). The exploratory<br />
nature <strong>of</strong> this study thus argues against the use <strong>of</strong> such<br />
an adjustment (Roback & Askins 2005). Nevertheless,<br />
a Bonferroni sequential adjustment was applied to each<br />
suite <strong>of</strong> analyses and is presented for comparative<br />
purposes.<br />
RESULTS<br />
A total <strong>of</strong> 18 species <strong>of</strong> terrestrial gastropod was recorded<br />
at the study site from 1991 to 2004: Alcadia alta<br />
(Sowerby), A. striata (Lamarck), Austroselenites alticola<br />
H.B. Baker, C. caracolla (Linnaeus), C. marginella<br />
(Gmelin), Cepolis squamosa (Férussac), Gaeotis nigrolineata<br />
Shuttleworth, Lamellaxis gracilis (Hutton), Megalomastoma<br />
croceum (Gmelin), N. tridens (Schweigger),<br />
Obeliscus terebraster (Lamarck), Oleacina glabra (Pfeiffer),<br />
O. interrupta (Shuttleworth), O. playa (H.B. Baker),<br />
Platysuccinea portoricensis (Shuttleworth), Polydontes<br />
acutangula (Burrow), Subulina octona (Bruguière), and<br />
Vaginulus occidentalis (Guilding). Two species (Oleacina<br />
interrupta and O. playa) are relatively uncommon, morphologically<br />
similar, and sometimes difficult to differentiate<br />
in the field. Because it is impossible subsequently<br />
to verify identities <strong>of</strong> released and unmarked individuals,<br />
the two species are treated hereafter as a single entity and<br />
referred to as O. playa, for a total <strong>of</strong> 17 species.<br />
Patterns <strong>of</strong> population dynamics <strong>of</strong> the 17 species<br />
were heterogeneous. Indeed, each <strong>of</strong> the five possible<br />
patterns <strong>of</strong> response to disturbance that ANCOVA could<br />
reveal was represented by at least one species (Figure 1).<br />
Disturbance affected the magnitude <strong>of</strong> density or population<br />
trajectories for six <strong>of</strong> 17 species (Alcadia striata, N.<br />
tridens, O. glabra, Platysuccinea portoricensis, Polydontes<br />
acutangula and Subulina octona; Table 1). For three species,<br />
density differed between time frames: P. acutangula was<br />
more abundant from 1991 to 1998 (following Hurricane<br />
Hugo and prior to Hurricane Georges) than from 1999<br />
to 2004 (following Hurricane Georges), whereas P. portoricensis<br />
and S. octona were more abundant following<br />
Hurricane Georges. Significant linear relationships<br />
between density and time since disturbance existed for<br />
A. striata, N. tridens and P. portoricensis. Densities<br />
<strong>of</strong> N. tridens and P. portoricensis increased through<br />
time following disturbance, whereas those <strong>of</strong> A. striata<br />
declined.Thesethreeresponseswereconsistentregardless<br />
<strong>of</strong> hurricane identity (Hugo versus Georges). Densities<br />
Table 1. Results <strong>of</strong> analyses <strong>of</strong> covariance assessing temporal trends in density <strong>of</strong> terrestrial gastropod species. F-ratios and P-values indicate<br />
significance levels for terms <strong>of</strong> the model. Bold type indicates components <strong>of</strong> ANCOVA models that were significant at the 0.05 level. Individual<br />
terms <strong>of</strong> the model were interpreted only if the overall model was significant. If the interaction between time since disturbance and hurricane was<br />
non-significant, then values for all other terms and for the overall model were calculated for a model excluding the interaction. If the interaction was<br />
significant, slopes differ between hurricanes and are not reported. Degrees <strong>of</strong> freedom for models including the interaction term were 1 (interaction),<br />
1 (time since disturbance), 1 (hurricane) and 24 (error). Degrees <strong>of</strong> freedom for models excluding the interaction term were 1 (time since disturbance),<br />
1 (hurricane) and 25 (error). Bold italics indicate overall ANCOVA models that remain significant after the application <strong>of</strong> Bonferroni’s sequential<br />
adjustment.<br />
Interaction term Time since disturbance Hurricane Overall model<br />
Species F P Slope F P F P F P<br />
Alcadia alta 0.01 0.927 −1.01 1.83 0.188 3.41 0.077 1.90 0.171<br />
Alcadia striata 0.50 0.485 −5.98 9.00 0.006 1.21 0.281 4.52 0.021<br />
Austroselenites alticola 0.04 0.849 −0.07 0.02 0.881 3.79 0.063 2.49 0.103<br />
Caracolus caracolla 0.62 0.439 39.4 5.62 0.026 0.48 0.493 2.88 0.075<br />
Caracolus marginella 0.98 0.332 −1.06 3.67 0.067 3.13 0.089 2.38 0.113<br />
Cepolis squamosa 0.66 0.423 −3.21 4.83 0.038 1.52 0.229 2.46 0.106<br />
Gaeotis nigrolineata 0.00 0.974 −30.6 1.90 0.180 0.44 0.511 0.95 0.399<br />
Lamellaxis gracilis 0.91 0.350 −0.21 0.52 0.478 1.30 0.265 0.68 0.515<br />
Megalomastoma croceum 1.16 0.291 0.58 1.33 0.260 1.69 0.361 1.06 0.361<br />
Nenia tridens 2.81 0.107 109 39.9 < 0.001 3.56 0.071 32.9 < 0.001<br />
Obeliscus terebraster 2.24 0.147 0.26 2.91 0.101 1.85 0.186 1.69 0.204<br />
Oleacina glabra 4.37 0.047 – 2.73 0.111 0.40 0.535 3.53 0.030<br />
Oleacina playa∗ 0.07 0.802 0.08 0.05 0.83 0.38 0.543 0.19 0.827<br />
Platysuccinea portoricensis 0.00 0.986 4.93 12.7 0.001 25.1 < 0.001 13.8 < 0.001<br />
Polydontes acutangula 0.27 0.609 −2.52 3.84 0.061 19.1 < 0.001 9.55 < 0.001<br />
Subulina octona 2.96 0.098 0.12 0.01 0.939 9.70 0.005 5.83 0.008<br />
Vaginulus occidentalis 0.13 0.723 −0.91 3.86 0.061 0.11 0.739 2.09 0.145<br />
Total gastropods 0.25 0.622 109 11.1 0.003 1.05 0.316 9.22 0.001<br />
∗ Includes O. interrupta.


