Huisartsgeneeskunde: aantrekkingskracht en beroepstrouw ... - Lirias
Huisartsgeneeskunde: aantrekkingskracht en beroepstrouw ... - Lirias Huisartsgeneeskunde: aantrekkingskracht en beroepstrouw ... - Lirias
10 Making General Practice Attractive: Encouraging GP attraction and Retention KCE Reports 90 The total licensed GPs increased throughout the years (from 12 292 in 1995 to 14 170 in 2005) (table 2) as well as the proportion of GPs who were inactive in the curative care. The inactivity percentage was defined as the GPs having 0 INAMI acts during the year (group nr 19 in appendix 1.8). This percentage increased for all age groups throughout the period considered (from 4% in 1995 to 12% in 2005 globally). More precisely, the increase was more noticeable for the age groups above 30 years. Indeed, between 1995 and 2005, the inactivity percentage for the age group between 30 and 39 years old increased from 4% in 1995 to 11% in 2005, while it only increased from 6% in 1995 to 9% in 2005 for the age group between 25 and 29 years. The small practices were defined as GPs who provide between 1 and 1249 acts during the observed year. The small practice percentages increased as well as the inactivity percentage in the age groups from 25 to 39 years old. Table 2: Inactivity or small practices in the curative sector for licensed GPs : numbers and percentages among potentially available GPs, by age group in 1995, 2000 and 2005. (Source: INAMI/RIZIV database, Belgium, 2007) Age groups % inactive in curative 1995 Small % inactive in Year 2000 Small % inactive in curative 2005 Small care under practice Total curative care practice Total care under practice Total AMI* percentage** GP*** under AMI* percentage** GP AMI* percentage** GP 25 - 29 6.0 41.1 470 7.3 42.3 634 8.9 50.9 440 30 - 39 3.9 15.3 4307 9.5 15.8 2951 11.0 20.8 2696 40 - 49 2.6 11.0 4496 6.9 10.7 5413 11.4 12.9 4413 50 - 59 2.6 10.6 1454 4.4 10.5 2589 7.4 11.7 4359 60 - 69 6.4 19.1 1126 10.3 17.9 1185 10.8 18.1 1265 70+ 25.1 44.6 439 36.2 34.9 702 43.5 30.3 997 total 4.3 15.6 12292 8.8 15.2 13474 12.2 16.9 14170 Source: INAMI/RIZIV (file of profiles), 2007 *The inactivity percentage is computed for MDs who do not provide any INAMI act during the observed year (group nr 19 in appendix 1.8). ** The small practice percentage concerns MDs who provide between 1 and 1249 acts during the observed year. ***The total GP concern the licensed GPs who are potentially available (those called “active”, i.e. not being dead, and not known as being out of practice, retired, living abroad, nor forbidden of practice) group nr 16 in appendix 1.8 ****Difference between the totals of table 5 and the totals of table 3 due to calculation on 2 different INAMI files (max loss/years: 9 persons). 1.4.1.3 Inactivity or small practice in the curative sector for licensed GPs under AMI: analysis by gender (INAMI/RIZIV database) Figures 1 and 2 (see appendix 1.9) detail the table 2 (above) for the percentages of GPs who are inactive in the curative sector, by gender. Figure 1 clearly shows that the inactivity percentage increased gradually for all age groups for the female GPs. However, the increase was less pronounced for the younger age groups (from 5.6% in 1995 to 10% in 2005) compared to the other age groups. The global inactivity percentage for the men also increased for all age groups (figure 2) but to a lesser extent, compared to the global inactivity percentage of the women (respectively 6% in 1995 to 15% in 2005 for the women versus 4% in 1995 to 11% in 2005 for the men). The inactivity percentage for the youngest age groups remained stable (from 6.5% in 1995 to 6% in 2005) compared to the inactivity percentage of women for the same age groups (from 5.6% in 1995 to 10% in 2005). The strong variations among this youngest age group can be explained by the small size of this group (137 men in 2005).
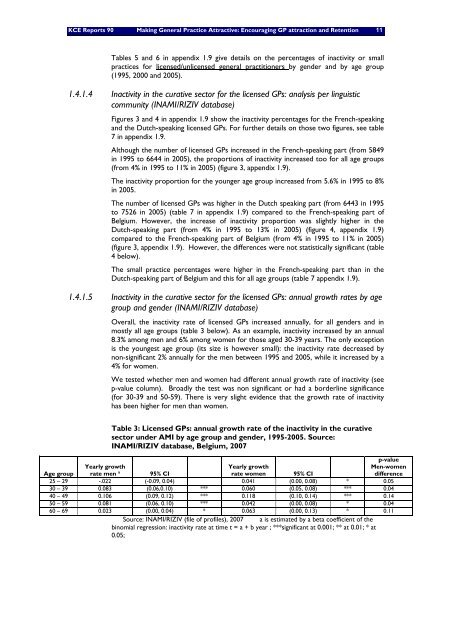
KCE Reports 90 Making General Practice Attractive: Encouraging GP attraction and Retention 11 Tables 5 and 6 in appendix 1.9 give details on the percentages of inactivity or small practices for licensed/unlicensed general practitioners by gender and by age group (1995, 2000 and 2005). 1.4.1.4 Inactivity in the curative sector for the licensed GPs: analysis per linguistic community (INAMI/RIZIV database) Figures 3 and 4 in appendix 1.9 show the inactivity percentages for the French-speaking and the Dutch-speaking licensed GPs. For further details on those two figures, see table 7 in appendix 1.9. Although the number of licensed GPs increased in the French-speaking part (from 5849 in 1995 to 6644 in 2005), the proportions of inactivity increased too for all age groups (from 4% in 1995 to 11% in 2005) (figure 3, appendix 1.9). The inactivity proportion for the younger age group increased from 5.6% in 1995 to 8% in 2005. The number of licensed GPs was higher in the Dutch speaking part (from 6443 in 1995 to 7526 in 2005) (table 7 in appendix 1.9) compared to the French-speaking part of Belgium. However, the increase of inactivity proportion was slightly higher in the Dutch-speaking part (from 4% in 1995 to 13% in 2005) (figure 4, appendix 1.9) compared to the French-speaking part of Belgium (from 4% in 1995 to 11% in 2005) (figure 3, appendix 1.9). However, the differences were not statistically significant (table 4 below). The small practice percentages were higher in the French-speaking part than in the Dutch-speaking part of Belgium and this for all age groups (table 7 appendix 1.9). 1.4.1.5 Inactivity in the curative sector for the licensed GPs: annual growth rates by age group and gender (INAMI/RIZIV database) Overall, the inactivity rate of licensed GPs increased annually, for all genders and in mostly all age groups (table 3 below). As an example, inactivity increased by an annual 8.3% among men and 6% among women for those aged 30-39 years. The only exception is the youngest age group (its size is however small): the inactivity rate decreased by non-significant 2% annually for the men between 1995 and 2005, while it increased by a 4% for women. We tested whether men and women had different annual growth rate of inactivity (see p-value column). Broadly the test was non significant or had a borderline significance (for 30-39 and 50-59). There is very slight evidence that the growth rate of inactivity has been higher for men than women. Table 3: Licensed GPs: annual growth rate of the inactivity in the curative sector under AMI by age group and gender, 1995-2005. Source: INAMI/RIZIV database, Belgium, 2007 Yearly growth Age group rate men a Yearly growth p-value Men-women 95% CI rate women 95% CI difference 25 – 29 -.022 (-0.09, 0.04) 0.041 (0.00, 0.08) * 0.05 30 – 39 0.083 (0.06,0.10) *** 0.060 (0.05, 0.08) *** 0.04 40 – 49 0.106 (0.09, 0.12) *** 0.118 (0.10, 0.14) *** 0.14 50 – 59 0.081 (0.06, 0.10) *** 0.042 (0.00, 0.08) * 0.04 60 – 69 0.023 (0.00, 0.04) * 0.063 (0.00, 0.13) * 0.11 Source: INAMI/RIZIV (file of profiles), 2007 a is estimated by a beta coefficient of the binomial regression: inactivity rate at time t = a + b year ; ***significant at 0.001; ** at 0.01; * at 0.05;
- Page 1 and 2: Huisartsgeneeskunde: aantrekkingskr
- Page 3 and 4: Huisartsgeneeskunde: aantrekkingskr
- Page 5: Layout : Van Moer Wim Brussel, 27 o
- Page 8 and 9: ii Huisartsgeneeskunde: aantrekking
- Page 10 and 11: iv Huisartsgeneeskunde: aantrekking
- Page 12 and 13: vi Huisartsgeneeskunde: aantrekking
- Page 14 and 15: viii Huisartsgeneeskunde: aantrekki
- Page 16 and 17: 2 Making General Practice Attractiv
- Page 18 and 19: 4 Making General Practice Attractiv
- Page 20 and 21: 6 Making General Practice Attractiv
- Page 22 and 23: 8 Making General Practice Attractiv
- Page 26 and 27: Age group 12 Making General Practic
- Page 28 and 29: 14 Making General Practice Attracti
- Page 30 and 31: 16 Making General Practice Attracti
- Page 32 and 33: 18 Making General Practice Attracti
- Page 34 and 35: 20 Making General Practice Attracti
- Page 36 and 37: 22 Making General Practice Attracti
- Page 38 and 39: 24 Making General Practice Attracti
- Page 40 and 41: 26 Making General Practice Attracti
- Page 42 and 43: 28 Making General Practice Attracti
- Page 44 and 45: 30 Making General Practice Attracti
- Page 46 and 47: 32 Making General Practice Attracti
- Page 48 and 49: Total 7th year students inscribed r
- Page 50 and 51: 36 Making General Practice Attracti
- Page 52 and 53: 38 Making General Practice Attracti
- Page 54 and 55: 40 Making General Practice Attracti
- Page 56 and 57: 42 Making General Practice Attracti
- Page 58 and 59: 44 Making General Practice Attracti
- Page 60 and 61: 46 Making General Practice Attracti
- Page 62 and 63: 48 Making General Practice Attracti
- Page 64 and 65: 50 Making General Practice Attracti
- Page 66 and 67: 52 Making General Practice Attracti
- Page 68 and 69: 54 Making General Practice Attracti
- Page 70 and 71: 56 Making General Practice Attracti
- Page 72 and 73: 58 Making General Practice Attracti
KCE Reports 90 Making G<strong>en</strong>eral Practice Attractive: Encouraging GP attraction and Ret<strong>en</strong>tion 11<br />
Tables 5 and 6 in app<strong>en</strong>dix 1.9 give details on the perc<strong>en</strong>tages of inactivity or small<br />
practices for lic<strong>en</strong>sed/unlic<strong>en</strong>sed g<strong>en</strong>eral practitioners by g<strong>en</strong>der and by age group<br />
(1995, 2000 and 2005).<br />
1.4.1.4 Inactivity in the curative sector for the lic<strong>en</strong>sed GPs: analysis per linguistic<br />
community (INAMI/RIZIV database)<br />
Figures 3 and 4 in app<strong>en</strong>dix 1.9 show the inactivity perc<strong>en</strong>tages for the Fr<strong>en</strong>ch-speaking<br />
and the Dutch-speaking lic<strong>en</strong>sed GPs. For further details on those two figures, see table<br />
7 in app<strong>en</strong>dix 1.9.<br />
Although the number of lic<strong>en</strong>sed GPs increased in the Fr<strong>en</strong>ch-speaking part (from 5849<br />
in 1995 to 6644 in 2005), the proportions of inactivity increased too for all age groups<br />
(from 4% in 1995 to 11% in 2005) (figure 3, app<strong>en</strong>dix 1.9).<br />
The inactivity proportion for the younger age group increased from 5.6% in 1995 to 8%<br />
in 2005.<br />
The number of lic<strong>en</strong>sed GPs was higher in the Dutch speaking part (from 6443 in 1995<br />
to 7526 in 2005) (table 7 in app<strong>en</strong>dix 1.9) compared to the Fr<strong>en</strong>ch-speaking part of<br />
Belgium. However, the increase of inactivity proportion was slightly higher in the<br />
Dutch-speaking part (from 4% in 1995 to 13% in 2005) (figure 4, app<strong>en</strong>dix 1.9)<br />
compared to the Fr<strong>en</strong>ch-speaking part of Belgium (from 4% in 1995 to 11% in 2005)<br />
(figure 3, app<strong>en</strong>dix 1.9). However, the differ<strong>en</strong>ces were not statistically significant (table<br />
4 below).<br />
The small practice perc<strong>en</strong>tages were higher in the Fr<strong>en</strong>ch-speaking part than in the<br />
Dutch-speaking part of Belgium and this for all age groups (table 7 app<strong>en</strong>dix 1.9).<br />
1.4.1.5 Inactivity in the curative sector for the lic<strong>en</strong>sed GPs: annual growth rates by age<br />
group and g<strong>en</strong>der (INAMI/RIZIV database)<br />
Overall, the inactivity rate of lic<strong>en</strong>sed GPs increased annually, for all g<strong>en</strong>ders and in<br />
mostly all age groups (table 3 below). As an example, inactivity increased by an annual<br />
8.3% among m<strong>en</strong> and 6% among wom<strong>en</strong> for those aged 30-39 years. The only exception<br />
is the youngest age group (its size is however small): the inactivity rate decreased by<br />
non-significant 2% annually for the m<strong>en</strong> betwe<strong>en</strong> 1995 and 2005, while it increased by a<br />
4% for wom<strong>en</strong>.<br />
We tested whether m<strong>en</strong> and wom<strong>en</strong> had differ<strong>en</strong>t annual growth rate of inactivity (see<br />
p-value column). Broadly the test was non significant or had a borderline significance<br />
(for 30-39 and 50-59). There is very slight evid<strong>en</strong>ce that the growth rate of inactivity<br />
has be<strong>en</strong> higher for m<strong>en</strong> than wom<strong>en</strong>.<br />
Table 3: Lic<strong>en</strong>sed GPs: annual growth rate of the inactivity in the curative<br />
sector under AMI by age group and g<strong>en</strong>der, 1995-2005. Source:<br />
INAMI/RIZIV database, Belgium, 2007<br />
Yearly growth<br />
Age group rate m<strong>en</strong> a Yearly growth<br />
p-value<br />
M<strong>en</strong>-wom<strong>en</strong><br />
95% CI<br />
rate wom<strong>en</strong> 95% CI<br />
differ<strong>en</strong>ce<br />
25 – 29 -.022 (-0.09, 0.04) 0.041 (0.00, 0.08) * 0.05<br />
30 – 39 0.083 (0.06,0.10) *** 0.060 (0.05, 0.08) *** 0.04<br />
40 – 49 0.106 (0.09, 0.12) *** 0.118 (0.10, 0.14) *** 0.14<br />
50 – 59 0.081 (0.06, 0.10) *** 0.042 (0.00, 0.08) * 0.04<br />
60 – 69 0.023 (0.00, 0.04) * 0.063 (0.00, 0.13) * 0.11<br />
Source: INAMI/RIZIV (file of profiles), 2007 a is estimated by a beta coeffici<strong>en</strong>t of the<br />
binomial regression: inactivity rate at time t = a + b year ; ***significant at 0.001; ** at 0.01; * at<br />
0.05;


