

Download het volledig rapport (120 p.) - KCE
Download het volledig rapport (120 p.) - KCE
Download het volledig rapport (120 p.) - KCE

Create successful ePaper yourself
Turn your PDF publications into a flip-book with our unique Google optimized e-Paper software.
<strong>KCE</strong> Reports 92 Nosocomial Infections in Belgium Part I 29<br />
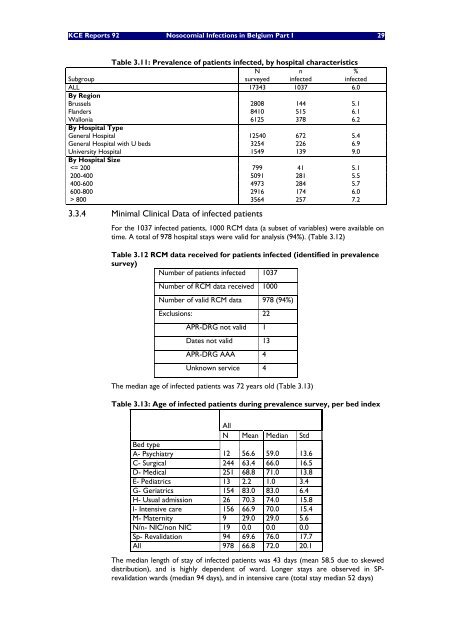
Table 3.11: Prevalence of patients infected, by hospital characteristics<br />
N<br />
n<br />
%<br />
Subgroup<br />
surveyed infected infected<br />
ALL<br />
By Region<br />
17343 1037 6.0<br />
Brussels 2808 144 5.1<br />
Flanders 8410 515 6.1<br />
Wallonia<br />
By Hospital Type<br />
6125 378 6.2<br />
General Hospital 12540 672 5.4<br />
General Hospital with U beds 3254 226 6.9<br />
University Hospital<br />
By Hospital Size<br />
1549 139 9.0<br />
800 3564 257 7.2<br />
3.3.4 Minimal Clinical Data of infected patients<br />
For the 1037 infected patients, 1000 RCM data (a subset of variables) were available on<br />
time. A total of 978 hospital stays were valid for analysis (94%). (Table 3.12)<br />
Table 3.12 RCM data received for patients infected (identified in prevalence<br />
survey)<br />
Number of patients infected 1037<br />
Number of RCM data received 1000<br />
Number of valid RCM data 978 (94%)<br />
Exclusions: 22<br />
APR-DRG not valid 1<br />
Dates not valid 13<br />
APR-DRG AAA 4<br />
Unknown service 4<br />
The median age of infected patients was 72 years old (Table 3.13)<br />
Table 3.13: Age of infected patients during prevalence survey, per bed index<br />
All<br />
N Mean Median Std<br />
Bed type<br />
A- Psychiatry 12 56.6 59.0 13.6<br />
C- Surgical 244 63.4 66.0 16.5<br />
D- Medical 251 68.8 71.0 13.8<br />
E- Pediatrics 13 2.2 1.0 3.4<br />
G- Geriatrics 154 83.0 83.0 6.4<br />
H- Usual admission 26 70.3 74.0 15.8<br />
I- Intensive care 156 66.9 70.0 15.4<br />
M- Maternity 9 29.0 29.0 5.6<br />
N/n- NIC/non NIC 19 0.0 0.0 0.0<br />
Sp- Revalidation 94 69.6 76.0 17.7<br />
All 978 66.8 72.0 20.1<br />
The median length of stay of infected patients was 43 days (mean 58.5 due to skewed<br />
distribution), and is highly dependent of ward. Longer stays are observed in SPrevalidation<br />
wards (median 94 days), and in intensive care (total stay median 52 days)


