Technology Development, Evaluation, and Application (TDEA) FY ...
Technology Development, Evaluation, and Application (TDEA) FY ...
Technology Development, Evaluation, and Application (TDEA) FY ...

Create successful ePaper yourself
Turn your PDF publications into a flip-book with our unique Google optimized e-Paper software.
LA-13924-PR<br />
Progress Report<br />
Approved for public release;<br />
distribution is unlimited.<br />
Peptide<br />
Fragment<br />
Engulfment<br />
of Particle<br />
Beryllium<br />
Particle<br />
Phagosome<br />
T Cell<br />
CD4<br />
Antigen<br />
Receptor<br />
Phagolysosome<br />
Exposed Inside<br />
Lysosome<br />
of Cell<br />
Cell<br />
Membrane<br />
<strong>Technology</strong> <strong>Development</strong>, <strong>Evaluation</strong>,<br />
<strong>and</strong> <strong>Application</strong> (<strong>TDEA</strong>)<br />
<strong>FY</strong> 2001 Progress Report<br />
Environment, Safety, <strong>and</strong> Health (ESH) Division<br />
Los Alamos National Laboratory is operated by the University of California<br />
for the United States Department of Energy under contract W-7405-ENG-36.
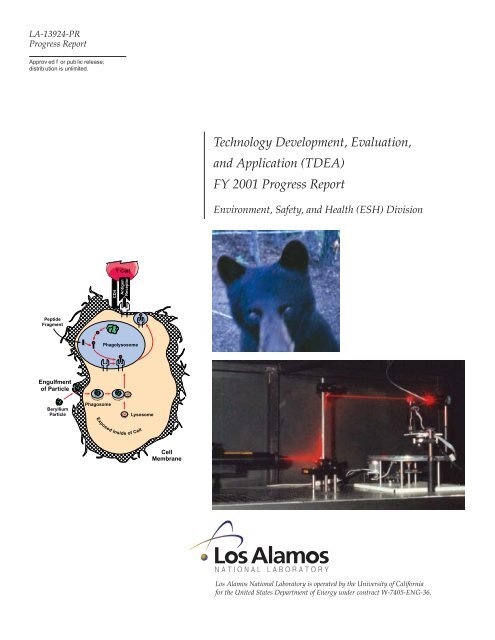
On cover at left, the diagram shows<br />
chronic beryllium disease cellular<br />
processing of particles from<br />
phagocytosis to antigen presentation.<br />
T-cell receptors are triggered when<br />
they bind with molecular antigen<br />
presented by an antigen-presenting<br />
cell, such as pulmonary alveolar<br />
machrophages.<br />
At top, an up-close picture shows a<br />
young black bear investigating the<br />
camera unit at the sampling station.<br />
A barbed-wire fur-snare appears in the<br />
background. The pictures help verify<br />
animal hair, tracks, <strong>and</strong> scat samples<br />
at the sampling station.<br />
The third photo shows the DA-LITES<br />
instrument developed in conjunction<br />
with Georgia Institute of <strong>Technology</strong>,<br />
which measures scattered laser light.<br />
Here, the instrument had the<br />
measurement photodiode mounted on a<br />
turntable that can be positioned at the<br />
desired angle. (Photo courtesy of<br />
Heather J. Gepford).<br />
Prepared by Larry G. Hoffman, Group ESH-10<br />
Edited by Earlene Hammock, Comforce, Inc., for Group IM-1<br />
Illustrations by Stacey Perez, Weirich Technical Associates, for Group IM-1, <strong>and</strong><br />
R<strong>and</strong>y Summers, Comforce, Inc., for Group IM-1<br />
Design <strong>and</strong> composition by Stacey Perez, Weirich Technical Associates, for Group IM-1<br />
Printing coordinator Guadalupe Archuleta, Group IM-4<br />
Abstract<br />
This progress report presents the results of 11 projects funded ($500K) in <strong>FY</strong>01 by the<br />
<strong>Technology</strong> <strong>Development</strong>, <strong>Evaluation</strong>, <strong>and</strong> <strong>Application</strong> (<strong>TDEA</strong>) Committee of the<br />
Environment, Safety, <strong>and</strong> Health Division (ESH). Five projects fit into the Health<br />
Physics discipline, 5 projects are environmental science <strong>and</strong> one is industrial hygiene/<br />
safety. As a result of their <strong>TDEA</strong>-funded projects, investigators have published sixteen<br />
papers in professional journals, proceedings, or Los Alamos reports <strong>and</strong> presented their<br />
work at professional meetings. Supplement funds <strong>and</strong> in-kind contributions, such as<br />
staff time, instrument use, <strong>and</strong> workspace, were also provided to <strong>TDEA</strong>-funded projects<br />
by organizations external to ESH Divisions.<br />
The four most recent reports in the unclassified series are LA-13438-PR, LA-13579-PR,<br />
LA-13766-PR, <strong>and</strong> LA-13901-PR.<br />
Photographs without negative numbers are the property of the author.<br />
An Affirmative Action/Equal Opportunity Employer<br />
This report was prepared as an account of work sponsored by an agency of the United States<br />
Government. Neither The Regents of the University of California, the United States<br />
Government nor any agency thereof, nor any of their employees, makes any warranty, express<br />
or implied, or assumes any legal liability or responsibility for the accuracy, completeness, or<br />
usefulness of any information, apparatus, product, or process disclosed, or represents that its<br />
use would not infringe privately owned rights. Reference herein to any specific commercial<br />
product, process, or service by trade name, trademark, manufacturer, or otherwise, does not<br />
necessarily constitute or imply its endorsement, recommendation, or favoring by The Regents<br />
of the University of California, the United States Government, or any agency thereof. The<br />
views <strong>and</strong> opinions of authors expressed herein do not necessarily state or reflect those of<br />
The Regents of the University of California, the United States Government, or any agency<br />
thereof. Los Alamos National Laboratory strongly supports academic freedom <strong>and</strong> a<br />
researcher's right to publish; as an institution, however, the Laboratory does not endorse the<br />
viewpoint of a publication or guarantee its technical correctness.
Contents<br />
Introduction .............................................................................1<br />
Environment<br />
A Wildfire Behavior Model for the Los Alamos Region<br />
<strong>and</strong> an <strong>Evaluation</strong> of Options for Mitigating Fire Hazards ...........4<br />
Developing Genetic Analysis Capabilities as a Tool to Manage<br />
Large Carnivore Species at LANL in Response to the Cerro<br />
Gr<strong>and</strong>e Fire <strong>and</strong> Associated Impacts ...........................................9<br />
The Effects of Depleted Uranium on Amphibian Health ............15<br />
Modification of the Los Alamos/Canberra Environmental<br />
Continuous Air Monitor (ECAM) Inlet for Enhanced<br />
Performance by Removal of Fine Particles .................................20<br />
Wildfire Effects on Contaminant Transport through<br />
Wind Erosion ...........................................................................27<br />
Health Physics<br />
Neutron Extremity Dosimetry Based on Monte Carlo<br />
Computations of Magnetic Resonance Images .........................36<br />
Laser Illuminated Track Etch Scattering (LITES)<br />
Dosimetry System ....................................................................38<br />
Personal Continuous Air Monitor (PCAM) .................................42<br />
PRESCILA: Proton Recoil Scintillator<br />
Los Alamos Neutron Rem Meter...............................................45<br />
Rapid Discrimination of Personnel Contamination Due<br />
to Radon versus Other Alpha-Emitting Radionuclides ...............53<br />
Industrial Hygiene<br />
<strong>Development</strong> of Methods for Determining Physicochemical<br />
Properties of Respirable Beryllium Aerosol Materials Associated<br />
with Chronic Beryllium Disease.................................................64<br />
Publications <strong>and</strong> Presentations ...............................................71<br />
1
Introduction<br />
The public expects that the Los<br />
Alamos National Laboratory (LANL,<br />
Laboratory) will operate in a manner that<br />
prevents negative impacts to the environment<br />
<strong>and</strong> protects the safety <strong>and</strong> health of<br />
its employees <strong>and</strong> the public. To achieve<br />
this goal within budget, the Department<br />
of Energy (DOE) <strong>and</strong> the Laboratory<br />
must develop new <strong>and</strong> improved environment,<br />
safety, <strong>and</strong> health (ES&H) technologies<br />
<strong>and</strong> implement innovative, more<br />
cost effective ES&H approaches to<br />
operations.<br />
The Environment, Health, <strong>and</strong> Safety<br />
Division (ESH) is a multifaceted division<br />
with activities <strong>and</strong> responsibilities that<br />
require technology development <strong>and</strong><br />
application in addition to the technical<br />
<strong>and</strong> operational support of Laboratory<br />
activities. Protecting the health of LANL<br />
workers <strong>and</strong> the public is a major effort<br />
with expenditures of over $60 million<br />
dollars a year. In fiscal year (<strong>FY</strong>) 95, the<br />
division established the <strong>Technology</strong><br />
<strong>Development</strong>, <strong>Evaluation</strong>, <strong>and</strong> <strong>Application</strong><br />
(<strong>TDEA</strong>) Program. The program is<br />
managed by a steering committee with<br />
members from both within ESH Division<br />
as well as outside the division.<br />
The program emphasizes cost effectively<br />
improving worker health <strong>and</strong><br />
safety by becoming more efficient,<br />
making better use of resources, <strong>and</strong><br />
addressing special needs <strong>and</strong> problems.<br />
Now in its seventh year, the program’s<br />
success can more clearly be evaluated by<br />
comparing its accomplishments with the<br />
initial <strong>TDEA</strong> Committee priorities. In the<br />
body of this report, the reader will find a<br />
mini-progress report for each ES&H<br />
discipline represented in the <strong>TDEA</strong>. The<br />
program concentrates on four topical<br />
areas: 1) dosimetry, 2) hazards protection,<br />
3) instrumentation, <strong>and</strong> 4) monitoring.<br />
However, the committee considers<br />
funding other topics that have compelling<br />
justification or significant immediate<br />
impact.<br />
In its first year, the <strong>TDEA</strong> Committee<br />
allocated $300K to support five projects<br />
for six months. Over the past seven years,<br />
this allocation has remained steady at<br />
approximately $500K per year, <strong>and</strong> the<br />
allocation supports approximately ten<br />
projects each year. From the beginning,<br />
the committee decided to limit the<br />
duration of any one project’s funding to<br />
three years. Much of the technology that<br />
has been developed from <strong>TDEA</strong>-funded<br />
projects is applied not only within the<br />
Laboratory <strong>and</strong> throughout the DOE<br />
complex, but nationally <strong>and</strong> internationally<br />
through government organizations<br />
<strong>and</strong> industry. The <strong>TDEA</strong> Committee<br />
maintains the following five program<br />
priorities.<br />
Improve ES&H protection to<br />
Laboratory workers <strong>and</strong> the public.<br />
Although all funded projects contribute to<br />
protecting workers <strong>and</strong> the public, one<br />
ongoing project in particular has the<br />
potential to contribute to an underst<strong>and</strong>ing<br />
of the workplace hazards associated<br />
with beryllium. The information gained<br />
in this study may result in improved<br />
worker protection, not just at the Laboratory,<br />
but also in the DOE complex as well<br />
as the international industrial community,<br />
<strong>and</strong> may result in establishing new<br />
st<strong>and</strong>ards.<br />
Support Laboratory mission<br />
objectives. One of the Laboratory's three<br />
mission objectives is to solve national<br />
problems in energy, environment,<br />
infrastructure, <strong>and</strong> health <strong>and</strong> safety. The<br />
Laboratory’s primary operational goal is<br />
safety. It is evident from the information<br />
provided in this report, that the <strong>TDEA</strong><br />
Program helps to directly achieve the<br />
mission objective <strong>and</strong> meet the goal in an<br />
efficient <strong>and</strong> cost effective manner.<br />
Introduction<br />
Respond <strong>and</strong> build on the unique<br />
expertise of the Laboratory <strong>and</strong><br />
Laboratory requirements. Investigators<br />
for <strong>TDEA</strong>-funded projects through the<br />
years have<br />
• developed lightweight, more<br />
sensitive instrumentation to measure<br />
worker exposure to neutrons;<br />
• applied sophisticated analytical<br />
chemistry techniques to bioassay<br />
sample measurement methods;<br />
• determined the impacts to the<br />
environment with regard to wildlife<br />
interaction within the Laboratory;<br />
• determined pressure-deformation<br />
correlation criteria to allow emergency<br />
responders to evaluate the<br />
hazards from pressurized drums;<br />
• identified methods to reduce worker<br />
exposure to internally deposited<br />
hazardous <strong>and</strong> radioactive material,<br />
developing methods to determine the<br />
properties of respirable beryllium<br />
associated with chronic beryllium<br />
disease; <strong>and</strong><br />
• evaluated the reusability of organic<br />
vapor air-purifying respirator<br />
cartridges.<br />
Achieve success within three years.<br />
This annual report summarizes the<br />
progress for the seventh year of this<br />
program. The success of the program is<br />
demonstrated by the implementation of<br />
funded project products in the workplace.<br />
We discuss successful implementation of<br />
these products in more detail in the body<br />
of this report.<br />
Find potential to transfer technologies<br />
to other DOE sites. Information <strong>and</strong><br />
methods generated by <strong>TDEA</strong>-funded<br />
projects are transferable to other DOE<br />
organizations with the same ES&H<br />
concerns. Other government organizations,<br />
universities, <strong>and</strong> private industry<br />
have also sought the developed technology.<br />
1
Introduction<br />
The <strong>FY</strong>01 projects listed by discipline<br />
include the following three categories:<br />
Environment<br />
A Wildfire Behavior Model for the<br />
Los Alamos Region <strong>and</strong> an <strong>Evaluation</strong> of<br />
Options for Mitigating Fire Hazards;<br />
Developing Genetic Analysis Capabilities<br />
as a Tool to Manage Large<br />
Carnivore Species at LANL in Response<br />
to the Cerro Gr<strong>and</strong>e Fire <strong>and</strong> Associated<br />
Impacts;<br />
The Effects of Depleted Uranium on<br />
Amphibian Health;<br />
Modification of the Los Alamos/<br />
Canberra Environmental Continuous Air<br />
Monitor (ECAM) Inlet for Enhanced<br />
Performance by Removal of Fine<br />
Particles; <strong>and</strong><br />
Wildfire Effects on Contaminant<br />
Transport through Wind Erosion.<br />
2<br />
Health Physics<br />
Neutron Extremity Dosimetry Based<br />
on Monte Carlo Computations of<br />
Magnetic Resonance Images;<br />
Laser Illuminated Track Etch Scattering<br />
(LITES) Dosimetry System;<br />
Personal Continuous Air Monitor<br />
(PCAM);<br />
PRESCILA: Proton Recoil Scintillator<br />
Los Alamos Rem Meter; <strong>and</strong><br />
Rapid Discrimination of Personnel<br />
Contamination Due to Radon versus<br />
Other Alpha-Emitting Radionuclides.<br />
Industrial Hygiene/ Safety<br />
<strong>Development</strong> of Methods for Determining<br />
Physiochemical Properties of<br />
Respirable Beryllium Aerosol Materials<br />
Associated with Chronic Beryllium<br />
Disease.<br />
The <strong>TDEA</strong> Committee evaluates<br />
<strong>TDEA</strong> Program success according to the<br />
following measures: publications <strong>and</strong><br />
presentations, cost savings, new technologies,<br />
<strong>and</strong> external support. Peer<br />
review is an important part of confirming<br />
the validity of the work. The interest<br />
from organizations external to ESH<br />
Division, especially financial support,<br />
also is a measure. However, the primary<br />
factor illustrating success is the actual<br />
application of the results of a project<br />
toward better protection of workers <strong>and</strong><br />
the environment. Measures of success,<br />
including applications of <strong>TDEA</strong>-funded<br />
project results, are discussed in the front<br />
of each topical section of this report.<br />
Projects listed under <strong>FY</strong>96 are<br />
documented in LA-13264-PR, for <strong>FY</strong>97<br />
in LA-13438-PR, <strong>FY</strong>98 in LA13579-PR,<br />
<strong>FY</strong>99 in LA-13766-PR, <strong>and</strong> <strong>FY</strong>00 in<br />
LA-13901-PR.
Studies to Date<br />
<strong>FY</strong>96<br />
Seasonal Movements, Activity Patterns,<br />
<strong>and</strong> Radionuclide Concentrations of<br />
Rocky Mountain Elk (Cervus elaphus<br />
nelsoni) <strong>and</strong> Mule Deer (Odocoileus<br />
heminous) Inhabiting the Pajarito Plateau<br />
<strong>FY</strong>97<br />
<strong>Development</strong> <strong>and</strong> <strong>Evaluation</strong> of a Radio-<br />
Frequency Identification System to<br />
Measure Time Spent by Medium-Sized<br />
Mammals at Contaminated Sites at Los<br />
Alamos National Laboratory (LANL)<br />
Seasonal Movements, Activity Patterns,<br />
<strong>and</strong> Radionuclide Concentrations of<br />
Rocky Mountain Elk (Cervus elaphus<br />
nelsoni) <strong>and</strong> Mule Deer (Odocoileus<br />
heminous) Inhabiting the Pajarito Plateau<br />
<strong>FY</strong>98<br />
Comparison of Two Permanent Plots<br />
within the 1977 La Mesa Fire <strong>and</strong><br />
Observations from the OSO Fire<br />
<strong>Development</strong> <strong>and</strong> <strong>Evaluation</strong> of a Radio-<br />
Frequency Identification System to<br />
Measure Time Spent by Medium-Sized<br />
Mammals at Contaminated Sites at Los<br />
Alamos National Laboratory (LANL)<br />
Seasonal Movements, Activity Patterns,<br />
<strong>and</strong> Radionuclide Concentrations of<br />
Rocky Mountain Elk (Cervus elaphus<br />
nelsoni) Inhabiting the Pajarito Plateau<br />
Environment<br />
A Wildfire Behavior Model for the Los Alamos Region <strong>and</strong> an <strong>Evaluation</strong> of<br />
Options for Mitigating Fire Hazards<br />
Developing Genetic Analysis Capabilities as a Tool to Manage Large<br />
Carnivore Species at LANL in Response to the Cerro Gr<strong>and</strong>e Fire <strong>and</strong><br />
Associated Impacts<br />
The Effects of Depleted Uranium on Amphibian Health<br />
Modification of the Los Alamos/Canberra Environmental Continuous Air<br />
Monitor (ECAM) Inlet for Enhanced Performance by Removal of Fine<br />
Particles<br />
Wildfire Effects on Contaminant Transport through Wind Erosion<br />
<strong>FY</strong>99<br />
A Wildfire Behavior Model for the Los<br />
Alamos Region <strong>and</strong> an <strong>Evaluation</strong> of<br />
Options for Mitigating Fire Hazards<br />
<strong>FY</strong>00<br />
A Wildfire Behavior Model for the Los<br />
Alamos Region <strong>and</strong> an <strong>Evaluation</strong> of<br />
Options for Mitigating Fire Hazards<br />
Performance <strong>Evaluation</strong> of LANL<br />
Environmental Radiological Air Monitoring<br />
Inlets at High-wind Velocities<br />
Associated with Resuspension<br />
The Effects of Depleted Uranium on<br />
Amphibian Health<br />
Summary of Progress<br />
The ESH Division <strong>TDEA</strong> program<br />
funded five environmental studies in<br />
<strong>FY</strong>01. The diverse projects resulted in 24<br />
publications <strong>and</strong> presentations with six of<br />
the papers being published in peer<br />
reviewed journals. Since 1996, a total of<br />
65 publications <strong>and</strong> presentations have<br />
resulted from environmental studies<br />
funded by <strong>TDEA</strong>. Three of the studies<br />
funded this fiscal year were a direct result<br />
of a need for information to manage the<br />
environmental effects of the Cerro<br />
Gr<strong>and</strong>e fire. The LANL Principle<br />
Investigators collaborated with state <strong>and</strong><br />
federal agencies <strong>and</strong>/or universities on<br />
each of the funded studies. The outside<br />
organizations contributed funding,<br />
personnel, <strong>and</strong> physical resources to the<br />
projects.
Environment<br />
A Wildfire Behavior Model for the Los Alamos Region <strong>and</strong> an <strong>Evaluation</strong> of<br />
Options for Mitigating Fire Hazards<br />
Principle Investigators: R<strong>and</strong>y G. Balice, Steven W. Koch, Ecology Group (ESH-20)<br />
Coinvestigators: Jack Nyhan, Sam Loftin, Patrick Valerio, Ecology Group (ESH-20); George H. Fenton, Air Quality Group (ESH-17)<br />
Funding: <strong>FY</strong>99, $93.5 K; <strong>FY</strong>00, $95.5 K; <strong>FY</strong>01, $95.9 K<br />
Matching funds: <strong>FY</strong> 1999, $15 K (U.S. Forest Service); <strong>FY</strong> 2000, $45 K (U.S. Forest Service); <strong>FY</strong> 2001, $50 K (U.S. Forest<br />
Service), $325.4 K (Facilities <strong>and</strong> Waste Operations Division, LANL)<br />
Introduction<br />
Since the occurrence of the Dome Fire<br />
in 1996, Los Alamos National Laboratory<br />
(LANL) <strong>and</strong> its neighboring l<strong>and</strong><br />
managers have become increasingly<br />
interested in protecting their resources<br />
from potential damages caused by<br />
wildfires. This awareness was significantly<br />
heightened by the Cerro Gr<strong>and</strong>e<br />
fire in early May 2000.<br />
To support LANL’s efforts to protect<br />
facilities <strong>and</strong> property from damages<br />
caused by wildfire, we conducted a threeyear<br />
project to develop a system for<br />
modeling the behavior of wildfires <strong>and</strong><br />
the potential for soil erosion in the Los<br />
Alamos region. During the first year of<br />
this project, we assembled the databases<br />
for performing these modeling tasks<br />
(Balice et al. 2000a). During the second<br />
year, we conducted sensitivity analyses<br />
<strong>and</strong> validation exercises (Balice et al.<br />
2001). The third year was devoted to<br />
updating the databases in the wake of the<br />
Cerro Gr<strong>and</strong>e fire <strong>and</strong> performing Monte<br />
Carlo simulations of fires <strong>and</strong> their<br />
economic impacts on LANL. This report<br />
is a summary of the fire behavior<br />
modeling activities conducted during the<br />
third year of this project. We conclude<br />
this report with evidence from the<br />
modeling results that previous thinning of<br />
overstocked forests at LANL reduced the<br />
expected loss to wildfire, such as the<br />
Cerro Gr<strong>and</strong>e fire, by approximately<br />
$44 M.<br />
LANL is well-suited for this type of<br />
modeling activity because of the environmental<br />
diversity throughout LANL <strong>and</strong><br />
the surrounding region (Balice et al.<br />
1997, Balice 1998), the presence of<br />
mature programs for monitoring weather<br />
4<br />
(Baars et al. 1998), soil (Nyhan et al.<br />
1978) <strong>and</strong> vegetation (Balice et al. 1999,<br />
2000b), <strong>and</strong> the availability of a strong<br />
computing <strong>and</strong> geographic information<br />
system (GIS) capability (Bennett et al.<br />
2001). We were able to combine these<br />
attributes in an optimal fashion by<br />
adopting FARSITE <strong>and</strong> the Enhanced<br />
Universal Soil Loss Equation (USLE) for<br />
modeling wildfire behavior <strong>and</strong> soil<br />
erosion, respectively. FARSITE was<br />
integrated with selected GIS data layers<br />
to interactively produce outputs of<br />
wildfire effects, such as total area burned,<br />
heat per unit area, rate of spread, <strong>and</strong><br />
occurrence of crown fires (Finney 1998).<br />
GIS data layers were also used to perform<br />
USLE estimations of annual soil erosion<br />
in tons per acre (Wischmeier <strong>and</strong> Smith<br />
1978, Nyhan <strong>and</strong> Lane 1986). The USLE<br />
results are summarized <strong>and</strong> reviewed in<br />
Nyhan et al. (2001).<br />
Methods<br />
Database development before the<br />
Cerro Gr<strong>and</strong>e Fire. The specific inputs<br />
required by FARSITE <strong>and</strong> the USLE<br />
were derived from existing, locally<br />
collected, environmental data that had<br />
been converted to spatially explicit<br />
formats (Koch <strong>and</strong> Balice 1999).<br />
FARSITE required three general types of<br />
inputs: weather, topography, <strong>and</strong> fuels.<br />
Weather data for specific time periods<br />
<strong>and</strong> locations within the Los Alamos<br />
region, including temperature, relative<br />
humidity, wind speed, <strong>and</strong> wind direction,<br />
were downloaded from the LANL<br />
Weather Machine (Air Quality Group<br />
2001). Topography, including slope,<br />
aspect, <strong>and</strong> elevation, was produced at<br />
30-meter resolution from USGS digital<br />
elevation model (DEM) data. Character-<br />
istics of fuels in vegetated areas, including<br />
the fuel model (Anderson 1982), total<br />
height of the vegetation, percent cover of<br />
the forest canopy, <strong>and</strong> height from the<br />
ground to the live forest crown were<br />
summarized from existing vegetation<br />
data that had been collected for the Los<br />
Alamos region (Balice et al. 1999,<br />
2000b). Additionally, crown bulk density<br />
information was adopted from Keane et<br />
al. (1998). Values for each of these<br />
parameters were assigned to a previously<br />
developed l<strong>and</strong> cover classification<br />
(Koch et al. 1997, Balice et al. 1997,<br />
Balice 1998). In areas that did not<br />
support vegetation, such as areas with<br />
bare rock, or with buildings, facilities <strong>and</strong><br />
paved areas of more than one acre in size,<br />
the fuel model was set to unburnable.<br />
To develop a realistic database of fire<br />
starting points within the Los Alamos<br />
region, we adopted a dataset of lightning<br />
strikes that had been organized by<br />
geographic coordinates <strong>and</strong> by signal<br />
strength (Jacobson et al. 2000, Smith et<br />
al. 2001). The time period for these data<br />
extended from April 1, 1998, to<br />
October 1, 1998. To limit the data set to<br />
lightning strikes that would occur during<br />
the wildfire season <strong>and</strong> would have<br />
sufficient energy to start a fire, we<br />
eliminated all lightning strikes after July<br />
11, as well as those with strengths less<br />
than 100 kiloamps. The resulting final<br />
dataset included 122 lightning strikes,<br />
<strong>and</strong> these were converted to ArcView<br />
shapefiles. Since the coordinates of these<br />
lightning strikes do not follow any<br />
obvious pattern, their distribution was<br />
considered as r<strong>and</strong>om.
Model validation against the Cerro<br />
Gr<strong>and</strong>e Fire. The wildfire behavior<br />
model had previously been partially<br />
validated against the TA-40 fire, which<br />
burned for 8 hours on March 22, 1996<br />
(Koch et al. 2000). The model was<br />
further validated against the Cerro<br />
Gr<strong>and</strong>e Fire. In addition to the pre-Cerro<br />
Gr<strong>and</strong>e Fire fuel <strong>and</strong> topographic data<br />
layers that had been previously developed,<br />
weather data from May 1–15, 2000,<br />
were downloaded from several LANL<br />
weather towers, including Pajarito<br />
Mountain, TA-6, TA-49, <strong>and</strong> TA-54. In<br />
addition, fuel-moisture data that were<br />
collected by B<strong>and</strong>elier National Monument<br />
<strong>and</strong> by the U.S. Forest Service<br />
immediately preceding <strong>and</strong> during the<br />
Cerro Gr<strong>and</strong>e Fire were also incorporated<br />
into the modeling system. Then, three<br />
segments of the Cerro Gr<strong>and</strong>e Fire were<br />
selected for further modeling:<br />
1) the Sunday, May 7, segment that<br />
occurred in the upper Sierra de los Valles<br />
between Water Canyon <strong>and</strong> Pajarito<br />
Canyon, 2) the Wednesday, May 10,<br />
segment along the western portions of the<br />
Los Alamos townsite, <strong>and</strong> 3) the Thursday,<br />
May 11, segment that burned on<br />
LANL between S-Site <strong>and</strong> TA-18. Each<br />
of these segments was modeled under<br />
constant conditions except for iterations<br />
of weather data from the four weather<br />
towers.<br />
Database revisions after the Cerro<br />
Gr<strong>and</strong>e Fire. The Cerro Gr<strong>and</strong>e Fire had<br />
profound effects on the fuel structures in<br />
the Los Alamos region <strong>and</strong> it is now<br />
desirable to revise <strong>and</strong> update the input<br />
data layers for the modeling system to<br />
reflect these changes. The revised data<br />
will allow comparisons of fire behaviors<br />
<strong>and</strong> soil-erosion potentials before <strong>and</strong><br />
after the Cerro Gr<strong>and</strong>e fire, <strong>and</strong> will<br />
address the current post-fire hazards. To<br />
revise the fuels data layers, we focused<br />
on the primary first-order impacts of the<br />
Cerro Gr<strong>and</strong>e Fire, which were to the<br />
vegetation cover. First, we adopted the<br />
Burned Area Emergency Rehabilitation<br />
Team burn-severity maps that classified<br />
burn severities into high, moderate, low,<br />
<strong>and</strong> unburned (Interagency BAER Team<br />
2000). Second, we incorporated data<br />
collected in the field during the summer<br />
of 2000. From preliminary analyses of<br />
these field data, we learned that areas<br />
with high-burn severity contained<br />
virtually no fuels during the first summer<br />
after the fire. In contrast, the fuel levels<br />
of areas with moderate- or low-burn<br />
severities were similar to pre-Cerro<br />
Gr<strong>and</strong>e fire conditions. As a result of<br />
these field observations, we set the areas<br />
that were burned at high severity during<br />
the Cerro Gr<strong>and</strong>e Fire to unburnable. In<br />
contrast, fuel levels of areas that were<br />
burned with low or moderate severities<br />
were left unchanged from prefire<br />
conditions.<br />
Monte Carlo simulations of<br />
expected loss to LANL from wildfire.<br />
We performed repeated simulations of<br />
wildfires to estimate the potential or<br />
expected impacts to LANL before <strong>and</strong><br />
after the application of thinning treatments<br />
to LANL forests. These simulations<br />
used the r<strong>and</strong>omly distributed<br />
lightning strikes as starting points.<br />
Wildfires were initiated at the 122<br />
lightning strike locations <strong>and</strong> allowed to<br />
burn from 8:00 A.M. to 8:00 P.M., a<br />
12-hour period, under both pre-thinning<br />
<strong>and</strong> post-thinning conditions. The outputs<br />
from the pre-thinning simulations were<br />
used to calculate the average expected<br />
loss (AEL ) to LANL, <strong>and</strong> these results<br />
pre<br />
were combined with outputs from<br />
identical simulations under post-thinning<br />
conditions (AEL ) to calculate the<br />
post<br />
reduced expected loss (REL) to LANL.<br />
For these wildfire simulations, we<br />
utilized the weather conditions that were<br />
recorded during Sunday, May 7, 2000, at<br />
the weather towers on Pajarito Mountain<br />
<strong>and</strong> at TA-6. The weather data from<br />
Pajarito Mountain were used for all<br />
mountainous terrain to the west of<br />
LANL, whereas the weather data from<br />
TA-6 were used for LANL <strong>and</strong> townsite<br />
property. From a wildfire st<strong>and</strong>point, the<br />
weather <strong>and</strong> fuel moisture conditions<br />
recorded at these towers on May 7, 2000,<br />
were severe <strong>and</strong> similar to those experienced<br />
during the Dome Fire of 1996. In<br />
contrast, these weather conditions are not<br />
as extreme as those experienced on<br />
Wednesday, May 10, 2000.<br />
Environment<br />
Using the lightning-strike locations as<br />
ignition points <strong>and</strong> the weather <strong>and</strong> fuel<br />
moisture conditions recorded during the<br />
Cerro Gr<strong>and</strong>e Fire, in combination with<br />
the pre-Cerro Gr<strong>and</strong>e Fire data layers, we<br />
simulated wildfires in the LANL region<br />
<strong>and</strong> calculated the pre-treatment average<br />
expected loss (AEL ) to LANL from<br />
pre<br />
wildfire:<br />
AELpre = —<br />
1 {∑ S(n) + ∑∑ In,x [(F(x) + R(x)]}<br />
N n∈N n∈N x∈X<br />
(1)<br />
where, S(n) = cost of wildfire suppression<br />
activities during the nth wildfire,<br />
I = indicator variable of damage or<br />
n,x<br />
severe destruction to facility x during<br />
wildfire n,<br />
F(x) = replacement value of facility x,<br />
including the value of its contents, <strong>and</strong><br />
R(x) = burdened costs of LANL<br />
employees populating facility x.<br />
The cost of wildfire suppression [S(n)]<br />
was determined by multiplying the<br />
acreage of the nth simulated wildfire by<br />
the average cost of suppression. The<br />
average cost of suppression, $125 per<br />
acre, was calculated from data reported<br />
for the time period from 1994 to 2000 by<br />
the National Interagency Fire Center<br />
(NIFC 2001). The number of facilities or<br />
buildings burned for each simulated fire<br />
was determined by superimposing the<br />
12-hour fire perimeter output from the<br />
fire model upon the GIS data layer of<br />
burnable LANL facilities. For each of<br />
these facilities, the indicator variable of<br />
damage (I ) was set to 1. Otherwise, I n,x n,x<br />
remained set at 0. The replacement values<br />
of each facility [F(x)] <strong>and</strong> its occupancy<br />
of LANL employees were obtained from<br />
a 2001 summarization for LANL<br />
compiled by the Site <strong>and</strong> Project Planning<br />
Group (SPPG 2001). This assumes<br />
that the facility would be closed during<br />
<strong>and</strong> after the wildfire, but would be<br />
essentially undamaged by the fire itself.<br />
To calculate the cost of lost income for<br />
each facility [R(x)], we first assumed that<br />
facility x would be closed for one month<br />
after the fire or that the LANL employees<br />
who work in facility x would be displaced<br />
for one month before being relocated to<br />
another LANL workplace. Then, we<br />
multiplied the number of LANL employ-<br />
5
Environment<br />
ees working in facility x by an estimate of<br />
the average monthly burdened cost to<br />
LANL for each employee, $20 K.<br />
To calculate the reduced expected loss<br />
(REL) to LANL, we adopted the GIS data<br />
layer of forested <strong>and</strong> wooded areas on<br />
LANL property that had been thinned<br />
before the Cerro Gr<strong>and</strong>e fire. These<br />
areas, which include a total of approximately<br />
800 acres, had been thinned from<br />
1997 to 2000 in accordance with the<br />
fuel-break prescription outlined in the<br />
Wildfire Hazard Reduction Program<br />
(DOE LAAO 2000). Based on field data<br />
collected in these fuel breaks, we reduced<br />
the canopy cover values by 50 percent<br />
<strong>and</strong> increased the distances between the<br />
ground fuels <strong>and</strong> the crown fuels by 25<br />
percent. Next, we repeated the 122<br />
simulations that had been used to<br />
calculate AEL , with the exception that<br />
pre<br />
the addition of fuel breaks in previously<br />
unthinned forests during these simulations<br />
resulted in a post-treatment average<br />
expected loss (AEL ) to LANL. Finally,<br />
post<br />
these intermediate results, along with the<br />
cost of thinning the forest to fuel break<br />
specifications (C), were used to calculate<br />
the reduced expected loss (REL) according<br />
to<br />
6<br />
REL = AEL – (AEL +C)<br />
pre post<br />
(2)<br />
where AEL pre = the pre-thinning average<br />
expected loss from wildfire,<br />
AEL post = the post-thinning average<br />
expected loss from wildfire, <strong>and</strong><br />
C = the cost of thinning the forests <strong>and</strong><br />
woodl<strong>and</strong>s to fuel break specifications.<br />
Progress <strong>and</strong> Results<br />
Model validation against the Cerro<br />
Gr<strong>and</strong>e Fire. The Pajarito Tower<br />
weather data modeled the Sunday,<br />
May 7, segment with high fidelity. In<br />
contrast, weather data from the TA-6,<br />
TA-49, <strong>and</strong> TA-54 weather towers did<br />
not faithfully model the Sunday, May 7,<br />
segment. Similarly, the Wednesday,<br />
May 10, segment was modeled most<br />
successfully with the Pajarito Tower<br />
weather data, <strong>and</strong> the Thursday, May 11,<br />
segment was modeled most successfully<br />
with the TA-49 weather data. Substitu-<br />
tion of weather data from alternate towers<br />
for modeling of these fires produced less<br />
desirable results. In all cases, the weather<br />
data that contributed to successful<br />
modeling of individual fire segments was<br />
gathered from the weather tower closest<br />
to the starting point for that segment, less<br />
than 2 miles. Substitution of weather data<br />
from other towers, even those that were<br />
not more than 5 miles distant from the<br />
starting point, produced less desirable<br />
results. These results emphasized the<br />
importance of using locally gathered data<br />
to successful fire behavior modeling.<br />
Monte Carlo simulations of<br />
expected loss to LANL from wildfire.<br />
Of the 122 lightning-strike ignition<br />
points, 26 occurred on bare rock, buildings,<br />
parking lots, or other unburnable<br />
locations <strong>and</strong>, therefore, did not produce<br />
a measurable simulated fire. An additional<br />
49 simulated fires did not burn on<br />
LANL property <strong>and</strong> were eliminated<br />
from further consideration. Of the<br />
remaining 47 simulated wildfires, the<br />
average area burned per fire was 1594<br />
acres before thinning <strong>and</strong> 914 acres after<br />
thinning (Table 1). This represents a 43<br />
percent reduction in the average number<br />
of acres burned. Similarly, the average<br />
number of buildings affected by the 47<br />
fires was reduced from 69 to 31, a 55<br />
percent reduction. The number of LANL<br />
employees per fire that were displaced<br />
was also reduced from 177 to 45.<br />
Table 1. Average per-fire results of pre-thinning <strong>and</strong> post-thinning simulations (N = 47).<br />
Table 2. Cost components of AEL pre <strong>and</strong> AEL post in $M.<br />
The calculated pre-thinning <strong>and</strong> postthinning<br />
components of the AEL are<br />
shown in Table 2. In each case, the cost<br />
of burned buildings (X) is the primary<br />
contributor to the respective AEL. The<br />
costs of fire suppression (S) <strong>and</strong> income<br />
losses (R) are relatively less important.<br />
The cost of thinning 800 acres of<br />
forests <strong>and</strong> woodl<strong>and</strong>s at LANL to<br />
fuel-break specifications (C) was<br />
approximately $2.5M. Using this value<br />
<strong>and</strong> the simulated results for AEL <strong>and</strong> pre<br />
AEL (Table 2), the REL calculates as<br />
post<br />
follows:<br />
REL = $78.66 M – ($32.35 M + $2.50 M) = $43.81 M.<br />
(3)<br />
Thus, after a $2.5M investment in<br />
thinning, the average cost to LANL,<br />
based on 47 wildfires that each burned<br />
for 12 hours under typical weather<br />
conditions, would be reduced by approximately<br />
$44M. This represents a more<br />
than 17-fold return on the original<br />
investment.<br />
Intermediate result Pre-thinning Post-thinning<br />
Acreage of fires 1594 914<br />
Number of buildings affected 69 31<br />
Number of displaced employees 177 45<br />
Component Pre-thinning Post-thinning<br />
Fire suppression (S) $ 0.20 $ 0.11<br />
Burned buildings ( X) $74.92 $31.33<br />
Income losses (R) $ 3.54 $ 0.90<br />
AEL $78.66 $32.35
Conclusions <strong>and</strong> Deliverables<br />
Deliverables. As originally proposed<br />
in this project, we have produced a fully<br />
functioning, validated system for<br />
modeling wildfire behaviors <strong>and</strong> soil<br />
erosion potentials in the Los Alamos<br />
region. This modeling system was used<br />
successfully to complete Monte Carlo<br />
simulations of expected loss to LANL<br />
from wildfires. We have also applied the<br />
modeling system to comparative analyses<br />
of soil-erosion potentials before <strong>and</strong> after<br />
the Cerro Gr<strong>and</strong>e fire (Nyhan et al.<br />
2001). The system will continue to be<br />
available for future research <strong>and</strong> management<br />
activities related to wildfire <strong>and</strong> soil<br />
erosion.<br />
Assumptions <strong>and</strong> availability of<br />
data for simulations. Given the assumptions<br />
<strong>and</strong> the data available for this<br />
analysis, the results of the Monte Carlo<br />
simulations appear to be conservative.<br />
First, a total of 1035 buildings <strong>and</strong><br />
structures burned at least once during the<br />
47 simulated wildfires. However,<br />
replacement values for only 531 of these<br />
structures were available (Site <strong>and</strong><br />
Project Planning Group 2001). Therefore,<br />
the values of 504 buildings <strong>and</strong> structures<br />
were not included in the AEL calculations,<br />
even though they were likely to<br />
have burned or been damaged by<br />
wildfires. Second, conservatism is<br />
introduced by the replacement values of<br />
the buildings, which do not include the<br />
values of the contents of these buildings.<br />
Third, the results are conservative if one<br />
considers that the simulations were<br />
limited to 12 hours, whereas the Cerro<br />
Gr<strong>and</strong>e Fire actively burned on LANL<br />
property for several days. This is consistent<br />
with the most credible wildfire<br />
scenario that assumes that catastrophic<br />
wildfires will burn for up to one week<br />
(Balice et al. 1997).<br />
Locally collected data <strong>and</strong> robust<br />
modeling. This project demonstrates the<br />
validity of our approach that uses<br />
detailed, locally collected data for<br />
parameterizing models of wildfire<br />
behavior <strong>and</strong> soil erosion. The importance<br />
of obtaining accurate, precise, <strong>and</strong><br />
relevant data to ensure robust modeling is<br />
supported by similar results generated<br />
elsewhere in the western United States<br />
(Keane et al. 1998, Keane et al. 2000).<br />
The disadvantages of using these kinds of<br />
data are that they can be expensive to<br />
obtain <strong>and</strong> are available to the modeling<br />
team only after extensive fieldwork <strong>and</strong><br />
laboratory analyses are completed.<br />
Another consequence of using locally<br />
collected data is that the associated model<br />
data layers may require frequent revisions<br />
as new information becomes available,<br />
or, in our case, as post-fire environmental<br />
conditions change <strong>and</strong> as ecosystem<br />
recovery occurs within the study region<br />
of interest.<br />
Importance of reducing fuels in fire<br />
hazard management. We also provided<br />
additional support for the importance of<br />
active <strong>and</strong> aggressive management of<br />
forests to protect LANL from wildfires.<br />
Of the three components of the fire<br />
triangle, fuel, heat <strong>and</strong> ignition, only fuels<br />
can be conveniently manipulated <strong>and</strong><br />
managed in a typical wildfire scenario<br />
(Balice et al. 1997). At LANL, fuels are<br />
represented by trees, which can only be<br />
reduced by thinning <strong>and</strong> removal. These<br />
thinning treatments should be completed<br />
well before the onset of a wildfire season<br />
for the full benefits.<br />
On the other h<strong>and</strong>, thinning treatments<br />
do not have to be severe to significantly<br />
reduce fire hazards. In the example of<br />
this modeling exercise, thinning 800<br />
acres of forested l<strong>and</strong> to average densities<br />
of 50 to 150 trees per acre significantly<br />
reduced the number of facilities <strong>and</strong><br />
buildings damaged or destroyed by<br />
wildfire.<br />
References<br />
Air Quality Group, The LANL weather<br />
machine: raw data request form. Web<br />
page (http://weather.lanl.gov/cgi-bin/<br />
datarequest) maintained by the Air<br />
Quality Group (ESH-17), Los Alamos<br />
National Laboratory (2001).<br />
Anderson, H.E., Aids to determining fuel<br />
models for estimating fire behavior.<br />
General Technical Report INT-122,<br />
USDA Forest Service, Intermountain<br />
Forest <strong>and</strong> Range Experiment Station,<br />
Ogden, UT (1982).<br />
Environment<br />
Baars, J., D. Holt, <strong>and</strong> G. Stone, “Meteorological<br />
monitoring at Los Alamos.”<br />
Los Alamos National Laboratory, report<br />
LA-UR-98-2148 (1998).<br />
Balice, R.G., “A preliminary survey of<br />
terrestrial plant communities in the Sierra<br />
de los Valles.” Los Alamos National<br />
Laboratory, report LA-13523-MS (1998).<br />
Balice, R.G., S.G. Ferran, <strong>and</strong> T.S. Foxx,<br />
“Preliminary vegetation <strong>and</strong> l<strong>and</strong> cover<br />
classification for the Los Alamos<br />
Region.” Los Alamos National<br />
Laboratory, report LA-UR-97-4627<br />
(1997).<br />
Balice, R.G., B.P. Oswald <strong>and</strong> C. Martin,<br />
“Fuels inventories in the Los Alamos<br />
National Laboratory Region: 1997.”<br />
Los Alamos National Laboratory, report<br />
LA-13572-MS (1999).<br />
Balice, R.G., S.W. Koch, P. Valerio, S.<br />
Loftin, <strong>and</strong> J. Baars, 2000a. “A wildfire<br />
behavior model for the Los Alamos<br />
Region <strong>and</strong> an evaluation of options for<br />
mitigating fire hazards.” <strong>Technology</strong>,<br />
<strong>Development</strong>, <strong>Evaluation</strong> <strong>and</strong> Assessment<br />
(<strong>TDEA</strong>) <strong>FY</strong> 1999 Progress Report.<br />
Los Alamos National Laboratory,report<br />
LA-13766-PR (1999).<br />
Balice, R.G., J.D. Miller, B.P. Oswald, C.<br />
Edminster <strong>and</strong> S.R. Yool, 2000b. “Forest<br />
surveys <strong>and</strong> wildfire assessment in the<br />
Los Alamos region, 1998-1999,”<br />
Los Alamos National Laboratory, report<br />
LA-12714-MS (2000).<br />
Balice, R.G., S.W. Koch, P. Valerio, S.<br />
Loftin, J.W. Nyhan, <strong>and</strong> G. Fenton.,<br />
“A wildfire behavior model for the Los<br />
Alamos Region <strong>and</strong> an evaluation of<br />
options for mitigating fire hazards,”<br />
<strong>Technology</strong>, <strong>Development</strong>, <strong>Evaluation</strong><br />
<strong>and</strong> Assessment (<strong>TDEA</strong>) <strong>FY</strong> 2000<br />
Progress Report. Los Alamos National<br />
Laboratory, report LA-13901-PR (2002).<br />
7
Environment<br />
Bennett, K., S.W. Koch, S. Gebhardt, M.<br />
Wright <strong>and</strong> W. Red Star, “GIS applications<br />
within the Ecology Group of<br />
LANL.” Los Alamos National<br />
Laboratory, report LA-UR-01-1209<br />
(2001).<br />
DOE LAAO, “Environmental Assessment<br />
for the Wildfire Hazard Reduction<br />
<strong>and</strong> Forest Health Improvement Program<br />
at Los Alamos National Laboratory,” Los<br />
Alamos, New Mexico. DOE-EA-1329,<br />
prepared by Department of Energy, Los<br />
Alamos Area Office, (2000).<br />
Finney, M.A., FARSITE: Fire area<br />
simulator model development <strong>and</strong><br />
evaluation. Research Paper RMRS-RP-4,<br />
USDA Forest Service, Rocky Mountain<br />
Research Station, Fort Collins, CO.<br />
(1998).<br />
Interagency BAER Team, Cerro Gr<strong>and</strong>e<br />
Fire burned area emergency rehabilitation<br />
(BAER) plan. Prepared by the<br />
Interagency BAER Team, Los Alamos,<br />
NM. (2000).<br />
Jacobson, A.R., K.L. Cummins,<br />
M. Carter, P. Klingner, D. Roussel-<br />
Dupré, <strong>and</strong> S.O. Knox, “FORTE radiofrequency<br />
observations of lightning<br />
strokes detected by the National Lightning<br />
Detection Network.” J. Geophys.<br />
Res. 105 (D12), 15,653-15,662. (2000).<br />
Keane, R.E., J.L. Garner, K.M. Schmidt,<br />
D.G. Long, J.P. Menakis, <strong>and</strong><br />
M.A. Finney, “<strong>Development</strong> of input<br />
data layers for FARSITE fire growth<br />
model for the Selway-Bitterroot Wilderness<br />
Complex, USA,” General Technical<br />
Report RMRS-GTR-3, USDA Forest<br />
Service, Rocky Mountain Research<br />
Station, Ogden, UT. (1998).<br />
Keane, R.E., S.A. Mincemoyer,<br />
K.M. Schmidt, D.G. Long, <strong>and</strong><br />
J.L. Garner, “Mapping vegetation <strong>and</strong><br />
fuels for fire management on the Gila<br />
National Forest Complex, New Mexico,”<br />
General Technical Report RMRS-GTR-<br />
46-CD, USDA Forest Service, Rocky<br />
Mountain Research Station, Ogden, UT.<br />
(2000).<br />
8<br />
Koch, S.W. <strong>and</strong> R.G. Balice, “Input data<br />
development for the FARSITE fire area<br />
simulator for the Los Alamos National<br />
Laboratory Region.” Presented at the<br />
ESRI User Conference, San Diego,<br />
June 26, 1999.<br />
Koch, S.W., T.K. Budge, <strong>and</strong><br />
R.G. Balice, “<strong>Development</strong> of a l<strong>and</strong><br />
cover map for Los Alamos National Lab<br />
<strong>and</strong> vicinity.” Los Alamos National<br />
Laboratory, report LA-UR-97-4628<br />
(1997).<br />
Koch, S.W, R.G. Balice, J.W. Nyhan, <strong>and</strong><br />
S.R. Loftin, “Validation <strong>and</strong> sensitivity<br />
analyses of a wildfire behavior model,”<br />
presented at the ESH Division Review<br />
Committee Meeting, Los Alamos<br />
National Laboratory, April 11–13, 2000.<br />
NIFC, “Wildl<strong>and</strong> Fire Statistics.” Web<br />
page (http://www.nifc.gov/stats) maintained<br />
by the National Interagency Fire<br />
Center, Boise, ID (2001).<br />
Nyhan, J.W. <strong>and</strong> L.J. Lane, “Erosion<br />
control technology: a user’s guide to the<br />
use of the universal soil loss equation at<br />
waste burial facilities,” Los Alamos<br />
National Laboratory, report LA-6779-MS<br />
(1986).<br />
Nyhan, J.W., L.W. Hacker, T.E. Calhoun,<br />
<strong>and</strong> D.L. Young, “Soil survey of Los<br />
Alamos County, New Mexico.”<br />
Los Alamos Scientific Laboratory, report<br />
LA-6779-MS (1978).<br />
Nyhan, J.W., S.W. Koch, R.G. Balice,<br />
<strong>and</strong> S. Loftin, “Estimation of soil erosion<br />
in burnt forest areas of the Cerro Gr<strong>and</strong>e<br />
Fire in Los Alamos, New Mexico.”<br />
Catena, submitted, in review (2001).<br />
Smith, D.A., K.B. Eack, J. Harlin,<br />
M.J. Heavner, A.R. Jacobson, R.S.<br />
Massey, X.M. Shao, <strong>and</strong> K.C. Wiens,<br />
“The Los Alamos Sferic Array: A<br />
research tool for lightning investigations.”<br />
J. Geophys. Res. submitted, in<br />
review, (2001).<br />
Site <strong>and</strong> Project Planning Group (PM-1),<br />
“<strong>FY</strong>01 ten-year comprehensive site<br />
plan.” Los Alamos National Laboratory,<br />
report LA-CP-01-374 (2001).<br />
Wischmeier, W.H. <strong>and</strong> D.D. Smith,<br />
“Predicting rainfall erosion lossesæa<br />
guide to conservation planning.” USDA<br />
H<strong>and</strong>book 537, U.S. Government<br />
Printing Office, Washington, D.C.<br />
(1978).
Environment<br />
Developing Genetic Analysis Capabilities as a Tool to Manage Large Carnivore<br />
Species at LANL in Response to the Cerro Gr<strong>and</strong>e Fire <strong>and</strong> Associated Impacts<br />
Principle Investigators: James R. Biggs (ESH-20), Jon L. Longmire (B-N1), Heather Alex<strong>and</strong>er, New Mexico State University/B-N1,<br />
Leslie Hansen (ESH-20)<br />
Coinvestigators: Carey Bare, Sherri Frybarger, (ESH-20)<br />
Other collaborating organizations: United States Forest Service, B<strong>and</strong>elier National Monument,<br />
New Mexico Dept. of Game <strong>and</strong> Fish<br />
Funding: <strong>FY</strong>01, $15K<br />
Introduction<br />
The Cerro Gr<strong>and</strong>e fire (CGF) of May<br />
2000 burned approximately 45,000 acres<br />
of forest <strong>and</strong> range l<strong>and</strong> on <strong>and</strong> adjacent<br />
to Los Alamos National Laboratory<br />
(LANL) property. Approximately 8,000<br />
acres burned on LANL property. This<br />
will most likely lead to both short-term<br />
(1–3 years) <strong>and</strong> long-term alterations in<br />
the distribution <strong>and</strong> behavior of large<br />
carnivores, such as mountain lion (Felis<br />
concolor) <strong>and</strong> black bear (Ursus<br />
americanus). At present, studies for<br />
monitoring <strong>and</strong> studying population<br />
characteristics <strong>and</strong> behavior of these<br />
species on <strong>and</strong> around LANL are limited<br />
because of the cost of labor-intensive<br />
techniques. Following the CGF, funding<br />
was made available to monitor the effects<br />
of the CGF on large carnivores. However,<br />
the funding is specifically targeted<br />
for the monitoring of these species for<br />
three years only using advanced telemetry<br />
equipment; money has not been<br />
budgeted to explore alternative more<br />
efficient <strong>and</strong> cost-effective methods of<br />
monitoring these species. After completion<br />
of the three-year monitoring, the<br />
application of long-term cost-effective<br />
techniques to monitor activity <strong>and</strong><br />
distribution will be necessary to continue<br />
studying effects of the fire as well as<br />
impacts from normal ongoing LANL<br />
operations. Issues pertaining to large<br />
carnivores include the following<br />
categories.<br />
Potential increase in the number of<br />
encounters between large carnivores<br />
<strong>and</strong> LANL employees. Following the<br />
Cerro Gr<strong>and</strong>e fire, LANL personnel<br />
investigated a two- to three-fold increase<br />
in mountain lion <strong>and</strong> black bear encoun-<br />
ters at LANL. This was attributed to<br />
several factors including loss of available<br />
habitat, the redistribution patterns of prey<br />
species, <strong>and</strong> human impacts associated<br />
with flood prevention measures. The<br />
increased sightings prompted the Laboratory<br />
to issue Lab-wide alerts about the<br />
potential dangers of encounters with<br />
mountain lions <strong>and</strong> black bears. In<br />
addition, several reports of mountain lion<br />
attacks on pets have taken place in Los<br />
Alamos County during 2001.<br />
Also in Los Alamos County, multiple<br />
nuisance bears have been transplanted to<br />
extreme northern New Mexico. Most of<br />
these bears will either die because of<br />
territorial disputes with existing bears in<br />
the transplant site or will return to the site<br />
of capture. Animals that do return could<br />
become a nuisance again <strong>and</strong> ultimately<br />
have to be destroyed. Long-term monitoring<br />
of carnivore populations can provide<br />
data critical to developing management<br />
strategies to minimize the potential for<br />
nuisance animals. ESH-20 is collaborating<br />
with the New Mexico Department of<br />
Game <strong>and</strong> Fish (NMDGF) to provide<br />
mountain lion <strong>and</strong> black bear awareness<br />
training to LANL employees through<br />
ESH-13. The primary issues of concern<br />
voiced by LANL employees include<br />
safety while performing field work,<br />
working in areas relatively isolated from<br />
centers of activity, jogging, hiking, <strong>and</strong><br />
current, past, <strong>and</strong> predicted future status<br />
<strong>and</strong> trends of these species due to the fire.<br />
Although we can offer awareness<br />
training, we cannot provide detailed<br />
information on distribution, behavioral<br />
patterns, areas of potentially greater risk<br />
of encounters, <strong>and</strong> potential problem<br />
individual animals. Nor can we provide<br />
information on the long-term fire effects<br />
to these species <strong>and</strong> thus cannot develop<br />
management strategies to mitigate<br />
potential problems.<br />
<strong>Application</strong> of low-cost techniques<br />
to study population characteristics of<br />
large carnivores. Currently, studies are<br />
underway to identify distribution, habitat<br />
use, <strong>and</strong> population characteristics of elk<br />
<strong>and</strong> deer using advanced telemetry<br />
systems. Telemetry systems can be<br />
deployed on these species relatively<br />
quickly <strong>and</strong> inexpensively because of the<br />
ease of capturing these species. However,<br />
capturing <strong>and</strong> collaring of large carnivore<br />
species, such as mountain lion <strong>and</strong> black<br />
bear, can be difficult, costly, time<br />
consuming, as well as posing a risk to the<br />
animal. Telemetry techniques applied to<br />
large carnivores can be cost effective <strong>and</strong><br />
provide important data at the onset of a<br />
study, but can become too costly <strong>and</strong><br />
labor intensive to continue for extended<br />
periods of time. The development of<br />
alternative methods to study the behavior,<br />
distribution, movement patterns, <strong>and</strong><br />
population characteristics of large<br />
predators is imperative to the long-term<br />
management of such species. Recent<br />
advancements in genetic analysis may<br />
offer a more innovative low-cost technique<br />
to obtain the information necessary<br />
to develop <strong>and</strong> implement management<br />
strategies for large carnivores. Genetic<br />
analysis of hair samples has been applied<br />
to wildlife studies (Foran et al. 1997) but<br />
further refinements in techniques to<br />
collect hair <strong>and</strong> scat samples are necessary.<br />
Scat (fecal material) is one of the<br />
most easily obtainable, low-cost sources<br />
of information on population characteristics<br />
of animals available (Kohn <strong>and</strong><br />
9
Environment<br />
Wayne 1997) <strong>and</strong> can provide data on<br />
animal distribution, abundance, spatialtemporal<br />
movement, diet, <strong>and</strong> disease<br />
(Putnam 1984). The further refinement<br />
<strong>and</strong> application of genetic analysis of<br />
animal scat that is both cost-efficient <strong>and</strong><br />
effective would aid in significant costsavings<br />
to LANL projects. Cost estimates<br />
to implement a study utilizing telemetry<br />
techniques would be about $100K per<br />
year versus an estimated $35–40K per<br />
year using genetic analysis (assumes<br />
6–10 individuals of each species [lion,<br />
bear] are radio collared with GPS radio<br />
collars).<br />
Effects of the Cerro Gr<strong>and</strong>e fire on<br />
the distribution <strong>and</strong> movements of<br />
large carnivores at LANL. Deer <strong>and</strong> elk<br />
are primary prey items for mountain lions<br />
in this area. Black bear readily feed on<br />
deer <strong>and</strong> elk as carrion. Black bear will<br />
also feed on the young of these species.<br />
Several vegetation monitoring studies<br />
were initiated in CY00 <strong>and</strong> CY01; results<br />
indicate that the production of extensive<br />
foraging range on <strong>and</strong> around LANL for<br />
deer, elk, <strong>and</strong> bear is taking place in the<br />
CGF burn area. In turn, the Laboratory<br />
may observe a significant increase in the<br />
use <strong>and</strong> distribution of these species on<br />
LANL property. The increase in prey<br />
species may result in an increase in the<br />
number of large carnivore species<br />
inhabiting <strong>and</strong>/or feeding in this area.<br />
LANL mitigation measures to reduce the<br />
adverse impacts from the fire (e.g., flood<br />
retention structures) may not only effect<br />
the movement patterns of large ranging<br />
carnivores, but also the long-term<br />
distribution patterns associated with the<br />
increase <strong>and</strong> distribution of prey species.<br />
Collaborative efforts including<br />
B<strong>and</strong>elier National Monument (BNM),<br />
Santa Fe National Forest (SFNF),<br />
NMDGF, <strong>and</strong> area pueblos are underway<br />
to address issues related to the long-term<br />
management of game species across the<br />
Jemez Mountains. Efforts have been<br />
stepped up because of the CGF <strong>and</strong><br />
associated mitigation measures. In many<br />
instances, individual mountain lions <strong>and</strong><br />
black bears will utilize each of these<br />
l<strong>and</strong>s as part of their territory or home<br />
range thus necessitating a region-wide<br />
approach to management. The primary<br />
10<br />
factor most limiting to implementing a<br />
wide-scale study on large carnivores is<br />
cost <strong>and</strong> sampling consistency across the<br />
region. LANL may implement limited<br />
radio collaring efforts as part of project<br />
specific needs. However, most adjoining<br />
entities <strong>and</strong> l<strong>and</strong>owners are unable to<br />
implement such studies because of cost<br />
<strong>and</strong> available resources. Thus,` collected<br />
data is inadequate to develop <strong>and</strong><br />
implement region-wide management<br />
strategies. The use of fecal <strong>and</strong> hair<br />
genetic analysis could offer a sampling<br />
<strong>and</strong> analysis technique that would not be<br />
cost prohibitive <strong>and</strong> will provide the data<br />
necessary to implement wide-scale<br />
management strategies. The application<br />
of these techniques can be easily applied<br />
to studying distribution <strong>and</strong> population<br />
trends of large carnivores in this area.<br />
Techniques for collecting<br />
genetic-analysis samples have been<br />
limited to blood <strong>and</strong>/or tissue samples<br />
from captured, radio collared animals as<br />
part of project-specific needs (Biggs et al.<br />
1999). These projects have focused<br />
primarily on elk <strong>and</strong> deer because of the<br />
cost-prohibitive nature of capturing large<br />
carnivores. Genetic-analysis sampling<br />
results help establish a genetic baseline of<br />
prey for mountain lion <strong>and</strong> black bear on<br />
LANL property. For application to<br />
management of large carnivores, a<br />
method needs to be rapid, relatively<br />
inexpensive, easy-to-learn, <strong>and</strong> definitive<br />
in its results (Foran et al. 1997). The<br />
method cannot vary with time, diet, or<br />
other factors. Genetic markers of individual<br />
animals do not change over time<br />
nor do they change with differing diets or<br />
other factors (Foran et al. 1997). Because<br />
of the behavioral characteristics of large<br />
carnivores, the collection of tissue <strong>and</strong><br />
blood samples is problematic. Mountain<br />
lions <strong>and</strong> black bears are difficult to<br />
capture, elusive, <strong>and</strong> secretive; therefore,<br />
the collection <strong>and</strong> analysis of scat or hair<br />
is often one of the best noninvasive<br />
methods for monitoring their populations<br />
(Foran et al. 1997). Although several<br />
technical problems prevent the widespread<br />
large-scale application of fecal<br />
genetic analysis, some studies have<br />
provided information on population<br />
characteristics, food habits, <strong>and</strong> reproduc-<br />
tion characteristics of wildlife species<br />
(Kohn et al 1995, Reed et al. 1997, Ernest<br />
et al. 2000). Fecal DNA analysis is an<br />
effective method for detecting <strong>and</strong><br />
identifying individual mountain lions<br />
(Ernest et al 2000). Comprehensive<br />
sampling of an area for feces or systematic<br />
fecal transects of populations may<br />
allow estimates of home range, territory<br />
dimensions, core-use areas, reproductive<br />
patterns, <strong>and</strong> population size (Kohn <strong>and</strong><br />
Wayne 1997). The same analytical<br />
methods used to deduce core areas <strong>and</strong><br />
home range from radio telemetry could<br />
be applied to these kinds of data from<br />
fecal samples.<br />
The primary objectives of this<br />
study are the following:<br />
1. Provide distribution, behavioral, <strong>and</strong><br />
population data on large carnivores to<br />
develop management strategies.<br />
2. Further develop <strong>and</strong> refine genetic<br />
analysis of fecal material for the study<br />
of large carnivores.<br />
3. Further refine methods of collecting<br />
scat <strong>and</strong> hair samples at LANL for<br />
genetic analysis.<br />
4. Provide a technique to study the longterm<br />
effects of the Cerro Gr<strong>and</strong>e fire<br />
on large carnivores.<br />
Methods<br />
Line transects <strong>and</strong> sampling stations to<br />
collect hair were established <strong>and</strong> evaluated<br />
during <strong>FY</strong>01 <strong>and</strong> are discussed<br />
further in the next section (Progress <strong>and</strong><br />
Results). Additional sampling stations<br />
<strong>and</strong> transects will be established throughout<br />
the study area to collect hair <strong>and</strong> scat<br />
<strong>and</strong> to characterize carnivore population<br />
parameters (i.e., population size, sex<br />
ratios, distribution). When possible,<br />
blood <strong>and</strong> tissue samples will be collected<br />
from radio-collared animals from<br />
other project-specific studies <strong>and</strong> roadkill<br />
animals for comparison to fecal <strong>and</strong> hair<br />
analysis results. Once fully implemented,<br />
sample collection sites will be plotted,<br />
individual animals identified via genetic<br />
analysis, <strong>and</strong> distribution coverages<br />
developed with the GIS.
The technology to identify <strong>and</strong><br />
monitor individual lions <strong>and</strong> bears is<br />
based on the analysis of microsatellites.<br />
Microsatellites are short, t<strong>and</strong>emly<br />
repeated DNA sequences found within<br />
the genomes of organisms. Microsatellite<br />
characteristics that make them “the<br />
system of choice” for modern genetic<br />
analyses are that they are highly variable<br />
(polymorphic) <strong>and</strong> they are easily<br />
analyzed using the polymerase chain<br />
reaction (PCR) (Weber <strong>and</strong> May, 1989;<br />
Epplen, 1991; Tautz <strong>and</strong> Renz, 1984).<br />
Short oligonucleotide primers (approximately<br />
20 nucleotides each) are developed<br />
to complement sequences that<br />
directly flank both sides of specific<br />
microsatellite repeat clusters (loci).<br />
These primer pairs, together with the<br />
PCR reaction, allow amplification of the<br />
microsatellite loci from small amounts of<br />
target DNA. The amplification products<br />
are florescently labeled <strong>and</strong> their length is<br />
determined using an automated DNA<br />
sequencing machine <strong>and</strong> DNA st<strong>and</strong>ards<br />
of known size. Variability at<br />
microsatellite loci is observed when<br />
different length amplification products<br />
are generated due to differing numbers of<br />
basic repeating units within the<br />
microsatellite clusters. The level of allelic<br />
variation that is seen at a series of<br />
specific microsatellite loci is generally<br />
sufficient for true genetic differentiation<br />
(or DNA profiling) of all individuals<br />
within a population (Weber <strong>and</strong> May,<br />
1989).<br />
Progress <strong>and</strong> results<br />
Proposed for <strong>FY</strong>01. As part of the<br />
<strong>FY</strong>01 objectives, a sampling design for<br />
collection of fecal <strong>and</strong> hair material<br />
would be developed at the onset of the<br />
study; this was accomplished by<br />
July 2001. Also in <strong>FY</strong>01, fecal samples<br />
were to be collected through systematic<br />
area sampling when techniques for the<br />
collection of samples <strong>and</strong> the genetic<br />
analysis would be refined. Line transects<br />
would be established within plots that<br />
have been located via a stratified r<strong>and</strong>om<br />
approach across LANL property. When<br />
possible, blood <strong>and</strong> tissue samples would<br />
be collected from radio-collared animals,<br />
other project-specific studies, <strong>and</strong><br />
roadkill animals for comparison to fecal<br />
<strong>and</strong> hair analysis results. Hair traps of<br />
different designs would be developed,<br />
deployed, <strong>and</strong> evaluated for effectiveness<br />
in collecting hair samples from target<br />
species.<br />
Progress to Date. Line transects for<br />
collecting fecal samples were established<br />
in three canyons (Cañada del Buey, Los<br />
Alamos Canyon, <strong>and</strong> Ancho Canyon) <strong>and</strong><br />
along one mesa top (Ancho Mesa).<br />
Samples were collected using a st<strong>and</strong>ardized<br />
protocol developed during <strong>FY</strong>01.<br />
The transects will be extended throughout<br />
the Lab <strong>and</strong> in surrounding areas (USFS,<br />
BNM) during <strong>FY</strong>02. All line transects<br />
will have Global Positioning System<br />
(GPS) coordinates taken to establish<br />
exact location of the line transects.<br />
During the <strong>FY</strong>01 sampling period,<br />
twenty-four scat samples were collected<br />
<strong>and</strong> included bear (most samples),<br />
bobcat, <strong>and</strong> coyote. All samples have<br />
been stored for genetic analysis to be<br />
performed during <strong>FY</strong>02. Also during the<br />
summer <strong>FY</strong>01, different hair-snare<br />
designs were tested for efficacy in<br />
collecting hair samples of high enough<br />
quality <strong>and</strong> quantity for performing<br />
genetic analysis (Fig. 1). Several snares<br />
of different designs were established at<br />
eight locations near the same locations as<br />
the line transects. At each location,<br />
cameras were set to take pictures of<br />
animals visiting the snares for confirmation<br />
of species (Figs. 2 <strong>and</strong> 3). Hair was<br />
placed in a small envelope, sealed, <strong>and</strong><br />
labeled with date, location of sample,<br />
type of snare used, <strong>and</strong> identification of<br />
animal if possible. The samples were then<br />
placed in a freezer until needed for DNA<br />
analysis. Preliminary results of the hair<br />
snares are reported in Quintana <strong>and</strong><br />
Alex<strong>and</strong>er (2001).<br />
During <strong>FY</strong>01, we proposed evaluating<br />
two approaches for designing the primer<br />
pairs needed to conduct the genetic work<br />
on mountain lion <strong>and</strong> black bear. The<br />
first approach uses microsatellite primer<br />
pairs developed for other cat species. The<br />
other approach involves developing new<br />
microsatellite markers by cloning <strong>and</strong><br />
sequencing microsatellite loci directly<br />
from lion DNA as has been done for<br />
other species (Longmire et al. 1999;<br />
Environment<br />
Longmire et al. in press, White et al.<br />
1999). This approach could require a year<br />
or more of development time <strong>and</strong> would<br />
be used only if we require additional<br />
resolving power to achieve full genetic<br />
differentiation of all individuals. As a<br />
result of <strong>FY</strong>01 efforts, it appears existing<br />
microsatellite primer pairs will work<br />
effectively for both black bear <strong>and</strong><br />
mountain lion.<br />
DNA isolation from scat. We have<br />
compiled information about benefits <strong>and</strong><br />
limitations of how scat <strong>and</strong> hair samples<br />
have been used in the past. Different<br />
protocols used to isolate DNA from<br />
samples were also tested. During <strong>FY</strong>01,<br />
we began testing the QIAamp DNA Stool<br />
Mini Kit, which offered a quick <strong>and</strong> easy<br />
system to isolate DNA from scat. This kit<br />
is ideal because it not only eliminates<br />
inhibitors present in the sample, but also<br />
it isolates DNA with minimal use of<br />
hazardous organic compounds, such as<br />
phenol <strong>and</strong> chloroform. Using the kit’s<br />
protocols, we have been able to isolate<br />
DNA from the scat; however, when PCR<br />
was performed, the primer sets were<br />
unable to amplify the microsatellites. The<br />
problem with isolating genomic DNA<br />
from scat is an incredibly high amount of<br />
bacterial DNA present, which makes it<br />
difficult to pull out the genomic DNA<br />
from the specific animal. In order to get<br />
amplification of the microsatellites, we<br />
added a phenol extraction into the kit’s<br />
protocol along with increasing the<br />
number of cycles performed in PCR.<br />
These changes allowed us to successfully<br />
amplify the microsatellites we were<br />
looking for. During <strong>FY</strong>02, we will<br />
continue to use this kit with a larger<br />
number of different dog scat samples to<br />
determine the kit’s consistency. We will<br />
also look at the environmental influences<br />
on the degradation of DNA in scat<br />
samples by looking at the success rate of<br />
isolating genomic DNA in a set period of<br />
time. Once the protocol is refined, DNA<br />
will be isolated from samples collected<br />
out in the field, <strong>and</strong> species identification<br />
along with individual animal profiling<br />
will be performed. Once individuals are<br />
identified, the samples from these<br />
individuals will be located on a map <strong>and</strong><br />
11
Environment<br />
Figure 1. Two types of hair snares are shown. The cubby snare (right) grabs hair samples<br />
from animals entering the snare to investigate scents that are placed on the tree. Hair is<br />
taken from animals using a series of brushes placed along the two timbers. The barbed<br />
wire snare (left) grabs hair samples from animals entering the enclosed area (scents are<br />
placed at the center of the area to attract animals). The barbs are long enough to grab hair<br />
without injuring the animal.<br />
Figure 2. Picture of a coyote entering the sampling station. In addition to mountain lions<br />
<strong>and</strong> black bears, this system can monitor other carnivore species such as coyote <strong>and</strong><br />
bobcat.<br />
Figure 3. An up-close picture of a young black bear investigating the camera unit at the<br />
sampling station with the barbed wire snare in the background. The pictures help verify<br />
animal species tracks, hair, <strong>and</strong> scat samples collected at the station.<br />
12<br />
distribution will be determined along<br />
with overall population size.<br />
DNA isolation from hair. Hair<br />
samples have been collected out in the<br />
field via the hair snares <strong>and</strong> trapping live<br />
bears. These samples are stored in a<br />
freezer until the protocol for DNA<br />
isolation from hair is tested. To test the<br />
protocol (obtained from LANL’s<br />
Bioscience Division), dog hair from a<br />
number of individuals will be used. Once<br />
the protocol is refined for use on mountain<br />
lion <strong>and</strong> black bear hair, we will<br />
begin isolating DNA from samples<br />
collected in the field <strong>and</strong> from live<br />
trapping for species identification (if<br />
needed). The plotted sample locations<br />
will be combined with the DNA analysis<br />
to determine distribution <strong>and</strong> overall<br />
population size.<br />
Use of buccal swabs for collection of<br />
DNA. In July 2001, we tested a method<br />
for collecting buccal cells using<br />
cytobrushes to swab the inside of the<br />
animal’s mouth. DNA is easily isolated<br />
by heating the cells to 100oC, which<br />
causes the cells to lyse. The buccal swabs<br />
yielded a high amount of DNA, so this<br />
technique will be added to the sample<br />
collection with black bears <strong>and</strong> mountain<br />
lions being trapped. These mouth swabs<br />
will be used as positive controls for<br />
individual identifications <strong>and</strong> comparisons<br />
to samples collected in the field. In<br />
August 2001, project personnel contacted<br />
the NMDGF to request that field officers<br />
collect mouth swab samples from<br />
nuisance bears captured throughout<br />
northern New Mexico. As a result,<br />
officers have been supplied with 40 kits<br />
to collect the swab samples <strong>and</strong> hair<br />
samples.<br />
Primer sets for mountain lion <strong>and</strong><br />
black bear. All current genetic studies of<br />
mountain lions use primer sets found for<br />
dinucleotide repeats in the domestic cat.<br />
No testing of primer sets for<br />
tetranucleotide repeats has been performed.<br />
There are many benefits to<br />
amplifying tetranucleotide repeats rather<br />
than dinucleotide repeats, mainly the<br />
ability to distinguish between two<br />
different alleles located close to one<br />
another. This increases the ability to
identify individuals. So far, 18<br />
tetranucleotide repeats in the domestic cat<br />
have been identified. All primer sets for<br />
these repeats will be tested with mountain<br />
lion samples obtained from Northern<br />
Arizona University to determine success<br />
in amplifying microsatellites (Fig. 4).<br />
Based on the findings from these tests, a<br />
primer note will be prepared <strong>and</strong> submitted<br />
to a peer-reviewed journal. Primer<br />
sets for black bear have been ordered <strong>and</strong><br />
will be tested for their success in amplifying<br />
microsatellites. By the end of CY01,<br />
a set of primers will be selected for the<br />
study.<br />
Conclusion <strong>and</strong> deliverables<br />
The development <strong>and</strong> application of a<br />
noninvasive technique, such as fecal<br />
genetic analysis, would be cost-effective<br />
<strong>and</strong> would provide biological data<br />
specific to target species. Using fecal <strong>and</strong><br />
hair analysis, population characteristics<br />
such as population size <strong>and</strong> trends, sex<br />
ratios, <strong>and</strong> distribution patterns could be<br />
effectively monitored through time <strong>and</strong> in<br />
relation to large scale perturbations (i.e.,<br />
wildfire) once sampling <strong>and</strong> analysis<br />
issues have been addressed. Using<br />
genetic analysis of hair <strong>and</strong> scat from<br />
within <strong>and</strong> near the Laboratory could<br />
ultimately minimize the number of<br />
collars deployed on these species or other<br />
invasive techniques to gather similar<br />
information. Genetically fingerprinting<br />
individuals within populations can also<br />
address questions related to reproduction<br />
<strong>and</strong> dispersal patterns of each species.<br />
During the first year of this study, we<br />
have successfully isolated DNA from<br />
animal scat samples using existing<br />
protocols, eliminating the need to further<br />
develop certain techniques. However,<br />
further refinements in sample collection<br />
<strong>and</strong> processing are needed <strong>and</strong> will be<br />
addressed during <strong>FY</strong>02. Furthermore,<br />
sampling efforts will be exp<strong>and</strong>ed from<br />
LANL property to the adjacent burned<br />
areas <strong>and</strong> other properties to gain more<br />
accurate baseline information on carnivore<br />
populations in this region.<br />
During <strong>FY</strong>02, a report will be prepared<br />
discussing current techniques for<br />
genetic analysis of carnivore scat <strong>and</strong> hair<br />
<strong>and</strong> limitations for application to the<br />
management of these species, an assess-<br />
Figure 4. Picture of primers established for tetranucleotide repeats in the domestic cat,<br />
tested with five mountain lion DNA samples. B<strong>and</strong>s lit up in the gel represent amplified<br />
alleles. The allele sizes amplified in the mountain lion samples correspond to allele sizes in<br />
the domestic cat.<br />
Environment<br />
ment of the necessary refinements <strong>and</strong>/or<br />
improvements to the genetic analysis, <strong>and</strong><br />
results of sampling efforts. The report<br />
will discuss a final evaluation of hair<br />
snares to collect quality samples. A<br />
primer note discussing the use of<br />
tetranucleotide repeats applied to<br />
mountain lion samples will be submitted<br />
by January 2002.<br />
References<br />
Biggs, J., K. Bennett, <strong>and</strong> P.R. Fresquez,<br />
“Resource use, activity patterns, <strong>and</strong><br />
disease analysis of Rocky Mountain elk<br />
(Cervus elaphus nelsoni) at the Los<br />
Alamos National Laboratory,” Los<br />
Alamos National Laboratory report<br />
LA-13536-MS (1999).<br />
Epplen, J.T., “On simple repeated GAT/<br />
CA sequences in animal genomes: A<br />
critical reappraisal,” Journal of Heredity<br />
79: 409–417 (1991).<br />
Ernest, H.B., M.C. Penedo, B.P. May,<br />
M. Syvanen, <strong>and</strong> W.M. Boyce, “Molecular<br />
tracking of mountain lions in the<br />
Yosemite Valley region in California:<br />
genetic analysis using microsatellites <strong>and</strong><br />
fecal DNA,” Mol. Ecology 9(4):433–441<br />
(2000).<br />
Foran, D.R., K.R. Crooks, <strong>and</strong> S.C.<br />
Minta, “Species identification from scat:<br />
an unambiguous genetic method,” Wildl.<br />
Soc. Bull. 25(4):835–839 (1997).<br />
Kohn, M.H., F. Knauer, A. Stoffella, W.<br />
Schroder, <strong>and</strong> S. Paabo, “Conservation<br />
genetics of the European brown bear: a<br />
study using excremental PCR of nuclear<br />
<strong>and</strong> mitochondrial sequences,” Mol.<br />
Ecology 4(1):95–103 (1995).<br />
Kohn, M.H. <strong>and</strong> R.K. Wayne, “Facts<br />
from feces revisited,” Trends Ecol. <strong>and</strong><br />
Evol. 12(6):223–227 (1997).<br />
Longmire, J. L., D.C. Hahn, <strong>and</strong><br />
J.L. Roach, “Low abundance of<br />
microsatellite repeats in the genome of<br />
the brown-headed cowbird (Molothrus<br />
ater),” Journal of Heredity 90: 574–578<br />
(1999).<br />
13
Environment<br />
Longmire, J.L., J.L. Roach, M. Maltbie,<br />
P.S. White, O.L. Tatum, K.D. Makova,<br />
<strong>and</strong> D.C. Hahn, “Tetranucleotide<br />
microsatellite markers for the brown<br />
headed cowbird (Molothrus ater),” In<br />
press: Journal of Avian Biology.<br />
Tautz, D., <strong>and</strong> Renz, M., “Simple<br />
sequences are ubiquitous repetitive<br />
components of eukariotic genomes,”<br />
Nucleic Acids Res. 12: 4127–4136<br />
(1984).<br />
Putnam, R., “Facts from feces,” Mammal<br />
Rev. 14:79–97 (1984).<br />
Quintana, E. <strong>and</strong> H. Alex<strong>and</strong>er, “The<br />
evaluation of techniques to collect hair<br />
<strong>and</strong> scat samples from free-ranging<br />
carnivores.” Los Alamos National<br />
Laboratory report LA-UR-01-3845<br />
(2001).<br />
14<br />
Reed, J.Z., D.J. Tollit, P.M. Thompson,<br />
<strong>and</strong> W. Amos, “Molecular scatology: the<br />
use of molecular genetic analysis to<br />
assign species, sex, <strong>and</strong> individual<br />
identity to seal feces,” Mol. Ecology<br />
6(3):225–234 (1997).<br />
Weber, J.L. <strong>and</strong> P.E. May, “Abundant<br />
class of human DNA polymorphisms<br />
which can be typed using the polymerase<br />
chain reaction,” Am. J. of Human<br />
Genetics 44: 388–396 (1989).<br />
White, P.S., O.L. Tatum, L.L. Deaven,<br />
<strong>and</strong> J.L. Longmire, “New, male-specific<br />
microsatellite markers from the human Y<br />
chromosome,” Genomics 57: 433–437<br />
(1999).
The Effects of Depleted Uranium on Amphibian Health<br />
Principle Investigator: Gilbert J. Gonzales, Ecologist, Contaminant Monitoring Team, Ecology Group (ESH-20)<br />
Environment<br />
Coinvestigators: Colleen A. Caldwell, Aquatic Toxicologist, United States Geological Survey, Biological Resources Division <strong>and</strong><br />
Department of Fishery <strong>and</strong> Wildlife Sciences, New Mexico State University; Sarah Mitchell, Graduate Research Assistant, New<br />
Mexico State University, Department of Fishery <strong>and</strong> Wildlife Sciences; <strong>and</strong> William R. Gould, New Mexico State University Experimental<br />
Statistics Center<br />
Funding: <strong>FY</strong>00 $15K; NMSU Cost Share, $30K; Ecology Group (ESH-20), $29K; <strong>FY</strong>01 $52K; NMSU Cost Share, $30K<br />
Introduction<br />
The Los Alamos National Laboratory<br />
(LANL) is located on the Pajarito Plateau<br />
on the east side of the Jemez Mountains.<br />
The plateau is a series of finger-like<br />
mesas transected by a series of canyons,<br />
which serve as the primary drainage from<br />
LANL. The canyons contain ephemeral,<br />
intermittent, <strong>and</strong> interrupted reaches of<br />
streams that feed into the Rio Gr<strong>and</strong>e<br />
Basin. The Laboratory’s Environmental<br />
Surveillance Program routinely collects<br />
water, soil, vegetation, <strong>and</strong> biota to<br />
evaluate the uptake <strong>and</strong> distribution of<br />
radionuclides within <strong>and</strong> outside LANL<br />
boundaries. Amphibians, which are<br />
known to exhibit hypersensitivity to<br />
environmental contaminants, are present<br />
in some of the canyons that traverse<br />
LANL.<br />
Characteristics <strong>and</strong> Use of Depleted<br />
Uranium. Depleted uranium (DU) is the<br />
by-product of an enrichment process to<br />
increase the percentage of the isotope<br />
235 U in natural uranium ore to make it<br />
suitable for use as nuclear fuel <strong>and</strong> in<br />
nuclear weapons. Compared to natural<br />
uranium, the physical properties of DU<br />
have resulted in widespread use in<br />
military <strong>and</strong> civilian applications. These<br />
properties include a density of 1.9 g/cm 3<br />
(1.7 times greater than lead) <strong>and</strong> a<br />
pyrophoric or ignitable nature<br />
(Eckelmeyer 1990; AEPI 1995). Since<br />
the early 1940s, the Department of<br />
Energy (DOE) <strong>and</strong> Department of<br />
Defense have tested <strong>and</strong> used DU in<br />
weapons systems <strong>and</strong> in armor plating of<br />
military vehicles (Ebinger et al. 1990;<br />
AEPI 1995). Weapons systems containing<br />
DU were successfully used during the<br />
Gulf War in Operation Desert Shield/<br />
Desert Storm, resulting in a renewed<br />
interest by other countries throughout the<br />
world <strong>and</strong> the concern for elevated levels<br />
of DU in the environment. In their 1994<br />
Summary Report to Congress, the Army<br />
Environmental Policy Institute (AEPI)<br />
recognized the long-term environmental<br />
consequences of using DU on the<br />
battlefield <strong>and</strong> in test ranges. As a result<br />
of our limited underst<strong>and</strong>ing of its<br />
toxicity, the report recommended an<br />
evaluation of the environmental fate <strong>and</strong><br />
effect of DU (AEPI 1995).<br />
Environmental Release, Transport,<br />
<strong>and</strong> Fate of Depleted Uranium. The<br />
primary release of DU to the environment<br />
occurs when weapon components or<br />
munitions are explosively detonated or<br />
impacted against a target. Upon impact,<br />
DU particles <strong>and</strong> aerosols are formed<br />
<strong>and</strong>, depending on their size, can spread<br />
throughout a large geographic area (AEPI<br />
1995; Becker 1992). Since DU is<br />
depleted in isotopes 234U <strong>and</strong> 235U, it is<br />
nearly 40–60% less radioactive than<br />
natural uranium. Therefore, the environmental<br />
concerns are based on its chemical<br />
properties <strong>and</strong> toxicity rather than its<br />
radioactivity. This is also in agreement<br />
with the principle that chemical effects of<br />
radionuclides on nonhuman biota are<br />
greater than the effects of the radioactivity<br />
(Whicker <strong>and</strong> Schultz 1982). Numerous<br />
studies at LANL have also implied<br />
this (Gonzales et al. 1998, Gonzales et al.<br />
1997, Ferenbaugh et al. 1996). Impact to<br />
the environment from DU metal was<br />
thought to be low because of the overall<br />
low solubility of uranium <strong>and</strong> because<br />
DU metal was alloyed with other heavy<br />
metals, such as titanium, that also have a<br />
low solubility. However, high temperatures<br />
<strong>and</strong> fire associated with explosion<br />
<strong>and</strong> impact can affect the surface of the<br />
DU metal. Over time, exposure to<br />
environmental conditions (e.g., photooxidation)<br />
alters the chemical state of DU<br />
increasing its solubility <strong>and</strong> potential for<br />
transport through the environment. The<br />
most effective transport of DU in the<br />
environment is by aqueous processes<br />
associated with erosion, surface runoff,<br />
<strong>and</strong> ground water (Hanson <strong>and</strong> Miera<br />
1976; Ebinger et al. 1990). The low<br />
solubility of alloyed heavy metals has led<br />
researchers to consider DU in soil as<br />
more of a terrestrial hazard than an<br />
aquatic one. However, a study investigating<br />
the movement of uranium from firing<br />
sites at LANL reported average concentrations<br />
in soil runoff <strong>and</strong> stream sediments<br />
of 51.1 µg/g <strong>and</strong> 42.2 µg/g,<br />
respectively (Becker 1992). Soil surveys<br />
close to the impact area of an active<br />
firing site on LANL showed concentrations<br />
of total uranium ranging from<br />
0.8 µg/g to 13,300 µg/g, which was an<br />
outlier. Uranium occurs naturally in the<br />
B<strong>and</strong>elier Tuff at relatively high concentrations<br />
(~3.4 µg/g, Fresquez et al. 1994).<br />
Potential Health Effects of Depleted<br />
Uranium on Amphibians. Amphibian<br />
population declines have been reported<br />
throughout the world. The decline<br />
appears to be complex <strong>and</strong> includes<br />
factors, such as normal population<br />
fluctuations caused by climatological<br />
factors, habitat destruction because of<br />
urbanization <strong>and</strong> drainage of wetl<strong>and</strong>s,<br />
higher levels of UV radiation, acid<br />
precipitation, toxic substances, <strong>and</strong><br />
increased susceptibility to disease.<br />
Amphibians have become an important<br />
indicator species of global health as a<br />
result of their biphasic life cycle, more<br />
frequent contact with soil, sediment, <strong>and</strong><br />
15
Environment<br />
water, <strong>and</strong> permeable skin which exposes<br />
the aquatic larvae <strong>and</strong> terrestrial adults to<br />
water-borne <strong>and</strong> terrestrial-borne<br />
toxicants. Reproduction <strong>and</strong> early life<br />
stages are an extremely vulnerable time<br />
in the life cycle of amphibians. Environmental<br />
toxicants can interfere with<br />
embryological development <strong>and</strong> larval<br />
growth by increasing susceptibility of<br />
eggs to pathogens <strong>and</strong> disease, retarding<br />
growth <strong>and</strong> development, <strong>and</strong>/or inhibiting<br />
the larvae’s ability to avoid predators<br />
(Carey <strong>and</strong> Bryant 1995). The application<br />
of aquatic toxicity tests using amphibians<br />
as test models has become an acceptable<br />
approach for identifying factors that<br />
might be related to their decline.<br />
Specialized acute <strong>and</strong> chronic toxicity<br />
tests have been developed, st<strong>and</strong>ardized,<br />
<strong>and</strong> adopted to identify the reasons for<br />
the worldwide disappearance of<br />
amphibians (ASTM 1991).<br />
Previous research on the effects of DU<br />
on Ceriodaphnia dubia (water flea) has<br />
shown significant effects of DU on water<br />
flea reproduction at concentrations as low<br />
as 3.91 µg/L (Kuhne 2000). Concentration-responses<br />
were observed in the<br />
number of offspring produced <strong>and</strong> the<br />
adults were reduced in size at greater<br />
concentrations. In chronic tests, statistical<br />
analysis show significant effects of DU<br />
on C. dubia survival in concentrations<br />
ranging from 14.0 to 63.8 µg/L. Metals of<br />
toxicological concern such as Cd <strong>and</strong> Pb<br />
were below concentrations reported to<br />
affect reproduction for a similar organism<br />
(water flea, Daphnia magna) (Eisler<br />
1985; 1988). Metal concentrations in test<br />
water indicated that toxicity most likely<br />
resulted from uranium with concentrations<br />
14,500 times greater than Pb <strong>and</strong><br />
11,724 times greater than Cd.<br />
Benefit. This investigation is designed<br />
to increase the ability to meet technical<br />
objectives of the Laboratory’s environmental<br />
health programs (e.g., the Environmental<br />
Surveillance Program). More<br />
specifically, the short-term goals of this<br />
research project will identify (1) health<br />
effects of DU from LANL soil on<br />
amphibian models <strong>and</strong> (2) contribute data<br />
to aid in the construction of a database,<br />
where none currently exist, on the effects<br />
of DU in an aquatic animal model. While<br />
16<br />
not every organism nor class of organisms<br />
at the Laboratory can be monitored<br />
to ensure environmental quality, amphibians<br />
constitute a major class of animal<br />
that have been proven to be exceptionally<br />
sensitive to contaminants (Ulsh et al.<br />
1999). However, before field measurement<br />
of contaminant levels in amphibia<br />
can be interpreted, dose-response toxicity<br />
on a number of measurement endpoints<br />
must first be established. This work will<br />
establish the toxicity of DU on amphibians.<br />
Results may also prove useful in<br />
monitoring the effects of the recent Cerro<br />
Gr<strong>and</strong>e fire.<br />
The long-term benefits of this research<br />
project will be the provision of data<br />
needed in developing ecological risk<br />
assessments for amphibia such as the<br />
Jemez Mountains salam<strong>and</strong>er (Plethodon<br />
neomexicanus), which is endemic only to<br />
the Jemez Mountains in north-central<br />
New Mexico <strong>and</strong> listed by New Mexico<br />
Department of Game <strong>and</strong> Fish as endangered.<br />
Another long-term benefit is the<br />
contribution of information that can be<br />
used by regulatory agencies to develop<br />
state <strong>and</strong> national water quality criteria<br />
for uranium in amphibia. Currently, fish<br />
are the st<strong>and</strong>ard aquatic test organisms in<br />
developing water quality criteria.<br />
However, mounting evidence indicates<br />
the embryonic <strong>and</strong> juvenile stage of<br />
amphibians (tadpoles) may be more<br />
susceptible to contaminant effects than<br />
fish.<br />
Methods<br />
Amphibia Collection <strong>and</strong> Rearing.<br />
In April <strong>and</strong> May of 1999 several aquatic<br />
habitat sites in northern <strong>and</strong> north-central<br />
New Mexico were visited <strong>and</strong> surveyed<br />
for chorus frogs. St<strong>and</strong>ing collection by<br />
netting was used at a site where chorus<br />
frogs were present to capture frogs for<br />
transport to New Mexico State University<br />
(NMSU) for the development of a captive<br />
breeding capability in June 2000.<br />
Test Solutions. A Memor<strong>and</strong>um of<br />
Agreement between the Regents of<br />
NMSU <strong>and</strong> the Regents of the University<br />
of California established mutual commitments<br />
between the two universities to<br />
collect surface soil containing DU from<br />
LANL <strong>and</strong> its delivery to NMSU.<br />
Approximately 50 pounds (23 kg) of DUcontaining<br />
soil was collected, sieved,<br />
homogenized, <strong>and</strong> analyzed for total<br />
uranium <strong>and</strong> 33 additional metals by<br />
mass spectrometry at the NMSU<br />
Carlsbad Environmental Monitoring <strong>and</strong><br />
Research Center (CEMRC) in Carlsbad,<br />
NM. The purpose of the analyses of the<br />
additional constituents is to determine<br />
whether the study is confounded by<br />
toxicants other than uranium, i.e.,<br />
whether any observed effects on amphibia<br />
are the result of metals other than<br />
uranium. The analytical results of the<br />
supernatant test water are shown in<br />
Table 1.<br />
Objectives. The objective of the<br />
proposed work is to develop DU/<br />
amphibian toxicity benchmarks through<br />
acute <strong>and</strong> chronic testing of embryonic<br />
development <strong>and</strong> growth of a st<strong>and</strong>ard<br />
amphibian model, the South African<br />
clawed frog (Xenopus laevis) <strong>and</strong> the<br />
western chorus frog (Pseudacris<br />
triseriata), a species native <strong>and</strong> common<br />
to LANL (Fig. 1). The results from the<br />
clawed frog toxicity assays will allow<br />
direct comparison with results of toxicity<br />
assays using the western chorus frog<br />
collected from l<strong>and</strong>s adjacent to LANL.<br />
Corollary field studies on the chorus frog<br />
will ultimately provide the needed<br />
complement to this study. Figure 1. Adult chorus frog at the NMSU<br />
aquatic toxicology lab. (Photo taken by Gil<br />
Gonzales, LANL.)
Table 1. Concentration (µg/L) of metals in treatment <strong>and</strong> control test solutions.<br />
Environment<br />
Medium Ba Be Cd Cu Fe Mg Mn Mo Na Pb Sb Sr Ti U Zn<br />
FETAX Solution 1<br />
Reference Water 2<br />
Well Water (negative<br />
control) 3<br />
Positive Control 4<br />
0.7 0.1 0.1 0.8 115 12137 0.2 -0.5 2.5E+05 0.2 -0.1 11.9 16.8 21.4 6.3<br />
518 0.3 0.0 0.4 413 11194 63 1.2 3.2E+04 0.8 -0.1 508 55.6 2.3 21.0<br />
63 0.1 0.1 0.1 226 10144 8.8 2.5 4.3E+04 -0.7 -0.1 706 38.1 8.7 0.8<br />
0.7 0.1 0.0 2.7 67 11161 -0.4 -0.4 2.5E+05 0.1 -0.1 12.1 17.2 0.3 7.0<br />
100% test water 1283 1.1 10.3 44.7 312 7888 0.3 47.8 3.9E+04 8.5 64.0 464 57.2 5309 13.6<br />
50% test water 612 0.9 5.5 47.5 212 9449 5.1 21.7 1.8E+05 7.5 28.8 216 37.3 2997 15.2<br />
25% test water 295 0.4 1.0 33.8 155 10368 2.8 10.3 2.5E+05 5.5 13.8 113 28.1 1711 14.7<br />
12.5% test water 150 0.5 1.6 20.1 123 10580 1.2 4.8 2.7E+05 3.6 7.1 62 22.6 1342 12.0<br />
Min Detection Level 3.1 0.5 0.5 6.5 150 103 1.1 1 3.8E+02 1.7 1.4 5.1 2.4 0.03 13<br />
1<br />
The FETAX solution is a balanced nutrient salt solution st<strong>and</strong>ard that allows the production of data that are repeatable, reliable, <strong>and</strong><br />
comparable to other FETAX research results.<br />
2<br />
Reference water, one of the four control solutions, is water that was aged with soil collected from the reference site outside of LANL<br />
<strong>and</strong> is expected to be relatively free of DU, but also is expected to have natural deposits of the naturally occurring heavy <strong>and</strong> trace<br />
metals.<br />
3<br />
The negative control consists of well water, which is expected to be relatively free of the metals of toxicological concern <strong>and</strong> is used<br />
in preparation of the test solutions <strong>and</strong> the reference water.<br />
4<br />
The positive control consists of 6-aminonicatinamide, which is used as a reference toxicant. With a known EC50 for malformation in<br />
tadpoles, the target response rate to this control must be achieved for experimental validation.<br />
Acute <strong>and</strong> Chronic Depleted<br />
Uranium Exposures. DU-aged test<br />
solutions were prepared from the aging of<br />
water with the DU-contaminated soil.<br />
Corresponding reference solutions (free<br />
of DU contamination) were also produced.<br />
The Frog Embryonic Teratogenic<br />
Assays-Xenopus (FETAX) acute toxicity<br />
tests are being conducted to determine<br />
the effects of DU on embryonic amphibian<br />
development when, during the<br />
developmental stage, unique cellular <strong>and</strong><br />
molecular processes operate to form a<br />
complex multicellular organism. During<br />
this stage, the processes are easily<br />
perturbed by chemicals. The FETAX<br />
acute toxicity assay results in st<strong>and</strong>ard<br />
endpoints of concentration-response<br />
mortality, <strong>and</strong> malformation curves are<br />
generated using probit analysis (Bantle<br />
1995). Embryo death is being measured<br />
by the 96-h LC 50 . Embryo malformation<br />
is being measured by 96-h EC 50 . A<br />
teratogenic index (TI) is then calculated<br />
as a measure of developmental hazard<br />
(TI = 96-h LC 50 /96-h EC 50 ). This value<br />
can then be used to rank toxicants<br />
according to their teratogenic hazard. The<br />
minimum concentration to inhibit growth<br />
is being calculated by measuring body<br />
length at the end of the acute toxicity<br />
tests.<br />
The chronic toxicity tests will be<br />
conducted on both amphibian species<br />
beginning at the tadpole stage to determine<br />
the effects of DU on hind-limb<br />
formation <strong>and</strong> tail resorption. The effects<br />
on hind-limb formation will be evaluated<br />
by exposing young larvae to DU-aged<br />
water for approximately 21 days. At the<br />
end of the test, the rate of development of<br />
the hind-limbs <strong>and</strong> any malformations<br />
will be evaluated. The rate of tail<br />
resorption will be monitored by exposing<br />
50-day-old tadpoles to DU-aged water<br />
(Fort et al. 1999).<br />
Chemical <strong>and</strong> Statistical Analyses.<br />
The acute <strong>and</strong> chronic toxicity tests will<br />
result in two matrices requiring analysis<br />
of DU concentrations: test water <strong>and</strong><br />
whole organisms (embryos <strong>and</strong> tadpoles)<br />
collected before <strong>and</strong> during the toxicity<br />
tests. Total uranium will be analyzed<br />
using trace metal analysis at the CEMRC<br />
in Carlsbad, NM. The CEMRC is a state-<br />
of-the-art facility designed to monitor a<br />
wide range of chemicals, including<br />
radionuclides. Trace metal analysis at<br />
CEMRC meets the U.S. Environmental<br />
Protection Agency level-4 requirements<br />
where the minimum detection limits are<br />
determined as three times the st<strong>and</strong>ard<br />
deviation of the method blanks. The<br />
analyses are conducted with a Perkin–<br />
Elmer ELAN-6000 Inductively Coupled<br />
Plasma-Mass Spectrometer, allowing for<br />
analysis of up to 39 metals with a short<br />
turnaround time (2 to 3 weeks).<br />
FETAX will provide information on<br />
the developmental toxicity of DU on two<br />
amphibian species. Concentrationresponse<br />
data for mortality <strong>and</strong> growth<br />
will be collected <strong>and</strong> compared with a<br />
reference soil. A nonlinear relationship<br />
will be observed between concentration<br />
<strong>and</strong> developmental toxicity responses<br />
from which a nonlinear model will be<br />
employed with the assistance of<br />
Dr. William Gould of the NMSU<br />
Experimental Statistics Center.<br />
17
Environment<br />
Progress <strong>and</strong> Results<br />
Collection, Rearing, <strong>and</strong> Maintenance<br />
of Test Amphibians. Breeding<br />
adults of the clawed frog have been<br />
purchased from commercial suppliers <strong>and</strong><br />
are currently being grown at the<br />
coinvestigator’s research facilities at<br />
NMSU. The clawed frogs have been put<br />
on a breeding rotation <strong>and</strong> are injected<br />
with hormone (human chorionic gonadotropin)<br />
every 60 days to maintain the<br />
viabilty of the eggs.<br />
In May 2000, approximately 25<br />
chorus frogs were collected <strong>and</strong> an<br />
additional 15 were collected in June of<br />
2001 in the Canjilon area (Fig. 2) (off<br />
DOE LANL property) of the Carson<br />
National Forest in northern New Mexico.<br />
The frogs are currently housed at the coinvestigators<br />
research facilities at NMSU<br />
where they are being studied to develop a<br />
captive breeding capability in the<br />
laboratory.<br />
Figure 2. Aquatic habitat in Canjilon area<br />
of northern New Mexico where adult<br />
chorus frogs were captured.<br />
Optimal rearing environmental factors<br />
(i.e., photoperiod, temperature, humidity)<br />
<strong>and</strong> breeding techniques are being<br />
developed <strong>and</strong> evaluated to induce<br />
breeding in a laboratory setting. This<br />
information is being used to develop a<br />
program for the environmental chamber<br />
to simulate natural climatic conditions<br />
that will, in turn, induce breeding in the<br />
chorus frog.<br />
Experimental Batch Solutions.<br />
Experimental DU batch treatment<br />
solutions <strong>and</strong> control soultions were<br />
prepared. Table 1 shows the analytical<br />
18<br />
results for 15 metals in treatment <strong>and</strong><br />
control test solutions. A small subsample<br />
was also screened for gross alpha<br />
(2 nCi/g), beta (7 nCi/g), <strong>and</strong> gamma<br />
(1.5 nCi/g) radioactivity.<br />
Acute Exposure Pilot <strong>and</strong> Range<br />
Finding Tests. With the use of the<br />
human chorionic gonadotropin to induce<br />
amplexus, clawed frogs have been<br />
successfully bred <strong>and</strong> used in a series of<br />
pilot studies to develop <strong>and</strong> refine the<br />
techniques in the FETAX protocol.<br />
Several range finding tests have also been<br />
conducted whereby clawed frog larvae<br />
have been acutely exposed to DU using<br />
DU-aged water.<br />
Acute Toxicity Tests. Three pairs of<br />
adult clawed frogs were bred <strong>and</strong> the<br />
eggs were harvested. These eggs were<br />
then used in the four-day toxicity tests.<br />
Three separate tests were run simultaneously.<br />
Each test used eggs from only<br />
one pair of frogs. The average percent<br />
mortality for the FETAX controls in one<br />
of the three tests was above 10%; as a<br />
result, that test was eliminated in the<br />
summation of the results. Therefore, the<br />
results represent an average of the<br />
remaining two tests. Test water concentrations<br />
ranging from 6.0 to 96.5 µg/L<br />
showed no concentration-response for<br />
mortality or for malformations (Table 2).<br />
Table 2. Percent cumulative mortality of<br />
Xenopus laevis in a 96-h exposure to test<br />
water containing DU.<br />
Medium<br />
Cumulative<br />
Mortality (%)<br />
Control 4<br />
Reference 0<br />
Positive Control 100<br />
Test Solution<br />
(% Dilution)<br />
6.25 0<br />
12.50 0<br />
25.00 8<br />
50.00 2<br />
100.00 2<br />
Chronic toxicity tests. Pilot studies<br />
for the 21-day hind limb formation test<br />
have been conducted. Early results<br />
indicated a problem with the rate of<br />
development in all the tadpoles, including<br />
the controls. Further tests are being<br />
conducted to determine the role of food,<br />
control water (FETAX solution), <strong>and</strong><br />
amount of test water.<br />
References<br />
AEPI (Army Environmental Policy<br />
Institute), “Health <strong>and</strong> environmental<br />
consequences of depleted uranium use in<br />
the U.S. Army: technical report,” Georgia<br />
Institute of <strong>Technology</strong>, Atlanta, GA<br />
(1995).<br />
ASTM (American Society for Testing<br />
<strong>and</strong> Materials), “St<strong>and</strong>ard guide for<br />
conducting embryo teratogenesis assay-<br />
Xenopus (FETAX), E 1439-91,<br />
Philadelphia, PA 825–835 (1991).<br />
Bantle, J.A., “FETAX- A developmental<br />
toxicity assay using frog embryos,” in<br />
Fundamentals of Aquatic Toxicology:<br />
Effects, Environmental Fate, <strong>and</strong> Risk<br />
Assessment, G.M. R<strong>and</strong> (editor), Taylor<br />
<strong>and</strong> Francis Publishers, Washington, DC,<br />
207–230 (1995).<br />
Becker, N.M., “Quantification of<br />
uranium transport away from firing sites<br />
at Los Alamos National Laboratory— A<br />
mass balance approach,” in Proceedings<br />
of the Symposium on Waste Management:<br />
<strong>Technology</strong> <strong>and</strong> Programs for Radioactive<br />
Waste Management <strong>and</strong> Environmental<br />
Restoration, E.G. Post (Editor),<br />
March 1–5, 1992; Tucson, AZ (1992).<br />
Carey, C. <strong>and</strong> C.J. Bryant, “Possible<br />
interrelations among environmental<br />
toxicants, amphibian development, <strong>and</strong><br />
decline of amphibain populations,”<br />
Environmental Health Perspectives, Vol.<br />
103 Supplement 4, 13–17 (1995).<br />
Ebinger, M.H, E.H. Essington, E.S.<br />
Gladney, B.D. Newman, <strong>and</strong> C.L.<br />
Reynolds, “Long-term fate of depleted<br />
uranium at Aberdeen <strong>and</strong> Yuma proving<br />
grounds,” Los Alamos National Laboratory<br />
report LA-11790-MS (1990).
Eckelmeyer, K.H, “Uranium <strong>and</strong> uranium<br />
alloys,” in ASM International H<strong>and</strong>book<br />
Committee, Metals H<strong>and</strong>book, Vol. 2.<br />
Properties <strong>and</strong> Selection, Nonferrous<br />
Alloys <strong>and</strong> Special Purpose Materials,<br />
American Society of Metals, International<br />
Materials Park, OH, 670–681<br />
(1990).<br />
Eisler, R., “Cadmium hazards to fish,<br />
wildlife, <strong>and</strong> invertebrates: A synoptic<br />
review,” U.S. Fish <strong>and</strong> Wildlife Service,<br />
Contaminant Hazard Reviews Report No.<br />
2, Biological Report No. 85 (1.2) (1985).<br />
Eisler, R., “Lead hazards to fish, wildlife,<br />
<strong>and</strong> invertebrates: A synoptic review,”<br />
U.S. Fish <strong>and</strong> Wildlife Service, Contaminant<br />
Hazard Reviews Report No. 14,<br />
Biological Report No. 85 (1.14) (1988).<br />
Ferenbaugh R., O. Meyers, M. Ebinger,<br />
A. Gallegos, <strong>and</strong> D. Breshears, “Ecological<br />
risk assessment approach for Los<br />
Alamos National Laboratory,” Los<br />
Alamos National Laboratory report<br />
LA-UR-96-766 (1996).<br />
Fort, D.J., T.L. Propst, E.L. Stover, J.C.<br />
Helgen, R.B. Levey, K. Gallagher, <strong>and</strong><br />
J.G. Burkhart, “Effects of pond water,<br />
sediment, <strong>and</strong> sediment extracts from<br />
Minnesota <strong>and</strong> Vermont, USA, on early<br />
development <strong>and</strong> metamorphosis of<br />
Xenopus,” Environmental Toxicology<br />
<strong>and</strong> Chemistry 18:2305–2315 (1999).<br />
Fresquez, P., D.R. Armstrong, <strong>and</strong> J.G.<br />
Salazar, “Radionuclide concentrations in<br />
game <strong>and</strong> non-game fish upstream <strong>and</strong><br />
downstream of Los Alamos National<br />
Laboratory: 1981 to 1993,” Los Alamos<br />
National Laboratory report LA-12818-<br />
MS (1994).<br />
Gallegos, A.F., G.J. Gonzales, K.D.<br />
Bennett, L.E. Pratt, <strong>and</strong> D.S. Cram, “A<br />
spatially-dynamic preliminary risk<br />
assessment of the American peregrine<br />
falcon at the Los Alamos National<br />
Laboratory,” Los Alamos National<br />
Laboratory report LA-13321-MS (1997).<br />
Gonzales G.J., A.F. Gallegos, M.A.<br />
Mullen, K.D. Bennett, <strong>and</strong> T.S. Foxx,<br />
“Preliminary risk assessment of the<br />
southwestern willow flycatcher<br />
(Empidonax traillii extimus) at the Los<br />
Alamos National Laboratory,” Los<br />
Alamos National Laboratory report LA-<br />
13508-MS (1998).<br />
Environment<br />
Hanson, W.C. <strong>and</strong> F.R. Miera, Jr.,<br />
“Long-term ecological effects of exposure<br />
to uranium,” Los Alamos Scientific<br />
Laboratory report LA-6269-MS (1976).<br />
Kuhne, W.W., “Effects of depleted<br />
uranium on the survival <strong>and</strong> health of<br />
Ceriadaphnia dubia <strong>and</strong> Hyalella<br />
azteca,” Master of Science Thesis, New<br />
Mexico State University (2000).<br />
Ulsh, B., M. Muhlman-Diaz, F.W.<br />
Whicker, J. Bedford, T. Hinton, <strong>and</strong> J.<br />
Congdon. 1999. Reptilian <strong>and</strong> amphibian<br />
evaluation methods. Proceedings of the<br />
Wildlife <strong>Application</strong>s to Remediation<br />
Decision-Making Conference, 17–19<br />
Aug., Denver, CO.<br />
Whicker, W.F., <strong>and</strong> V. Schultz. 1982.<br />
Radioecology: Nuclear Energy <strong>and</strong> the<br />
Environment, CRC Press, Inc., Boca<br />
Raton, FL.<br />
19
Environment<br />
Modification of the Los Alamos/Canberra Environmental Continuous Air Monitor<br />
(ECAM) Inlet for Enhanced Performance by Removal of Fine Particles<br />
Principle Investigator: John C. Rodgers (ESH-4)<br />
Collaborators: Suilou Huang, Atmospheric Radioactivity Group, New Mexico Institute of Mining <strong>and</strong> <strong>Technology</strong>,<br />
Socorro, New Mexico<br />
Funding: <strong>FY</strong>01, $15K plus $8K supplemental ($23K).<br />
Introduction<br />
In the post-fire assessments <strong>and</strong><br />
discussions of the Cerro Gr<strong>and</strong>e fire, a<br />
number of challenging questions have<br />
been raised in regard to the sources <strong>and</strong><br />
radionuclide identities associated with<br />
gross-alpha <strong>and</strong> gross-beta activity in the<br />
smoke plumes. One particular concern is<br />
that apparently Los Alamos National<br />
Laboratory (LANL, the Laboratory) had<br />
no way to rapidly monitor the smoke<br />
plumes generated on-site to determine if<br />
there were significant quantities of manmade<br />
alpha-emitting radionuclides being<br />
released into the air. Although there were<br />
good grounds for believing that the<br />
increased alpha activity in the smoke<br />
from this fire was derived from naturally<br />
occurring radon progeny, especially<br />
210Po, released from burning vegetation<br />
<strong>and</strong> forest floor litter (M.F. LeCloarec et<br />
al 1995; Nho et. al. 1996 ), it was<br />
difficult to quickly confirm this because<br />
of sample size <strong>and</strong> analysis requirements.<br />
Generally, in the absence of fire<br />
conditions on-site, it is advantageous to<br />
be able to continuously monitor for<br />
alpha-emitting radionuclides under<br />
ambient conditions with sufficient<br />
sensitivity to address worker safety<br />
concerns. Such monitoring would require<br />
a continuous air-monitoring instrument<br />
with a high-volumetric sampling rate to<br />
quickly acquire a detectable quantity of<br />
alpha radionuclides from elevated<br />
concentrations in the air, but also an<br />
accurate means for correcting the gross<br />
alpha count for the interference effects of<br />
radon progeny collected in the sample.<br />
The alpha energy of certain of the radon<br />
progeny is close to the emission energy<br />
of plutonium <strong>and</strong> americium, <strong>and</strong> thus<br />
activity in their low-energy tails overlap<br />
20<br />
with the energy levels of these transuranics,<br />
creating interference (e.g., 239Pu = a<br />
5.15 MeV, 241Am = 5.49 MeV, a 218Po = a<br />
6.0 MeV, 214Po = 7.69 MeV).<br />
a<br />
The short-lived radon progeny occur<br />
in the air at levels in the range of tenths<br />
of pCi/l, depending on time of day,<br />
conditions of the atmosphere, <strong>and</strong> other<br />
factors. At these concentrations, backgrounds<br />
of natural alpha emitters create<br />
serious interference with the detection of<br />
levels of man-made alpha emitters, which<br />
would be of concern. These interference<br />
effects can be partially corrected by alpha<br />
spectroscopy-based spectral analysis <strong>and</strong><br />
removal of overlapping sources of<br />
counts. By a combined process of such<br />
background correction to reduce the<br />
degree of interference, <strong>and</strong> increased<br />
sampling rate to accumulate larger<br />
quantities of particulate radionuclides of<br />
concern, real-time monitoring can offer<br />
useful ambient monitoring results in<br />
applications on-site.<br />
Concept Over the past several years,<br />
the Laboratory has developed (<strong>and</strong> an<br />
industrial partner, Canberra Industries,<br />
has commercialized) an environmental<br />
continuous air monitor for alpha-emitting<br />
radionuclides (alpha-ECAM). ECAM has<br />
special environmental inlet <strong>and</strong> weathertight<br />
enclosure, capable of higher<br />
sampling rates (over 3 CFM), <strong>and</strong><br />
incorporating alpha-spectroscopy based<br />
background interference correction<br />
algorithms.<br />
The instrument was designed to<br />
provide accident-response air monitoring<br />
for responder protection in the vicinity of<br />
spills or accidents to which the Accident<br />
Response Group (ARG) might be called.<br />
The design of the ECAM inlet <strong>and</strong> the<br />
sampling train are such that attained<br />
levels of sensitivity <strong>and</strong> periods of<br />
sampling without filter change are<br />
suitable for the worker protection mission<br />
in most conditions. However, were the<br />
sampling rate through this inlet to be<br />
simply increased (tripled or quadrupled)<br />
in an attempt to increase sensitivity,<br />
quantities of radon progeny collected<br />
would correspondingly increase, along<br />
with the rate of dust loading <strong>and</strong> rapidity<br />
of filter clogging leading to frequent filter<br />
changes. Clogging would be made worse<br />
by the presence of smoke in the air.<br />
As shown in Figure 1, wood smoke<br />
rapidly clogs CAM filters. At an initial<br />
sampling rate of about 3 CFM, the filter<br />
clogs in about 30 minutes. At 10 CFM,<br />
the time to failure would be even shorter.<br />
Smoke particles generated by burning<br />
wood are generally in the 0.01 µm –<br />
1.0 µm size range. Both theoretical <strong>and</strong><br />
experimental studies indicate this is the<br />
size responsible for the most rapid<br />
clogging of filters (Brown 1993). The<br />
particle size associations of the radon<br />
progeny in the environment are also<br />
small: George (1972) found that the<br />
activity median aerodynamic diameter<br />
(AMAD) of radon progeny in rural<br />
outdoor air is approximately 0.3 µm. In<br />
contrast, in a survey of published<br />
measurements of the AMAD of environmental<br />
samples of radioactive particulates<br />
(Dorian 1997) found that while<br />
fallout aerosols <strong>and</strong> natural radioactive<br />
aerosols are found in a size mode about<br />
1 µm, for the case of resuspended manmade<br />
radionuclide aerosols in the<br />
environment, an AMAD of about 6 µm<br />
was reported. There is, then, an opportunity<br />
to address the problem of interference<br />
<strong>and</strong> clogging by size-selective<br />
sampling. If the fine component
(D < 1 µm) of a polydisperse environ-<br />
p<br />
mental particulate aerosol could be<br />
reasonably efficiently separated from the<br />
large components in the inlet stage of an<br />
ECAM, before filtration, while the larger<br />
particle components are captured, then it<br />
would be possible to greatly increase the<br />
sampling rate (<strong>and</strong> thereby the sample<br />
size of the transuranics). The increased<br />
sampling rate would not fully incur the<br />
penalties of increased collection of radon<br />
progeny that interfere with alpha<br />
detection of transuranics, <strong>and</strong> increased<br />
filter loading by fine particles that<br />
contribute most to rapid clogging. While<br />
clogging could eventually occur (complete<br />
separation is not practical), it would<br />
be at a much lower rate than would be<br />
expected at the elevated sampling rate of,<br />
say, 10 CFM.<br />
Objectives The objective of the<br />
project is to design a modified inlet for<br />
the ECAM that would achieve just such a<br />
separation <strong>and</strong> support much higher<br />
sampling rates. The technique under<br />
investigation is an application of size<br />
selective sampling using a virtual<br />
impactor to achieve separation.<br />
In virtual impactor sampler design,<br />
particle laden air passing into the inlet is<br />
first accelerated through a jet forming<br />
accelerator nozzle.The jet of air impacts<br />
into a co-axially aligned receiver nozzle<br />
of slightly larger diameter. Flow drawn<br />
into the receiver nozzle is at a rate<br />
typically 1/10th or less of the accelerator<br />
jet flow. As a result, the slowly moving<br />
air of the receiver nozzle acts as a<br />
‘virtual’ surface. The surface abruptly<br />
deflects most of the sampled air away<br />
from <strong>and</strong> around the receiver, where it is<br />
collected <strong>and</strong> discharged as the major<br />
flow component of the sample. Larger<br />
size particles, due to their inertia, cross<br />
the deflected streamlines, go into the<br />
receiver nozzle, <strong>and</strong> are carried to the<br />
sample filter in the minor flow.<br />
A schematic cross section drawing of<br />
how a virtual impactor stage acts to<br />
separate small <strong>and</strong> large particles is<br />
shown in Figure 2. With proper design, it<br />
should be possible to construct a virtual<br />
impactor-separator having a sharp D50 cut-point diameter (that particle diameter<br />
at which 50% of the particles are collected<br />
in the major flow <strong>and</strong> 50% in the<br />
minor flow). The results of the first<br />
year’s studies of this concept have<br />
generally confirmed the expectation that<br />
the goal of efficient separation of<br />
components of the sample can be<br />
achieved. Results have also shown that<br />
scaling from single nozzle configurations<br />
to multinozzle, high-sampling rate<br />
systems is challenging <strong>and</strong> requires<br />
careful design <strong>and</strong> meticulous construction<br />
for success.<br />
Impact Success with the design of a<br />
modified alpha-ECAM inlet capable of<br />
operation at sampling rates 3 or 4 times<br />
the rate of a laboratory CAM, with<br />
comparable increases in sensitivity, could<br />
help address public concerns about<br />
Flow through filter (CFM)<br />
3.00<br />
2.50<br />
2.00<br />
1.50<br />
1.00<br />
0.50<br />
0.00<br />
Environment<br />
Laboratory capabilities for rapidly<br />
determining if large concentrations of<br />
man-made alpha-emitting radionuclides<br />
are present in ambient smoke or dust<br />
generated on site. Even discussions about<br />
possibly including the present ARG<br />
alpha-ECAM in the Laboratory air<br />
surveillance network has been favorably<br />
received by the community press<br />
(Snodgrass 2001). While ECAM deployment<br />
will never achieve the level of<br />
sensitivity required for perimeter monitoring,<br />
it could play a supporting role in<br />
the Laboratory <strong>and</strong> University of California<br />
(UC) efforts to provide continuing<br />
community feedback on incidents that<br />
might be perceived to have public<br />
impacts. Furthermore, if improved<br />
performance of the ARG ECAM could be<br />
0.00 5.00 10.00 15.00 20.00 25.00 30.00<br />
Minutes after smoke release starts<br />
Figure 1. Effects of wood smoke on the sample flow rate through an ECAM filter: Flow rate<br />
(CFM), is plotted over time from the beginning of smoke release. Decline in flow is a nearexponential<br />
function of the mass of small particles collected.<br />
Figure 2. Schematic cross section of a virtual impactor. A high-velocity jet air is formed in<br />
the accelerator nozzle directed at the receiver nozzle of slightly larger diameter. Small<br />
particle trajectories are shown first entering <strong>and</strong> then exiting the receiver nozzle in deflected<br />
major flow. The large particle trajectories continue down into the receiver nozzle <strong>and</strong> are<br />
transported to a sample filter in the minor flow.<br />
21
Environment<br />
achieved, Laboratory emergency<br />
responders could be provided with<br />
enhanced real-time air monitoring of<br />
ambient conditions if they are called out<br />
where suspect emissions are occurring.<br />
This would help managers track exposure<br />
conditions <strong>and</strong> assure that appropriate<br />
levels of personal protective equipment<br />
(PPE) are being used.<br />
Methods<br />
Our approach to the development of a<br />
suitable virtual impactor separator stage<br />
as a modification to the ECAM inlet has<br />
included both theoretical <strong>and</strong> experimental<br />
aspects. An initial design effort was<br />
based on predictive equations reported in<br />
the technical literature that are expected<br />
to result in successful designs (Marple<br />
<strong>and</strong> Chein 1980, Marple et.al. 1993, Loo<br />
<strong>and</strong> Cork 1988), <strong>and</strong> recent design<br />
enhancements reported by Kim <strong>and</strong> Lee.<br />
The experimental studies began with an<br />
evaluation of a test-bed single nozzle<br />
virtual impactor design with a predicted<br />
D cut-point diameter of 2.5 µm. As<br />
50<br />
shown in Figure 3., this test unit consists<br />
of a single accelerator jet nozzle positioned<br />
in the body section opposite the<br />
receiver nozzle. The unit is designed for<br />
easy disassembly for study. Sizeseparation<br />
efficiency tests were conducted<br />
in the Atmospheric Radioactivity<br />
Laboratory at New Mexico Institute of<br />
Mining <strong>and</strong> <strong>Technology</strong> (NMIMT) using<br />
a technique developed for CAM studies<br />
that involve the labeling of inert test<br />
particles with high enough levels of<br />
radon progeny to allow measurement by<br />
alpha-counting.<br />
Figure 4 illustrates the radon progeny<br />
labeling step. The radon progeny are<br />
injected in an air stream flowing over the<br />
particles spread on a filter <strong>and</strong> are<br />
deposited on the particles by electrostatic<br />
deposition induced by a high-voltage<br />
field. (Huang et al. 2001) The labeled<br />
aerosols are then dispersed in a mixing<br />
chamber <strong>and</strong> applied to the test instrument<br />
via a transport line (Figure 5) Filters<br />
collected from the instrument <strong>and</strong><br />
reference samplers are then simultaneously<br />
counted in an alpha-counter array<br />
(Figure. 6). To test particle size selective<br />
22<br />
sampling efficiencies, mixtures of radonprogeny<br />
labeled smoke particles <strong>and</strong><br />
particles of iron oxide (0.3–0.8 µm),<br />
glass bead particles ( 3.0–10.0 µm), or<br />
gold particles (5.0 µm), representing the<br />
large diameter target species were<br />
prepared. These mixtures were sampled<br />
from the mixing chamber through the test<br />
Impactor body section<br />
Impactor receiver nozzle<br />
Impactor accelerator jet<br />
nozzle<br />
virtual impactor, <strong>and</strong> later, through a<br />
multinozzle impactor array in a modified<br />
ECAM inlet. In the test unit, separate<br />
pumps were used to establish the major<br />
flow at 1.45 CFM, shunting aside most of<br />
the small particles in the sample, <strong>and</strong> to<br />
establish the minor flow of 0.15 CFM<br />
(i.e., 10:1 ratio) through the receiver<br />
Figure 3. The test-bed virtual impactor system: a single nozzle accelerator <strong>and</strong> receiver<br />
setup. The major flow is extracted through the hose barb on the right side of the body<br />
section. The minor flow is withdrawn from the base of the receiver nozzle (bottm right),<br />
shown still attached to the base manifold. Flow into this virtual impactor feeds into the<br />
accelerator nozzle (left), which mounts through a top manifold plate (not shown here) on<br />
the top of the body section.<br />
Radon supply<br />
HV power<br />
supply<br />
Test particle holder<br />
Figure 4. Labeling test particles with radon progeny: Test particles are mounted on a filter<br />
<strong>and</strong> exposed to radon progeny in a small chamber where a high-voltage field is applied,<br />
causing electrostatic deposition onto the particles.
Aerosol<br />
mixing<br />
chamber<br />
Test Virtual<br />
Impactor<br />
Minor flow<br />
Major flow<br />
Pumps<br />
<strong>and</strong> supply<br />
air<br />
Figure 5. Mixing chamber <strong>and</strong> test fixtures: Particles labeled with radon progeny are<br />
introduced into a large volume of air in the mixing chamber. The aerosol is drawn into the<br />
test virtual impactor (bottom right) through the accelerator. Flow then splits, with the major<br />
flow (1.45 CFM) drawn off with a separate pump. The minor flow (0.15 CFM) is extracted<br />
out of the base of the receiver. Filter cartriges in these separate flows collect radioactive<br />
labeled particles for later counting.<br />
Alpha<br />
Detectors<br />
Power<br />
supplies<br />
<strong>and</strong><br />
counters<br />
Figure 6. Multiple alpha detector <strong>and</strong> scalar array: The sample <strong>and</strong> reference filters<br />
containing radon-progeny labeled particles collected in tests of the virtual impactor are<br />
simultaneously counted in an array of ZnS(Ag) alpha-scintillation detector/scalar counters.<br />
Environment<br />
nozzle to capture the separated large<br />
particles along with a portion of the small<br />
particles.<br />
Progress <strong>and</strong> Results<br />
Test Virtual Impactor. Studies with<br />
the test-bed impactor demonstrated that<br />
the predicted cut-point based on accelerator<br />
nozzle diameter was approximately<br />
reached (observed D ~ 2.8 µm). See<br />
50<br />
Figure 7. Tests with the gold particles<br />
showed that 94% of these particles<br />
followed the minor flow path as predicted.<br />
However, internal losses on the<br />
receiver tip <strong>and</strong> other surfaces proved to<br />
be larger than expected. Literature values<br />
for expected losses range from less than<br />
1% to over 40% depending on design,<br />
particle size, <strong>and</strong> other factors. We<br />
anticipated that losses could be held to<br />
about 20%. Experimentally, losses were<br />
found to be as much as 39% instead. At<br />
the same time, there was nearly 6 times<br />
the amount of the large particles collected<br />
on the impactor filter as collected by a<br />
reference sample filter having the same<br />
flow rate. This fact demonstrates the<br />
enormous potential for large particle<br />
enrichment in the low flow (here, 0.15<br />
CFM) stream of a virtual impactor<br />
operating at considerably higher total<br />
flow rate (here, 1.6 CFM).<br />
The large internal deposition observed<br />
prompted a trial of a modified receiver<br />
design based on the work of Kim <strong>and</strong><br />
Lee. In their work, the entrance section<br />
(they call it a “flow guide” section) is<br />
flared out at a 30º angle, <strong>and</strong> the bore<br />
through the center exp<strong>and</strong>s from 0.64 cm<br />
near the tip into a larger diameter 0.94 cm<br />
bore through the rest of the receiver. We<br />
constructed a test receiver based on this<br />
design, as shown in the photograph,<br />
Figure 8a. The base of the new test<br />
receiver was designed with a threaded<br />
section so that the gap space between the<br />
accelerator <strong>and</strong> receiver could be adjusted<br />
in tests to determine if this were a critical<br />
design factor. A repeat of labeled particle<br />
tests with the modified receiver design<br />
showed that although the D cut-point<br />
50<br />
was shifted down (to 2 µm), the<br />
interstage losses were at least as large or<br />
larger, so that the cut point is not as<br />
sharply defined. At this point in the study<br />
23
Environment<br />
Figure 7. Speration efficiency as a function of particle size in the test unit: It is defined as<br />
the ratio of radioactivity in the minor flow to the sum radioactivity of the minor flows. The<br />
error bars are the measurement uncertainties. Also shown is a fitting line of an exponential<br />
function. The cutoff aerodynamic diameter for the virtual impactor is 2.8 mm. The fraction<br />
of fine particles being captured along with the large particle flow is only approximately<br />
20%, while the large particle fraction is nearly quantitative.<br />
(a)<br />
(b)<br />
24<br />
Separation Efficiency<br />
1.2<br />
1<br />
0.8<br />
0.6<br />
0.4<br />
0.2<br />
before applying the calibration factor<br />
0<br />
0.1 1 10 100<br />
Aerodynamic Diameter, µm<br />
Major<br />
flow to<br />
plenum<br />
Figure 8. Modified receiver nozzle design:<br />
A receiver nozzle with the “flow guide”<br />
modification is shown mounted in the<br />
test-bed virtual impactor (a). The<br />
accelerator <strong>and</strong> receiver bore diameters<br />
were not adjusted in this stage of the<br />
design. A 5-nozzle array of these receivers<br />
was designed for a full-scale test in a<br />
prototype ECAM.<br />
The design (b) has as circular array of<br />
receivers mounted between two manifold<br />
plates defining a volume that accumulates<br />
the major flow passing from the top plate<br />
through small holes shown. The major flow<br />
is drawn into a plenum <strong>and</strong> discharges by<br />
the major flow pump. The minor flow exits<br />
through the bore of the receivers <strong>and</strong><br />
passes down through the CAM head to the<br />
sample collection filter at the base.<br />
Minor<br />
flow path<br />
out of<br />
receiver<br />
after applying the calibration factor<br />
we decided, based on time constraints for<br />
design, construction, <strong>and</strong> testing of a<br />
high-volume configuration, to proceed<br />
with the modified receiver design <strong>and</strong><br />
apply it to a multinozzle design mounted<br />
in a test ECAM capable of larger total<br />
sampling rates, as shown in the CAD<br />
drawing of Figure 8b.<br />
Multinozzle ECAM inlet Each<br />
element of the multinozzle array of 5<br />
virtual impactors was designed to be<br />
about equivalent to the single nozzle<br />
design, with a total flow of approximately<br />
11.1 CFM , composed of a major flow of<br />
8.6 CFM <strong>and</strong> a minor flow of 1.09 CFM,<br />
together with a reference sample flow<br />
extracted out of the major flow of 1.41<br />
CFM. A second reference sample of the<br />
total flow contents was obtained from the<br />
feed line between the mixing chamber<br />
<strong>and</strong> the test ECAM. The 5 elements, in a<br />
circular array, were designed to retrofit<br />
into the inlet section of a prototype<br />
ECAM design that had been previously<br />
built for test <strong>and</strong> evaluation in the LANL<br />
/Canberra ECAM CRADA (Figure 9a). A<br />
characteristic of the prototype design that<br />
made this possible is a space between the<br />
outer case <strong>and</strong> an inner wall surrounding<br />
the CAM head component that could be<br />
isolated by sealing rings to create a major<br />
flow manifold, as seen the photograph of<br />
the completed modification (Figure 9b).<br />
The minor flow path from the outlets of<br />
the receivers (Figure 9c) remains the<br />
same as the normal ECAM through the<br />
CAM head to the filter cartridge in the<br />
base. The sealing rings can be seen top<br />
<strong>and</strong> bottom (9b), <strong>and</strong> also ports on the<br />
sidewall through which the major flow is<br />
drawn. The top closure <strong>and</strong> inlet tube to<br />
the monitor has been removed for these<br />
views. The results of preliminary tests<br />
with the multinozzle array indicate that<br />
the D cut-point shifted back up to about<br />
50<br />
2.8 µm, which is not unacceptable for a<br />
test unit. But the internal losses actually<br />
became worse for the larger particle<br />
sizes, approaching nearly all the particles<br />
at 10 µm. Clearly, in the confined space<br />
available in the existing prototype<br />
ECAM, the potential for unwanted flow<br />
impingements has gone up. A similar<br />
increased percentage loss of large<br />
particles when scaling up from a single
nozzle to a multiple nozzle, high-volume<br />
virtual impactor array was reported by<br />
Yule (1978) in his design of a virtual<br />
impactor for alpha-air monitoring. A<br />
critical design issue is that the accelerator<br />
nozzle dimensionless Reynolds number<br />
(a function of jet diameter <strong>and</strong> velocity),<br />
at a flow rate of 1.72 CFM, is in excess<br />
of 14,000, which puts it outside many<br />
design recommendations for impactors<br />
(Re = 3,000 – 10,000), but approximately<br />
the same as the Yule design. One effect<br />
of such high-jet velocities is greater<br />
turbulence <strong>and</strong> less penetration of the jet<br />
flow into the receiver nozzle tip, with<br />
potentially greater large particle losses in<br />
this critical region. In <strong>FY</strong>02, further<br />
testing is planned using liquid particles<br />
<strong>and</strong> a fluorescent tracer to allow wiping<br />
of surfaces to recover deposited particles.<br />
Recovery <strong>and</strong> counting of deposition<br />
losses could not be done with the<br />
radioactive labels. Pinpointing the sites of<br />
major deposition losses will allow the<br />
redesign of the accelerator/receiver<br />
system to achieve better transport<br />
(a)<br />
Accelerator Nozzle<br />
Receiver Nozzle<br />
Detector<br />
Minor Flow Filter<br />
Total Flow Inlet<br />
CAM head<br />
Major Flow Blower<br />
Major Flow Plenum<br />
efficiency. An entirely new design<br />
approach will be taken in developing a<br />
second generation high-volume virtual<br />
impactor, one that will increase the<br />
effective area of accelerator nozzle <strong>and</strong><br />
bring down the jet velocity <strong>and</strong> Reynolds<br />
number of the flow.<br />
Conclusions <strong>and</strong> Deliverables<br />
The investigations to date have shown<br />
that the use of a virtual impactor stage in<br />
the inlet of an ECAM has considerable<br />
potential for allowing sampling rates to<br />
be increased significantly while at the<br />
same time, by removal of most of the fine<br />
particles <strong>and</strong> radon progeny <strong>and</strong> retaining<br />
the larger particle mode, radon progeny<br />
background is kept low, <strong>and</strong> early<br />
clogging of the filter is prevented. One<br />
issue, which emerged from the first<br />
attempt at designing a high-volume,<br />
multinozzle virtual impactor array, is that<br />
within the geometrical confines of an<br />
ECAM inlet, there are possibly turbulent<br />
interactions between flows from adjacent<br />
nozzles <strong>and</strong> between flows <strong>and</strong> the side<br />
(b)<br />
Environment<br />
walls of the ECAM, leading to additional<br />
patterns of loss. The design <strong>and</strong> placement<br />
of multiple accelerator <strong>and</strong> receiver<br />
nozzles needs further investigation to<br />
determine major sites of deposition <strong>and</strong><br />
to develop alternative designs. Another<br />
concern is the high velocities generated<br />
in the accelerator nozzles of the present<br />
design contribute to larger deposition<br />
losses on the receivers. We are pursuing<br />
an alternative design, which would allow<br />
for a larger jet forming accelerator, <strong>and</strong><br />
better placement in the ECAM inlet in the<br />
continuing investigations. Among the<br />
deliverables of the first year are the<br />
following:<br />
1) the application of radon progeny<br />
labeling of solid test particles to virtual<br />
impactor testing;<br />
2) the design, construction, <strong>and</strong> testing of<br />
a single nozzle virtual impactor<br />
utilizing both the st<strong>and</strong>ard receiver<br />
nozzle <strong>and</strong> the Kim <strong>and</strong> Lee “flow<br />
guide” concept, <strong>and</strong><br />
Figure 9. Cross section drawing <strong>and</strong> photos of modified prototype ECAM: A 5-nozzle array of virtual impactors fitted to the inlet section of a<br />
Los Alamos/Canberra protorype alpha-ECAM is shown in cross section (a). Minor flow out of the receiver nozzles passes over the top of the<br />
enclosed preamp/detector chassis <strong>and</strong> down to the sample filter. A major flow plenum is created between the inner <strong>and</strong> outer walls of the<br />
ECAM body. The top <strong>and</strong> outer case have been removed in photo (b) to show the accelerators <strong>and</strong> major flow plenum. The receiver array is<br />
shown in photo (c). A portion of the inner CAM head can be seen in (b) with the filter-cartridge drawer open.<br />
(c)<br />
25
Environment<br />
3.) the design, construction, <strong>and</strong> testing of<br />
a full scale, 5-nozzle, retrofit virtual<br />
impactor in the inlet of a prototype<br />
ECAM.<br />
References:<br />
Le Cloarec, M.F., Ardouin, B., Cachier,<br />
H., Liousse, C., Neveu, S., <strong>and</strong> Nho,<br />
E.Y. (1995) 210Po in savanna burning<br />
plumes. J. Atmos. Chem. 22, 111-122.<br />
Nho, E.Y., Ardouin, B., LeCloarec, M.F.,<br />
<strong>and</strong> Ramonet, M. Origins of 210Po in the<br />
atmosphere at Lamto, Ivory Coast:<br />
biomass burning <strong>and</strong> Saharan dusts.<br />
(1996) Atmos. Environment 30:22 3705-<br />
3714.<br />
Brown, R.C. (1993) Air Filtration,<br />
Pergamon Press, Oxford.<br />
George, A.C. (1972) Indoor <strong>and</strong> Outdoor<br />
Measurements of Natural Radon <strong>and</strong><br />
Radon Decay Products in New York City<br />
Air. In: The Natural Radiation Environment<br />
II, J.A.S. Adams, W. M. Lowder,<br />
<strong>and</strong> T.E. Gesell, Eds., CONF-720805,<br />
741-750. NTIS, Springfield, VA.<br />
Dorian, M.D. (1997) Particle size<br />
distributions of radioactive aerosols in the<br />
environment. Rad. Prot. Dosimetry 69:2<br />
117-132.<br />
Snodgrass, R. (2001) “New <strong>Technology</strong><br />
Available for Air Monitoring: Rise in<br />
Depleted Uranium Counts Not Considered<br />
Worrisome”. Los Alamos Monitor<br />
(newspaper), August 24.<br />
26<br />
Marple, V.A., <strong>and</strong> Chien, C.M., “Virtual<br />
impactors: A theoretical study,” Environ.<br />
Sci. <strong>and</strong> <strong>Technology</strong> 14:8 976 –985<br />
(1980).<br />
Marple, V.A., Rubow, K.I., <strong>and</strong> Olsen,<br />
B.A., “Inertial, Gravitational, Centrifugal,<br />
<strong>and</strong> Thermal Collection Techniques,”<br />
Aerosol Measurement, K. Willeke <strong>and</strong><br />
P.A. Baron, Eds., Van Nostr<strong>and</strong><br />
Reinhold, New York (1993).<br />
Loo, B.W., <strong>and</strong> Cork, C.P., “<strong>Development</strong><br />
of high efficiency virtual impactors.<br />
Aero. Sci. <strong>and</strong> <strong>Technology</strong> 9: 167–176<br />
(1988).<br />
Huang, S., Schery, S.D., Alcantara, R. E.,<br />
Dale, N. V., <strong>and</strong> Rodgers, J.C.,<br />
“Micrometer-sized short-lived radioactive<br />
aerosol particles for convenient use<br />
in laboratory measurements,” Health<br />
Physics (in press, submitted April 2001);<br />
LA-UR-01-5464.<br />
Kim, M.C., <strong>and</strong> Lee, K.W, “Design<br />
modifications of virtual impactor for<br />
enhancing particle concentration performance,”<br />
Aero. Sci. <strong>and</strong> Tech. 32:3<br />
233–242 (2000).<br />
Yule, T., “An on-line monitor for alphaemitting<br />
aerosols,” IEEE Trans. Nucl.<br />
Sci. NS-25:1 762-766 (1978).
Wildfire Effects on Contaminant Transport through Wind Erosion<br />
Principle Investigator: Jeff J. Whicker (ESH-4)<br />
Coinvestigators: John Rodgers (ESH-4), John Pinder, Colorado State University, F. Ward Whicker, Colorado State University,<br />
David D. Breshears (EES-10), <strong>and</strong> Craig Eberhart (ESH-17)<br />
Funding: <strong>FY</strong>01, $39K<br />
Additional Funding: <strong>FY</strong>01, $50K for resuspension measurements at Area-G<br />
$25K for preliminary pathway study at Yucca Mountain<br />
Summary<br />
Redistribution of soil, nutrients, <strong>and</strong><br />
contaminants is often driven by wind<br />
erosion, <strong>and</strong> is especially pronounced<br />
during episodic high-velocity winds. In<br />
addition, vegetation cover, which<br />
moderates wind erosion, can be reduced<br />
rapidly <strong>and</strong> dramatically by wildfire.<br />
However, few studies have evaluated key<br />
spatial <strong>and</strong> temporal aspects of wind<br />
erosion with respect to: 1) wind erosion<br />
rates on burned forest sites compared to<br />
unburned forest sites; 2) erosion rates as<br />
related to canopy <strong>and</strong> ground cover as<br />
well as episodic high-velocity winds; <strong>and</strong><br />
3) quantified resuspension rates for<br />
contaminated soils in burned forest areas.<br />
For this study, measurements of vertical<br />
<strong>and</strong> horizontal soil flux, forest canopy<br />
cover, ground cover, <strong>and</strong> key meteorological<br />
metrics, are being made in<br />
unburned, severely burned, <strong>and</strong> moderately<br />
burned areas at Los Alamos<br />
National Laboratory (LANL). Combined,<br />
the preliminary data suggest that 1) wind<br />
erosion rates at LANL have been<br />
significantly increased by Cerro Gr<strong>and</strong>e<br />
fire, 2) dust concentrations show considerable<br />
temporal variation <strong>and</strong> appear to<br />
be strongly correlated to episodic highvelocity<br />
winds, <strong>and</strong> 3) distributions of<br />
weekly vertical soil flux can be applied<br />
to estimate the mean <strong>and</strong> associated<br />
variation in resuspension rates for<br />
contaminants of interest from LANL<br />
sites.<br />
Introduction<br />
Wind erosion suspends soil particles<br />
<strong>and</strong> any associated contaminants from<br />
surfaces <strong>and</strong> lifts them into the atmosphere,<br />
which can result in long-distance<br />
transport <strong>and</strong>, thus, have the potential to<br />
impact human <strong>and</strong> ecological health. The<br />
resuspended particulate can impact<br />
human <strong>and</strong> ecological health through 1)<br />
direct inhalation of contaminated soil <strong>and</strong><br />
2) deposition onto l<strong>and</strong>s where contaminants<br />
may ultimately enter food pathways.<br />
Therefore, underst<strong>and</strong>ing<br />
wind-driven resuspension of contaminated<br />
soils at LANL is critically important<br />
for predicting the human <strong>and</strong><br />
ecological risk presented by such<br />
contaminated sites. In addition, the ability<br />
to accurately predict wind resuspension<br />
under possible extreme conditions, such<br />
as those created by wildfires or other<br />
major disturbances, is necessary for<br />
managing environmental restoration<br />
activities <strong>and</strong> for long-term stewardship<br />
of Department of Energy (DOE) l<strong>and</strong>s.<br />
Rates of wind erosion fundamentally<br />
depend on the characteristics of wind <strong>and</strong><br />
vegetation cover in a complex fashion<br />
(Bagnold 1941). For example, Fryrear<br />
(1985) showed that wind erosion rates<br />
increased exponentially with loss in<br />
vegetation. Further, wind-erosion shows<br />
a threshold type response to wind<br />
velocities (Gillette et al. 1980). That is,<br />
there is essentially little erosion until the<br />
wind velocity exceeds the threshold<br />
velocity, but above this threshold<br />
wind-erosion rates increase dramatically<br />
as a power function of velocity (Woodruff<br />
<strong>and</strong> Siddoway, 1965; Anspaugh et<br />
al. 1975). Importantly, this threshold<br />
velocity can be significantly lowered by<br />
loss of vegetation, e.g., from wildfire, <strong>and</strong><br />
by disturbances to soil cover, e.g., from<br />
vehicles, (Gillette et al. 1980; Belnap <strong>and</strong><br />
Gillette 1998). Also, the affected areas<br />
can be slow to recover (Okin et al. 2001).<br />
Moreover, because of these highly nonlinear<br />
relationships, wind erosion may<br />
occur primarily during episodic high-<br />
Environment<br />
wind events (Cahill et al. 1996; Goossens<br />
<strong>and</strong> Offer, 1997; Stout, 2001). Therefore,<br />
the loss of vegetation from the fire, or<br />
from other disturbances such as vehicle<br />
traffic across the l<strong>and</strong>scape, could<br />
dramatically increase wind erosion <strong>and</strong><br />
resuspension of contaminated soil,<br />
especially during high-wind events.<br />
However, there are few relevant studies<br />
that have evaluated the long-term effects<br />
of fire or other disturbances on episodic<br />
wind erosion, <strong>and</strong> how erosion rates<br />
might change as the forest recovers.<br />
Given the dramatic removal of<br />
vegetation resulting from the Cerro<br />
Gr<strong>and</strong>e fire, it is possible that there will<br />
be significant increases in transport rates<br />
<strong>and</strong> concentrations of contaminated soils<br />
to offsite locations. The Cerro Gr<strong>and</strong>e<br />
fire burned over significant portions of<br />
LANL property (Figure 1), <strong>and</strong> these<br />
areas contained many sites with possible<br />
soil contamination (potential release sites<br />
[PRS]). The rapid removal of vegetation<br />
by fire has been shown to result in<br />
increased water <strong>and</strong> wind erosion at other<br />
DOE semiarid sites (Johansen et al.<br />
2001a; Johnson et al. 2000; Whicker et<br />
al. 2002). At LANL, Johansen et al.<br />
(2001b) found water erosion rates for<br />
plots burned by the Cerro Gr<strong>and</strong>e fire<br />
were an order-of-magnitude greater than<br />
unburned plots. Despite the critical role<br />
fire could have on wind erosion <strong>and</strong><br />
contaminant transport, there have been<br />
only a couple of studies of the effects of<br />
fire on wind erosion. Moreover, these<br />
studies have been focused on ecosystems<br />
that are very different from that found at<br />
LANL. Zobeck et al. (1989) studied the<br />
effects of fire on wind erosion in Texas<br />
rangel<strong>and</strong>, <strong>and</strong> Whicker et al. (2002)<br />
studied fire effects in shrubl<strong>and</strong>s in<br />
southern New Mexico. Both studies<br />
27
Environment<br />
showed that fire, through its effects on<br />
vegetation, significantly increased wind<br />
erosion; however, extrapolating the<br />
quantitative results of these studies to<br />
LANL may underestimate effects<br />
because the mass <strong>and</strong> vertical structure of<br />
the forest vegetation is greater than that<br />
in rangel<strong>and</strong> <strong>and</strong> shrubl<strong>and</strong>. It is important<br />
to consider the possible moderating<br />
effect of the extensive remediation done<br />
on LANL burned areas on wind erosion,<br />
but the level of effectiveness of these<br />
efforts to stabilize the soil remains<br />
unknown. It is also important to remember<br />
that these remediation efforts were 1)<br />
generally designed to reduce water<br />
erosion <strong>and</strong> are not necessarily effective<br />
for wind erosion, <strong>and</strong> 2) these<br />
remediation efforts were designed to<br />
reduce <strong>and</strong> not prevent erosion. Thus,<br />
underst<strong>and</strong>ing <strong>and</strong> quantifying the effects<br />
of the Cerro Gr<strong>and</strong>e fire <strong>and</strong> follow-up<br />
remediation efforts on wind erosion is<br />
essential for accurate human <strong>and</strong> ecological<br />
risk assessment, which are required<br />
28<br />
for long-term stewardship of DOE owned<br />
l<strong>and</strong>s.<br />
Objectives. Because fire may affect<br />
wind resuspension in LANL ecosystems<br />
by 1) removing tree canopies, thus<br />
increasing wind velocities at the ground<br />
surface <strong>and</strong> 2) removing ground vegetation<br />
<strong>and</strong> litter cover, thus exposing the<br />
soil particles (i.e., reducing wind-erosion<br />
thresholds), studies are being performed<br />
at three levels of burn effects. These are:<br />
1) severely burned areas where most of<br />
the trees were killed <strong>and</strong> almost all of the<br />
needle <strong>and</strong> ground litter was consumed<br />
by the fire, 2) moderately burned areas<br />
where the fire was confined largely to the<br />
ground vegetation <strong>and</strong> litter cover <strong>and</strong> the<br />
damage to the canopy was primarily the<br />
scorching of needles on the lower<br />
branches, <strong>and</strong> 3) unburned areas where<br />
there was no evidence of fire effects. The<br />
general objective of this project is to<br />
investigate resuspension of soils as<br />
affected by these different types of<br />
effects from the Cerro Gr<strong>and</strong>e fire.<br />
Figure 1. Outline of Cerro Gr<strong>and</strong>e fire (in orange) across the LANL site (in yellow) with<br />
potential release sites (in green).<br />
Specifically, we: 1) measure <strong>and</strong> compare<br />
wind erosion at replicate sites in areas<br />
that were severely burned, moderately<br />
burned, <strong>and</strong> unburned; 2) relate wind<br />
erosion (by particle size for some<br />
measurements) to locally measured<br />
parameters of meteorology, vegetation,<br />
<strong>and</strong> soil conditions in these burned <strong>and</strong><br />
unburned areas; <strong>and</strong> 3) quantify<br />
resuspension rates, especially during<br />
periods of extreme wind events, to obtain<br />
more accurate prediction of human risk.<br />
This report covers progress for the first of<br />
a three-year proposed project.<br />
Methods<br />
Effects of fire on soil resuspension.<br />
For this study, two replicate sites, termed<br />
primary <strong>and</strong> secondary sites, were<br />
selected for each burn type. Sampling <strong>and</strong><br />
data collection are being performed at<br />
both primary <strong>and</strong> secondary sites in<br />
severely burned, moderately burned, <strong>and</strong><br />
unburned areas (Figure 2). To quantify<br />
wind-erosion rates in the different burned<br />
<strong>and</strong> unburned sites, we are using numerous<br />
Big Springs Number Eight (BSNE)<br />
samplers. These BSNE field dust<br />
collectors (Figure 3) have been extensively<br />
tested <strong>and</strong> show good sampling<br />
efficiency for soils with higher fractions<br />
of s<strong>and</strong> <strong>and</strong> silt (Fryrear 1986; Goossens<br />
<strong>and</strong> Offer 2000) such as those which are<br />
abundant at LANL (Nyhan et al. 1978).<br />
These samplers are passive collectors of<br />
airborne dust that do not require electricity<br />
<strong>and</strong> are easy <strong>and</strong> inexpensive to<br />
assemble from interchangeable parts.<br />
Numerous samplers can be employed<br />
with great flexibility in their placement.<br />
This allows us to make continuous<br />
measurements using multiple samplers at<br />
multiple sites. As shown in Figure 3, a<br />
BSNE sampling station consists of three<br />
BSNE samplers at heights of 0.25 m, 0.5<br />
m, <strong>and</strong> 1 m. The BSNE samplers provide<br />
measures of integrated resuspension<br />
collected over sampling intervals of<br />
normally one to two weeks. The BSNE<br />
sampling stations are arranged in line<br />
transects at intervals of 30 m with three<br />
sampling stations at the primary sites <strong>and</strong><br />
two sampling stations at the secondary<br />
sites. To ensure comparability with<br />
previous studies, comparative data are
Figure 2. Aerial photograph with overlay of sampling plots.<br />
Figure 3. Photograph of a BSNE sampling station in the primary severely burned area.<br />
being collected at several sites using the<br />
older, less flexible Bagnold-type dust<br />
collectors used in previous studies.<br />
Wind erosion relationships to<br />
meteorological conditions <strong>and</strong> vegetation<br />
cover. Meteorological data-collection<br />
stations are installed at primary sites<br />
to obtain data on wind velocity, temperature,<br />
relative humidity, <strong>and</strong> rainfall at<br />
1-minute intervals. These data may be<br />
integrated over longer time intervals for<br />
comparison to the data from the BSNE<br />
samplers. The data can also be related<br />
more directly to short-term measures of<br />
resuspension being collected by 1) the<br />
TSI DustTrak monitor which provides<br />
minute-by-minute PM-10 concentration<br />
measurements <strong>and</strong> 2) the ESH-17 TEOM<br />
(Tapered Element Oscillating Microbalance)<br />
monitor, which provides PM-10<br />
concentration averages every 15 minutes.<br />
Environment<br />
These combined measurements will be<br />
used to establish critical conditions for<br />
enhanced resuspension, such as threshold<br />
velocities, by correlating particle concentration<br />
measurements to the local<br />
meteorological conditions (e.g., wind<br />
velocity). In addition, the meteorological<br />
tower at Technical Area (TA) 6 is<br />
providing additional data on friction<br />
velocities <strong>and</strong> soil moisture. These local<br />
meteorological measurements include<br />
relatively short-term averaging (1–15<br />
minute averages) to provide finer time<br />
scales.<br />
In addition to measurement of<br />
meteorological conditions, measurements<br />
were made to characterize tree-canopy<br />
cover <strong>and</strong> ground-level cover at both the<br />
primary <strong>and</strong> secondary sites for each burn<br />
type area. Measurements of the treecanopy<br />
cover have been estimated using<br />
a spherical densiometer (<strong>and</strong> limited<br />
aerial photography analysis). Groundcover<br />
measurements were made using 1m<br />
sampling plots r<strong>and</strong>omly positioned in<br />
the sampling areas. Digital pictures of the<br />
ground cover within the 1-m squares are<br />
being analyzed for percent cover <strong>and</strong><br />
categorized by type (i.e., bare, live<br />
vegetation, pine needles). The groundcover<br />
measurements were made toward<br />
the middle <strong>and</strong> the end of the summer<br />
growing season (June <strong>and</strong> September<br />
2001), <strong>and</strong> next year we plan to make<br />
similar measurements at the beginning of<br />
the growing season (i.e., April/May).<br />
Obtain distribution of resuspension<br />
rates at a burned area. Resuspension<br />
rates will be made using the meteorological<br />
flux gradient method (Stull 1988). For<br />
this method, the mass flux (F) is the<br />
product of the eddy diffusivity coefficient<br />
(K ) <strong>and</strong> the mass air concentration (x)<br />
z<br />
gradient with height (z):<br />
F = K z — dx<br />
dz<br />
(1)<br />
The eddy diffusivity coefficient is a<br />
linear function of the friction velocity<br />
(u * ). The friction velocity is a measure of<br />
the boundary shear created as winds pass<br />
over vegetation <strong>and</strong> soils. The friction<br />
velocity for a given terrain <strong>and</strong><br />
wind-velocity can be measured by<br />
29
Environment<br />
measuring the wind velocity profile with<br />
height (Bagnold 1941) or it can be<br />
determined using high-frequency threedimensional<br />
measurements of wind<br />
velocities (Stull 1988) using Equation 2.<br />
30<br />
u * = [u'w' 2<br />
+ v'w'2<br />
] 1 – 2<br />
(2)<br />
where u’, v’, w’ are the instantaneous<br />
wind-velocity components in the x, y,<br />
(horizontal) <strong>and</strong> z (vertical) directions.<br />
The instantaneous wind-velocity components<br />
will be measured using a sonic<br />
anemometer. Data for the wind profiles<br />
with height (as well as other meteorological<br />
conditions) will be obtained from the<br />
existing four 100 m meteorological<br />
towers on LANL property. Once F is<br />
determined, the resuspension rate is<br />
determined by the mass flux divided by<br />
the density of the local soil <strong>and</strong> the depth<br />
of the resuspendable soil (i.e., 3 mm<br />
[Webb et al. 1997]).<br />
To determine the concentration<br />
gradient with height (dx/dz), which is<br />
needed for resuspension rate measurements,<br />
total suspended particulate (TSP)<br />
measurements will be collected weekly.<br />
These samplers will be placed at two<br />
heights (1 <strong>and</strong> 3 m) to allow measurement<br />
of the concentration gradients. The<br />
TSP air samples to be used have a<br />
sampling inlet that was slightly modified<br />
from a sampler of that described in Liu<br />
<strong>and</strong> Pui (1981). This sampling inlet has<br />
the advantage of sampling without<br />
directional dependence <strong>and</strong> appears to<br />
provide accurate sampling at typical wind<br />
velocities <strong>and</strong> for predominant particle<br />
sizes expected at LANL. Liu <strong>and</strong> Pui<br />
(1981) tested the sampling inlet in a wind<br />
tunnel <strong>and</strong> found aspiration efficiencies<br />
for particles of aerodynamic diameters of<br />
8.5 <strong>and</strong> 11 µm was 100% ± 10% at wind<br />
speeds up to 2.5 m s-1 (typical velocities<br />
measured at LANL). However, measurement<br />
of resuspension at velocities higher<br />
than this was also needed because during<br />
these higher-wind velocities,<br />
resuspension is increased. The original<br />
Liu <strong>and</strong> Pui inlet design was for a PM 10<br />
sampler, so modification to this inlet was<br />
required for collection of all particle<br />
sizes, not just those less than 10 µm.<br />
The modifications of the Liu <strong>and</strong> Pui<br />
design included placement of the filter<br />
close to the bottom plate <strong>and</strong> the addition<br />
of a coarse wire screen to keep insects<br />
out of the filter. Because of the modifications<br />
to the inlet <strong>and</strong> the need to determine<br />
sampling efficiencies at higher wind<br />
velocities, Rodgers et al (2000) tested the<br />
sampler at velocities 12, 15, <strong>and</strong> 17 m s -1<br />
<strong>and</strong> for particle aerodynamic sizes of 5,<br />
10, <strong>and</strong> 30 µm. Results of this study<br />
suggest that collection efficiency for the<br />
used inlet was most affected by particle<br />
size <strong>and</strong> less affected by wind velocity.<br />
Collection efficiencies for the 5 µm<br />
particles was about 120% (20% over<br />
sampling on average), <strong>and</strong> dropped to<br />
around 50% for both the 10 µm <strong>and</strong><br />
30 µm particles.<br />
Progress <strong>and</strong> Results<br />
Effects of fire on soil resuspension.<br />
Figure 4 shows mean collection rates at<br />
each of the areas (severely burned,<br />
moderately burned, <strong>and</strong> unburned forest).<br />
Each of the three graphs represent data<br />
from the three different collection heights<br />
(0.25, 0.5 <strong>and</strong> 1 m). All three graphs<br />
show that collection rates were greater in<br />
the severely burned area compared to the<br />
other two areas, <strong>and</strong> the collection rates<br />
Collection Rate (gd -1 )<br />
0.01<br />
0.001<br />
1e-4<br />
1e-5<br />
0.01<br />
0.001<br />
1e-4<br />
1e-5<br />
Severe Moderate Unburned<br />
HEIGHT: 25 cm<br />
Severe Moderate Unburned<br />
HEIGHT: 10 cm<br />
0<br />
for each burn category decreased with<br />
increasing collection height.<br />
Also, we have noticed evidence of<br />
deposited soil on the BSNE surfaces from<br />
rainsplash on the lower two samplers<br />
after rains, especially for the 0.25-m<br />
sampler. Because these graphs represent<br />
data collected from May through August<br />
of 2001, which includes the monsoon<br />
season where significant rainstorms<br />
occur, some of the differences between<br />
burn areas at the 0.25-m height <strong>and</strong>, to a<br />
lesser extent, the 0.5-m height are likely<br />
due to rainsplash. We found no evidence<br />
of rainsplash at the 1-m sampling height.<br />
Rainsplash can be an important mechanism<br />
for contaminant mobility because<br />
the water droplets can entrain soil<br />
particles <strong>and</strong> inject them into the air<br />
where they can deposit <strong>and</strong> dry on foliage<br />
<strong>and</strong> branches, becoming a secondary<br />
source for plant uptake <strong>and</strong> ingestion<br />
(Dreicer et al. 1984) or for resuspension<br />
(Giess et al. 1997). Therefore, finding<br />
increased rainsplash in the severely<br />
burned areas does have additional<br />
implications for contaminant transport.<br />
L<strong>and</strong>scape fabric was placed directly<br />
under the BSNE samplers in June to<br />
minimize rainsplash, <strong>and</strong> we believe this<br />
was partially successful. We plan to<br />
investigate the possible use of rain hoods<br />
Severe Moderate Unburned<br />
HEIGHT: 50 cm<br />
Min-Max<br />
25%-75%<br />
Median value<br />
Figure 4. Mean collection rates categorized by area type <strong>and</strong> collection height.
that would attach to the top of the BSNE<br />
samplers <strong>and</strong> minimize the amount of<br />
rain <strong>and</strong> rainsplash collected by the<br />
samplers. These hoods have been used by<br />
other researchers (Shao et al. 1993).<br />
Wind erosion relationship to<br />
meteorological conditions <strong>and</strong><br />
vegetation cover. There were significant<br />
effects of the fire on the vegetation cover<br />
that have implications for wind erosion.<br />
For example, spherical densiometer<br />
estimates of mean live canopy cover were<br />
about 60%, 40%, <strong>and</strong> 0% for the categories<br />
of unburned, moderately burned <strong>and</strong><br />
severely burned areas, respectively. The<br />
removal of live canopy cover in severely<br />
burned areas means that there is little<br />
remaining moderating effect of the trees<br />
on wind velocities at the ground surface.<br />
This was confirmed by our measurements,<br />
which showed highly significant<br />
increases in 1-m wind velocities at the<br />
severely burned site relative to the<br />
unburned site. The greater wind speeds<br />
may contribute to greater wind erosion in<br />
the severely burned area. In addition,<br />
quantitative measures of ground-level<br />
vegetation cover are ongoing, but<br />
preliminary data indicate a nearly<br />
complete removal of ground-level<br />
vegetation in both the severely <strong>and</strong><br />
moderately burned areas. These data also<br />
indicate a partial recovery of litter cover<br />
on the soil in moderately burned areas<br />
because of the fall of the scorched<br />
needles. This partial recovery of the litter<br />
cover may also moderate wind-erosion<br />
rates. In the unburned area, the forest<br />
floor has little vegetation but is covered<br />
with a thick mat of pine needles. In<br />
contrast, there is much more live vegetative<br />
ground cover at the severely burned<br />
site because of extensive remediation<br />
efforts, but the overall ground cover is<br />
less because there are more open bare<br />
patches of soil. These changes in vegetation<br />
<strong>and</strong> litter cover could have significant<br />
implications for wind-erosion rates.<br />
The TSI DustTrak <strong>and</strong> the TEOM<br />
measurements show substantial variation<br />
in PM-10 concentrations, especially<br />
during high winds. Figure 5 shows an<br />
example data set collected during a<br />
windstorm last spring. The 1-minute<br />
aerosol concentrations show a dramatic<br />
rise about 10:00 A.M. This corresponds to<br />
an increase in sustained wind velocity of<br />
greater than about 5 m s -1 , which is<br />
generally lower than threshold velocities<br />
found at fully vegetated sites (Stout 2001;<br />
Whicker et al. 2002). However, more<br />
measurements <strong>and</strong> analyses of the data<br />
are planned for the upcoming year to get<br />
more accurate estimates of these threshold<br />
velocities. A high-volume cascade<br />
impactor has been purchased for another<br />
project, but we plan on using it to provide<br />
Environment<br />
Figure 5. One-minute PM-10 aerosol concentrations taken at the TA-6 burned area during<br />
a wind storm.<br />
detailed measurements of particle size<br />
distributions at the TA-6 burned site.<br />
Obtain distribution of resuspension<br />
rates at a burned area. Using the<br />
vertical gradient (Eqn. 1), one can<br />
calculate the vertical flux <strong>and</strong> the<br />
resuspension rate for a particular contaminant.<br />
Figure 6 shows the vertical<br />
mass flux. Using these values for vertical<br />
flux, one can then calculate resuspension<br />
rate for any particular soil contaminant.<br />
For example, we can examine Pu-239 in<br />
LANL on-site soils. Based on a mean<br />
vertical gradient at TA-6 of about 0.6 mg<br />
m-4 (positive values signify upward fluxes<br />
<strong>and</strong> soil loss), a mean friction velocity<br />
measured at TA-6 during the sampling<br />
period (0.4 m s -1 ), a sampling height of<br />
2 m, <strong>and</strong> an average on-site air concentration<br />
of Pu-239 in air of 4 aCi m -3 (LANL<br />
1996). We obtain an average upward<br />
mass flux of soil of about 6 g m -2 yr -1 or<br />
an upward vertical flux of 0.2 Bq m -2 yr -1<br />
for Pu-239. This translates into a fractional<br />
resuspension rate of 5 x10 -11 s -1 or a<br />
half-life of 644 years. This resuspension<br />
rate is at the faster end of resuspension<br />
rate values found by other researchers,<br />
but is within the range of values found at<br />
other DOE sites (Anspaugh et al. 1975;<br />
Shinn et al.1997). In contrast, the site at<br />
TA-54 showed little or no net vertical<br />
movement (mean about 0) overall<br />
measurements. While these calculations<br />
31
Environment<br />
Number of observations<br />
Figure 6. Distribution of verticle fluxes taken at the burned area at TA-6.<br />
32<br />
15<br />
14<br />
13<br />
12<br />
11<br />
10<br />
9<br />
8<br />
7<br />
6<br />
5<br />
4<br />
3<br />
2<br />
1<br />
0<br />
Downward flux (0)<br />
30<br />
are preliminary, the illustration shows<br />
how the obtained measurements can be<br />
directly used to assess risk for many soil<br />
contaminants.<br />
Conclusions <strong>and</strong> Deliverables<br />
Conclusions. Taken together, these<br />
preliminary data suggest that wind<br />
erosion has increased as a result of the<br />
Cerro Gr<strong>and</strong>e fire <strong>and</strong> the effects continue<br />
one <strong>and</strong> a half years later. Based on<br />
1-m-high BSNE sampler results, the<br />
median horizontal flux of wind driven<br />
soil is about a factor of 3 greater in the<br />
severely burned site compared to the<br />
unburned site. This difference could be<br />
greater than this during windy times. In<br />
addition, rainsplash may have been<br />
increased significantly.<br />
Measurements of ground cover show<br />
significantly more vegetation in the<br />
severely burned area as a result of the<br />
substantial remediation efforts. These<br />
efforts likely reduced wind erosion;<br />
however, they were only partially<br />
successful because they did not reduce it<br />
to the level of the moderately burned<br />
sites. Moreover, some observations<br />
Vertical Flux (g m -2 yr -1 )<br />
suggest that these remediation activities<br />
may have less effect next year because of<br />
the small numbers of perennial plants<br />
established. Once the annuals from this<br />
year’s seeding have died, the soil may be<br />
more exposed next year than this year.<br />
Measurements also show the effects of<br />
the fire on reducing live canopy cover.<br />
Preliminary data show that this resulted<br />
in greater ground level (1 m) wind<br />
velocities in the severely burned area<br />
relative to the unburned area. Short-term<br />
(minute-to-minute) aerosol concentrations<br />
show considerable variation <strong>and</strong><br />
appear to be strongly related to wind<br />
velocities, but additional analyses are<br />
needed to confirm this <strong>and</strong> to determine<br />
threshold wind velocities.<br />
The work plan for this year calls for<br />
measurements similar to those described<br />
above. Making these measurements is<br />
critical to capture wind erosion/<br />
resuspension rates under a wide variety<br />
of conditions, especially during lowfrequency,<br />
high winds.<br />
Deliverables. This is the first of three<br />
years of proposed study. During the first<br />
year, we purchased instruments, devel-<br />
oped sampling plans, began measurements,<br />
<strong>and</strong> analyzed preliminary data.<br />
Over the three years, deliverables include<br />
an archived <strong>and</strong> published data set of<br />
resuspension related measurements as<br />
correlated to meteorological <strong>and</strong> vegetation<br />
cover conditions at several burned<br />
<strong>and</strong> unburned LANL sites. At some level,<br />
these sites will represent the soil <strong>and</strong><br />
atmospheric conditions of similar forest<br />
ecosystems, so the results will have<br />
applicability beyond LANL. Also, this<br />
work can improve the model predictions<br />
of resuspension <strong>and</strong> subsequent risk.<br />
Interest has been expressed in this study<br />
<strong>and</strong> our related research. In fact, our<br />
studies at the Waste Isolation Pilot Plant<br />
(WIPP) <strong>and</strong> Rocky Flats were recently<br />
highlighted in the DOE publication<br />
“Initiatives in Environmental <strong>Technology</strong><br />
Investment.” Further, the results of this<br />
investigation can be applied to other<br />
contaminants <strong>and</strong>, therefore, be of<br />
interest to a wider audience. Publications<br />
in peer-reviewed journals will summarize<br />
the research. Finally, this proposal not<br />
only provides for timely <strong>and</strong> valuable<br />
information for LANL, it can also serve<br />
as seed money for additional collaborations<br />
in resuspension <strong>and</strong> in related areas,<br />
such as geographic indexing system<br />
(GIS) mapping <strong>and</strong> modeling of contaminant<br />
transport. Already in <strong>FY</strong>01, money<br />
has been obtained for resuspension<br />
studies at LANL’s Area G ($60K) <strong>and</strong> at<br />
Yucca Mountain ($25+K).
References<br />
Anspaugh, L.R., J.H. Shinn, P.L. Phelps,<br />
N.C. Kennedy, “Resuspension <strong>and</strong><br />
redistribution of plutonium in soils,”<br />
Health Phys. 29:571–582, 1975.<br />
Bagnold, R.A., “The physics of blown<br />
s<strong>and</strong> <strong>and</strong> desert dunes,” London:<br />
Chapman <strong>and</strong> Hall Ltd., 1941.<br />
Belnap, J. <strong>and</strong> D.A. Gillette, “Vulnerability<br />
of desert biological soil crusts to wind<br />
erosion: the influences of crust development,<br />
soil texture, <strong>and</strong> disturbance,”<br />
J. Arid Environ. 39:133–142, 1998.<br />
Cahill, T.A., T.E. Gill, J.S. Reid, E.A.<br />
Gearhart, <strong>and</strong> D.A. Gillette, “Saltating<br />
particles, playa crusts <strong>and</strong> dust aerosols at<br />
Owens (Dry) Lake, California,” Earth<br />
Surf. Processes L<strong>and</strong>forms 21:621–639;<br />
1996.<br />
Department of Energy Publication,<br />
“Initiatives in Environmental <strong>Technology</strong><br />
Investment,” 8 Fall: 6–8, 2001,<br />
http://www.wpi.org.<br />
Driecer, M, T.E. Hakonson, G.C. White,<br />
<strong>and</strong> F.W. Whicker, “Rainsplash as a<br />
mechanism for soil contamination of<br />
plant-surfaces,” Health Phys. 46(1):177–<br />
187, 1984.<br />
Fryrear, D.W., “A field dust sampler,” J.<br />
Soil Water Conserv. 41:117–120, 1986.<br />
Fryrear, D.W., “Soil cover <strong>and</strong> wind<br />
erosion,” Trans. ASAE 28:781–784,<br />
1985.<br />
Giess, P.; A.J.H. Goddard, G. Shaw,<br />
“Factors affecting particle resuspension<br />
from grass swards,” J. Aerosol Sci.<br />
28(7):1331–1349, 1997.<br />
Gillette, D.A., J. Adams, A. Endo, <strong>and</strong><br />
D. Smith, “Threshold velocities for input<br />
of soil particles into the air by desert<br />
soils,” J. Geophys. Res. 85(C10):<br />
5621–5630, 1980.<br />
Goossens, D. <strong>and</strong> Z.Y. Offer, “Aeolian<br />
dust erosion on different types of hills in<br />
a rocky desert: wind tunnel simulations<br />
<strong>and</strong> field measurements,” J. Arid<br />
Environ. 37:209–229, 1997.<br />
Goossens, D. <strong>and</strong> Z.Y. Offer, “Wind<br />
tunnel evaluation of six aeolian dust<br />
samplers,” Atmos. Env. 34:1043–1057,<br />
2000.<br />
Johansen, M.P., T.E. Hakonson, F.W.<br />
Whicker, R.J. Simanton, <strong>and</strong> J.J. Stone,<br />
“Hydrologic response <strong>and</strong> radionuclide<br />
transport following fire at semiarid sites,”<br />
J. Env. Quality. 30: 2010–2017, 2001a.<br />
Johansen, M.P., T.E. Hakonson, <strong>and</strong> D.D.<br />
Breshears, “Post-fire runoff <strong>and</strong> erosion<br />
from rainfall simulation: contrasting<br />
forests with shrubl<strong>and</strong>s <strong>and</strong> grassl<strong>and</strong>s,”<br />
Hydro. Process. 15: in press, 2001b.<br />
Johnson, S.R., D.D. Breshears, <strong>and</strong> T.B.<br />
Kirchner, “Multi-pathway, multi-site<br />
contaminant transport: assessing vertical<br />
migration, wind erosion, <strong>and</strong> water<br />
erosion at semiarid DOE sites,” Health<br />
Phys. 78(6):S159, 2000.<br />
Liu, B.Y.H. <strong>and</strong> Y.H. Pui, “Aerosol<br />
sampling inlets <strong>and</strong> inhalable particles,”<br />
Atmos. Environ. 15:589–600, 1981.<br />
Los Alamos National Laboratory<br />
(LANL) “Environment Surveillance at<br />
Los Alamos during 1995,” Los Alamos<br />
National Laboratory report<br />
LA-13210-ENV, 1996.<br />
Nyhan, J.W., L.W. Hacker,<br />
T.E. Calhoun, <strong>and</strong> D.L. Young, “Soil<br />
survey of Los Alamos County, New<br />
Mexico,” Los Alamos National Laboratory<br />
report LA-677-MS, 1978.<br />
Okin, G.S., B. Murray, <strong>and</strong> W.H.<br />
Schlesinger, “Degradation of s<strong>and</strong>y arid<br />
shrubl<strong>and</strong> environments: observations,<br />
process modelling, <strong>and</strong> management<br />
implications,” J. Arid Environ. 47:<br />
123–144, 2001.<br />
Rodgers, J.C., P.T. Wasiolek,<br />
J.J. Whicker, C. Eberhart, K. Saxton, <strong>and</strong><br />
D. Ch<strong>and</strong>ler, “Performance evaluation of<br />
LANL environmental radiological air<br />
monitoring inlets at high-wind velocities<br />
associated with resuspension,”<br />
Los Alamos National Laboratory report<br />
LA-UR-00-3091, 2000.<br />
Environment<br />
Shao, Y., G.H. McTainsh, J.F. Leys, <strong>and</strong><br />
M.R. “Raupach, Efficiencies of sediment<br />
samplers for wind-erosion measurement,”<br />
Austrailian J. Soil Res. 31: 983–1011,<br />
1993.<br />
Shinn, J.H., D.N. Homan, <strong>and</strong> W.L.<br />
Robinson, “Resuspension studies in the<br />
Marshall Isl<strong>and</strong>s,” Health Phy.<br />
73(1):248–257, 1997.<br />
Stout, J. E., “Dust <strong>and</strong> environment in the<br />
Southern High Plains of North America,”<br />
J. Arid Environ. 47: 425–441, 2001.<br />
Stull, R.B., “An Introduction to Boundary<br />
Layer Meteorology,” Kluwer<br />
Academic Publishers: The Netherl<strong>and</strong>s<br />
(1998).<br />
Webb, S.A., S.A. Ibrahim, <strong>and</strong> F.W.<br />
Whicker, “A three-dimensional spatial<br />
model of plutonium in soil near Rocky<br />
Flats, Colorado,” Health Phys. 73(2):<br />
340–349, 1997.<br />
Whicker, J.J., D. Breshears, D. Schoop,<br />
P. Wasiolek, R. Tavani, <strong>and</strong> J. Rodgers,<br />
“Temporal <strong>and</strong> spatial variation in<br />
episodic wind erosion in unburned <strong>and</strong><br />
burned shrubl<strong>and</strong>,” J. Environ. Quality,<br />
3 in press, 2002.<br />
Woodruff, N.P. <strong>and</strong> F.H. Siddoway, “A<br />
wind-erosion equation,” Soil Sci. Soc.<br />
Am. J. Proceedings 29:602–608, 1965.<br />
Zobeck, T.M., D.W. Fryrear, <strong>and</strong><br />
R.D. Pettit, “Management effects on<br />
wind-eroded sediment <strong>and</strong> plant nutrients,”<br />
J. Soil Water Conserv.<br />
March–April: 160–163, 1989.<br />
33
Studies to Date<br />
<strong>FY</strong>95<br />
Optimization of Placement of Workplace<br />
Continuous Air Monitoring (CAM)<br />
Instrumentation<br />
High-Energy Neutron Dosimetry<br />
<strong>FY</strong>96<br />
<strong>Application</strong>s of Thermal Ionization Mass<br />
Spectrometry to the Detection of Pu-239<br />
<strong>and</strong> Pu-240 Intakes<br />
High-Energy Neutron Dosimetry <strong>and</strong><br />
Spectroscopy<br />
<strong>Development</strong> <strong>and</strong> Implementation of the<br />
LANL Neutron Extremity Dosimeter<br />
Optimization of Continuous Air Monitoring<br />
(CAM) Instrument Placement<br />
<strong>FY</strong>97<br />
<strong>Application</strong>s of Thermal Ionization Mass<br />
Spectrometry (TIMS) to the Detection of<br />
Pu-239 <strong>and</strong> Pu-240 Intakes<br />
High-Energy Neutron Dosimetry <strong>and</strong><br />
Spectroscopy<br />
<strong>Development</strong> <strong>and</strong> Implementation of the<br />
Los Alamos National Laboratory<br />
(LANL) Neutron Extremity Dosimeter<br />
Optimization of Continuous Air Monitoring<br />
(CAM) Instrument Placement<br />
Resuspension of Pu-238 from Surfaces<br />
Health Physics<br />
Neutron Extremity Dosimetry Based on Monte Carlo Computations of<br />
Magnetic Resonance Images<br />
Laser Illuminated Track Etch Scattering (LITES) Dosimetry System<br />
Personal Continuous Air Monitor (PCAM)<br />
PRESCILA: Proton Recoil Scintillator Los Alamos Rem Meter<br />
Rapid Discrimination of Personnel Contamination Due to Radon versus<br />
Other Alpha-Emitting Radionuclides<br />
<strong>FY</strong>98<br />
Characterization of Photon Radiation<br />
Fields in a LANL Plutonium Facility<br />
Detection <strong>and</strong> Internal Dosimetry of<br />
Insoluble Metal Tritides<br />
Determining <strong>and</strong> Monitoring the<br />
Inhalable Fraction of Plutonium Aerosols<br />
in an Accident<br />
Implications of Room Ventilation <strong>and</strong><br />
Containment Design for Minimization of<br />
Worker Exposure to Plutonium Aerosols<br />
PRESCILA: Proton Recoil Scintillator<br />
Los Alamos Neutron Dose Meter<br />
<strong>FY</strong>99<br />
Detection <strong>and</strong> Internal Dosimetry of<br />
Insoluble Metal Tritides<br />
Determining <strong>and</strong> Monitoring the<br />
Inhalable Fraction of Plutonium Aerosols<br />
in an Accident<br />
Implications of Room Ventilation <strong>and</strong><br />
Containment Design for Minimization of<br />
Worker Exposure to Plutonium Aerosols<br />
Proton Recoil Scintillator Los Alamos<br />
Neutron Dose Meter<br />
Rapid Discrimination of Personnel<br />
Contamination Due to Radon Versus<br />
Other Alpha-Emitting Radionuclides<br />
An XRF Continuous Air Monitor for<br />
Metal Tritide Aerosols in the Workplace<br />
<strong>FY</strong>00<br />
Detection of Low-Energy-Emitting-<br />
Radionuclides Using Mobile Platforms<br />
Physical Parameters for the Internal<br />
Dosimetry of Insoluble Metal Tritide<br />
Particles<br />
Algorithm for Determination of Need for<br />
Dosimetry Monitoring<br />
Neutron Extremity Dosimetry Based on<br />
Monte Carlo Computations of Magnetic<br />
Resonance Images<br />
PRESCILA: Proton Recoil Scintillator<br />
Los Alamos Rem Meter<br />
An XRF Continuous Air Monitor for<br />
Metal Tritide Aerosols in the Workplace<br />
Rapid Discrimination of Personnel<br />
Contamination Due to Radon versus<br />
Other Alpha-Emitting Radionuclides<br />
Summary of Progress<br />
<strong>TDEA</strong>-funded projects in the health<br />
physics category have generated 68<br />
presentations <strong>and</strong> publications from<br />
eighteen studies funded since <strong>FY</strong>95. The<br />
fact that a greater number of health<br />
physics studies have been funded by<br />
<strong>TDEA</strong> reflects the unique <strong>and</strong> diverse<br />
radiation protection requirements at<br />
LANL. The <strong>TDEA</strong>-funded radiation<br />
protection projects have resulted in<br />
products at the leading edge of the<br />
discipline’s technology. The latest<br />
example is the PRESCILA neutron<br />
probe, commercially available in 2002.
Health Physics<br />
Neutron Extremity Dosimetry Based on Monte Carlo Computations of Magnetic<br />
Resonance Images<br />
Principal Investigator: Michael W. Mallett (ESH-4)<br />
Coinvestigator: Jeffrey M. Hoffman (ESH-4)<br />
Funding: <strong>FY</strong>00 $26K, <strong>FY</strong>01 $8K<br />
Introduction<br />
This project seeks to advance the<br />
protection of Los Alamos National<br />
Laboratory (LANL) employees from<br />
radiation health hazards, in particular,<br />
neutron dose to the extremities. This is in<br />
direct support of three University of<br />
California contract performance measures:<br />
1) management of routine occupational<br />
radiation exposures; 2) hazard<br />
analysis <strong>and</strong> control; <strong>and</strong> 3) injury/illness<br />
prevention. The research will provide the<br />
technical basis for reporting measured<br />
neutron absorbed dose to the extremities<br />
as an equivalent dose, consistent with<br />
governing regulations (e.g., 10 CFR 835).<br />
In addition, the results will validate newer<br />
radiation protection concepts (e.g.,<br />
ICRP 60’s radiation weighting factor, wR )<br />
as applicable to extremity dosimetry.<br />
Likewise, the research will address<br />
shortcomings in current dosimetry<br />
st<strong>and</strong>ards (specifically, the lack of<br />
Department of Energy Laboratory<br />
Accreditation Program (DOELAP)<br />
performance testing for neutron extremity<br />
dosimetry as a component of HPS N13.32<br />
because of a lack of consistency between<br />
current regulations <strong>and</strong> current protection<br />
concepts.)<br />
At present, the new LANL neutron<br />
extremity dosimeter is capable of<br />
measuring the absorbed neutron dose<br />
(e.g., Gy or rad) to the extremities.<br />
However, DOE reporting requirements<br />
necessitate this dose be reported as an<br />
equivalent dose (e.g., Sv or rem). No<br />
technical basis exists for “qualifying” the<br />
neutron dose to the extremities as<br />
measured by personal dosimeters (e.g.,<br />
thermoluminescent dosimetry/dosimeters,<br />
or TLDs). However, it is acceptable to<br />
report a neutron extremity dose based<br />
upon photon personal dosimeter measure-<br />
36<br />
ments, <strong>and</strong> subsequently adjusting the<br />
result by a known neutron-to-photon dose<br />
ratio. Hence, the capability of the new<br />
LANL neutron extremity dosimeter is<br />
relegated to a qualitative measure rather<br />
than functioning as the dose-of-record.<br />
Assessing neutron-to-photon dose ratios<br />
across the Laboratory still requires fairly<br />
labor <strong>and</strong> time-intensive field measurements.<br />
By developing the technical basis for<br />
reporting an equivalent neutron dose to<br />
the extremities consistent with present<br />
regulations, these field measurements are<br />
made unnecessary. Elimination of the<br />
field measurements is estimated as a cost<br />
savings of $9K annually, equivalent to 60<br />
hours of effort at $150/hour. The savings<br />
would be double should the field measurements<br />
be performed on a semiannual<br />
schedule. In addition, interruptions of<br />
programmatic work at TA-55 because of<br />
the performance of these field measurements<br />
would also be eliminated, a benefit<br />
that is decidedly difficult to quantify.<br />
However, it should be noted that the<br />
fundamental benefit of this research is a<br />
technical contribution that fills a much<br />
needed void in the field of extremity<br />
dosimetry.<br />
Method<br />
This research seeks to accommodate<br />
currently instituted radiation protection<br />
concepts. That is, the calculation of a<br />
quality factor applicable to the extremities<br />
will be made. As currently defined<br />
(ICRP 26), the value of Q is a function of<br />
the collision stopping power (or unrestricted<br />
linear energy transfer), L ∞ , in<br />
water. This relationship was determined<br />
for the whole body using a<br />
30-cm-diameter sphere. As there is no<br />
agreement upon a suitable phantom for<br />
the extremities as it pertains to neutron<br />
radiation, the method proposed here is to<br />
use actual physical measurements of the<br />
human extremities, as represented by<br />
magnetic resonance images (MRIs). In<br />
particular, image segmenting techniques<br />
generate MRIs that clearly differentiate<br />
between muscle, fat, <strong>and</strong> bone, the three<br />
principle tissues of the extremities. This<br />
information will be used to define the<br />
transport geometry for Monte Carlo<br />
computations. Neutron transport through<br />
the MRI-defined medium would therefore<br />
accurately calculate L ∞ applicable to<br />
the extremities. From these results,<br />
applying the L ∞- Q relationship of ICRP<br />
26 will yield a consistent, humanly<br />
realistic quality factor (function) for<br />
reporting a neutron equivalent dose to the<br />
extremities. Furthermore, the results can<br />
be used to assess the validity of the ICRP<br />
60 methodology as it pertains to the<br />
extremities.<br />
Progress <strong>and</strong> Results<br />
During <strong>FY</strong>2001, the project completed<br />
the collection of MRIs for eleven<br />
volunteer subjects. The image field of<br />
view consisted of one leg <strong>and</strong> one arm<br />
per volunteer. The images were subsequently<br />
postprocessed to grossly segment<br />
the various tissues, that is, fat, muscle,<br />
bone, <strong>and</strong> other. The original<br />
(non-postprocessed) images were<br />
provided as well. Using this image series,<br />
computer anatomical mappings of the
Figure 1. MR images of the leg, transverse orientation:<br />
a) raw image (left), corresponding segmented image (right) using previous technique.<br />
b) raw image (left), corresponding segmented image (right) using improved technique.<br />
body will be constructed as the geometry<br />
definitions for neutron transport calculations,<br />
i.e., MCNP input file geometry<br />
cards.<br />
Additional work was performed to<br />
resolve segmenting anomalies. To reduce<br />
noise, accurately define tissue boundaries,<br />
<strong>and</strong> limit the segmenting field-ofview<br />
once a tissue has been defined,<br />
postprocessing techniques were employed<br />
to eliminate ambiguous results.<br />
Marrow was added as another defined<br />
tissue. The improved segmenting<br />
technique renders satisfactory anatomy<br />
mappings in an automated fashion, rather<br />
than painstakingly addressing images<br />
voxel by voxel.<br />
(a)<br />
(b)<br />
Conclusion <strong>and</strong> Deliverables<br />
A database of magnetic resonance<br />
images of the human extremities suitable<br />
for structuring the geometry conditions of<br />
Monte Carlo computations has been<br />
compiled. The result of the Monte Carlo<br />
computations using the MRI database<br />
will be assembled into a coherent<br />
methodology that will serve as the<br />
technical basis for reporting the neutron<br />
extremity dose consistent with current<br />
regulations <strong>and</strong> st<strong>and</strong>ards. The methodology<br />
will be presented for peer review<br />
among the health physics extremity<br />
dosimetry/personnel monitoring<br />
community <strong>and</strong>, following appropriate<br />
revision, will be instituted as a component<br />
of the LANL Personnel Dosimetry<br />
Program, ESH-4.<br />
Health Physics<br />
References<br />
10 CFR 835, Occupational Radiation<br />
Protection, Code of Federal Regulations,<br />
Volume 61, No. 247, December 23,<br />
(1996).<br />
American National St<strong>and</strong>ards Institue<br />
(ANSI), Performance Testing of Extremity<br />
Dosimeters, HPS N13.32 (New York:<br />
ANSI, 1995).<br />
ICRP Publication 26, Recommendations<br />
of the International Commission on<br />
Radiological Protection, Pergamon Press,<br />
Oxford, Engl<strong>and</strong> (1977).<br />
ICRP Publication 60, 1990 Recommendations<br />
of the International Commission on<br />
Radiological Protection, Pergamon Press,<br />
Elmsford, NY (1991).<br />
University of New Mexico Health<br />
Science Center, Clinical <strong>and</strong> Magnetic<br />
Resonance Research Center, 1201 Yale<br />
NE, Albuquerque, NM 87131.<br />
37
Health Physics<br />
Laser Illuminated Track Etch Scattering (LITES) Dosimetry System<br />
Principal Investigator: Murray E. Moore (ESH-4)<br />
Coinvestigators: Robert T. Devine, Jeffrey M. Hoffman, Richard J. McKeever (ESH-4), Robert E. Hermes (MST-7), Heather J.<br />
Gepford, Nolan E. Hertel, Georgia Institue of <strong>Technology</strong><br />
Funding: <strong>FY</strong>01 $55K<br />
Introduction<br />
The Laser Illuminated Track Etch<br />
Scattering (LITES) project proposes to<br />
develop <strong>and</strong> build a “next generation”<br />
instrument for measuring the neutron<br />
dose equivalent registered by CR-39<br />
track etch foil dosimeters.<br />
The LITES instrument has the<br />
potential of replacing one (or possibly<br />
two) different instruments, which are<br />
presently used for measuring the neutron<br />
dose equivalent registered by track etch<br />
foils at Los Alamos National Laboratory<br />
(LANL).<br />
To satisfy US Department of Energy<br />
Laboratory Accreditation Program<br />
(DOELAP) requirements, the LANL<br />
Personnel Dosimetry Operations (PDO)<br />
team uses two different analytical<br />
instruments to count track etch foils,<br />
depending on the dose exposure<br />
recorded by the foil.<br />
The instruments used for track etch<br />
counting are (1) the Autoscan 60<br />
(Bicron Instruments), <strong>and</strong> (2) an optical<br />
microscope, which is used to manually<br />
count track etch foils. The Bicron<br />
Autoscan 60 system routinely works for<br />
track etch foils exposed to less than 300<br />
mrem in dose equivalent. An optical<br />
microscope manually counts the foils;<br />
however, this technique is time-consuming,<br />
especially when measuring dose on<br />
dozens of individual foils.<br />
If a single automated instrument<br />
could be developed to count the foils,<br />
there would be monetary savings in the<br />
amount of necessary lab equipment. In<br />
addition, the accuracy <strong>and</strong> reliability of<br />
the single automated system would<br />
simplify the DOELAP certification<br />
requirements.<br />
38<br />
The ESH-4 PDO team leader recently<br />
assessed the current state of PDO track<br />
etch operations, <strong>and</strong> welcomed the<br />
development of a new reader for track<br />
etch dosimeters. The PDO team routinely<br />
processes about 2000 foils quarterly, plus<br />
several hundred foils classified as<br />
“special,” also on a quarterly basis. An<br />
automated instrument would be both<br />
repeatable <strong>and</strong> reliable, <strong>and</strong> would be<br />
more cost effective because manual<br />
counting <strong>and</strong> visual inspection of track<br />
etches would be eliminated.<br />
Method<br />
The basis of the operation of the<br />
LITES system is explained in Figure 1<br />
<strong>and</strong> in the following paragraphs.<br />
LITES<br />
(1)<br />
(6)<br />
(7)<br />
To measure the neutron dose<br />
equivalent received by a CR-39 plastic<br />
foil, neutron tracks are enlarged in the<br />
plastic by a chemical etch procedure.<br />
The etch protocol begins with a one-hour<br />
pre-etch in a 60% methanol <strong>and</strong> 40%<br />
6.25 N NaOH solution at 70 ºC to remove<br />
alpha- <strong>and</strong> heavy-charged particle tracks.<br />
This is followed by a 15-hour etch in<br />
6.25 N NaOH maintained at 70 ºC during<br />
the etch cycle. A 10-minute stop etch<br />
using room temperature 0.1 N HCl <strong>and</strong> a<br />
final rinse with distilled water <strong>and</strong> a<br />
wetting agent complete the protocol. The<br />
etch protocol resulted in an average track<br />
diameter of 20 µm for bare 252 Cf tracks.<br />
Figure 1. Laser Illuminates Track Etch Scattering (LITES) dosimetry system schematic.<br />
(2)<br />
LITES dosimeter <strong>and</strong> component description<br />
(1) Illuminating laser<br />
(2) Track etch pits in the CR-39 foil scatters laser light<br />
(3) Lens refocuses the scattered light<br />
(4) Beam stop blocks main laser beam<br />
(5) Photodiode measures magnitude of scattered laser light<br />
(6) Flat glass slide diverts small portion of main laser beam<br />
(7) Second photodiode measures main laser output<br />
(3)<br />
(4)<br />
(5)
To be measured in the LITES system,<br />
a track etch foil dosimeter is placed in the<br />
LITES sample holder (see Figure 2). This<br />
sample holder is mounted on a YZ<br />
motion-control table (providing linear<br />
motion, side-to-side <strong>and</strong> up-down). Light<br />
from a helium-neon laser with output<br />
power of 6.6 milliWatts is directed<br />
through the track etch foil, <strong>and</strong> the etched<br />
pits cause the laser light to be scattered<br />
(much as drops of water suspended in the<br />
atmosphere scatter incident light)<br />
The optical lens in the LITES system<br />
refocuses the scattered light so that it<br />
impinges onto the photodiode, which<br />
measures the amount of the incident light.<br />
A small beam stop placed in between the<br />
optical lens <strong>and</strong> the photodiode prevents<br />
the main laser beam from reaching the<br />
photodiode, thereby increasing the<br />
sensitivity by which the relatively small<br />
amount of scattered light may be measured<br />
by the photodiode.<br />
A second photodiode is placed at right<br />
angles to the direction of the main laser<br />
beam, <strong>and</strong> a glass slide diverts a small<br />
portion (about 8%) of the main laser<br />
beam to this second photodiode for<br />
measurement. This beam-splitter arrangement<br />
allows real-time measurement of<br />
the laser power output. The LITES<br />
system then uses the ratio of the scattered<br />
light to diverted light as a measurement<br />
metric (“the LITES ratio”) for determining<br />
the amount of the neutron dose<br />
equivalent deposited in the CR-39 foil.<br />
Progress <strong>and</strong> Results<br />
Calibrating LITES with foils of<br />
known dose. The next stage in the<br />
process for measuring neutron dose<br />
equivalent is illustrated in Figure 3,<br />
where the results of foils of known dose<br />
are presented.<br />
In this stage of the analysis, 10 LANL<br />
“lemon” badge holders were exposed to<br />
varying amounts of known neutron dose<br />
equivalent, with each badge holder<br />
containing 5 different CR-39 foils.<br />
Therefore, Figure 3 represents 10 foils,<br />
classified by the location within the<br />
lemon badge holder. Then, the LITES<br />
system was calibrated with this information<br />
so that the background corrected<br />
Health Physics<br />
Figure 2. A photograph of the LITES system shows the vital components in measuring the<br />
light scattered from the track etch pits in the CR-39 foil.<br />
Dose, Rem<br />
6.00<br />
5.00<br />
4.00<br />
3.00<br />
2.00<br />
1.00<br />
0.00<br />
0.00 50.00 100.0<br />
0<br />
LITES ratio BKG<br />
cor rected<br />
Figure 3. Scattered laser light is measured for foils of known calibrated dose equivalent,<br />
allowing the calculation of a predictive correlation factor.<br />
LITES ratio could be used to predict the<br />
neutron-equivalent dose on foils irradiated<br />
with an unknown amount of dose.<br />
Measuring foils of unknown dose<br />
with LITES. The PDO team received a<br />
test set of track etch dosimeters consisting<br />
of 10 LANL “lemon badges” that had<br />
been irradiated with varying amounts of<br />
unknown dose. These badge holders held<br />
a total of 50 foils (5 foils per badge) <strong>and</strong><br />
these foils were analyzed by four<br />
different methods, including:<br />
• the Bicron Autoscan 60,<br />
• the LITES system, <strong>and</strong><br />
150.0<br />
0<br />
Foils of<br />
known dose<br />
2nd order<br />
polynomial fit,<br />
R^2=0.998<br />
• manual counting by an optical microscope.<br />
Upon inspection of the graphed results<br />
in Figure 4, one may see an upper bound<br />
for the valid results from the Autoscan<br />
60. The optical microscope results<br />
represent a full three days of manual<br />
counting of the track etch pits for each<br />
data set. In terms of time, the LITES<br />
system was able to process the known<br />
calibration foils plus the unknown trial<br />
foils in about four hours. This was<br />
accomplished using the LITES system in<br />
its current format, which is only semiautomated,<br />
where the operator must<br />
39
Health Physics<br />
manually place <strong>and</strong> remove the individual<br />
foils so that they may be counted. These<br />
results are encouraging, <strong>and</strong> the PDO<br />
staff are interested in the possibilities<br />
available with the new LITES system.<br />
<strong>Development</strong> of supplemental<br />
capabilities: DA-LITES at Georgia<br />
Institute of <strong>Technology</strong>. The DA-LITES<br />
(Differential Angle-LITES) system is a<br />
modification of LANL-LITES (see<br />
Figures 5 <strong>and</strong> 6) that measures the<br />
scattered light intensity from the CR-39<br />
as a function of scatter angle. This work<br />
at Georgia Tech involved not only<br />
making measurements of the scatter<br />
distribution, but also theoretically<br />
evaluating the system’s ability to extract<br />
neutron quality information. The<br />
DA-LITES system is comprised of a<br />
turntable that rotates the silicon-diode<br />
detector about the CR-39 detector at a<br />
fixed distance. As is true of the<br />
LANL-LITES device, the automated<br />
movement of the CR-39 in the horizontal<br />
<strong>and</strong> vertical directions is computer<br />
controlled. This allows for measuring<br />
<strong>and</strong> averaging a number of readings from<br />
distinct locations on the detector.<br />
A theoretical model of scattering from<br />
neutron-induced tracks has been developed.<br />
This model has proven useful in<br />
evaluating the effects of varying different<br />
parameters of the DA-LITES system.<br />
Specifically, a significant change is seen<br />
in the scatter distribution from normal<br />
proton tracks by varying the etch time (15<br />
hours in Figure 7 vs. 6 hours in Figure 8)<br />
<strong>and</strong> by changing the coherent light<br />
wavelength (633 nm vs. 514 nm).<br />
Additional work remains to be done<br />
on the DA-LITES system. The need for<br />
much of this work became evident as a<br />
direct consequence of the work performed<br />
for this contract. Proposed future<br />
work includes experimentally evaluating<br />
the result of changing the wavelength of<br />
coherent light used. Theoretical models<br />
indicate that a change in the scatter<br />
distribution will be observed. We have<br />
acquired an argon-ion laser for this<br />
evaluation. Because of the higher power<br />
of this laser, we expect an improvement<br />
in the measurement error associated with<br />
this method at low dose equivalent.<br />
40<br />
Response (mRem)<br />
5000<br />
4000<br />
3000<br />
2000<br />
1000<br />
0<br />
1 2 3 4 5 6 7 8 9 10<br />
Manual #1<br />
Manual #2<br />
Autoscan 60<br />
LANL-LITES<br />
Manual #3<br />
Figure 4. Results of the analysis of track etch foils of unknown dose. The results from the<br />
LITES instrument compare favorably to results from automated Autoscan 60 instrument <strong>and</strong><br />
to results obtained from manual counting by optical microscope.<br />
HeNe<br />
Laser<br />
Dosimeter IDs<br />
CR-39<br />
Foil<br />
Silicon diode<br />
detector<br />
(on turntable)<br />
Figure 5. The DA-LITES system measures the scattered laser light over a range of scattering<br />
angles.
Figure 6. The DA-LITES instrument had the measurement photodiode mounted on a<br />
turntable which can be positioned at the desired angle.<br />
Intensity<br />
1.E+00<br />
1.E-01<br />
1.E-02<br />
1.E-03<br />
1.E-04<br />
1.E-05<br />
1.E-06<br />
1.E-07<br />
1.E-08<br />
1.E-09<br />
1.E-10<br />
1.E-11<br />
0 10 20 30 40 50 60<br />
Scatter Angle (deg)<br />
Figure 7. Results of 15-hour etch time on track etch foils exposed to various neutron<br />
energies.<br />
Intensity<br />
1.E-01<br />
1.E-03<br />
1.E-05<br />
1.E-07<br />
1.E-09<br />
,<br />
0.5 MeV, 15 hr<br />
1 MeV, 15 hr<br />
5 MeV 15 hr<br />
1.E-11<br />
0 10 20 30 40 50 60<br />
Scatter Angle (deg)<br />
0.5 MeV, 6 hr<br />
1 MeV, 6 hr<br />
5 MeV, 6 hr<br />
Figure 8. Results of 6-hour etch time on track etch foils exposed to various neutron<br />
energies.<br />
Health Physics<br />
Theoretical models indicate that a<br />
15-hour etch significantly limits the<br />
possibility of extracting neutron quality<br />
information, a result which was seen<br />
experimentally. Repeating the experimental<br />
measurements using a set of<br />
CR-39 detectors that were etched for only<br />
six hours should produce more promising<br />
results. In addition, measurements<br />
should be made for additional neutron<br />
spectra <strong>and</strong> monoenergetic neutrons.<br />
Determination of the limitations at<br />
high-dose because of track overlap for<br />
both LANL-LITES <strong>and</strong> DA-LITES is<br />
needed.<br />
From a theoretical st<strong>and</strong>point, a<br />
number of simplifying assumptions were<br />
made that should be addressed. These<br />
include the development of a more<br />
realistic track model that includes carbon<br />
<strong>and</strong> oxygen recoils, consideration of<br />
overetched tracks, <strong>and</strong> the variation in the<br />
track-etch rate as a function of track<br />
depth. The effects of polarization, both<br />
experimentally <strong>and</strong> theoretically, also<br />
remain to be examined.<br />
Conclusion <strong>and</strong> deliverables<br />
The LITES system holds promise in<br />
providing valuable reinforcement (<strong>and</strong><br />
hopefully replacement) of the methods<br />
<strong>and</strong> instruments that have been relied<br />
upon in the past. In order to completely<br />
replace these methods, however, work<br />
remains to include the LITES system into<br />
the ESH-4 PDO Technical Basis<br />
Document.<br />
41
Health Physics<br />
Personal Continuous Air Monitor (PCAM)<br />
Principal Investigator: Ron G. Morgan (ESH-12)<br />
Coinvestigator: Sam Salazar (ESH-4)<br />
Collaborators: William Murray, Hardware Design (NIS-6), Ken Butterfield, Software Design (NIS-6),<br />
Debra Garcia, Financial Mgmt. Support (BUS 3)<br />
Funding: <strong>FY</strong>01 $44.8K<br />
Introduction<br />
Current monitoring <strong>and</strong> alarm capabilities<br />
for airborne actinides are hampered<br />
by delays that can lead to slowed<br />
down evacuation of areas with highactinide<br />
concentrations. We proposed to<br />
develop a wearable alpha continuous air<br />
monitor (CAM) that would sample air in<br />
the user’s breathing zone <strong>and</strong> warn the<br />
user about high levels of airborne alpha<br />
activity very quickly. We believe we<br />
have accomplished that goal.<br />
Statement of Problem.<br />
a. Real-time breathing-zone monitoring<br />
<strong>and</strong> alarm capability for airborne<br />
actinides does not currently exist.<br />
Although fixed CAMs alarm at preset<br />
airborne concentration levels, they are<br />
hampered by dilution factors, caused<br />
by air-circulation patterns <strong>and</strong> the<br />
physical distance from point-ofrelease.<br />
Dilution leads to large delay<br />
times between actinide release <strong>and</strong><br />
CAM alarm. Delays lead, in turn, to<br />
further delay evacuating areas with<br />
high-actinide airborne concentrations,<br />
resulting in potentially larger doses to<br />
personnel.<br />
b. The internal dosimetry required for<br />
actinide-inhalation uptakes is difficult,<br />
imprecise, <strong>and</strong> expensive.<br />
c. Where actinide environments, or<br />
potential actinide environments,<br />
cannot be well characterized (such as<br />
decontamination <strong>and</strong> decommissioning<br />
[D&D] <strong>and</strong> environmental<br />
restoration [ER] projects) or where<br />
environments are seldom entered<br />
(pump rooms, attics, etc.), the worker<br />
protection often takes the form of<br />
overly conservative protective<br />
clothing or administrative controls<br />
that are time-consuming <strong>and</strong> difficult<br />
42<br />
to implement, such as the use of<br />
remotely-operated devices.<br />
Benefit.<br />
a. Real-time monitoring <strong>and</strong> alarm<br />
capability for actinides would lead to<br />
a safer environment for workers, <strong>and</strong><br />
considerable savings related to the<br />
avoidance of occurrences (<strong>and</strong> the<br />
program delays which are often<br />
driven by occurrences).<br />
b. The personal CAM (PCAM) provides<br />
a representative breathing-zone air<br />
sample, which may potentially be<br />
used to assign dose. Where the PCAM<br />
is used, internal dosimetry investigations<br />
may be avoided altogether.<br />
c. Workers in not-well-characterized<br />
environments, for example, D&D <strong>and</strong><br />
ER activities, could use real-time<br />
monitoring <strong>and</strong> alarm capabilities to<br />
prevent exposure <strong>and</strong> avoid overprotection<br />
in administrative <strong>and</strong> protective<br />
clothing requirements.<br />
Method <strong>and</strong> Results<br />
For fiscal year 2001, our main goals<br />
were to develop a prototype set of<br />
hardware for the PCAM <strong>and</strong> to develop<br />
the alarm algorithm to detect alpha<br />
particles from plutonium. To develop the<br />
alarm, we measured alpha spectra from<br />
filters exposed to air that had been moved<br />
through thorium <strong>and</strong> uranium ore<br />
samples. This process provided templates<br />
that were used in Monte Carlo simulation<br />
of the various alarm algorithms <strong>and</strong> alarm<br />
settings. We calculated the detection<br />
likelihood <strong>and</strong> the false alarm rates for<br />
several algorithms. Results from the best<br />
algorithm are presented here. We decided<br />
to use an algorithm based on two regions<br />
of interest (ROIs), one to determine a<br />
background <strong>and</strong> the other for the signal.<br />
Hardware description. The hardware<br />
has three main components: a pump <strong>and</strong><br />
Photo 1. Labeled photo of PCAM,<br />
November 2001.<br />
air system to sweep particles to a<br />
micropore air filter; a silicon-barrier<br />
detector to detect alpha particle emission;<br />
<strong>and</strong> a single board microprocessor based<br />
multichannel analyzer (MCA) to do<br />
energy-resolved alpha spectroscopy. Data<br />
for each detected alpha particle is stored<br />
in list mode in battery backed-up RAM<br />
for long-term storage. The microprocessor<br />
has a keypad <strong>and</strong> liquid crystal<br />
display for the user interface.<br />
Research Results. Our goal was to<br />
develop a system that would alarm at<br />
about the one-DAC (Pu239) level in the<br />
normal radon background present in PF4.<br />
First, we needed to obtain an energy<br />
calibration <strong>and</strong> spectral resolution for our<br />
detector system. We used several<br />
electroplated alpha sources to develop the<br />
energy calibration, U238 , Th230 , Pu239 ,<br />
Pu238 , <strong>and</strong> Pu-Am-U. The sources are<br />
shown in Figure 1.<br />
We used two sources for our radon<br />
data. These were specially prepared<br />
containers of thorium <strong>and</strong> uranium ore<br />
samples that allowed air to be pumped<br />
through the sample on its way to the
filter. While these ore samples were<br />
mostly one type of ore, both samples<br />
contained a mixture or uranium <strong>and</strong><br />
thorium as would be expected from<br />
naturally occurring material. The radon<br />
data demonstrates the detector energy<br />
resolution when measuring alpha spectra<br />
from a filter. See figure 2.<br />
Our alarm algorithm uses two equalwidth<br />
ROIs, one centered on the 6.05<br />
MeV peak from radon <strong>and</strong> one centered<br />
on the 5.15 MeV peak from Pu239 . An<br />
ROI centered on the 5.4 peak would be<br />
used to detect Pu238 . The filter introduces<br />
a loss of resolution because the alpha<br />
particles lose energy in penetrating the<br />
filter material before reaching the<br />
detector. This produces the exponential<br />
tail toward lower energies evident in<br />
Figure 2. Because exponential functions<br />
add as linear functions, we only need to<br />
account for the one radon region when<br />
determining the background under the<br />
plutonium region. We assumed a fixed<br />
ratio in these two ROIs when only radon<br />
is present. We calculate the uncertainty in<br />
this ratio given the current number of<br />
counts in the radon ROI <strong>and</strong> set a<br />
threshold of four sigma for our alarm<br />
level. If the number of counts is small,<br />
we use Poisson statistics to determine the<br />
alarm level, but the certainty required is<br />
about the same as the 4 sigma level for<br />
Gaussian statistics. We also include a<br />
term for the uncertainty in measuring the<br />
mean value in the radon ROI <strong>and</strong> we can<br />
add an extra term to allow setting the<br />
false alarm rate if that becomes necessary.<br />
The data will be stored as a list of<br />
energy <strong>and</strong> arrival times. This will allow<br />
post processing of the data as well as the<br />
real-time analysis planned for the PCAM<br />
system. As each count is recorded, the<br />
spectrum will be developed by playing<br />
the list backward with counts being<br />
added to a histogram, <strong>and</strong> the alarm<br />
function being tested. This will continue<br />
until the alarm threshold is exceeded in<br />
the plutonium ROI or the list is exhausted.<br />
Thus, a new plutonium leak will<br />
not have to overcome a large background<br />
of hours of accumulated radon counts.<br />
counts<br />
Health Physics<br />
Figure 1. Electroplated, single <strong>and</strong> multiple isotope, alpha particle sources measured using<br />
the prototype PCAM system.<br />
Counts<br />
4000<br />
3500<br />
3000<br />
2500<br />
2000<br />
1500<br />
1000<br />
500<br />
0<br />
600<br />
500<br />
400<br />
300<br />
200<br />
100<br />
0<br />
Electroplated Alpha Sources<br />
3 3.5 4 4.5 5 5.5 6<br />
Energy MeV<br />
Radon Spectra<br />
0 1000 2000 3000 4000 5000 6000 7000 8000<br />
0<br />
9000<br />
Energy MeV<br />
Figure 2. Radon Spectra from natural uranium <strong>and</strong> thorium ores. Data represents several<br />
hours of collection on a filter with 2 liters per minute air flow rate. Data has been plotted<br />
using separate Y axis to normalize the peak counts. Note that both spectra contain mixtures<br />
of Rn 222 <strong>and</strong> Rn 220 .<br />
500<br />
450<br />
400<br />
350<br />
300<br />
250<br />
200<br />
150<br />
100<br />
50<br />
9000<br />
8000<br />
7000<br />
6000<br />
5000<br />
4000<br />
3000<br />
2000<br />
1000<br />
0<br />
Counts<br />
U238<br />
Pu239<br />
Pu-Am-U<br />
Pu238<br />
Th230<br />
Th230<br />
Rn220<br />
Rn222<br />
43
Health Physics<br />
We tested our alarm algorithm for<br />
sensitivity <strong>and</strong> false alarm rates using a<br />
Monte Carlo technique. We r<strong>and</strong>omly<br />
sampled a template consisting of the<br />
radon spectrum with an injected plutonium<br />
spectrum. The peak channel of the<br />
plutonium was scaled to be a percentage<br />
of the peak channel in the radon spectrum.<br />
For a plutonium signal of 100%,<br />
the counts in the energy channel at 5.15<br />
MeV from plutonium was equal to the<br />
counts in the 6.05 channel because of<br />
radon. This situation has roughly one<br />
third of the total counts in the spectrum<br />
because there are more radon peaks than<br />
the 6.05 MeV peak. As each r<strong>and</strong>om<br />
count was generated, we treated it just as<br />
we would the counts arriving from the<br />
Table 1. Likelihood for detecting plutonium in a radon background.<br />
Figure 3. False alarm level generated for 8500 data trials.<br />
44<br />
detector. It was added to the histogram,<br />
the background in the ROI <strong>and</strong> the alarm<br />
threshold were calculated, <strong>and</strong> the alarm<br />
function was evaluated. The number of<br />
counts required to produce an alarm was<br />
recorded. This was repeated for many<br />
runs to produce a likelihood function for<br />
an alarm. Table 1 has a summary of these<br />
results. The table indicates that when the<br />
injected plutonium signal is about 100%,<br />
then 50% of the alarms were generated<br />
within the first 19 counts in the detector.<br />
Within 45 counts, 99% of the alarms<br />
were generated.<br />
10% 20% 25% 33% 50% 100% injected<br />
signal<br />
5% 45 22 15 13 7 7<br />
10% 88 33 27 21 13 7<br />
25% 182 57 42 33 21 13<br />
50% 317 99 68 46 32 19<br />
75% 497 148 102 68 42 26<br />
90% 664 203 139 91 55 33<br />
95% 764 239 164 108 62 38<br />
99%<br />
likelihood<br />
986 313 221 142 78 45<br />
Counts<br />
10000<br />
1000<br />
100<br />
10<br />
1<br />
1<br />
5<br />
9<br />
13<br />
17<br />
21<br />
25<br />
29<br />
33<br />
37<br />
41<br />
FALSE ALARMS<br />
45<br />
49<br />
53<br />
57<br />
61<br />
65<br />
TRIALS<br />
69<br />
73<br />
77<br />
81<br />
85<br />
89<br />
93<br />
97<br />
101<br />
105<br />
109<br />
113<br />
117<br />
121<br />
125<br />
ACCUM<br />
To determine a false alarm rate, The<br />
template consisted of the radon spectrum<br />
alone. For each run, sampling was<br />
performed until the alarm level was<br />
exceeded or 10000 counts were generated.<br />
Figure 3 shows the false alarms for<br />
8500 runs. Note that some of the false<br />
alarms happened with the minimum<br />
number of counts required to exceed the<br />
alarm threshold. This probability is<br />
similar to that of tossing a coin 7 times<br />
<strong>and</strong> obtaining seven ‘heads’ in a row. The<br />
step in the curve at 7 represents the<br />
minimum number of counts given<br />
Poisson statistics. A kink in the curve at<br />
42 can be seen where the shift from<br />
Poisson to Gaussian statistics occurs. If<br />
the total counts expected in the PCAM<br />
for a 4 hour shift inside PF4 is 300<br />
counts, then the false alarm rate would be<br />
75/8500 or less than 1% per shift. (One<br />
has to look at the full table of 8500 runs<br />
to get this number).<br />
Conclusions<br />
We can infer from the results above<br />
that, given a radon background comparable<br />
to that in PF-4, the instrument will<br />
be able to detect a one-DAC plutonium<br />
239 atmosphere <strong>and</strong> alarm in about 60<br />
minutes, <strong>and</strong> that it will alarm in a<br />
100-DAC atmosphere in about one<br />
minute.<br />
A point of reference : a one-DAC<br />
atmosphere delivers about 0.042 mrem/<br />
minute to the unprotected worker, <strong>and</strong> a<br />
100-DAC atmosphere delivers about 4.2<br />
mrem/minute. Therefore, a worker in a<br />
one-DAC atmosphere will incur about<br />
2.5 mrem committed effective dose<br />
equivalent (CEDE) before the PCAM<br />
alarms, <strong>and</strong> a worker in a 100-DAC<br />
atmosphere will incure about 4.2 mrem<br />
CEDE prior to the alarm.<br />
The current false alarm rate appears to<br />
be less that 1% in units of 4-hr shifts, i.e.,<br />
we can expect less than one PCAM false<br />
alarm for every 100 4-hr shifts worked.<br />
We do see some potential for improvement<br />
in this false alarm rate.<br />
We plan on placing the PCAM into<br />
PF4 <strong>and</strong> the CMR building in order to<br />
obtain actual data in fiscal year 2002.
PRESCILA: Proton Recoil Scintillator Los Alamos Neutron Rem Meter<br />
Principal Investigator: Richard H. Olsher (ESH-4)<br />
Coinvestigators: David T. Seagraves, Shawna L. Eisele, Christopher W. Bjork, <strong>and</strong> William A. Martinez (ESH-4)<br />
Funding: <strong>FY</strong>99 $15K, <strong>FY</strong>00 $12.5K, <strong>FY</strong>01 $20K<br />
Introduction<br />
Conventional neutron meters currently<br />
in use at Los Alamos <strong>and</strong> elsewhere are<br />
based on 1960s technology that relies on<br />
a large neutron-moderator assembly<br />
surrounding a thermal detector to achieve<br />
an accurate dose response. Typically, a<br />
BF3 or 3He gas-filled counter tube is<br />
positioned in the center of a heavy (e.g.,<br />
20 pounds) polyethylene moderator. The<br />
heavy moderator is necessary to obtain a<br />
useful response over a limited neutron<br />
energy range, from thermal to 10 MeV<br />
In general, current rem meters are not<br />
only heavy <strong>and</strong> bulky, but possess poor<br />
high-energy response above 10 MeV,<br />
which makes them inaccurate for<br />
applications at high-energy accelerator<br />
facilities (e.g., Los Alamos Neutron<br />
Science Center (LANSCE)). Other<br />
disadvantages are high cost (as much as<br />
$6K) <strong>and</strong> poor ergonomics for field<br />
surveys. The photo above demonstrates<br />
the ease with which PRESCILA can be<br />
used to perform field surveys.<br />
Our goal was to develop a practical<br />
proton recoil scintillator (PRESCILA) of<br />
low weight (5 pounds) with good<br />
sensitivity <strong>and</strong> gamma rejection, <strong>and</strong><br />
enhanced high-energy response.<br />
PRESCILA offers the potential of<br />
replacing thous<strong>and</strong>s of neutron rem<br />
meters in field applications around the<br />
world with a lightweight <strong>and</strong> more<br />
accurate design.<br />
Benefits<br />
(a) Radiation Protection (Group ESH-1)<br />
has requested a lightweight alternative<br />
to the st<strong>and</strong>ard rem meter to facilitate<br />
field surveys. The weight of the<br />
commercial version of PRESCILA is<br />
about 2 kg (4.5 pounds) versus the 10<br />
kg (22 pounds) of a st<strong>and</strong>ard rem<br />
meter.<br />
(b) The cost of maintenance of the current<br />
inventory is driven by the need to<br />
periodically replace the BF detector<br />
3<br />
tube ($300 ea.). Over the life of the<br />
inventory (130 rem meters), these<br />
costs are estimated to be $60,000.<br />
Maintenance costs for PRESCILA<br />
should be about 50% lower for a<br />
saving of $30,000.<br />
(c) Poor energy response at high-neutron<br />
energies limits the ability of a<br />
st<strong>and</strong>ard rem meter to accurately<br />
measure dose around accelerator<br />
facilities, such as LANSCE. St<strong>and</strong>ard<br />
rem meters with a pure polyethylene<br />
moderator seriously underestimate (by<br />
up to a factor of ten) neutron dose<br />
around accelerator facilities. A recent<br />
design trend has been to add heavy<br />
metal inserts to the polyethylene<br />
moderator to improve the high-energy<br />
response via spallation neutron<br />
generation. Birattari et al. (1990) were<br />
the first to investigate the use of a lead<br />
insert to enhance neutron response<br />
above the (n,2n) threshold of about 8<br />
MeV. The Los Alamos design<br />
WENDI-II (Olsher et al. 2000) uses<br />
Health Physics<br />
tungsten powder as both an absorber<br />
<strong>and</strong> neutron generator to extend the<br />
response function to 5 GeV. In both<br />
cases, there is a serious weight<br />
penalty as the moderator assembly<br />
exceeds 30 pounds in weight.<br />
(d) As the PRESCILA rem meter is<br />
accepted throughout the Department<br />
of Energy (DOE) complex, cost<br />
savings <strong>and</strong> improved performance<br />
will be realized in every radiation<br />
protection program where neutron<br />
dose-hazards are present.<br />
(e) The possibility of patenting this<br />
detector means royalty income to the<br />
Laboratory via licensing agreements<br />
with instrument vendors. Currently,<br />
Eberline Instruments <strong>and</strong> Ludlum<br />
Measurements, Inc., are in the process<br />
of licensing <strong>and</strong> commercializing the<br />
PRESCILA technology.<br />
Objectives<br />
During <strong>FY</strong>01 the project team<br />
investigated a final PRESCILA probe<br />
design with the following objectives:<br />
• Finalize the fast <strong>and</strong> thermal scintillator<br />
development in collaboration with<br />
Eljen <strong>Technology</strong> <strong>and</strong> Ludlum Measurements,<br />
Inc.<br />
• Optimize the detector-response<br />
function to obtain the most accurate<br />
energy response for operational<br />
spectra.<br />
• Characterize the probe’s performance<br />
using both benchmark neutron fields<br />
<strong>and</strong> operational spectra.<br />
• Determine the optimum calibration<br />
protocol for the probe <strong>and</strong> the associated<br />
counter.<br />
45
Health Physics<br />
Methods <strong>and</strong> Results<br />
Probe Design <strong>and</strong> Assembly. Figure<br />
1 shows an exploded view of the final<br />
PRESCILA probe schematic. Fast <strong>and</strong><br />
thermal scintillator elements are used to<br />
provide a wide energy response from<br />
thermal to well beyond 20 MeV. Light<br />
produced in the scintillators is collected<br />
by the Lucite light guide <strong>and</strong> transmitted<br />
to the photo multiplier tube (PMT),<br />
where it is converted into current. An<br />
ADIT sideview bialkali 1-inch PMT is<br />
positioned in a cylindrical cutout in the<br />
light guide. The light guide itself — as<br />
well as additional polyethylene — is used<br />
as moderating material for the thermal<br />
scintillator, which is located below the<br />
PMT.<br />
The fast neutron signal is derived<br />
primarily from proton recoils in the<br />
hydrogenous matrix of the fast scintillator<br />
elements. The Eljen <strong>Technology</strong> EJ-400P<br />
scintillator is based on the work of<br />
Hornyak (Hornyak 1952) <strong>and</strong> Emmerich<br />
(Emmerich 1954) in the 50s. The original<br />
Hornyak detector was made by molding<br />
together a blended mixture of ZnS <strong>and</strong><br />
Lucite powders. The original design<br />
suffered from poor efficiency because<br />
ZnS(Ag) absorbs its own light <strong>and</strong> limits<br />
the active phosphor volume that can<br />
transmit light to the PMT. Emmerich<br />
improved the light-collection efficiency<br />
by embedding sections of 1/8-in-thick<br />
Lucite sheet into the detector. The Lucite<br />
acted as a light guide for pulses originating<br />
inside the scintillator. This principle<br />
is taken to the extreme in the Eljen<br />
<strong>Technology</strong> EJ-410P design (Figure 2),<br />
which is the result of a collaborative<br />
effort with Eljen <strong>Technology</strong> <strong>and</strong> Ludlum<br />
Measurements, Inc. The strategy was to<br />
increase the surface area from which<br />
scintillation light may be emitted <strong>and</strong> to<br />
minimize self-absorption in the phosphor.<br />
A total of five phosphor rings is used; the<br />
thickness of each ring is approximately<br />
2.5 mm.<br />
The grooves are filled with a mixture<br />
of epoxy glue <strong>and</strong> ZnS(Ag) powder. This<br />
geometry minimizes light self-absorption<br />
<strong>and</strong> maximizes the phosphor surface area<br />
that can communicate light to the PMT.<br />
Some of the proton recoils reach <strong>and</strong><br />
46<br />
PMT H<strong>and</strong>le<br />
PMT<br />
Polyethylene (5% Boron)<br />
Lucite<br />
Light Guide<br />
Thermal -Neutron Scintillator:<br />
6 LiF + ZnS phosphor<br />
Cadmium /Lead Filter<br />
4.1 in.<br />
Polyethylene (5% Boron)<br />
Fast-Neutron Scintillator:<br />
ZnS phosphor in<br />
hydrogenous matrix<br />
Figure 1. An exploded view of the PRESCILA neutron rem meter (patent pending).<br />
Figure 2. Elijen EJ410-P fast scintillator.<br />
deposit energy in nearby grains of<br />
ZnS(Ag) phosphor. The phosphor grain<br />
size is on the order of 8 microns, which<br />
gives protons an advantage over secondary<br />
electrons for depositing significantly<br />
more energy per grain because of their<br />
higher stopping power (dE/dx). The<br />
resultant voltage pulse height generated<br />
by proton tracks is of sufficient magnitude<br />
to allow gamma pulse height<br />
discrimination. In contrast, plastic<br />
scintillators require pulse shape discrimi-<br />
nation for effective gamma discrimination.<br />
Since st<strong>and</strong>ard health physics<br />
counters, such as the Eberline E-600,<br />
only provide pulse height discrimination,<br />
PRESCILA is compatible with existing<br />
off-the-shelf commercial counters.<br />
Epithermal <strong>and</strong> intermediate energy<br />
neutron response is generated by the<br />
thermal scintillator (Eljen EJ-420P), an<br />
improved form of the Stedman scintillator<br />
(Stedman 1956). A mixture of 6LiF
<strong>and</strong> ZnS(Ag) powders is hot-pressed onto<br />
the back of a Lucite disc, with the active<br />
phosphor layer being convoluted to<br />
maximize light output. The percentage of<br />
6Li loading is adjusted to properly match<br />
the response of the fast scintillators. The<br />
6Li(n,α) 3H reaction produces the ionizing<br />
tracks responsible for excitation of the<br />
phosphor. Both the triton <strong>and</strong> alpha<br />
particle have sufficient range to ionize<br />
nearby grains of phosphor.<br />
A lead/cadmium filter is located<br />
directly below the thermal scintillator in<br />
order to further contour its response. The<br />
filter consists of a 1.12-in. diameter lead<br />
disc (0.015-in. nominal thickness)<br />
followed by a 0.75-in. diameter cadmium<br />
disc (0.015-in. thick).<br />
Probe Energy Response. The energy<br />
response of the final PRESCILA prototype<br />
was investigated at the Physikalisch-<br />
Technische Bundesanstalt (PTB), the<br />
German Bureau of St<strong>and</strong>ards, during July<br />
2001. The irradiations included a series<br />
of monoenergetic neutron beams at the<br />
PTB Accelerator Facility, as well as bare<br />
<strong>and</strong> D2O moderated 252Cf irradiations.<br />
The Accelerator techniques included<br />
all of the available ISO techniques:<br />
24 keV, 144 keV, 250 keV, 565 keV,<br />
1.2 MeV, 2.5 MeV, 5.0 MeV, 8.0 MeV,<br />
14.8 MeV, <strong>and</strong> 19 MeV. These beams are<br />
produced by accelerating protons or<br />
deuterons onto 7Li, tritium, <strong>and</strong> deuterium<br />
targets. The beams have been well<br />
characterized by the Neutron Dosimetry<br />
staff of the PTB using spectral measurements<br />
including time of flight techniques.<br />
The irradiations were performed in a lowscatter<br />
geometry in a large experimental<br />
hall (24 m x 30 m x 14 m). The contribution<br />
of room return <strong>and</strong> background was<br />
subtracted for each technique by performing<br />
an additional measurement using an<br />
appropriate shadow cone between the<br />
detector <strong>and</strong> neutron source. In the case<br />
of the 19 MeV technique, a large unwanted<br />
neutron contribution is generated<br />
because of (d,n) reactions in the target<br />
structural materials (Ti <strong>and</strong> Ag). An<br />
additional measurement was performed<br />
with a blank (untritiated) target. The<br />
blank target count rate was then subtracted<br />
from the primary measurement to<br />
correct for this source of background<br />
neutrons.<br />
The results of these measurements are<br />
given in Figures 3, 4, <strong>and</strong> 5. The response<br />
function shown for PRESCILA is<br />
supplemented below 0.144 MeVwith<br />
Monte Carlo calculations using the Los<br />
Alamos code MCNP. A detailed model<br />
was used to track neutrons though the<br />
probe assembly. The absolute response of<br />
the thermal detector was calculated in<br />
terms of total number of capture reactions<br />
in 6Li. The result was adjusted to match<br />
the experimentally determined response<br />
at 0.144 MeV. The MCNP calculations<br />
agree with experimentally determined<br />
response at 24 keV within 1.5%. Also<br />
shown are the calculated response<br />
functions for the Eberline NRD, Eberline<br />
WENDI, <strong>and</strong> the Andersson-Braun (AB)<br />
rem meters. The response per unit dose<br />
functions were normalized to a bare 252Cf field to simulate the effect of such a<br />
calibration. Figure 3 shows the absolute<br />
response per unit fluence in units of<br />
counts-cm2 .<br />
Figure 3. Response per unit fluence.<br />
Health Physics<br />
The sensitivity of PRESCILA is on<br />
par with that of the Eberline WENDI rem<br />
meter, <strong>and</strong> is a factor of 10 higher than<br />
that of the Eberline NRD. Sensitivity<br />
measurements in st<strong>and</strong>ard isotopic fields<br />
are summarized in Table 1.<br />
The traditional energy response (per<br />
unit dose) is shown in Figures 4 <strong>and</strong> 5 for<br />
PRESCILA [both NCRP-38 <strong>and</strong> H*(10)],<br />
the Eberline NRD, <strong>and</strong> the Andersson-<br />
Braun (AB) or Snoopy rem meters.<br />
Figure 5 provides an exp<strong>and</strong>ed view of<br />
the energy range from 0.1 MeV to<br />
20 MeV. The ideal response per unit dose<br />
is, of course, a uniform response of 1.0 at<br />
all neutron energies. All rem meters<br />
deviate from the ideal significantly.<br />
Below 0.1 MeV, PRESCILA’s energy<br />
response exhibits an over response<br />
similar to that of current commercial<br />
models. In the range from 0.1 MeV to 1.0<br />
MeV, the probe under responds with the<br />
response minima of 0.35 being at energy<br />
of 0.565 MeV. PRESCILA was designed<br />
so that the over-response balances out the<br />
under-response to provide a reasonably<br />
uniform response for typical field spectra.<br />
47
Health Physics<br />
Table 1. Rem meter sensitivity (NCRP-38 Dose) The predicted response of PRESCILA<br />
48<br />
Model<br />
Bare 252 Cf<br />
(cpm/mrem/h)<br />
D 2 O Moderated 252 Cf<br />
(cpm/mrem/h)<br />
241 AmBe<br />
(cpm/mrem/h)<br />
PRESCILA 420 690 610<br />
NRD 39 51.4 30.7<br />
Figure 4. Energy response functions per unit dose.<br />
Figure 5. Energy response functions.<br />
in a variety of benchmark <strong>and</strong> operational<br />
neutron fields was calculated by folding<br />
the fluence response function (Fig. 3)<br />
with published neutron spectra. Almost<br />
all of the spectra, including a representative<br />
selection of pressurized water reactor<br />
fields (PWR) were derived from the<br />
IAEA’s Technical Report 318 (IAEA,<br />
1990). The calculations are summarized<br />
in Table 2 <strong>and</strong> provide a virtual glimpse<br />
of PRESCILA’s expected field performance.<br />
The nomenclature for the neutron<br />
fields is identical to that given in the<br />
IAEA report. The absolute response (cpm<br />
per unit dose) is given as well as the<br />
relative response referenced to a bare<br />
252Cf calibration.<br />
For most operational spectra, a bare<br />
252Cf calibration is optimum <strong>and</strong> gives<br />
the most conservative response. For<br />
accelerator produced high-energy fields,<br />
a 241AmBe calibration is most suitable.<br />
Unlike both the NRD <strong>and</strong> AB meters,<br />
which decrease monotonically in response<br />
above 7 MeV, PRESCILA’s<br />
response is quite uniform from 2 MeV to<br />
19 MeV, the high-energy limit of the<br />
PTB facility. Indications are that its highenergy<br />
response is extended beyond 100<br />
MeV, based on irradiations <strong>and</strong> field-test<br />
measurements obtained at the LANSCE.
Table 2. PRESCILA Response in various benchmark <strong>and</strong> operational fields.<br />
Response (cpm/mrem/h) Relative Response:<br />
Neutron Spectrum<br />
Bare<br />
NCRP-38 H*(10)<br />
252 Cf Calibration<br />
NCRP-38 H*(10)<br />
Bare 252 Cf 413 361 1.00 1.00<br />
252<br />
Cf in 18-inch diameter<br />
polyethylene sphere<br />
485 433 1.17 1.20<br />
252 Cf Skyshine 357 291 0.86 0.81<br />
D2O moderated 252 Cf 689 602 1.67 1.67<br />
241 AmBe 617 586 1.49 1.62<br />
Bare 238 PuO2 443 383 1.07 1.06<br />
Cm2O3 power source 416 362 1.00 1.00<br />
Bare PuF4 source 252 210 0.61 0.58<br />
BWR E/3-X29 366 279 0.88 0.77<br />
PWR I/1-IV 595 451 1.44 1.25<br />
PWR F/5 728 555 1.76 1.54<br />
PWR G/3 602 469 1.46 1.30<br />
PWR H/12 585 455 1.42 1.26<br />
PWR 1L-1 540 414 1.31 1.15<br />
Medical Accelerator: 25 MeV Phot 529 470<br />
Tungsten, through<br />
90 cm concrete<br />
1.28 1.30<br />
25 MeV photons on Tungsten,<br />
skyshine<br />
384 310 0.93 0.86<br />
Medical Accelerator: U-120<br />
Cyclotron, unshielded<br />
696 684 1.68 1.89<br />
Fusion Reactors: Tokamak,<br />
First wall<br />
467 398 1.13 1.10<br />
Natural Uranium pile (5 ton) 400 300 0.97 0.83<br />
Measured Dose Rate (mrem/h)<br />
60<br />
50<br />
40<br />
30<br />
20<br />
10<br />
0<br />
PRESCILA<br />
EAGLE<br />
SWENDI<br />
DiNeutron<br />
Figure 6. 4WNR15L flight path survey.<br />
Rembrant<br />
Instrument Type<br />
HPI 2080<br />
top 6"<br />
top 12"<br />
bottom 6"<br />
bottom 12"<br />
NRD<br />
RO2 (gamma)<br />
HPI (gamma)<br />
Health Physics<br />
Field Measurements. Limited field<br />
testing of two preproduction prototypes<br />
was completed at Los Alamos during<br />
2001. Both probes were mated to<br />
Eberline E-600 counters.<br />
One probe, calibrated to 241AmBe neutrons, participated in a survey of<br />
Flight Path 15L, Target 4, WNR facility<br />
south yard, at LANSCE. Target 4 is a<br />
tungsten target that is routinely irradiated<br />
by a 800 MeV proton beam for spallation<br />
neutron production. PRESCILA <strong>and</strong><br />
several other neutron rem meters<br />
obtained dose rate data at several<br />
distances from the flight path beam tube.<br />
The neutron beam is highly collimated,<br />
so the measurements represent scatter<br />
primarily because of interactions in the<br />
beam tube’s walls <strong>and</strong> air fill. The results<br />
are summarized in Figure 6. The EAGLE<br />
is a modified version of the HPI 2080<br />
pulsed neutron rem meter, <strong>and</strong> features a<br />
tungsten powder loaded moderator<br />
assembly for extended high-energy<br />
response to 5 GeV. The PRESCILA data<br />
agree closely with the EAGLE measurements.<br />
The second PRESCILA rem meter,<br />
calibrated to 252Cf neutrons, was used at<br />
a plutonium processing facility at Los<br />
Alamos in conjunction with other<br />
instruments to map out the neutron dose<br />
rates in several rooms. The results are<br />
summarized in Table 3.<br />
Under the instrument list, ROSPEC<br />
refers to BTI Inc.’s Rotational Spectrometer.<br />
SWENDI refers to Eberline’s Smart<br />
WENDI rem meter, <strong>and</strong> REMbr<strong>and</strong>t<br />
refers to Apfel Enterprises’ neutron<br />
survey meter Model AP2001. The<br />
ROSPEC was first used to measure the<br />
neutron spectrum at the locations<br />
indicated, <strong>and</strong> then it calculated the<br />
corresponding dose by folding in an<br />
appropriate fluence to dose-conversion<br />
function. Based on previous studies,<br />
ROSPEC dose measurements are<br />
believed to be accurate to within 10%.<br />
Where ROSPEC results were available,<br />
PRESCILA measurements in general<br />
agreed within 21%.<br />
49
Health Physics<br />
Table 3. Field survey data for plutonium processing facility.<br />
Location Instrument Dose Rate (mrem/h)<br />
PRESCILA 9.8<br />
Vault, Room A<br />
ROSPEC 8.1<br />
SWENDI 10.3<br />
REMbr<strong>and</strong>t 6.9<br />
PRESCILA 66.2<br />
Vault, Room C<br />
ROSPEC 63.1<br />
SWENDI 83.3<br />
PRESCILA 64.6<br />
Vault, Room E<br />
ROSPEC 62.1<br />
SWENDI 77.7<br />
REMbr<strong>and</strong>t 21.9<br />
PRESCILA 38.4<br />
Vault, Room G<br />
ROSPEC 33.3<br />
SWENDI 39.1<br />
REMbr<strong>and</strong>t 31.8<br />
PRESCILA 66.0<br />
Vault, Room J<br />
SWENDI 73.4<br />
REMbr<strong>and</strong>t 37.7<br />
PRESCILA 54.0<br />
Vault, Room K<br />
SWENDI 60.4<br />
REMbr<strong>and</strong>t 26.1<br />
PRESCILA 12.1<br />
Hallway/Room A<br />
SWENDI 13.2<br />
REMbr<strong>and</strong>t 4.8<br />
PRESCILA 18.6<br />
Hallway/Room G<br />
SWENDI 18.5<br />
REMbr<strong>and</strong>t 9.3<br />
PRESCILA 13.2<br />
Hallway/Room K<br />
SWENDI 12.7<br />
REMbr<strong>and</strong>t 7.9<br />
PRESCILA 15.2<br />
Hallway/Room M<br />
SWENDI 16.1<br />
REMbr<strong>and</strong>t 12.3<br />
Angular Dependence. The angular<br />
dependence of the PRESCILA probe was<br />
investigated at PTB at low (0.144 MeV),<br />
intermediate (2.5 MeV), <strong>and</strong><br />
high-neutron energies (14.8 MeV). Data<br />
were collected for both X–Y <strong>and</strong> X–Z<br />
planes of rotation (the Z-axis is defined<br />
along the h<strong>and</strong>le of the probe). The<br />
results are presented in Figures 7, 8,<br />
<strong>and</strong> 9.<br />
Typically, response uniformity was<br />
within +/15% for all three energies tested<br />
<strong>and</strong> both rotations. The maximum<br />
deviation, about 22% over response, was<br />
measured during the X–Z rotation at<br />
144 keV for the bottom facet of the<br />
probe.<br />
50<br />
Figure 7.<br />
PRESCILA: Angular Dependence<br />
0.144 MeV Neutron Energy<br />
X-Y <strong>and</strong> X-Z Rotations<br />
Figure 8.<br />
Figure 9.
Response Linearity. The dose rate<br />
linearity of PRESCILA was investigated<br />
at PTB using the Accelerator Facility’s<br />
Cyclotron <strong>and</strong> the 2H(d,n) 3He reaction,<br />
which produces an intense 8 MeV<br />
neutron beam. In addition, the response<br />
linearity below 100 mrem/h was studied<br />
at the PTB Bunker facility using a bare<br />
252Cf source. All of the measurements<br />
were conducted with the Eberline E-600<br />
counter. The results are summarized in<br />
Figure 10.<br />
The response becomes nonlinear at<br />
dose rates in excess of 600 mrem/h<br />
because of coincidence counting of small<br />
pulse height events. These are proton<br />
recoil events that individually would not<br />
exceed the upper discriminator setting<br />
<strong>and</strong> trigger a count. However, at<br />
high-count rates on the order of 500,000<br />
cpm, coincidence results in increased<br />
counting efficiency. As the count rate<br />
exceeds about 106 cpm, dead time<br />
becomes severe enough to reduce the<br />
response per unit dose. The under<br />
response is 45% at a dose rate of 2.5 rem/<br />
h.<br />
Gamma Rejection. The gamma<br />
spillover into the neutron channel was<br />
investigated at both Los Alamos <strong>and</strong> PTB<br />
using a 137Cs field, <strong>and</strong> at Los Alamos<br />
using 137Cs <strong>and</strong> 60Co, <strong>and</strong> fluorescent xray<br />
fields. When the neutron channel<br />
discriminator is properly set for a neutron<br />
response of 410 cpm/mrem/h (bare<br />
252Cf), the gamma spillover was determined<br />
to be approximately linear up to an<br />
exposure rate of 100 mR/h. The gamma<br />
response was also found to be relatively<br />
independent of energy over the range<br />
from 100 keV to 1.2 MeV. Above 100<br />
mrem/h gamma, the response was found<br />
to become nonlinear up to several<br />
hundred mR/h <strong>and</strong> finally saturate in<br />
fields over 500 mrem/h gamma.<br />
The gamma spillover magnitude was<br />
determined to be typically in the range of<br />
2–3% of the photon exposure rate in pure<br />
gamma fields. In a 58 mrem/h gamma<br />
field, the corresponding response in the<br />
neutron channel was measured to be 1<br />
mrem/h, amounting to only a minor over<br />
estimate of the total dose rate. In mixed<br />
gamma-neutron fields, the gamma<br />
Figure 10. PRESCILA: response linearity.<br />
contribution increases because of<br />
coincidence counting. Combining a 58<br />
mrem/h gamma field with a 77 mrem/h<br />
252Cf neutron field, resulted in a 14.6%<br />
over response in the neutron channel.<br />
However, use of the Eberline E-600<br />
counter’s spillover correction capability<br />
allows for dynamic correction of the<br />
gamma signal by subtraction of a small<br />
percentage (2%) of the lower channel<br />
from the upper (neutron) channel. For the<br />
spillover correction to work properly,<br />
however, the lower <strong>and</strong> upper channels<br />
need to be defined correctly (see section<br />
on calibration protocol).<br />
Calibration Protocol. The Eberline<br />
E-600 counter’s functionality ideally<br />
suits the needs of the PRESCILA probe,<br />
so one of the research objectives was to<br />
determine an optimum calibration<br />
procedure for this particular combination.<br />
The following general procedure is<br />
recommended:<br />
• Set the probe high voltage to 635 V.<br />
• Select the upper window of channel 1<br />
as the neutron channel.<br />
• Set the dead time to 8 µs<br />
Health Physics<br />
• Position the probe in either a 252Cf or<br />
241AmBe field—depending on the<br />
calibration spectrum desired.<br />
• Adjust the upper discriminator to<br />
obtain a response of 410 (+/-5%) cpm/<br />
mrem/h for 252Cf or 590 (+/- 5%) cpm/<br />
mrem/h for 241AmBe. The exact<br />
discriminator setting is a function of<br />
the PMT gain.<br />
• Set the calibration constant in counts/<br />
rem equal to: (cpm/mrem/h)(60,000).<br />
• Calculate the lower discriminator<br />
setting as 40% of the upper discriminator.<br />
Adjust the lower discriminator<br />
accordingly.<br />
• Set the lower-to-upper channel<br />
crossover to 0.02.<br />
Measurements have shown that the<br />
reproducibility of the threshold settings<br />
among E-600 counters varies by as much<br />
as 30%. Since the proton recoil distribution<br />
is uniform from the spectrum<br />
maximum to the lower threshold, any<br />
relative shift in the upper discriminator<br />
setting impacts neutron channel accuracy.<br />
For this reason, it is recommended that<br />
each probe be dedicated to a particular<br />
E-600 counter <strong>and</strong> be calibrated as a unit.<br />
51
Health Physics<br />
Conclusion <strong>and</strong> Deliverables<br />
A final PRESCILA probe design is<br />
now ready for licensing. Its salient<br />
performance features are as follows:<br />
(a) Extended energy response to beyond<br />
20 MeV<br />
(b) Excellent sensitivity (410 cpm/mrem/<br />
h for bare 252Cf) (c) Uniform directional response over a<br />
wide range of energies<br />
(d) Low weight (4.5 pounds)<br />
(e) Good gamma rejection in fields up to<br />
100 mR/h<br />
On March 9, 2001, the Laboratory<br />
filed a patent application (DOE Docket<br />
No. S-96,584) for the PRESCILA<br />
neutron rem meter. Licensing negotiations<br />
are in progress with both Eberline<br />
Instruments <strong>and</strong> Ludlum Measurements,<br />
Inc. A commercial version of PRESCILA<br />
is expected to be available to the health<br />
physics community in early 2002.<br />
52<br />
References<br />
Birattari, C., A. Ferrari, C. Nuccetelli, M.<br />
Pelliccioni, <strong>and</strong> M. Silari, “An extended<br />
range neutron rem counter,” Nucl.<br />
Instrum. Methods A297:250–257 (1990).<br />
Compendium of Neutron Spectra <strong>and</strong><br />
Detector Responses for Radiation<br />
Protection Purposes, Technical Report<br />
Series No. 318, International Atomic<br />
Energy, Vienna (1990).<br />
Emmerich, W. S., “A Fast Neutron<br />
Scintillator,” Rev. Sci. Instr. 25:69–70<br />
(1954).<br />
Hornyak, W. F., “A Fast Neutron<br />
Detector,” Rev. Sci. Instr. 23:264–267<br />
(1952).<br />
Olsher, R.H., H.H. Hsu, A. Beverding,<br />
J.H. Kleck, W.H. Casson, D.G. Vasilik,<br />
<strong>and</strong> R.T. Devine, “WENDI: An Improved<br />
Neutron Rem Meter,” Health Phys.<br />
70:170–181 (2000).<br />
Stedman, R., “Scintillator for Thermal<br />
Neutron using 6 LiF <strong>and</strong> ZnS(Ag),” Rev.<br />
Sci. Instr. 31:1156 (1956).
Health Physics<br />
Rapid Discrimination of Personnel Contamination Due to Radon versus Other<br />
Alpha-Emitting Radionuclides<br />
Principle Investigator: James T. Voss, Operational Health Physics (ESH-1)<br />
Coinvestigator: William Martinez, Health Physics Measurements (ESH-4)<br />
Funding: <strong>FY</strong>99, $22.2K; <strong>FY</strong>00, $18K; <strong>FY</strong>01, $18K<br />
Introduction<br />
Personnel, clothing, <strong>and</strong> other items<br />
may become contaminated with unknown<br />
radioactive isotopes. Naturally<br />
occurring radon <strong>and</strong> thoron progeny<br />
impact the determination of the sources<br />
of contamination due to their collection<br />
on electrostatic surfaces, such as plastic<br />
items <strong>and</strong> synthetic clothing, <strong>and</strong> their<br />
subsequent transfer to personnel or<br />
clothing.<br />
The present available methods of<br />
determining whether the contamination is<br />
because of radon or other radionuclides<br />
include:<br />
(1) determining the alpha-to-beta ratio<br />
(this may be accomplished with h<strong>and</strong>held<br />
alpha-beta friskers in the field or<br />
by counting samples with gross<br />
alpha-beta laboratory counters);<br />
(2) recounting the sample after a short<br />
decay period to confirm short-lived or<br />
long-lived isotopes;<br />
(3) alpha spectroscopy;<br />
(4) beta spectroscopy; <strong>and</strong><br />
(5) gamma spectroscopy.<br />
These methods all take time <strong>and</strong> may<br />
prove to be inconclusive. The time<br />
required to determine if contamination<br />
comes from radon results in (1) lost<br />
productivity while the worker <strong>and</strong> the<br />
surveyor(s) make the determination <strong>and</strong><br />
(2) increased anxiety in the worker while<br />
the determination is made. These<br />
methods also potentially impact worker<br />
safety <strong>and</strong> health if medical treatment for<br />
a potential uptake is necessary. If the<br />
unknown contaminant is one of several<br />
possibilities, the investigation of the<br />
source of contamination takes longer.<br />
Positively identifying the radioactive<br />
contaminant if it is not radon or thoron<br />
progeny has several benefits. A summary<br />
of the field methods of identifying<br />
specific radionuclides is presented later in<br />
this report.<br />
Methods of minimizing the presence<br />
of radon <strong>and</strong> thoron progeny have<br />
recently come under investigation.<br />
A brief discussion of these methods is<br />
included in this report.<br />
Timed Coincidence Counting <strong>and</strong><br />
Alpha-Particle Energy<br />
Discrimination<br />
Two additional methods of radon <strong>and</strong><br />
thoron discrimination are under development.<br />
The timed coincidence method is<br />
currently in Los Alamos National<br />
Laboratory’s (LANL, the Laboratory)<br />
patenting process, <strong>and</strong> development of<br />
the supporting hardware <strong>and</strong> software<br />
continues. Alpha-particle energy discrimination<br />
applied to our st<strong>and</strong>ard<br />
detectors is also being developed. A<br />
discussion of these two methods is<br />
included later in this report.<br />
Radiological Incident Reports<br />
There are approximately 300 Radiological<br />
Incident Reports (RIRs) written<br />
for personal <strong>and</strong>/or clothing contamination<br />
incidents at LANL each year. The<br />
number of personnel <strong>and</strong>/or clothing<br />
RIRs written for contamination since our<br />
first evaluation in 1996 has not declined.<br />
Any personal or clothing contamination<br />
due to other than radon or thoron must be<br />
reported as an RIR. A simple RIR may<br />
cost $10,000 in person-hours per incident<br />
(300 incidents times $10,000 =<br />
$3,000,000/yr). Radon or thoron progeny<br />
are responsible for approximately 150<br />
contamination events each year. The<br />
determination that these contamination<br />
events are due to radon or thoron may<br />
cost as much as $2,000 each event in<br />
person-hours (150 events times $2,000<br />
per event = $300,000/yr).<br />
In two large nuclear facilities at<br />
LANL, TA-55 <strong>and</strong> CMR, the number of<br />
alarms on PCMs (personnel contamination<br />
monitors) averages several each day.<br />
The number of individual personnel<br />
surveys through the PCMs at these two<br />
facilities is several hundred each day.<br />
The alarm rates for the two facilities are<br />
in the range of less than one percent<br />
(
Health Physics<br />
tion of the isotope assists ESH-2’s<br />
response to personnel contamination<br />
events. Reducing the time to determine<br />
whether the contamination is from radon<br />
or thoron results in a person-hour cost<br />
saving equal to the percent reduction in<br />
the time required.<br />
The person-hours lost in responding to<br />
contamination alarms because of radon or<br />
thoron amounts to more than $2,000,000<br />
per year at LANL <strong>and</strong> is estimated to be<br />
more than $20,000,000 in all of DOE.<br />
A small percentage (perhaps 10 %) of<br />
those incidents of personal or clothing<br />
contamination reported in the RIRs may<br />
be caused by radon or thoron, but we do<br />
not have the capability or resources to<br />
make the determination at the lower<br />
regulatory limits for personal contamination.<br />
The potential cost savings is (300<br />
incidents/yr x 0.10 x $10,000/incident)<br />
$300,000/yr.<br />
Methods of Discriminating Radon<br />
<strong>and</strong> Thoron Progeny from other<br />
Alpha Emitters<br />
The radon <strong>and</strong> thoron interference in<br />
alpha contamination discrimination is<br />
because of the 7.68 MeV 214Po <strong>and</strong> 6.0<br />
MeV 214Po alpha-energy peaks from<br />
222Rn decay <strong>and</strong> the 8.78 MeV 212Po <strong>and</strong><br />
6.05 MeV 212Bi alpha-energy peaks from<br />
220Rn decay (see Figure 1). Radon <strong>and</strong><br />
thoron exist everywhere in our environment<br />
<strong>and</strong> become a source of confusion<br />
when personnel or their clothing are<br />
contaminated with this natural<br />
radioactivity.<br />
It is desired to be able to: (1) detect<br />
other alpha-emitting isotopes such as<br />
239Pu, 238Pu, 241Am, 238U, 235U, <strong>and</strong> 234U in the presence of interferences from<br />
radon <strong>and</strong> thoron progeny; (2) to achieve<br />
a detection limit of less than 300 dpm/<br />
100 cm2 for the isotopes of interest using<br />
a short count time; <strong>and</strong> (3) to determine if<br />
54<br />
250<br />
200<br />
150<br />
100<br />
50<br />
Alpha Spectra of Commonly Encountered Alpha Emitters<br />
Figure 1. Alpha Spectra.<br />
Gd-148 U-238<br />
U-234<br />
Th-230<br />
1 1.3 1.7 2.2 2.7 3.2 3.6 4.1 4.6 5.0 5.5 6.0 6.4 6.9 7.4 7.9 8.3 8.8 9.3 9.7 10.2 10.7<br />
MeV<br />
the contamination is one of tranuranics,<br />
uranium, or thorium sources.<br />
The typical personnel contamination<br />
response begins with a contamination<br />
alarm on a whole-body frisker such as the<br />
Eberline PCM-2 (see Figure 2). The<br />
PCM-2 uses multiple P-10 (10% methane<br />
<strong>and</strong> 90% argon) gas-flow detectors for<br />
alpha <strong>and</strong> beta particle detection. A<br />
whole-body frisk is then performed by<br />
the responding RCT (radiological control<br />
technician) using a h<strong>and</strong>-held contamination<br />
detector. A whole-body frisk using a<br />
100-cm2 detector takes 2 to 3 minutes.<br />
The spot of contamination or the article<br />
of clothing may be removed <strong>and</strong> allowed<br />
to radioactively decay for a short period<br />
of time before another measurement is<br />
made. Radon progeny have an effective<br />
half-life of approximately 30 minutes<br />
while thoron progeny have an effective<br />
half-life of approximately 10.5 hours.<br />
When the h<strong>and</strong>-held contamination<br />
detector shows no detectable activity <strong>and</strong><br />
the PCM-2 does not alarm, then the<br />
Pu-239<br />
Pu-238<br />
Am-241<br />
Po-218<br />
Bi-212<br />
Po-214<br />
Figure 2. Eberline PCM-2.<br />
Po-212
activity is determined to have been radon<br />
or thoron progeny.<br />
Alpha-to-Beta Ratio using the<br />
PCM-2<br />
The determination of the alpha-to-beta<br />
ratio using the PCM-2’s indication <strong>and</strong><br />
the h<strong>and</strong>-held contamination monitor<br />
(such as the Eberline E-600/SHP-380)<br />
gives further confidence that the contaminant<br />
is radon or thoron progeny if the<br />
ratio is approximately 1:2. However, this<br />
method is not absolute because a mixture<br />
of alpha <strong>and</strong> beta emitters other than<br />
radon or thoron progeny could have been<br />
encountered. The uranium isotopes also<br />
have a similar alpha-to-beta ratio.<br />
A complication arises in comparing<br />
the level of contamination reported by the<br />
PCM-2 <strong>and</strong> the level determined with<br />
h<strong>and</strong>-held survey instruments. The 34<br />
detectors on the PCM-2 range in active<br />
surface area from about 150 cm2 to over<br />
600 cm2 . The h<strong>and</strong>-held survey instruments’<br />
active surface areas range from<br />
15.5 cm2 to 100 cm2 . In many cases the<br />
surface area of the spot of contamination<br />
is greater than the active surface area of<br />
the h<strong>and</strong>-held instrument. If the spot of<br />
contamination is larger than the active<br />
surface area of the h<strong>and</strong>-held instrument,<br />
then that instrument will indicate a level<br />
of contamination less than that reported<br />
by the PCM-2 by a ratio of the<br />
instrument’s active surface area divided<br />
by the area of the spot of contamination.<br />
If a 15.5-cm2 detector is used to monitor<br />
an area of contamination of 300 cm2 ,<br />
then the h<strong>and</strong>-held instrument will<br />
indicate 1/20 (15.5-cm2 divided by 300<br />
cm2 ) of the level reported by the PCM-2.<br />
Alpha-to-Beta Ratio using<br />
H<strong>and</strong>-held Instruments<br />
The primary h<strong>and</strong>-held instruments<br />
used by the technicians responding to an<br />
indication of personnel or clothing<br />
contamination are the Ludlum 139, with<br />
an air proportional alpha-only detector,<br />
<strong>and</strong> the Eberline E-600, with the<br />
SHP-380 detector or the SHP-330<br />
detector. See Figures 3–6. The Ludlum<br />
139 is an early 1980s generation instrument<br />
with a detector active surface area<br />
of 76 cm 2 . The Eberline E-600 is a mid<br />
1990s generation instrument. The SHP-<br />
380 <strong>and</strong> SHP-330 are used with the<br />
E-600 for alpha <strong>and</strong> beta particle detection.<br />
The SHP-380 uses ZnS (zinc<br />
sulfide-silver actvated) bonded to a<br />
plastic scintillator <strong>and</strong> has an active<br />
surface area of 100 cm 2 . The SHP-330 is<br />
a sealed gas-proportional detector using a<br />
mixture of argon <strong>and</strong> CO 2 <strong>and</strong> has an<br />
active surface area of 15.5 cm 2 . Since the<br />
Ludlum 139 is an alpha-only instrument,<br />
it cannot be used to determine the alphato-beta<br />
ratio. In addition to the differences<br />
in detector active surface areas<br />
described earlier, there is another<br />
confounding problem in the alpha <strong>and</strong><br />
Figure 3. Ludlum 139<br />
Figures 3-6. The primary h<strong>and</strong>-held instruments used by technicians.<br />
Health Physics<br />
beta particle detection efficiencies of the<br />
different types of detectors. The different<br />
detectors are typically calibrated with<br />
similar radionuclides <strong>and</strong> will indicate<br />
correctly when used to monitor radionuclides<br />
with energies similar to those used<br />
for the calibration. However, the different<br />
detectors have different alpha <strong>and</strong> beta<br />
energy versus efficiency slopes. Therefore,<br />
the different types of detectors will<br />
not indicate the same alpha-to-beta ratios<br />
when measuring the same spot of<br />
contamination.<br />
Figure 4. Eberline E-600<br />
Figure 5. SHP-330 Figure 6. SHP-380<br />
55
Health Physics<br />
Recounting the Sample after a<br />
Short Decay Period to Confirm<br />
Short-lived or Long-lived Isotopes<br />
Any of the instruments described<br />
earlier may be used to recount the sample<br />
or spot of contamination. If the contamination<br />
is from radon, then this method<br />
will work; however, it does require<br />
several minutes for the radon progeny to<br />
decay to less than detectable limits.<br />
Radon progeny have an effective half-life<br />
of approximately 30 minutes (see Figure<br />
7). The determination that radon progeny<br />
is present does not ensure there are no<br />
detectable radionuclides of interest such<br />
as plutonium. Unfortunately, we also<br />
have to deal with thoron progeny on<br />
occasion. Thoron progeny have an<br />
effective half-life of approximately 10.5<br />
hours (see Figure 8); so, the option of<br />
allowing a period of time for decay does<br />
not work if a person is contaminated with<br />
thoron progeny. If a sample of the<br />
contamination can be taken, then it can<br />
be counted locally using an alpha/beta<br />
sample counter such as the Ludlum 2929<br />
with the 43-10-1 ZnS/plastic scintillator<br />
detector. See Figure 9 below.<br />
Figure 9. Ludlum 2929.<br />
Alpha, Beta, <strong>and</strong> Gamma<br />
Spectroscopy<br />
Alpha, beta, or gamma spectroscopy<br />
can sometimes be used to identify the<br />
specific isotopes.<br />
Alpha-Particle Emitting Isotopes<br />
Figure 10, Radionuclides of Interest,<br />
indicates the relative energies of some<br />
typical alpha particle emitters. Attenuation<br />
of the alpha particle reduces the<br />
measure alpha energy <strong>and</strong> spreads the<br />
spectrum, making energy resolution of<br />
the various peaks more difficult.<br />
56<br />
Isotope &<br />
Half-life<br />
222 Rn / 3.823 d<br />
218 Po / 3.05 m<br />
214 Pb / 26.8 m<br />
214 Bi / 19.7 m<br />
214 Po / 164 us<br />
210 Tl / 1.3 m<br />
210 Pb / 21 y<br />
210 Bi / 5.01 d<br />
210 Po / 138.4 d<br />
206 Tl / 4.19 m<br />
Figure 7. Radon Decay Chain.<br />
Figure 8. Thoron Decay Chain.<br />
Isotope &<br />
Half-life<br />
239 Pu<br />
24,100 years<br />
238 Pu<br />
87.7 years<br />
241 Am<br />
432.7 years<br />
Isotope &<br />
half-life<br />
220 Rn 55s (Thoron)<br />
216 Po / 0.15 s<br />
212 Pb / 10.64 h<br />
212 Bi / 60.6 m<br />
212 Po / 304 ns<br />
208 Tl / 3.10 m<br />
α Energy<br />
(MeV) & abundance<br />
5.105 @ 11.5%<br />
5.143 @ 15.1%<br />
5.155 @ 73.3%<br />
5.358 @ 0.1%<br />
5.456 @ 28.3%<br />
5.499 @ 71.6%<br />
5.388 @ 1.4%<br />
5.443 @ 12.8%<br />
5.486 @ 85.2%<br />
Figure 10. Radionuclides of Interest.<br />
222 Rn (radon) decay from 238 U<br />
α Energy<br />
(MeV) & abundance<br />
5.49 @ 100%<br />
6.00 @ 100%<br />
No<br />
negligible<br />
7.69 @ 100%<br />
No<br />
negligible<br />
negligible<br />
5.305 @ 100%<br />
No<br />
220 Rn (thoron) decay from 232 Th (thorium)<br />
αα Energy<br />
(MeV) & abundance<br />
6.29 @ 100%<br />
6.78 @ 100%<br />
No<br />
6.05 @ 25%<br />
6.09 @ 10%<br />
8.78 @ 100 %<br />
No<br />
ββ Energy<br />
(MeV) & abundance<br />
No<br />
0.33 @ 0.019%<br />
0.65 @ 50%<br />
0.71 @ 40%<br />
0.98 @ 6%<br />
1.00 @ 23%<br />
1.51 @ 40%<br />
3.26 @ 19%<br />
β Energy<br />
(MeV) & abundance<br />
Radionuclides of Interest<br />
β Energy<br />
(MeV) & abundance<br />
No<br />
No<br />
No<br />
No<br />
No<br />
0.346 @ 81%<br />
0.586 @ 14%<br />
1.55 @ 5%<br />
2.26 @ 55%<br />
No<br />
1.28 @ 25%<br />
1.52 @ 21%<br />
1.80 @ 50%<br />
γ Energy<br />
(MeV) & abundance<br />
0.550 @ 0.07%<br />
negligible<br />
0.239 @ 47%<br />
0.300 @ 3.2%<br />
0.040 @ 2%<br />
0.727 @ 7%<br />
1.620 @ 1.8%<br />
negligible<br />
0.511 @ 23%<br />
0.583 @ 86%<br />
0.860 @ 12%<br />
2.614 @ 100%<br />
212 212 208<br />
Bi decays 64% of the time to Po through beta decay <strong>and</strong> 36% of the time to Tl through<br />
alpha decay.<br />
No<br />
1.3 @ 25%<br />
1.9 @ 56%<br />
2.3 @ 19%<br />
0.016 @ 85%<br />
0.061 @ 15%<br />
1.161 @ 100%<br />
No<br />
1.571 @ 100%<br />
γ Energy<br />
(MeV) & abundance<br />
0.510 @0.07%<br />
negligible<br />
0.295 @ 19%<br />
0.352 @ 36%<br />
0.609 @ 47%<br />
1.120 @ 17%<br />
1.764 @ 17%<br />
0.799 @ 0.014%<br />
0.296 @ 80%<br />
0.795 @ 100%<br />
1.31 @ 21%<br />
0.047 @ 4%<br />
negligible<br />
negligible<br />
negligible<br />
γγ Energy<br />
(MeV) & abundance<br />
0.052 @0.02%<br />
0.129 @0.0062%<br />
0.375 @ 0.0015%<br />
0.414 @ 0.0015%<br />
Uranium x-ray 0.014 @ 4.4%<br />
0.044 @ 0.039%<br />
0.100 @ 0.0075%<br />
0.153 @ 0.0013%<br />
Uranium x-ray 0.014 @ 11.6%<br />
0.026 @ 2.4%<br />
0.033 @ 0.1%<br />
0.060 @ 35.9%<br />
Neptunium x-ray 0.014 @ 43%
Alpha Spectroscopy<br />
Alpha spectroscopy is performed in<br />
the field using the SAIC AP-2 h<strong>and</strong>-held<br />
instrument (see Figure11). This instrument<br />
has an alpha energy resolution full<br />
width at half-maximum peak height<br />
(FWHM) of about 200 keV. If the alpha<br />
emitters on the spot of contamination are<br />
not attenuated, then the AP-2 can resolve<br />
the alpha energies well enough to<br />
distinguish radon progeny alpha emitters<br />
from the other alpha emitters. However,<br />
such things as clothing <strong>and</strong> hair do<br />
attenuate the alpha energies <strong>and</strong> cause the<br />
spectrum on the AP-2 to be smeared into<br />
the lower energy range. See figures at<br />
right.<br />
The AP-2’s detector is a 50-mm diameter<br />
ion-implanted silicon detector with a<br />
honeycomb-like metal cover that collimates<br />
the alpha particles to improve the<br />
instrument’s alpha particle energy<br />
resolution (see Figure 11). The liquid<br />
crystal display (LCD) on the face of the<br />
instrument displays either a bar graph<br />
with count rate indication or a real-time<br />
alpha spectrum.<br />
Two AP-2s are in use at Los Alamos,<br />
one at TA-55 <strong>and</strong> one at CMR. In<br />
general, we have had success in rapidly<br />
responding to contamination alarms <strong>and</strong><br />
determinging the true cause of contamination<br />
with these instruments. We are<br />
developing our own instruments to<br />
address the AP-2’s problems of high<br />
initial cost, ergonomics, <strong>and</strong> lack of<br />
spectrum processing ability. The prototype<br />
of this new instrument uses the<br />
Rainbow MCA (multi-channel analyzer,<br />
described elsewhere in this report)<br />
connected to a solid-state silicon detector.<br />
Figure 11. SAIC AP-2 Detector, front <strong>and</strong> back views.<br />
Health Physics<br />
57
Health Physics<br />
Beta Spectroscopy<br />
Beta spectroscopy is not routinely<br />
performed in the field, but it has some<br />
potential for identifying the radioactive<br />
contaminant. At present, there are no<br />
portable-low-cost beta spectroscopy<br />
systems commercially available. We are<br />
developing a portable beta spectroscopy<br />
system using a 75-mm-diameter plastic<br />
scintillator coupled to a 75-mm-diameter<br />
photo-multiplier tube (PMT). The first<br />
prototype uses the Rainbow MCA. See<br />
Figures 12 <strong>and</strong> 13 on the right.<br />
Beta-Particle Emitting Isotopes<br />
These beta spectra were taken with a<br />
plastic scintillator similar to the one<br />
pictured (see Figure 12). The short-lived<br />
progeny of uranium-238 have a beta<br />
energy maximum (e-max) of 193 keV<br />
(thous<strong>and</strong> electron volts) <strong>and</strong> 2.2 MeV<br />
(million electron volts). Tc-99 has a beta<br />
energy e-max of 292 keV. These spectra<br />
indicate that a plastic scintillator can<br />
discriminate between those beta energies.<br />
See Figures 14 <strong>and</strong> 15 at right.<br />
58<br />
Figure 12. Plastic scintillator <strong>and</strong> PMT.<br />
Figure 14. Beta radiation from U-238 progeny.<br />
Figure 15. Beta radiation from Tc-99.<br />
Figure 13. Rainbow MCA.
Gamma Spectroscopy<br />
We are performing gamma spectroscopy<br />
in the field using the HPI Rainbow<br />
MCA <strong>and</strong> the 3-inch-diameter by<br />
3-inch-thick sodium iodide detector.<br />
The Rainbow MCA is a battery-powered<br />
1024 channel analyzer with an LCD<br />
display. The instrument can store<br />
12 spectra <strong>and</strong> has the capability to<br />
subtract background spectra. This<br />
instrument has a gamma energy resolution<br />
(FWHM) of about 10 keV. The<br />
gamma emitters’ energies may be<br />
attenuated by various materials, but the<br />
gamma energies are not shifted as is the<br />
case with the alpha-spectroscopy<br />
systems. See Figure 16 at right.<br />
Gamma Emitting Isotopes<br />
Figure 17 shows the two distinct<br />
gamma energies from niobium-94 of<br />
702 keV <strong>and</strong> 871 keV on the right side of<br />
the spectrum. Barium-133 has several<br />
distinct gamma energies at 31, 80, 276,<br />
<strong>and</strong> 356 keV. The specific gamma<br />
radiation energies of radon <strong>and</strong> thoron<br />
progeny may be used to identify those<br />
isotopes. However, the weight of the<br />
detector, the ergonomics of its shape, <strong>and</strong><br />
the lower intrinsic efficiency of all<br />
gamma detectors have limited its<br />
usefulness in responding to contamination<br />
events.<br />
Timed Coincidence Counting<br />
Applied to Radon <strong>and</strong> Thoron<br />
Discrimination<br />
Timed coincidence counting can be<br />
applied to the subtraction of counts from<br />
radionuclides when the immediate<br />
progeny of a radionuclide has a very<br />
short half-life.<br />
The table of radon decay indicates that<br />
214Po is an alpha-particle emitter with a<br />
half-life of 164 µs (micro-seconds).<br />
If the instrument detects radioactive<br />
decay of the parent, in this case 214Bi, followed by the radioactive decay of its<br />
progeny 214Po within a very short time,<br />
then we can have a very high degree of<br />
confidence that the two radioactive<br />
decays were part of the radon decay chain<br />
<strong>and</strong> were not due to other radioactivity.<br />
In a typical distribution of radon progeny,<br />
Figure 16. 3X 3 Nal detector.<br />
Figure 17. Gamma radiation from Nb-94 <strong>and</strong> Ba-133.<br />
214Po accounts for about 90% of the<br />
alpha activity. 214Bi accounts for about<br />
half of the beta activity. If we subtract<br />
these two activities from the gross radonprogeny<br />
activity, then practically no<br />
alpha activity is left to initiate an alpha<br />
alarm. Typically, beta activity from radon<br />
progeny is well below the alarm setpoints<br />
of our contamination monitors.<br />
The table of thoron decay indicates<br />
that 212Po is an alpha-particle emitter<br />
with a half-life of 304 ns (nano-seconds).<br />
Its immediate parent is 212Bi. The decay<br />
scheme of thoron is different than the<br />
radon decay scheme. 212Bi decays by<br />
beta particle emission 64% of the time to<br />
212Po, <strong>and</strong> 36% of the time by alpha<br />
particle decay to 208Tl. This difference in<br />
decay schemes allows us to subtract all of<br />
the alpha activity <strong>and</strong> about 80% of the<br />
beta activity from thoron when we detect<br />
the coincidence of 212Bi decay followed<br />
by the alpha decay of 212Po. Health Physics<br />
If we set up our timed coincidence<br />
circuit to count an alpha particle following<br />
a beta particle within a window of<br />
200 µs as a coincident radon progeny,<br />
then what is our confidence that we will<br />
not falsely count true activity as radon<br />
progeny? First, our typical radon <strong>and</strong><br />
thoron false alarms have count rates in<br />
the range of 500 to 3,000 counts per<br />
minute. If we postulate an extreme case<br />
where we have 25,000 counts per minute<br />
of true alpha activity <strong>and</strong> 25,000 counts<br />
per minute of true beta activity, then the<br />
false coincident count rate will happen<br />
4% of the time. The instrument would<br />
simply report 96% of the true activity. If<br />
the activity were in the range of 2,500<br />
counts per minute for both true alpha <strong>and</strong><br />
true beta activity, then the instrument<br />
would report 99.6% of the true activity<br />
after falsely subtracting the radon<br />
coincidence. On the other h<strong>and</strong>, when the<br />
activity is due to radon progeny, the<br />
59
Health Physics<br />
instrument would subtract all of the radon<br />
progeny <strong>and</strong> report no activity.<br />
The application of the timed coincidence<br />
method of radon <strong>and</strong> thoron<br />
discrimination requires both hardware<br />
<strong>and</strong> software development. Faster<br />
amplifiers are needed to support the<br />
304-ns decay-time coincidence in the<br />
thoron decay chain. Software is needed to<br />
provide the counting <strong>and</strong> subtraction<br />
logic. The timed coincidence method can<br />
be applied to any detector capable of<br />
detecting <strong>and</strong> discriminating both alpha<br />
<strong>and</strong> beta particle emissions. The timed<br />
coincidence method is in the<br />
Laboratory’s patenting process at the<br />
present time, <strong>and</strong> the development of<br />
the supporting hardware <strong>and</strong> software<br />
continues.<br />
Alpha-Particle Energy<br />
Discrimination<br />
Some h<strong>and</strong>-held instruments, such as<br />
the Harwell A92A (Figure 18) <strong>and</strong> the<br />
Eberline E-600/SHP-380 <strong>and</strong> E-600/<br />
SHP-330 (Figure 5), may be used to<br />
discriminate the different alpha particle<br />
energies. Stationary personnel contamination<br />
monitors, such as the Eberline<br />
PCM-2 (Figure 2) <strong>and</strong> HFM-7 (Figure<br />
21, H<strong>and</strong> <strong>and</strong> Foot Monitor), may also be<br />
used to discriminate the different alpha<br />
particle energies.<br />
Harwell A92A<br />
The A92A uses a silicon solid-state<br />
detector with a surface area of 9 square<br />
inches (75-mm by 75-mm square) to<br />
detect alpha emitters. The A92A does not<br />
have a MCA, but uses an upper level<br />
discriminator that eliminates the<br />
instrument’s response to alpha energies<br />
above the upper level cutoff. The upper<br />
level discriminator is typically set just<br />
above the highest alpha expected to be<br />
encountered. The 5.8 MeV alpha particle<br />
energy from 244Cm may be used effectively<br />
to set the instrument’s upper level<br />
cutoff. By eliminating alpha energy<br />
response above 5.8 MeV, more than 90%<br />
of the typical interference from radon<br />
progeny is eliminated from the<br />
instrument’s response. Also, if the<br />
contamination is from radon progeny<br />
60<br />
only, then using the upper level discriminator<br />
on the A92A limits its response to<br />
only the 6.00 MeV alpha energy from<br />
214Po, which has a 3 minute half-life.<br />
This allows for a much more rapid<br />
determination that the activity is radon by<br />
allowing for the decay of this single<br />
radon progeny isotope. See Figures 18<br />
<strong>and</strong> 19 below.<br />
Our success with the A92A has not<br />
been as good as we had anticipated<br />
because of the electronics that were<br />
designed in the late 1980s. The lack of a<br />
response time switch <strong>and</strong> an integrate<br />
mode has prevented this instrument from<br />
meeting our expectations. We plan to use<br />
the instrument’s large area detector, the<br />
instrument’s best feature, in two prototypes.<br />
One prototype uses the Eberline E-<br />
600 to provide two levels of alpha<br />
particle energy discrimination, <strong>and</strong> one<br />
uses the Rainbow MCA to provide an<br />
alpha energy spectrum. The A92A’s<br />
detector with a 56-cm2 active surface<br />
area is substantially greater than the<br />
15.5-cm2 active surface area of the<br />
SAIC AP-2.<br />
Figure 18. Harwell A92A.<br />
Eberline SHP-380<br />
The SHP-380 was described earlier<br />
in this report (page 56). Its ability to<br />
discriminate alpha particle energies was<br />
unacceptable because of light scattering<br />
in the ZnS phosphor <strong>and</strong> in the detector<br />
case. This light scattering spreads the<br />
energy response of the detector over too<br />
broad a range to discriminate the different<br />
alpha particle energies.<br />
Eberline SHP-330<br />
The SHP-330 was described earlier in<br />
this report (page 56). Its ability to<br />
discriminate alpha particle energies was<br />
unacceptable because of the thickness of<br />
the detector entrance window. Alpha<br />
particles entering the detector window at<br />
an angle are attenuated more than alpha<br />
particles entering the window perpendicularly.<br />
This spreads the energy<br />
response of the detector over too broad a<br />
range.<br />
Figure 19. A92A Detector.
Eberline PCM-2 <strong>and</strong> HFM-7<br />
The PCM-2 was described earlier in<br />
this report (page 55). The HFM-7 is<br />
similar in operation to the PCM-2, but is<br />
used to detect contamination on the h<strong>and</strong>s<br />
<strong>and</strong> feet (bottom of the shoes) of personnel.<br />
We are investigating the possibility<br />
of modifying the calibration procedure of<br />
one of these instruments to allow it to<br />
discriminate alpha particles of different<br />
energies. These instruments have two<br />
discriminator levels: the low-level is for<br />
beta detection, <strong>and</strong> the upper-level is for<br />
alpha detection. After we have modified<br />
the instrument, the lower discriminator<br />
level will be for the alpha particles of less<br />
than 6.00 MeV, <strong>and</strong> the upper discriminator<br />
level will be for those alpha emitters<br />
of 6.00 MeV <strong>and</strong> higher.<br />
Figure 20. Eberline HFM-7.<br />
Once we have proven the ability of the<br />
PCM-2s <strong>and</strong> HFM-7s to discriminate<br />
alpha particle energies, the users will<br />
have two options. First, they can have<br />
their instruments recalibrated to detect<br />
alpha only, but to discriminate between<br />
radon or thoron progeny <strong>and</strong> the isotopes<br />
of interest. Second, the PCM-2s <strong>and</strong><br />
HFM-7s can be modified to have three<br />
discriminator levels—the lowest for beta<br />
particle detection, the middle for alpha<br />
particle emitters of interest, <strong>and</strong> the<br />
highest for radon <strong>and</strong> thoron progeny.<br />
The first option is the cheapest, for it will<br />
only be a matter of scheduling the<br />
recalibration. The second option will cost<br />
approximately $10K for a PCM-2 <strong>and</strong><br />
$5K for an HFM-7, but will give the user<br />
the most options on how the instrument<br />
can be used.<br />
Ion Generators to Minimize Radon<br />
<strong>and</strong> Thoron Interference<br />
Ion generators are being investigated<br />
to minimize radon <strong>and</strong> thoron progeny<br />
interference. In the introduction, we<br />
stated that radon <strong>and</strong> thoron progeny<br />
become attached onto plastic <strong>and</strong> other<br />
synthetic materials through electrostatic<br />
attraction. If the electrostatic charge on<br />
materials can be reduced or eliminated,<br />
then much less radon <strong>and</strong> thoron progeny<br />
will become attached to those materials.<br />
By applying techniques used in electronics<br />
manufacturing <strong>and</strong> explosives<br />
manufacturing, we can reduce those<br />
electrostatic charges. Electrostatic<br />
charges on plastics <strong>and</strong> other synthetic<br />
materials can build up to several thous<strong>and</strong><br />
volts. These electrostatic charges<br />
typically exist as separate areas of<br />
positive <strong>and</strong> negative charges. Ion<br />
generators neutralize these areas of<br />
positive <strong>and</strong> negative charges by supplying<br />
many thous<strong>and</strong>s of positive <strong>and</strong><br />
negative ions to the areas of charge. This<br />
causes the separate areas of charge to<br />
blend together. With no electrostatic<br />
charges to attract fresh radon or thoron<br />
progeny, a short decay time will reduce<br />
the radon <strong>and</strong> thoron activities to much<br />
lower levels. If the plastic or synthetic<br />
material is treated with the ion generator<br />
before they attract radon or thoron<br />
progeny, then we can achieve the same<br />
final result without waiting for decay<br />
Health Physics<br />
time. For most plastic <strong>and</strong> synthetic<br />
materials, this neutralization of electrostatic<br />
charge will last up to two hours<br />
before the materials again build up<br />
electrostatic charges.<br />
Conclusions<br />
In most cases of personnel contamination,<br />
it is possible to rapidly discriminate<br />
between radon <strong>and</strong> thoron progeny <strong>and</strong><br />
other alpha-emitters using h<strong>and</strong>-held<br />
detectors.<br />
It is not possible for the present<br />
automatic personnel contamination<br />
monitors to discriminate between radon<br />
<strong>and</strong> thoron progeny <strong>and</strong> other alphaemitters.<br />
Using more sophisticated electronics<br />
in the personnel contamination monitors<br />
may allow for discrimination of the<br />
different alpha energies. This could make<br />
the personnel contamination monitors<br />
much more effective in discriminating<br />
between radon <strong>and</strong> thoron progeny <strong>and</strong><br />
other alpha emitters.<br />
Ion generators have some potential to<br />
minimize the problems associated with<br />
radon <strong>and</strong> thoron progeny becoming<br />
attached to personnel <strong>and</strong> clothing.<br />
Field identification of the specific<br />
isotopes will require more sophisticated<br />
portable detectors. However, those<br />
portable detectors do not need to be<br />
expensive <strong>and</strong> the operators do not need<br />
extensive training if adequate procedures<br />
are developed.<br />
References<br />
Evans, R. D., “Engineers’ Guide to the<br />
Elementary Behavior of Radon Daughters”<br />
(Health Physics, Pergamon Press,<br />
1969).<br />
Hoover, M. D., personal communication<br />
(2000).<br />
Knoll, G. F., “Radiation Detection <strong>and</strong><br />
Measurement” (John Wiley <strong>and</strong> Sons,<br />
New York, 2000).<br />
10 CFR 835 “Occupational Radiation<br />
Protection”<br />
Rasmussen, R., personal communication<br />
(2000).<br />
61
Studies to Date<br />
<strong>FY</strong>95<br />
Pilot Program for the Risk-Based<br />
Surveillance of Lung Cancer<br />
A Polymeric Barrier Monitor to Protect<br />
Workers<br />
<strong>Evaluation</strong> of a Real-Time Beryllium<br />
Detection Instrument<br />
<strong>FY</strong>96<br />
A Polymeric Barrier Monitor to Protect<br />
Workers<br />
<strong>Evaluation</strong> of Commercial Air-Purifying<br />
Respirator Cartridges for Protection<br />
against Vapors of Nitric Acid<br />
<strong>FY</strong>97<br />
Reusability of Organic Vapor Air-<br />
Purifying Respirator Cartridges<br />
FRHAM-TEX II Cool Suit Material<br />
Testing for Water (<strong>and</strong> therefore,<br />
Tritium) Protection<br />
A Polymeric Barrier Monitor to Protect<br />
Workers<br />
<strong>FY</strong>98<br />
Pressure-Deformation Correlation in<br />
Waste Containers (PDCWC)<br />
Reusability of Organic Vapor Air-<br />
Purifying Respirator Cartridges<br />
Industrial Hygiene<br />
<strong>Development</strong> of Methods for Determining Physiochemical Properties of<br />
Respirable Beryllium Aerosol Materials Associated with Chronic Beryllium<br />
Disease<br />
<strong>FY</strong>99<br />
<strong>Development</strong> of Methods for Determining<br />
Physiochemical Properties of<br />
Respirable Beryllium Aerosol Materials<br />
Associated with Chronic Beryllium<br />
Disease<br />
Pressure Effects <strong>and</strong> Deformation of<br />
Waste Containers<br />
Service Life Modeling for Using Organic<br />
Vapor Air-Purifying Respirator<br />
Cartridges <strong>and</strong> Setting Change-Out<br />
Schedules<br />
<strong>FY</strong>00<br />
<strong>Development</strong> of Methods for Determining<br />
Physiochemical Properties of<br />
Respirable Beryllium Aerosol Materials<br />
Associated with Chronic Beryllium<br />
Disease<br />
Service Life Modeling for Using LANL<br />
Organic Vapor Air-Purifying Respirator<br />
Cartridges <strong>and</strong> Setting Change-Out<br />
Schedules<br />
Summary of Progress<br />
Industrial hygiene <strong>and</strong> safety projects<br />
have produced 31 professional papers <strong>and</strong><br />
presentations since the <strong>TDEA</strong> program<br />
started in <strong>FY</strong>95. One industrial hygiene<br />
study was funded in <strong>FY</strong>01. That study<br />
alone has resulted in 6 professional<br />
papers <strong>and</strong> presentations, with 2 of the<br />
papers published in peer reviewed<br />
journals. The project is a comprehensive<br />
study of respirable beryllium, which has<br />
become very important to workers from<br />
the former Cold War weapons complex.<br />
The study has resulted in collaboration<br />
among four LANL organizations <strong>and</strong><br />
many organizations external to the Lab,<br />
including Lovelace Respiratory Research<br />
Institute, Brush Wellman Inc., <strong>and</strong> the<br />
Institut de Protection et de Surete<br />
Nucleaire.
Industrial Hygiene<br />
<strong>Development</strong> of Methods for Determining Physicochemical Properties of<br />
Respirable Beryllium Aerosol Materials Associated with Chronic Beryllium Disease<br />
Principal Investigators: Ronald C. Scripsick, Industrial Hygiene <strong>and</strong> Safety (ESH-5) <strong>and</strong> Kendall J. Hollis, Materials <strong>Technology</strong>:<br />
Metallurgy (MST-6)<br />
Investigators: Gregory A. Day, Mary Ann Hill, <strong>and</strong> R. Scott Lillard (MST-6), Robert M. Dickerson (MST-8), Eric J. Peterson (MST-STC),<br />
Aleks<strong>and</strong>r B. Stefaniak (ESH-5), Yol<strong>and</strong>a E. Valdez (B-5), Mark D. Hoover, Lovelace Respiratory Research Institute, Albuquerque,<br />
NM (LRRI), Michael S. Kent, Brush Wellman Inc., Elmore, OH, Marie-Hélène Hengé-Napoli, Institut de Protection et de Sûreté<br />
Nucléaire, Cedex, France<br />
Funding: <strong>FY</strong>99, <strong>TDEA</strong> - $88K; MST-6 $90K; <strong>FY</strong>00, <strong>TDEA</strong> - $89K; ESH-5 - $40K (unburdened); MST-6 - $40K (unburdened); <strong>FY</strong>01,<br />
<strong>TDEA</strong> - $100K; ESH-5 - $40K (unburdened); MST-6 - $120K (unburdened)<br />
Introduction<br />
Traditionally, beryllium (Be) aerosol<br />
mass concentration has been used to<br />
develop exposure controls for Be facilities.<br />
Recent epidemiological studies <strong>and</strong><br />
exposure assessments (Kr97, Ei98)<br />
indicate investigation into exposure<br />
indices other than Be aerosol mass<br />
concentration may be needed to control<br />
exposures to levels that assure protection.<br />
<strong>Development</strong> of such indices requires<br />
information on the physical <strong>and</strong> chemical<br />
properties of Be aerosol exposures that<br />
may affect occurrence of disease. The<br />
objective of this study is to adapt methods<br />
for evaluating these properties in<br />
actinides <strong>and</strong> other hazardous materials to<br />
evaluations of respirable Be aerosol<br />
materials.<br />
Epidemiological studies find that<br />
exposure to insoluble Be aerosol materials<br />
is associated with development of<br />
chronic beryllium disease (CBD) in<br />
workers (Ei83, Kr93, St96, Kr96, Kr97).<br />
At the cellular <strong>and</strong> molecular level, it is<br />
thought that a dissolved Be species is the<br />
Be input to the immunopathologic<br />
process that results in disease (Ne93).<br />
This project is focusing on physical <strong>and</strong><br />
chemical properties of beryllium particles<br />
that control conversion from particle to<br />
dissolved species. The study hypothesis is<br />
that the rate of dissolution <strong>and</strong> dissolution<br />
lifetime of particles deposited in the<br />
alveolar region of the lung may influence<br />
the disease process <strong>and</strong> that exposure<br />
indices based on physicochemical<br />
properties that govern dissolution may<br />
lead to protection of workers.<br />
64<br />
This is an annual report of progress for<br />
the third <strong>and</strong> final year of the project. In<br />
fiscal year (<strong>FY</strong>) 2001, progress was made<br />
in two areas: 1) development of cellular<br />
methods for determining dissolution rate<br />
constants (k) for Be, <strong>and</strong> 2) development<br />
of a framework for data interpretation.<br />
Progress made in each of these areas is<br />
described below.<br />
<strong>Development</strong> of cellular methods<br />
for determining dissolution rate<br />
constants (k) for Be<br />
The intracellular dissolution behavior<br />
of insoluble particles is often modeled<br />
using macrophage cells maintained in<br />
vitro (Kreyling et al., 1990; Eidson et al.,<br />
1991). From the dissolution data, the<br />
chemical dissolution rate constant, k,<br />
with units of g/cm2-day, can be determined<br />
<strong>and</strong> used to model the dissolution<br />
behavior of a given material.<br />
The appropriate in vitro compartment<br />
within which to measure the dissolved<br />
mass of analyte of interest is not well<br />
established. Kreyling et al. (1990)<br />
investigated the in vitro dissolution of<br />
cobalt oxide particles <strong>and</strong> found that the<br />
dissolved species diffused out of the cell.<br />
This observation indicates that the mass<br />
of particle dissolved should most<br />
appropriately be measured in the extracellular<br />
culture medium. In contrast,<br />
Eidson et al. (1991) observed that<br />
dissolved beryllium produced by dissolution<br />
of beryllium particles in vitro<br />
accumulated within cells until a cytotoxic<br />
concentration was reached, then released<br />
to extracellular media upon cell death.<br />
These data suggest that the mass of<br />
dissolved analyte should be measured for<br />
the intracellular compartment only to<br />
avoid overestimating the value of k.<br />
Based on these conflicting data, an<br />
approach was devised to compare both<br />
methods in our in vitro studies of the<br />
dissolution behavior of respirable<br />
beryllium aerosol particles.<br />
Prior to undertaking full-scale studies,<br />
we reviewed the methods of Kreyling et<br />
al. <strong>and</strong> Eidson et al. Their techniques<br />
were practiced <strong>and</strong>/or modified based on<br />
results of our own pilot studies <strong>and</strong> a<br />
methodology, depicted in Figure 1,<br />
capable of comparing the results obtained<br />
from the two in vitro approaches. For the<br />
purposes of our studies, the method based<br />
on Eidson et al. (1991) is referred to as<br />
sequential sacrifice because the dissolution<br />
rate constant was calculated from the<br />
mass of dissolved beryllium within the<br />
macrophage cell phagolysosome at<br />
predetermined harvest-time points. The<br />
sequential sacrifice method entails dosing<br />
a number of tissue culture dishes containing<br />
macrophage cells <strong>and</strong> harvesting a<br />
subset of dishes at fixed time points until<br />
all dishes have been harvested. The<br />
method based on Kreyling et al. (1990) is<br />
referred to as serial decanting because the<br />
dissolution rate constant was determined<br />
from the mass of dissolved beryllium in<br />
the extracellular culture medium at<br />
predetermined time points. In the serial<br />
decanting method, a set number of tissue<br />
culture dishes are dosed <strong>and</strong> at fixed time<br />
points the culture medium from each dish<br />
was removed, then replaced with fresh<br />
culture medium, maintaining the same<br />
number of dishes throughout the study
period. Sacrificed tissue culture dishes<br />
<strong>and</strong> cell culture media were then subject<br />
to a series of fractionation steps, described<br />
below, to separate dissolved from<br />
particulate beryllium so that k could be<br />
calculated from the dissolution data.<br />
Several techniques were developed for<br />
this methodology, including 1) preparation<br />
of liquid-beryllium particle dosing<br />
suspensions, 2) dose delivery, 3) maintenance<br />
of cell cultures for a period<br />
sufficient for quantifiable dissolution to<br />
occur, <strong>and</strong> 4) fractionation of particulate<br />
from dissolved beryllium within the cell<br />
<strong>and</strong> in the culture media:<br />
Preparation of liquid-beryllium<br />
particle dosing suspensions. Techniques<br />
were developed to suspend beryllium<br />
particles in liquid. All possible combinations<br />
of beryllium particles (beryllium<br />
metal or beryllium oxide), container<br />
(plastic centrifuge tube or glass scintillation<br />
vial), <strong>and</strong> liquid matrix (water or<br />
phosphate buffered saline [PBS]) were<br />
tested with the goal of finding an<br />
optimum set of variables for suspension<br />
preparation. Results indicated that<br />
beryllium oxide could be suspended in<br />
water or PBS, <strong>and</strong> that beryllium metal<br />
could only be suspended in PBS using a<br />
glass scintillation vial to prevent the loss<br />
of particles to the container wall.<br />
Dose delivery technique. Gravimetric<br />
determination of a mass of powder is<br />
often used to dose cell cultures with a<br />
known amount of beryllium (Andre et al.,<br />
1987; Eidson et al., 1991) in dissolution<br />
studies. To circumvent analytical<br />
weighing balance sensitivity limitations,<br />
the dose mass of beryllium was determined<br />
using inductively coupled plasmamass<br />
spectrometry (ICP-MS). This<br />
technique involves estimating a dosing<br />
suspension concentration gravimetrically<br />
<strong>and</strong> verifying the exact dose mass by<br />
submitting multiple samples of the cell<br />
culture medium supplemented with<br />
dosing suspension for ICP-MS analysis.<br />
Maintenance of cell cultures during<br />
dissolution studies. The J774A.1<br />
monocyte-macrophage cell line was<br />
planned for use in our dissolution studies<br />
because these cells are highly phagocytic<br />
(Ralph <strong>and</strong> Nakoinz, 1975). A potential<br />
limitation to using this cell line is that the<br />
cell population doubling time is 12–24<br />
hours (Ralph et al. 1976), <strong>and</strong> once<br />
confluent (e.g., having formed a monolayer<br />
of cells on the dish surface), the<br />
cells must be sub-cultured or they will<br />
begin to die. As a result, a balance was<br />
needed between having a sufficient cell<br />
population per dish to ensure rapid <strong>and</strong><br />
complete beryllium particle uptake while<br />
avoiding confluence prior to sufficient<br />
dissolution having occurred to meet ICP-<br />
MS analytical limit of detection. We<br />
investigated two options for delaying<br />
time to confluence, using a cytostatic<br />
agent <strong>and</strong> increasing tissue culture dish<br />
surface area.<br />
Lipopolysaccharide (LPS) is a<br />
chemostatic agent, i.e., at 10 µg LPS/ml<br />
media J774A.1 growth rate is reported to<br />
be static but physiologic functioning is<br />
not altered (Ralph <strong>and</strong> Nakoinz, 1977).<br />
In a pilot study, we investigated the<br />
effects of LPS at two concentrations, 2 or<br />
9 mg LPS/ml media, on J774A.1 cell<br />
proliferation <strong>and</strong> viability. Cell population<br />
doubling time was 2.4 to 3.0 times<br />
slower for cells cultured in either 2 or 9<br />
µg LPS/ ml medium than in control<br />
medium; however, LPS was cytotoxic<br />
after 4 days.<br />
Based on the negative results of the<br />
LPS pilot study, we investigated a second<br />
technique to delay the time to confluence,<br />
increasing the tissue culture dish surface<br />
area available for growth. For this pilot<br />
study, six of each sized sterile tissue<br />
culture dishes, 60 x 15 mm, 100 x 20<br />
mm, <strong>and</strong> 150 x 25 mm were seeded with<br />
2 x 10⁶ J774A.1 cells per dish in minimum<br />
essential media (MEM). Every<br />
other day, cells in each dish were<br />
suspended <strong>and</strong> assayed for cell concentration<br />
<strong>and</strong> viability by trypan dye exclusion<br />
technique. Results indicated that using a<br />
150 mm culture dish rather than a<br />
100 mm dish in vitro dissolution studies<br />
could be maintained for 12 days prior to<br />
cells reaching confluence.<br />
Fractionating particulate from<br />
dissolved beryllium. Kreyling et al.<br />
(1990) <strong>and</strong> Eidson et al. (1991) used<br />
filtration to fractionate particulate from<br />
dissolved species, both in the extracellu-<br />
Industrial Hygiene<br />
lar medium <strong>and</strong> within the cells; however,<br />
an exact technique was not specified.<br />
We investigated the feasibility of<br />
using several different filtration techniques,<br />
including an open face filter<br />
holder or a lure lock filter unit that<br />
attaches to a syringe. Results from pilot<br />
studies indicated that filtration using an<br />
open face filter holder was subject to wall<br />
losses, <strong>and</strong> that 0.1, 0.22, <strong>and</strong> 0.45 µm<br />
pore size filters used by Kreyling et al.<br />
(1990) <strong>and</strong> Eidson et al. (1991) were apt<br />
to clog while filtering particle free<br />
cultured medium. Lure lock filter units<br />
that attach to the end of disposable<br />
syringes were also subject to clogging<br />
with 0.1, 0.22, <strong>and</strong> 0.45 µm pore size<br />
filters, resulting in spillage of culture<br />
medium or rupture of the filter, yielding<br />
unfiltered sample breakthrough into the<br />
filtrate.<br />
The negative results from the pilot<br />
studies investigating filtration prompted<br />
development of an alternative approach<br />
combining low- <strong>and</strong> high-speed centrifugation,<br />
depicted in Figure 2, to separate<br />
particulate from dissolved beryllium.<br />
First, the culture medium from each<br />
sequential sacrifice <strong>and</strong> serial decanting<br />
dish was aspirated <strong>and</strong> placed into<br />
separate labeled 50-ml centrifuge tubes,<br />
<strong>and</strong> centrifuged at 1100 rpm <strong>and</strong> 4 o C for<br />
6 minutes. The supernatant from each<br />
centrifuge tube was then aspirated <strong>and</strong><br />
transferred to separate labeled 50 ml<br />
high-speed centrifuge bottles <strong>and</strong><br />
centrifuged at 10000 rpm <strong>and</strong> 4 o C for 45<br />
minutes. The supernatant from this highspeed<br />
spin, which contains the mass of<br />
dissolved beryllium in the extracellular<br />
culture medium, M DE , was aspirated <strong>and</strong><br />
transferred to separate labeled glass<br />
sample jars. The undissolved mass of<br />
beryllium in the extracellular medium,<br />
M UDE , from particles that were free or<br />
inside floating cells at the time of<br />
aspiration remained in the pellet. Next,<br />
the PBS rinse from each serial decanting<br />
<strong>and</strong> sequential sacrifice was added to the<br />
appropriate 50 ml centrifuge tube<br />
containing the cell pellet from the lowspeed<br />
spin, <strong>and</strong> centrifuged at 1100 rpm<br />
<strong>and</strong> 4 o C for 6 minutes. The resulting<br />
supernatant contained any residual<br />
dissolved beryllium captured by the PBS<br />
65
Industrial Hygiene<br />
rinse, M DE , <strong>and</strong> the cell pellet potentially<br />
contained dissolved intracellular, M DI ,<br />
<strong>and</strong> undissolved intracellular, M UDI ,<br />
beryllium. The supernatant containing<br />
M DE was aspirated <strong>and</strong> combined with<br />
the M DE sample previously obtained from<br />
the high-speed spin to yield a single<br />
sample containing all M DE for a given<br />
dish. For the serial decanting dishes, the<br />
dissolution rate constant is determined<br />
from the M DE , which represents dissolved<br />
beryllium that has diffused out of<br />
the cell, so the cell pellet containing M DI<br />
<strong>and</strong> M UDI was resuspended in 5 ml PBS<br />
<strong>and</strong> submitted for ICP-MS analysis to<br />
complete the mass balance. For sequential<br />
sacrifice dishes, the dissolution rate<br />
constant is calculated from the M DI ;<br />
therefore, the cell pellet was subject to<br />
further fractionation. The cells in the<br />
sequential sacrifice dishes were suspended<br />
using 4 x 10 ml aliquots of PBS<br />
<strong>and</strong> transferred to the appropriate highspeed<br />
centrifuge bottle containing the cell<br />
pellet with M DI <strong>and</strong> M UDI <strong>and</strong> centrifuged<br />
at 10000 rpm <strong>and</strong> 4 o C for 45<br />
minutes. The resulting supernatant,<br />
containing M DI was aspirated <strong>and</strong><br />
66<br />
Sequential Sacrifice Serial Decanting<br />
2 x 10⁶ J774A.1 Cells 2 x 10⁶ Dose Dose<br />
J774A.1 Cells<br />
Day 0<br />
Day 2<br />
Day 10<br />
Aspirate culture medium Aspirate culture medium<br />
Rinse with phosphate buffered saline<br />
Harvest cells<br />
Day 0<br />
Day 10<br />
transferred to a glass sample jar <strong>and</strong> the<br />
particle-cell debris pellet containing<br />
MUDI resuspended in 5 ml PBS <strong>and</strong> all<br />
samples were submitted for beryllium<br />
analysis by ICP-MS.<br />
Determination of the dissolution<br />
rate constant of beryllium oxide. Using<br />
the method described above, we performed<br />
two experiments to determine the<br />
dissolution rate constant of beryllium<br />
oxide particles (aerodynamic diameter<br />
1.5–2.5 µm, specific surface area =<br />
11.1 m2 /g). A suspension containing<br />
approximately 780 µg beryllium oxide<br />
was prepared in a glass scintillation vial.<br />
An aliquot of the suspension was added<br />
to supplemented MEM to achieve a target<br />
dose of 80 µg beryllium oxide (29 µg Be)<br />
per dish. Next, 15 sequential sacrifice, 3<br />
serial decanting, <strong>and</strong> 3 cellular control<br />
dishes were prepared by seeding 150 x 25<br />
mm dishes with 2 x 10⁶ J774A.1 cells per<br />
dish, incubated for 2 hours to allow cells<br />
to adhere, then the culture medium<br />
aspirated <strong>and</strong> replaced with medium<br />
containing beryllium oxide. The exception<br />
to this protocol was that cellular<br />
control dishes were not dosed, but 3<br />
Rinse with phosphate buffered saline<br />
Replace with fresh culture medium<br />
Figure 1. Method for fractioning particulate from dissolved beryllium in the intracellular <strong>and</strong> extracellular compartments.<br />
acellular control dishes consisting of<br />
dosing medium only were prepared <strong>and</strong><br />
all 24 dishes were returned to the<br />
incubator. Six samples of equal volume<br />
of dosing medium as that used to culture<br />
dishes were prepared <strong>and</strong> submitted for<br />
ICP-MS analysis to determine the exact<br />
initial beryllium dose mass. The media<br />
from 9 r<strong>and</strong>om dishes aspirated prior to<br />
dosing were also submitted as blanks to<br />
confirm the absence of beryllium in cells<br />
at the start of the study. Every other day<br />
for 10 days three sequential sacrifice<br />
dishes were harvested <strong>and</strong> the medium<br />
from 3 serial decanting dishes was<br />
aspirated <strong>and</strong> replaced as described in<br />
Figure 1 <strong>and</strong> the cell cultures <strong>and</strong><br />
medium manipulated as depicted in<br />
Figure 2 until all dishes were harvested<br />
on day 10.<br />
The efficiency of certain steps<br />
outlined in Figures 1 <strong>and</strong> 2 were unknown,<br />
so three pilot studies were<br />
embedded in the experiment. The<br />
efficiency of the PBS rinse step in<br />
removing residual MDE from the cells,<br />
the efficiency with which beryllium was
Culture Medium<br />
Low-Speed<br />
Spin<br />
Supernatant<br />
Cell Pellet (M DI, M UDI)<br />
Low-Speed<br />
Spin<br />
Supernatant = M DE<br />
High-Speed<br />
Spin<br />
Cell Pellet (M DI, M UDI)<br />
High-Speed<br />
Spin<br />
Supernatant = M DI<br />
Figure 2. In vitro method for determination of dissolution rate constants of beryllium aerosols.<br />
removed from dishes when cells were<br />
harvested, <strong>and</strong> the beryllium recovery<br />
efficiency of the high-speed centrifuge<br />
step were determined. The results of<br />
these pilot studies will be used to<br />
calculate efficiency correction factors for<br />
data analysis.<br />
Preliminary Results. A portion of the<br />
samples generated during the first<br />
dissolution experiment has been analyzed<br />
<strong>and</strong> a preliminary summary of the results<br />
is provided here for the serial decanting<br />
method. The analysis of the remaining<br />
serial decanting <strong>and</strong> all sequential<br />
sacrifice samples is ongoing. The initial<br />
dose mass as determined from 6 samples<br />
of dosing medium analyzed by ICP-MS<br />
is 20.7 µg Be <strong>and</strong> no beryllium was<br />
detected in blank samples. For the serial<br />
decanting dishes (N = 3), MDE on day 2<br />
after dosing was 0.122 µg Be while no<br />
beryllium was detected in the M UDE<br />
samples, e.g.,
Industrial Hygiene<br />
<strong>Development</strong> of framework for<br />
data interpretation<br />
Exposure-disease relation. At a<br />
fundamental level, Be exposure controls<br />
CBD. The disease is observed in cohorts<br />
with exposure to Be <strong>and</strong> has not been<br />
reported in the absence of exposure<br />
(Cu87, Ne92, Mi98, Wa00). There is<br />
evidence of an exposure threshold for<br />
CBD. Beryllium is commonly found in<br />
soil <strong>and</strong> air at trace levels, yet cases of<br />
disease are not observed in the general<br />
public. From studies of past beryllium<br />
environmental releases (Wa00), an<br />
airborne exposure concentration threshold<br />
for CBD of 0.01 µg Be/m3 has been<br />
derived. To date, no clear exposuredisease<br />
relation has been found for CBD<br />
(Ei98, Kr97). However, there is evidence<br />
suggesting that chemical form may affect<br />
this relation. Kreiss (Kr96) found a<br />
positive association between beryllium<br />
exposure <strong>and</strong> sensitization at a facility<br />
that only worked with beryllium oxide<br />
whereas no such association was found at<br />
a facility where there were exposures to<br />
multiple beryllium species (Kr97).<br />
Recently, at two facilities having comparable<br />
beryllium exposure levels, Deubner<br />
et al. (De01) attributed an eight-fold<br />
difference in disease incidence to<br />
differences in the chemical form of<br />
exposures at the facilities.<br />
Dose-Response Relation. Studies<br />
(Ha70, Ep82, Ro88, Sa89) contributing to<br />
development of the beryllium lymphocyte<br />
proliferation test show an in vitro<br />
dose-response relation between added<br />
beryllium <strong>and</strong> T cell activation in<br />
individuals with CBD. Epstein et al.<br />
(Ep82), Rossman et al. (Ro88) <strong>and</strong> Saltini<br />
(Sa89) observed a positive dose response<br />
in both brochoalveolar lavage (BAL) <strong>and</strong><br />
peripheral blood cell cultures for treatments<br />
of soluble beryllium (e.g., BeSO4 ).<br />
Hanifin (Ha70) made similar observations<br />
with cells from peripheral blood for<br />
treatments with beryllium oxide particles.<br />
This is the only dose-response study to<br />
use beryllium particulate found in our<br />
literature review. Hanifin’s results for<br />
three CBD patients (cases A, B, <strong>and</strong> C)<br />
are shown in Figure 3. The results<br />
include a positive response region where<br />
68<br />
<br />
<br />
<br />
<br />
<br />
<br />
<br />
<br />
Figure 3. Dose-response data from Hanifin et al. showing a positive response region.<br />
response [R] increases with added<br />
mass M – R = f(M).<br />
Added mass can be interpreted as<br />
added BeO surface area (S) using the<br />
relation with specific surface area (Sp):<br />
M = S/Sp<br />
<br />
(1).<br />
Thus, the functional dependence of<br />
response observed by Hanafin et al. can<br />
also be expressed in terms of added BeO<br />
surface area. For BeO particles, the<br />
production rate of dissolved beryllium<br />
depends on total particulate surface area.<br />
Such a functional dependence on S is<br />
expected if response is limited by the<br />
availability of beryllium dissolved from<br />
added beryllium particles. This interpretation<br />
of Hanifin’s results suggests that<br />
the kinetics of lymphocyte activation,<br />
here represented by lymphocyte proliferation,<br />
may depend on the kinetics of<br />
particle dissolution.
Conclusion <strong>and</strong> Deliverables<br />
In <strong>FY</strong> 2001, major activity areas<br />
included development of cellular methods<br />
for determining dissolution rate<br />
constants (k) for Be (<strong>Development</strong> of<br />
methods section), <strong>and</strong> the development of<br />
a framework for data interpretation<br />
section. Progress made in each area is<br />
described in detail above <strong>and</strong> is summarized<br />
below.<br />
Uncertainty in whether intracellularly<br />
dissolved beryllium remained within cells<br />
or is transported out of the cell across the<br />
cell membrane drove our decision to look<br />
for dissolved beryllium both within cells<br />
<strong>and</strong> in extracellular fluid. Our method<br />
consists of two components: 1) serial<br />
sacrifice of cell cultures <strong>and</strong> determining<br />
dissolved beryllium associated with lysed<br />
cells <strong>and</strong> 2) sequential decanting where<br />
dissolved beryllium is analyzed for in cell<br />
culture extracellular fluid. Two studies<br />
were completed using this two<br />
component method. Analysis of samples<br />
from these studies is ongoing.<br />
We collaborated with Theoretical<br />
Biology group (T-10) to investigate the<br />
exposure-disease <strong>and</strong> dose-response<br />
relations for chronic beryllium disease.<br />
The literature supports a disease exposure<br />
threshold concentration of<br />
0.01 µg Be/m3 . Ambient exposure levels<br />
below this value do not appear to result in<br />
cases of CBD. Determining an exposuredisease<br />
relation has been elusive. Our<br />
review of certain recent studies suggests<br />
that the presence of such exposuredisease<br />
relations may be obscured by a<br />
dependence on the chemical form of<br />
exposure.<br />
Dose-response relations have been<br />
observed in cultures of lymphocytes from<br />
the peripheral blood <strong>and</strong> BAL fluid of<br />
CBD patients when treated with soluble<br />
beryllium (e.g., Be2SO4 ). One study has<br />
been found where positive dose-response<br />
was also observed for doses of insoluble<br />
BeO particulate. Through conversion of<br />
added beryllium particulate mass to<br />
added beryllium particle surface area,<br />
results of this study can be interpreted to<br />
suggest that the kinetics of the lympho-<br />
cyte response may be limited by dissolution<br />
of BeO particulate.<br />
References<br />
An87 André, S., H. Métivier, G.<br />
Lantenois, M. Boyer, D. Nolibé, <strong>and</strong> R.<br />
Masse: Beryllium Metal Solubility in the<br />
Lung, Comparison of Metal <strong>and</strong> Hotpressed<br />
Forms by in vivo <strong>and</strong> in vitro<br />
Dissolution Bioassays. Human Toxicol.<br />
6:233–240 (1987).<br />
Cu87 Cullen, M.R., J.R. Kominsky,<br />
M.D. Rossman, M.G. Cherniack, J.A.<br />
Rankin, J.R. Balmes, J.A. Kern, R. P.<br />
Daniele, L. Palmer, G.P. Naegel, K.<br />
McManus, <strong>and</strong> R. Cruz: Chronic<br />
Beryllium Disease in a Precious Metal<br />
Refinery. Am Rev Respir Dis 135:201–<br />
208 (1987)<br />
De01 Deubner, D., J. Kelsh, M.<br />
Shum, L. Maier, M. Kent, <strong>and</strong> E. Lau:<br />
Beryllium sensitization, chronic beryllium<br />
disease, <strong>and</strong> exposures at a beryllium<br />
mining <strong>and</strong> extraction facility. Appl.<br />
Occup. Env. Hyg. 16(5):579–592 (2001).<br />
Ei83 Eisenbud, M., <strong>and</strong> J. Lisson:<br />
Epidemiological Aspects of Beryllium-<br />
Induced Nonmalignant Lung Disease: A<br />
30-Year Update. J. Occ. Med. 25(3):196–<br />
202 (1983).<br />
Ei91 Eidson, A.F., A. Taya, G.L.<br />
Finch, M.D. Hoover, C. Cook: Dosimetry<br />
of Beryllium in Cultured Canine<br />
Pulmonary Alveolar Macrophages. J.<br />
Toxicol. Environ. Health 34:433–448<br />
(1991).<br />
Ei98 Eisenbud, M.: The St<strong>and</strong>ard for<br />
Control of Chronic Beryllium Disease.<br />
Appl. Occup. Environ. Hyg. 13(1):25–31<br />
(1998).<br />
Ep82 Epstein PE, Dauber JH,<br />
Rossman MD, <strong>and</strong> RP Daniele:<br />
Bronchoalveolar Lavage in a Patient with<br />
Chronic Berylliosis: Evidence for<br />
Hypersensitivity Pneumonitis. Ann.<br />
Intern. Med. 97:213–216 (1982).<br />
Industrial Hygiene<br />
Fi88 Finch, G.L., J.A. Mewhinney,<br />
A.F. Eidson, M.D. Hoover, <strong>and</strong> S.J.<br />
Rothenberg: In Vitro Dissolution<br />
Characteristics of Beryllium Oxide <strong>and</strong><br />
Beryllium Metal Aerosols. J. Aerosol Sci.<br />
19(3):333–342 (1988).<br />
Ha70 Hanifin, J.M., W.L. Epstein,<br />
<strong>and</strong> M.J. Cline: In Vitro Studies of<br />
Granulomatous Hypersensitivity to<br />
Beryllium. J. Invest. Derm. 55:284–288<br />
(1970).<br />
Kr90 Kreyling, W.G., J.J. Godleski,<br />
S.T. Kariya, R.M. Rose, <strong>and</strong> J.D.<br />
Brain: In Vitro Dissolution of Uniform<br />
Cobalt Oxide Particles by Human <strong>and</strong><br />
Canine Alveolar Macrophages. Amer.<br />
Jou. of Resp. Cell <strong>and</strong> Molecular Bio.<br />
2:413–422 (1990).<br />
Kr93 Kreiss, K., M.M. Mroz, B.<br />
Zhen, J.W. Martyny, <strong>and</strong> L.S.<br />
Newman: Epidemiology of Beryllium<br />
Sensitization <strong>and</strong> Disease in Nuclear<br />
Workers. Am. Rev. Respir. Dis.<br />
148:985–991 (1993).<br />
Kr96 Kreiss, K., M.M. Mroz, L.S.<br />
Newman, J. Martyny, <strong>and</strong> B. Zhen:<br />
Machining Risk of Beryllium Disease<br />
<strong>and</strong> Sensitization with Median Exposures<br />
Below 2 µg/m3. Amer. J. Ind. Med.<br />
30:16–25 (1996).<br />
Kr97 Kreiss, K., M.M. Mroz, B.<br />
Zhen, H. Wiedeman, <strong>and</strong> B. Barna:<br />
Risks of Beryllium Disease Related to<br />
Work Processes at a Metal, Alloy, <strong>and</strong><br />
Oxide Production Plant. Occ. Env. Med.<br />
54(8):605–612 (1997).<br />
Mi98 Middleton, D.C., Chronic<br />
beryllium disease: uncommon disease,<br />
less common diagnosis. Environ Health<br />
Perspect 106:765–767 (1998).<br />
Ne92 Newman, L.S. <strong>and</strong> K. Kreiss.,<br />
Non-occupational beryllium disease<br />
masquerading as sarcoidosis: identification<br />
by blood lymphocyte proliferative<br />
response to beryllium. Am Rev Respir Dis<br />
145:1212–1214 (1992).<br />
69
Industrial Hygiene<br />
Ne93 Newman, L.S.: To Be2+ or Not<br />
to Be2+: Immunogenetics <strong>and</strong> Occupational<br />
Exposure. Science 262:197–198<br />
(1993).<br />
Ra75 Ralph P <strong>and</strong> I Nakoinz:<br />
Phagocytosis <strong>and</strong> cytolysis by a macrophage<br />
tumor <strong>and</strong> its cloned cell line. Nature.<br />
257:393–393 (1975).<br />
Ra76 Ralph P, Moore-Malcolm AS,<br />
<strong>and</strong> K Nilsson: Lysosome Synthesis by<br />
Established Human <strong>and</strong> Murine Histiocytic<br />
Lymphoma Cell lines. J. Exp. Med.<br />
143:1528–1533 (1976).<br />
Ra77 Ralph P <strong>and</strong> I Nakoinz: Direct<br />
toxic effects of immunopotentiators on<br />
monocytic, myelomonocytic, <strong>and</strong><br />
histiocytic or macrophage tumor cells in<br />
culture. Cancer Res. 37:546–550 (1977).<br />
70<br />
Ro88 Rossman MD, Kern JA, Elias<br />
JA, Cullen MR, Epstein PE, Preuss<br />
OP, Markham TN, <strong>and</strong> RP Daniele:<br />
Proliferative Response of<br />
Bronchoalveolar Lymphocytes to<br />
Beryllium: A Test for Chronic Beryllium<br />
Disease. Ann. Intern. Med. 108:687–693<br />
(1988).<br />
Sa89 Saltini C, K. Winestock, M.<br />
Kirby, P. Pinkston <strong>and</strong> R.G. Crystal:<br />
Maintenance of Alveolitis in Patients<br />
with Chronic Beryllium Disease by<br />
Beryllium Specific Helper T-Cells. N.<br />
Engl. J. Med. 320(17):1103–1109 (1989).<br />
St96 Stange, W., D.E. Hilmas, F.J.<br />
Furman: Possible Health Risks from<br />
Low Level Exposure to Beryllium.<br />
Toxicology 111:213–224 (1996).<br />
Wa00 Wambach, P.F., R.M. Tuggle:<br />
<strong>Development</strong> of an eight-hour occupational<br />
exposure limit for beryllium. Appl.<br />
Occup. Environ. Hyg. 15(7):581–587<br />
(2000).
Publications <strong>and</strong> Presentations Resulting from <strong>TDEA</strong> Projects<br />
The publications <strong>and</strong> presentations<br />
listed below have received full or partial<br />
funding from the <strong>TDEA</strong> Program. In<br />
some instances, a project has been<br />
ongoing, <strong>and</strong> <strong>TDEA</strong> contributed support<br />
toward its progress.<br />
Balice et al.<br />
Selected Presentations <strong>and</strong> LA Reports<br />
for the Duration of the Project<br />
Balice, R.G., “Ecological risk assessment<br />
<strong>and</strong> extreme events analysis: applications<br />
to wildfire management.” Presented at<br />
the symposium Extreme Event Analysis<br />
in Ecology, held at the 86th Annual<br />
Meeting of the Ecological Society of<br />
America, Madison, WI 2001.<br />
Balice, R.G. <strong>and</strong> S.W. Koch, “Regression<br />
modeling to enhance spatial representations<br />
of fuel loads <strong>and</strong> fire hazards.”<br />
LA-UR-01-1090, presented at the ESH<br />
Division Review Committee Meeting,<br />
Los Alamos National Laboratory,<br />
March 13–15, 2001.<br />
Balice, R.G., S.W. Koch, <strong>and</strong> S.R. Yool,<br />
“Modeling the spatial patterns of forest<br />
fuels in the Los Alamos region.”<br />
Presented at the 85th Annual Meeting of<br />
the Ecological Society of America,<br />
Snowbird, UT 2000.<br />
Balice, R.G., B.P.Oswald, <strong>and</strong> S.R. Yool,<br />
“Fuels inventories <strong>and</strong> spatial modeling<br />
of fire hazards in the Los Alamos<br />
Region.” Pages 138-147 in Proceedings<br />
of the Crossing the Millennium: Integrating<br />
Spatial Technologies <strong>and</strong> Ecological<br />
Principles for a New Age in Fire Management<br />
Conference <strong>and</strong> Workshop,<br />
Volume 1, (L. Neuenschw<strong>and</strong>er et al.,<br />
Technical Editors), University of Idaho<br />
<strong>and</strong> the International Association of<br />
Wildl<strong>and</strong> Fire, Moscow, ID 2000.<br />
Balice, R.G., J.D. Miller, B.P. Oswald,<br />
C. Edminster, <strong>and</strong> S.R. Yool, “Forest<br />
surveys <strong>and</strong> wildfire assessment in the<br />
Los Alamos Region; 1998-1999.” Los<br />
Alamos National Laboratory, report LA-<br />
13714-MS 2000.<br />
Publications <strong>and</strong> Presentations Resulting from <strong>TDEA</strong> Projects<br />
Koch, S.W. <strong>and</strong> R.G. Balice, “Input data<br />
development for the FARSITE fire area<br />
simulator for the Los Alamos National<br />
Laboratory Region.” Presented at the<br />
ESRI User Conference, San Diego, CA<br />
June 26, 1999.<br />
Koch, S.W. <strong>and</strong> R.G. Balice, “Interactions<br />
of wildfire components: modeling<br />
the Cerro Gr<strong>and</strong>e Fire.” Oral presentation<br />
at the 86th Annual Meeting of the<br />
Ecological Society of America,<br />
Madison, WI, August 5–10, 2001.<br />
Koch, S.W, R.G. Balice, J.W. Nyhan, <strong>and</strong><br />
S.R. Loftin, “Validation <strong>and</strong> sensitivity<br />
analyses of a wildfire behavior model.”<br />
Presented at the ESH Division Review<br />
Committee Meeting, Los Alamos<br />
National Laboratory, April 11–13, 2000.<br />
Koch, S.W., R.G. Balice, S.R. Loftin,<br />
J.W. Nyhan, P. Valerio, <strong>and</strong> J. Baars,<br />
“Modeling wildfire behavior <strong>and</strong> effects<br />
in the Los Alamos Region following the<br />
Cerro Gr<strong>and</strong>e Wildfire.” Oral presentation<br />
at the Fall Meeting of the New<br />
Mexico Geographic Information Council,<br />
Albuquerque, NM, November 3, 2000.<br />
Nyhan, J., S.W. Koch, R.G. Balice, S.<br />
Loftin, <strong>and</strong> P. Valerio, “Estimation of<br />
soil erosion in burned forest areas<br />
resulting from the Cerro Gr<strong>and</strong>e Fire.”<br />
Poster presented at the ESH Division<br />
Review Committee Meeting, Los Alamos<br />
National Laboratory, LA-UR-01-1356,<br />
March 13–15, 2001.<br />
Valerio, P, “Tree thinning saves lives <strong>and</strong><br />
property. Poster presentation at the Fire<br />
Conference 2000: The First National<br />
Congress on Fire Ecology, Prevention<br />
<strong>and</strong> Management.” Held in San Diego,<br />
California, by the California Association<br />
of Fire Ecology,<br />
November 27–December 1, 2000.<br />
Yool, S.R., J.D. Miller, R.G. Balice,<br />
B.P. Oswald, <strong>and</strong> C. Edminster,<br />
“Mapping fuel risk at the Los Alamos<br />
urban-wildl<strong>and</strong> interface.” Pages 228–<br />
234 in Proceedings of the Crossing the<br />
Millennium: Integrating Spatial Technologies<br />
<strong>and</strong> Ecological Principles for a<br />
New Age in Fire Management Conference<br />
<strong>and</strong> Workshop, Volume I,<br />
(L. Neuenschw<strong>and</strong>er et al., Technical<br />
Editors), University of Idaho <strong>and</strong> the<br />
International Association of Wildl<strong>and</strong><br />
Fire, Moscow, ID 2000.<br />
Peer Reviewed Publications <strong>and</strong><br />
Presentations<br />
Miller, J.D., J.W. Nyhan, <strong>and</strong> S.R. Yool,<br />
“Modeling potential erosion due to the<br />
Cerro Gr<strong>and</strong>e Fire with a GIS-based<br />
implementation of the Revised Universal<br />
Soil Loss Equation.” L<strong>and</strong>scape Ecology<br />
submitted, in review, 2001.<br />
Nyhan, J.W., S.W. Koch, R.G. Balice,<br />
<strong>and</strong> S. Loftin, “Estimation of soil erosion<br />
in burnt forest areas of the Cerro Gr<strong>and</strong>e<br />
Fire in Los Alamos, New Mexico.”<br />
Catena, submitted, in review, 2001.<br />
Oswald, B.P., R.G. Balice, <strong>and</strong><br />
K.B. Scott, “Fuel loads <strong>and</strong> overstory<br />
conditions at Los Alamos National<br />
Laboratory, New Mexico.” Pages 41–45<br />
in Fire <strong>and</strong> Forest Ecology: Innovative<br />
Silviculture <strong>and</strong> Vegetation Management<br />
(W. Keith Moser <strong>and</strong> Cynthia F. Moser,<br />
Editors). Tall Timbers Fire Ecology<br />
Conference Proceedings, No. 21. Tall<br />
Timber Research Station, Tallahassee, FL<br />
2000.<br />
71
Publications <strong>and</strong> Presentations Resulting from <strong>TDEA</strong> Projects<br />
Biggs et al.<br />
Presentations:<br />
Quintana, E. <strong>and</strong> H. Alex<strong>and</strong>er, “The<br />
evaluation of techniques to collect hair<br />
<strong>and</strong> scat samples from free-ranging<br />
carnivores.” Los Alamos National<br />
Laboratory report LA-UR-01-3845 2001.<br />
Peer Reviewed Publications:<br />
Alex<strong>and</strong>er H., J. Longmire, J. Biggs, L.<br />
Hansen, C. Bare, <strong>and</strong> S. Frybarger, In<br />
preparation, “Tetranucleotide<br />
microsatellite loci for mountain lion<br />
(Puma concolor).”<br />
Gonzales et al.<br />
Publications <strong>and</strong> Presentations<br />
In September 2001, a poster on this<br />
project was presented at the annual<br />
Wildlife Society meeting in Reno,<br />
Nevada. In November 2001, a poster was<br />
presented at the annual Society for<br />
Environmental Toxicology <strong>and</strong> Chemistry<br />
conference in Baltimore, Maryl<strong>and</strong>.<br />
Planned publications <strong>and</strong> presentations<br />
for this project include a presentation at<br />
the Society for Environmental Toxicology<br />
<strong>and</strong> Chemistry, publication in the J.<br />
Environ. Tox. <strong>and</strong> Chem., satisfaction of<br />
the thesis requirement for the M.S.<br />
degree (Ms. Sarah Mitchell), <strong>and</strong> a poster<br />
presentation at the annual Environment,<br />
Safety <strong>and</strong> Health Division Review.<br />
Mallett et al.<br />
Publications<br />
<strong>TDEA</strong> Progress Report, “Neutron<br />
Extremity Dosimetry Based on Monte<br />
Carlo Computations of Magnetic Resonance<br />
Images,” Los Alamos National<br />
Laboratory report LA-13901-PR 2000.<br />
Presentations<br />
Poster presentation to the ESH Division<br />
Review Committee: March 12, 2001,<br />
LA-UR-01-1245.<br />
72<br />
Moore et al.<br />
Publications<br />
Moore, M.E., H.J. Gepford, R.E..<br />
Hermes, N.E. Hertel, <strong>and</strong> R.T. Devine,<br />
“Laser Illuminated Track Etch Scattering<br />
(LITES) Dosimetry System” to be printed<br />
in Radiation Protection Dosimetry,<br />
accepted for publication in Solid State<br />
Dosimetry—Proceedings of the<br />
Thirteenth International Conference<br />
(Athens, Greece July 9–13, 2001).<br />
Presentations<br />
Moore, M.E., R.T. Devine, H.J. Gepford,<br />
R.E. Hermes, N.E. Hertel, J.M. Hoffman,<br />
<strong>and</strong> R.J. McKeever, Poster presentation<br />
to the ESH Division Review Committee:<br />
March 12, 2001. Title: “Laser Illuminates<br />
Track Etch Scattering (LITES) Dosimetry<br />
System,” Received a “Best-in-Class”<br />
designation from the DRC committee.<br />
Conference presentation (Heather<br />
Gepford): Laser Illuminated Track Etch<br />
Scattering (LITES) Dosimetry System.<br />
M.E. Moore, R.E. Hermes, R.T. Devine<br />
(LANL), H.J. Gepford, <strong>and</strong> N.E. Hertel<br />
(Georgia Tech). Thirteenth International<br />
Conference on Solid State Dosimetry<br />
July 9–13, 2001, Athens, Greece.<br />
Awards<br />
LITES team received a “Los Alamos<br />
Achievement Award” from the Environment,<br />
Safety, <strong>and</strong> Health Division. Los<br />
Alamos National Laboratory,<br />
September 20, 2001.<br />
Rodgers et al.<br />
Presentations <strong>and</strong> LA Reports<br />
Rodgers, J.C., M.J. Koskelo, <strong>and</strong> S.<br />
Homann, “Features of the environmental<br />
continuous air monitor (ECAM),” Los<br />
Alamos National Laboratory report LA-<br />
UR-01-1390 presented at, DOE Air<br />
Monitoring Users Group Meeting, Oak<br />
Ridge, TN, March 19, 2001.<br />
Rodgers, J.C., <strong>and</strong> S. Huang,<br />
“Modification of the Los Alamos /<br />
Canberra Environmental Continuous Air<br />
Monitor (ECAM) inlet for enhanced<br />
performance by removal of fine particles,”<br />
Los Alamos National Laboratory<br />
report LA-UR-01-0763 presented at<br />
<strong>TDEA</strong> Committee Review <strong>and</strong> Division<br />
Review Committee June 2001.<br />
Rodgers, J.C., “Monitoring for alphaemitting<br />
radionuclides in the environment<br />
using the Los Alamos / Canberra alpha-<br />
ECAM,” presented at, CRMG Meeting,<br />
Santa Clara Pueblo, NM August 22,<br />
2001.<br />
Huang, S., R. Alcantara, S.D. Schery,<br />
P.T. Wasiolek, <strong>and</strong> J.C. Rodgers,<br />
“Investigations of techniques to improve<br />
continuous air monitors under conditions<br />
of high dust loading in environmental<br />
settings,” presented at, EMSP National<br />
Workshop, Atlanta, GA, April 24–28,<br />
2000.
Peer Reviewed Publications<br />
Huang, S., S.D. Schery, R.E. Alcantara,<br />
N.V. Dale, <strong>and</strong> J.C. Rodgers,<br />
“Micrometer-sized short-lived radioactive<br />
aerosol particles for convenient use<br />
in laboratory measurements,” Health<br />
Physics (in press, submitted April 2001).<br />
Huang, S., S.D. Schery, R.E. Alcantara,<br />
J.C. Rodgers, <strong>and</strong> P.T. Wasiolek,<br />
“Influence of dust loading on the alphaparticle<br />
energy resolution of continuous<br />
air monitors for thin deposits of radioactive<br />
aerosols,” Health Physics (in press,<br />
submitted September 2001).<br />
Scripsick et al.<br />
Presentations<br />
LANL Divisional Review Committee<br />
Poster Session, March 2001<br />
Surface area of beryllium metal, oxide<br />
<strong>and</strong> copper alloy aerosol particles:<br />
Stefaniak, A.B., M.D. Hoover, G.A. Day,<br />
<strong>and</strong> R.C. Scripsick.<br />
Chronic beryllium disease dosimetry:<br />
particle dissolution to lymphocyte<br />
activation: Scripsick, R.C., <strong>and</strong> B.B.<br />
Goldstein.<br />
AIHCE01 Poster Session June 2001<br />
Surface area of beryllium metal, oxide<br />
<strong>and</strong> copper alloy aerosol particles:<br />
Stefaniak, A.B., M.D. Hoover, G.A. Day,<br />
<strong>and</strong> R.C. Scripsick.<br />
Microscopy <strong>and</strong> Microanalysis (August<br />
2001)<br />
TEM of BeO aerosol: materials aspects<br />
of method development in studying<br />
chronic beryllium disease: Dickerson,<br />
R.M., R.C. Scripsick, G.A. Day, A.B.<br />
Stefaniak, <strong>and</strong> E.J. Peterson.<br />
Publications <strong>and</strong> Presentations Resulting from <strong>TDEA</strong> Projects<br />
Peer Reviewed Publications<br />
Scripsick, R.C.: On the role of particle<br />
dissolution in chronic beryllium disease.<br />
(In preparation)<br />
Stefaniak A.B., M.D. Hoover, R.M.<br />
Dickerson, E.J. Peterson, G.A. Day, P.N.<br />
Breysse, <strong>and</strong> R.C. Scripsick: Surface<br />
Area of Respirable Beryllium Metal,<br />
Oxide, <strong>and</strong> Copper Alloy Aerosols <strong>and</strong><br />
Implications for Assessment of Exposure<br />
Risk of Chronic Beryllium Disease. (In<br />
preparation)<br />
Stefaniak A.B., R.S. Lillard, R.M.<br />
Dickerson, P.N. Breysse, <strong>and</strong> R.C.<br />
Scripsick: Evidence to Support the<br />
Potential Importance of Chloride Ion <strong>and</strong><br />
pH in Phagocytic Dissolution of Beryllium<br />
Metal Particles. (In preparation).<br />
Whicker et al.<br />
Peer Reviewed Publications<br />
Whicker, J.J., D.D. Breshears,<br />
P.T. Wasiolek, T.B. Kirchner,<br />
R.A. Tavani, D.A. Schoep, <strong>and</strong><br />
J.C. Rodgers, “Temporal <strong>and</strong> spatial<br />
variation of episodic wind erosion in<br />
unburned <strong>and</strong> burned semiarid<br />
shrubl<strong>and</strong>s,” J. of Environmental<br />
Quality, 31, 2002.<br />
73
This report has been reproduced directly from the<br />
best available copy. It is available electronically on<br />
the web (http://www.doe.gov/bridge).<br />
Copies are available for sale to U.S. Department of<br />
Energy employees <strong>and</strong> contractors from—<br />
Office of Scientific <strong>and</strong> Technical Information<br />
P.O. Box 62<br />
Oak Ridge, TN 37831<br />
(865) 576-8401<br />
Copies are available for sale to the public from—<br />
National Technical Information Service<br />
U.S. Department of Commerce<br />
5285 Port Royal Road<br />
Springfield, VA 22616<br />
(800) 553-6847
Los Alamos, New Mexico 87545