ZSL Ranging patterns in Sumatran tigers final report 2004
ZSL Ranging patterns in Sumatran tigers final report 2004
ZSL Ranging patterns in Sumatran tigers final report 2004

You also want an ePaper? Increase the reach of your titles
YUMPU automatically turns print PDFs into web optimized ePapers that Google loves.
PIGS, PALMS, PEOPLE<br />
AND TIGERS<br />
S URVIVAL OF THE S UMATRAN TIGER IN A<br />
COMMERCIAL LANDSCAPE<br />
REPORT 2002-<strong>2004</strong><br />
BY T.M.MADDOX, D.PRIATNA, E.GEMITA,<br />
A.SELAMPASSY,<br />
JAMBI TIGER PROJECT<br />
Conservation Programmes, Zoological Society of London, Regents Park, London, NW1 4RY
2<br />
CONTENTS<br />
SUMMARY 6<br />
INTRODUCTION 8<br />
The importance of unprotected areas 8<br />
The importance of oil palm 8<br />
Tigers and oil palm 9<br />
The need for conservation action <strong>in</strong> commercial landscapes 9<br />
PROJECT BACKGROUND 11<br />
The Zoological Society of London 11<br />
PT Asiatic Persada 11<br />
Collaboration between PT Asiatic Persada and <strong>ZSL</strong> 11<br />
research programme 2002-<strong>2004</strong> 12<br />
Project site 12<br />
Location 12<br />
Habitat types 13<br />
PROJECT GOALS AND OBJECTIVES 16<br />
Project vision 16<br />
Initial objectives 16<br />
Modified objectives 16<br />
PROJECT FUNDING AND SUPPORT 19<br />
GENERAL METHODS 20<br />
Camera trapp<strong>in</strong>g 20<br />
Secondary sign surveys 22<br />
L<strong>in</strong>e transects 23<br />
Wildlife captures 24<br />
Expertise 24<br />
Tra<strong>in</strong><strong>in</strong>g 25<br />
Remote dart gun 26<br />
Leg-hold traps 27<br />
Live bait<strong>in</strong>g 28<br />
Panel traps 30
Anaesthetics and medical drugs 31<br />
Radio track<strong>in</strong>g 31<br />
Data Handl<strong>in</strong>g – Project database 32<br />
Overview 32<br />
Database functions 33<br />
SURVEY EFFORT 37<br />
Camera trapp<strong>in</strong>g 37<br />
Camera resources available 37<br />
Camera locations 37<br />
Camera trapp<strong>in</strong>g effort 38<br />
Photographs obta<strong>in</strong>ed 39<br />
L<strong>in</strong>e transects 40<br />
Secondary signs 40<br />
Transects walked 40<br />
Wildlife signs and illegal activity recorded 40<br />
Wildlife captures 41<br />
Trap nights 41<br />
Encounter rates and captures 41<br />
Notes on <strong>in</strong>juries due to foot loop traps 42<br />
Casualties 43<br />
Radio track<strong>in</strong>g 44<br />
OBJECTIVE 1: INFRASTRUCTURE AND FOUNDATIONS 45<br />
Establishment of collaborative conservation programme 45<br />
Collaborations and partnerships 45<br />
Logistics 48<br />
Research Programme team 49<br />
Team members 49<br />
Tasks 50<br />
Tra<strong>in</strong><strong>in</strong>g 50<br />
Collaboration 50<br />
Anti -Poach<strong>in</strong>g and Wildlife Monitor<strong>in</strong>g (APWM) team 51<br />
Structure 51<br />
Tasks 51<br />
Equipment 52<br />
Tra<strong>in</strong><strong>in</strong>g 52<br />
Collaboration 53<br />
Communication and <strong>in</strong>formation 53<br />
Newsletters 53<br />
Meet<strong>in</strong>gs 53<br />
OBJECTIVE 2: BASE ECOLOGICAL DATA 55<br />
Species diversity 55<br />
3
4<br />
Species list 55<br />
Species identification rate 58<br />
Relative abundance 59<br />
Wildlife sign encounter rates 59<br />
Photographic proportions 61<br />
Use of random / non random cameras 62<br />
Relative abundance over time 63<br />
Absolute density estimates from l<strong>in</strong>e transects 68<br />
Species distribution <strong>in</strong>side and outside the plantation 69<br />
Species presence / absence 69<br />
Relative abundance <strong>in</strong>side and outside the plantation concession 70<br />
Threats to conservation 71<br />
OBJECTIVE 3: TIGER PREY ECOLOGY 74<br />
Prey availability with<strong>in</strong> the study area 74<br />
Prey Diversity 74<br />
Prey abundance 74<br />
Distribution of prey species 77<br />
Movements of prey species 77<br />
Impacts of prey species on the plantation 78<br />
OBJECTIVE 4: TIGER ECOLOGY 80<br />
Tiger population estimate 80<br />
Individual recognition 81<br />
<strong>Rang<strong>in</strong>g</strong> <strong>patterns</strong> 83<br />
Range calculation 83<br />
Camera trapp<strong>in</strong>g rates <strong>in</strong> different habitats 86<br />
Activity <strong>patterns</strong> as determ<strong>in</strong>ed by camera traps 86<br />
REFERENCES 88<br />
APPENDICES 90<br />
Problems with “Camtrakker” camera traps 90<br />
List of all subjects photographed 92<br />
Distribution maps 1<br />
Canidae distribution 2<br />
Cercopithecidae and Hylobates distribution 3<br />
Cervidae distribution 4<br />
Felidae distribution 5
Mustelidae distribution 6<br />
Suidae distribution 7<br />
Tapiridae distribution 8<br />
Ursidae distribution 9<br />
Viverridae distribution 10<br />
Other small mammal distribution 11<br />
Human and illegal activity distribution 12<br />
5
6<br />
SUMMARY<br />
A key strategy for ensur<strong>in</strong>g the survival of the <strong>Sumatran</strong> tiger is to work on their survival<br />
outside the protected area system. Non-protected areas represent a far larger area of land,<br />
do not exclude people and therefore reduce the potential for land use conflict, and can<br />
provide connectivi ty between the core protected areas.<br />
In 2002 LIPI issued a research permit to Tom Maddox on behalf of the Zoological Society of<br />
London to beg<strong>in</strong> research<strong>in</strong>g how <strong>tigers</strong> can survive outside protected areas. Potential for<br />
coexistence between <strong>tigers</strong> and commercial land use had already been shown <strong>in</strong> an oil palm<br />
plantation, PT Asiatic Persada (AP), <strong>in</strong> Sumatra. A comb<strong>in</strong>ation of the plantation’s read<strong>in</strong>ess<br />
to adopt a management system sympathetic to tiger conservation and the Zoological Society<br />
of London (<strong>ZSL</strong>)’s belief <strong>in</strong> the importance of engagement with <strong>in</strong>dustry for conservation has<br />
resulted <strong>in</strong> the formation of the Jambi Tiger Project, a unique partnership between a<br />
conservation NGO, LIPI, and a commercial agricultural company that aims to establish how<br />
<strong>tigers</strong> survive with oil palm and what can be done to ensure the situation persists <strong>in</strong> a<br />
susta<strong>in</strong>able manner. Between 2001-2 the plantation created a 15 man conservation team<br />
which demonstrated without doubt the existence of at least four adult and breed<strong>in</strong>g <strong>tigers</strong> on<br />
site as well as a large variety of other species. In late 2002 the project expanded, with <strong>ZSL</strong><br />
receiv<strong>in</strong>g fund<strong>in</strong>g from the Save the Tiger Fund (STF), 21 st Century Tiger, Tufton Charitable<br />
Trust and employ<strong>in</strong>g permanent field staff. <strong>2004</strong> saw repeat fund<strong>in</strong>g from all organisations<br />
and the addition of Rh<strong>in</strong>o and Tiger Conservation Fund money for develop<strong>in</strong>g the plantation<br />
conservation team. Onsite <strong>in</strong>frastructure was thus established and programmes for monitor<strong>in</strong>g<br />
species presence, relative abundance and any immediate threats were expanded. A total of<br />
20 hard work<strong>in</strong>g and enthusiastic staff are now <strong>in</strong> place dedicated to tiger conservation and<br />
research. The <strong>ZSL</strong> and Asiatic staff share the workload, assist<strong>in</strong>g each other with the patrols<br />
and scientific survey efforts as necessary. Co-operation has been fostered with the Jambi<br />
branch of the KSDA and the adjacent logg<strong>in</strong>g concession PT Asialog (which is also used by<br />
the <strong>tigers</strong>), both of whom are keen to f<strong>in</strong>d a solution to conflict between <strong>in</strong>dustry and<br />
conservation. The project comb<strong>in</strong>es a core monitor<strong>in</strong>g / protection team run jo<strong>in</strong>tly by the<br />
plantation and <strong>ZSL</strong> with a research team that now employs three Indonesian scientists, one<br />
British researcher and one Indonesian mechanic. Research objectives for 2003-4 targeted<br />
understand<strong>in</strong>g the relationship between <strong>tigers</strong>, their probable ma<strong>in</strong> prey (wild pigs, Sus<br />
scrofa) and their role of prey species as pests on the plantation.<br />
The results show more than 40 medium and large sized mammals us<strong>in</strong>g the oil palm<br />
concession and borders, with other mammals of conservation <strong>in</strong>terest <strong>in</strong>clud<strong>in</strong>g tiger<br />
(Panthera tigris) dhole (Cuon alp<strong>in</strong>us), sun bear (Helarctos malayanus), Malayan tapir<br />
(Tapirus <strong>in</strong>dicus), clouded leopard (Neofelis nebulosa) and fish<strong>in</strong>g cat (Prionailurus viverr<strong>in</strong>us)<br />
with little difference between the plantation concession and the more <strong>in</strong>tact forest concession.<br />
However, use of the oil palm crop itself is limited and almost all species are restricted to the<br />
unplanted habitats border<strong>in</strong>g the oil palm or the Asialog forest concession. However, the<br />
degraded scrub habitats showed higher presence of many species than the apparently less<br />
degraded forest concession, <strong>in</strong>clud<strong>in</strong>g the <strong>Sumatran</strong> tiger.<br />
Prey studies were based on night transects and randomly placed camera trap surveys. These<br />
confirmed wild pigs (Sus scrofa) to be the dom<strong>in</strong>ant ungulate and likely tiger prey present,<br />
with abundance far outweigh<strong>in</strong>g any other species, although at least 19 potential tiger prey<br />
species exist on site. L<strong>in</strong>e transects estimated density with<strong>in</strong> the oil palm and scrub habitats<br />
to be around 2.5 pigs/km 2 and agreed with camera trapp<strong>in</strong>g studies that densities <strong>in</strong> the forest<br />
were negligible <strong>in</strong> comparison. These densities are comparable to other pig studies but much<br />
lower than the only other oil palm study where predators were absent. Pigs were also one of<br />
the few species to show higher abundance <strong>in</strong>side the oil palm crop compared to outside <strong>in</strong> the<br />
scrub. However, studies of abundance were not as complete as hoped with the failure of<br />
capture mark recapture studies follow<strong>in</strong>g unsuccessful trapp<strong>in</strong>g attempts. L<strong>in</strong>e transects are
thought to be underestimat<strong>in</strong>g true densities and further work estimat<strong>in</strong>g absolute density is<br />
also required for calibrat<strong>in</strong>g camera trap results. Consequently, these estimates are only<br />
considered to be prelim<strong>in</strong>ary results. As a result of problems captur<strong>in</strong>g pigs, other aspects of<br />
the prey study were also delayed and planned assessments of pig impact on the plantation<br />
are still underway.<br />
Prey movements were <strong>in</strong>vestigated with two radio collared wild pig (Sus scrofa) and one tapir<br />
(Tapirus <strong>in</strong>dicus ). Wild pig do not wear collars well, the first releas<strong>in</strong>g itself after two weeks<br />
and the second, thanks to a modified harness attachment, lasted two months. Data may not<br />
be complete, but <strong>in</strong>dicate range use of approximately 5-6 km 2 , both focuss<strong>in</strong>g on scrub / oil<br />
palm border areas. The tapir cont<strong>in</strong>ues to be tracked well and shows a surpris<strong>in</strong>gly small<br />
range of about 6 km 2 , based entirely <strong>in</strong> the plantation scrub and not <strong>in</strong> the forest.<br />
Research on the <strong>tigers</strong> based on density calculations from camera trapp<strong>in</strong>g rates and<br />
<strong>in</strong>dividual recognition of camera trap photos show that a m<strong>in</strong>imum of n<strong>in</strong>e and possibly even<br />
sixteen <strong>tigers</strong> have used the plantation concession and border<strong>in</strong>g areas with<strong>in</strong> the last three<br />
years, suggest<strong>in</strong>g densities comparable to many protected areas. At least four of the <strong>tigers</strong><br />
were breed<strong>in</strong>g residents liv<strong>in</strong>g with<strong>in</strong> the plantation concession. However, camera trap rates<br />
fell sharply <strong>in</strong> 2003-4 despite prey species and other large mammals apparently rema<strong>in</strong><strong>in</strong>g<br />
stable and based on recent data the tiger population looks to be <strong>in</strong> severe trouble. Various<br />
avenues still need to be explored before conclusions drawn (for example an expanded survey<br />
is needed <strong>in</strong>to the forest concession) but it appears likely that illegal land clearance is look<strong>in</strong>g<br />
the most likely cause.<br />
Tiger movements were also assessed by camera traps and all appeared to use both the<br />
plantation and forest concessions. One tiger was also successfully captured and radio<br />
collared, the first ever <strong>in</strong> Sumatra. Despite some complications receiv<strong>in</strong>g the signal <strong>in</strong> certa<strong>in</strong><br />
habitats, data were collected for 7 months before the tiger slipped out of the collar. Dur<strong>in</strong>g this<br />
time the tiger spent most of its time <strong>in</strong> plantation scrub, apparently never ventur<strong>in</strong>g <strong>in</strong>to the oil<br />
palm. However, estimates of tiger ranges were not particularly improved by the radio track<strong>in</strong>g<br />
data.<br />
7
8<br />
INTRODUCTION<br />
THE IMPORTANCE OF UNPROTECTED AREAS<br />
Whilst much attention is rightly placed on species <strong>in</strong> protected areas, very little is placed on<br />
their survival outside reserves, despite the vast majority of land be<strong>in</strong>g unprotected and the<br />
obvious limitations on <strong>in</strong>creas<strong>in</strong>g protected land (Western 1989). For large carnivores <strong>in</strong><br />
particular, it is clear that protected areas <strong>in</strong> isolation will never be sufficient for long-term<br />
conservation needs, both because of size limitations and because of the “edge” effects<br />
(Woodroffe & G<strong>in</strong>sberg 1998) which cause surround<strong>in</strong>g areas without any wildlife<br />
management to act as a “s<strong>in</strong>k” for the “source” <strong>in</strong>side the park. Undoubtedly, humandom<strong>in</strong>ated<br />
landscapes have highly detrimental effects on a range of species; however, <strong>in</strong><br />
many cases coexistence of even the most unlikely species is possible (Maddox 2002). In<br />
Indonesia, massive habitat losses are occurr<strong>in</strong>g outside protected areas. Forest cover has<br />
fallen from 162 million hectares to 98 million hectares between 1950 and 2000 with the<br />
current loss rate at 2-2.4 million hectares per year, a rate that should wipe out lowland<br />
diptocarp forest <strong>in</strong> Sumatra by 2005 (Glastra et al. 2002). In its place rema<strong>in</strong>s a patchwork of<br />
production forests, plantations and human habitations, now becom<strong>in</strong>g the dom<strong>in</strong>ant<br />
landscape type <strong>in</strong> Sumatra.<br />
THE IMPORTANCE OF OIL PALM<br />
Of the many land uses found outside protected areas <strong>in</strong> South East Asia, of particular<br />
importance is the rapidly expand<strong>in</strong>g oil palm sector. Oil palm (Elaeis gu<strong>in</strong>eensis) is a palm<br />
native to West Africa, produc<strong>in</strong>g fruit rich <strong>in</strong> oil from which food and non-foodstuffs can be<br />
manufactured. Land used for oil palm is important for conservation for three primary reasons.<br />
Firstly, oil palm represents a major direct threat to many conservation <strong>in</strong>terests. Initially this is<br />
by driv<strong>in</strong>g forest clearance. Oil palm plantations require high ra<strong>in</strong>fall, relatively flat land and an<br />
altitude of below 200m - the exact same conditions as tropical lowland diptocarp forest.<br />
Consequently, most oil palm production is directly or <strong>in</strong>directly responsible for forest<br />
clearance and consequent species loss. Furthermore, due to the rapid degeneration of the<br />
fruit, oil palm fruit cannot be transported easily and is generally produced <strong>in</strong> association with a<br />
mill. The economics of this result <strong>in</strong> large areas (several thousand hectares) of monoculture<br />
rather than small hold<strong>in</strong>gs of crops <strong>in</strong>terspersed with other vegetation. Such large patches of<br />
monoculture are far less compatible with conservation <strong>in</strong>terests that many other agricultural<br />
production methods and consequently the local impact of oil palm production is generally<br />
severe with very few other species surviv<strong>in</strong>g <strong>in</strong> the production areas. F<strong>in</strong>ally, oil palm<br />
production also has an impact on the environment through various production methods, most<br />
notably fires used for land clearance (oil palm concessions have been blamed for many of the<br />
destructive forest fires that have blighted Indonesia <strong>in</strong> recent years) but also through chemical<br />
runoff and other local pollutants.<br />
Secondly, oil palm crop already covers a major proportion of the South East Asian and <strong>in</strong><br />
particular Indonesian landscape and it is expected to <strong>in</strong>crease. S<strong>in</strong>ce the first plantation <strong>in</strong><br />
1911 oil palm has spread, primarily <strong>in</strong> the last ten years, to over 3 million hectares currently<br />
planted <strong>in</strong> Indonesia with Sumatra be<strong>in</strong>g one of the ma<strong>in</strong> producers (Potter & Lee 1999),<br />
(Wakker 1999). Furthermore, oil palm coverage is set to <strong>in</strong>crease. Between 1975 and 1995<br />
output of crude palm oil <strong>in</strong>creased ten times, whilst consumption <strong>in</strong>creases between 1990 and<br />
1996 were higher than any other edible oil (Potter & Lee 1999). Global demand for palm oil is<br />
already at 22.5 million tonnes per year and this is predicted to rise nearly 100% <strong>in</strong> 20 years, to<br />
40 million by 2020 with Indonesia and particularly Sumatra expected to provide at least 50%<br />
of the <strong>in</strong>crease (Glastra et al. 2002). Consequently, 8.7 million hectares are already allocated<br />
for oil palm <strong>in</strong> Indonesia and a further 32 million hectares were under application <strong>in</strong> 1999
(Wakker 1999). By 2012 “Oilworld” predicts oil palm will become the lead<strong>in</strong>g vegetable oil<br />
source (Casson 1999).<br />
Thirdly oil palm is a vital part of the Indonesian economy, br<strong>in</strong>g<strong>in</strong>g <strong>in</strong> 1.4 billion US$ of foreign<br />
exchange <strong>in</strong> 1997 and account<strong>in</strong>g for 31% of agricultural exports (Casson 1999) with the<br />
recent <strong>in</strong>creases <strong>in</strong> demand have made it one of the fastest grow<strong>in</strong>g sections of the<br />
Indonesian economy (Potter & Lee 1999), Oil palm crop therefore has severe impacts on<br />
conservation, already covers much of the Indonesian landscape and is <strong>in</strong>creas<strong>in</strong>g rapidly and<br />
its economic importance mean that it is here to stay whether conservationists agree or not.<br />
Consequently various conservation groups are look<strong>in</strong>g at how to reduce or m<strong>in</strong>imise the<br />
impacts of oil palm production on conservation. Already there is mount<strong>in</strong>g political pressure<br />
on the oil palm <strong>in</strong>dustry and governments, both through groups concerned primarily<br />
conservation implications as well as groups more concerned with the social impacts. For<br />
example, large, politically powerful groups such as the Worldwide Fund for Nature (WWF)<br />
and Friends of the Earth are already work<strong>in</strong>g hard both to limit future forest losses to new oil<br />
palm by encourag<strong>in</strong>g new plantations to be established on low conservation priority land and<br />
also by try<strong>in</strong>g to force environmental responsibility <strong>in</strong>to production through the Round Table<br />
on Susta<strong>in</strong>able Oil Palm, buyer lobby<strong>in</strong>g and other methods. However, solutions are also<br />
required for exist<strong>in</strong>g plantations. Oil palm concessions are not good for conservation but<br />
neither are they entirely <strong>in</strong>compatible. For plantations wish<strong>in</strong>g to reduce their environmental<br />
impact, or for plantations forced to reduce their impact through market forces, basic field data<br />
are required on what and how plantations can be managed to maximise their compatibility<br />
with certa<strong>in</strong> conservation goals. The potential for coexistence with conservation does not<br />
apply to all species, but for some of even the most endangered species there is hope.<br />
TIGERS AND OIL PALM<br />
Tigers are currently fac<strong>in</strong>g a variety of threats throughout their range and many predictions for<br />
the future make grim read<strong>in</strong>g, even <strong>in</strong> their core protected areas. For example, the <strong>Sumatran</strong><br />
tiger (Panthera tigris sumatrae) is listed as “Critical” by the IUCN and is on CITES Appendix I<br />
and is the last rema<strong>in</strong><strong>in</strong>g subspecies <strong>in</strong> Indonesia follow<strong>in</strong>g the shoot<strong>in</strong>g of the last Bal<strong>in</strong>ese<br />
tiger <strong>in</strong> 1937 and the ext<strong>in</strong>ction of the Javan <strong>in</strong> the early late 1970s / early 1980s<br />
(Seidensticker & Suyono 1980). The number thought to rema<strong>in</strong> <strong>in</strong> the wild is about 400 <strong>in</strong><br />
protected areas, with a further 100 estimated <strong>in</strong> other forested areas (Frankl<strong>in</strong> et al. 1999).<br />
However, whilst many populations <strong>in</strong> protected areas are monitored, almost no research has<br />
been carried out <strong>in</strong> areas outside protected areas and the accuracy of these figures is<br />
unknown. Inside the National Parks, <strong>tigers</strong> face a daily risk of habitat loss, prey depletion and<br />
direct poach<strong>in</strong>g and are surrounded by a sea of agricultural plantations, <strong>in</strong>creas<strong>in</strong>g human<br />
populations and decreas<strong>in</strong>g forest coverage. On first appearances the future looks bleak.<br />
However, <strong>tigers</strong> are a surpris<strong>in</strong>gly adaptable species (Sunquist et al. 1999) and apparently<br />
<strong>in</strong>hospitable cleared or agricultural land does not necessarily represent a barrier to <strong>tigers</strong><br />
(Seidensticker 1987). Tigers therefore can and do survive <strong>in</strong> even the most unlikely<br />
environments, <strong>in</strong>clud<strong>in</strong>g an oil palm-forest matrix (Zoological Society of London 2003a).<br />
However, how <strong>tigers</strong> survive <strong>in</strong> such a landscape and to what extent is still largely unknown. If<br />
the future of Indonesia’s last tiger subspecies is to be ensured, its survival <strong>in</strong> the unprotected<br />
matrix of commercial forests, plantations and <strong>in</strong>habited areas that already dom<strong>in</strong>ate its last<br />
refuges must be understood. If the conditions that allow their survival can be identified and<br />
their persistence ensured, the fragile populations <strong>in</strong> protected areas may suddenly look more<br />
hopeful as they are <strong>in</strong>terl<strong>in</strong>ked by their little understood cous<strong>in</strong>s <strong>in</strong> Sumatra’s commercial<br />
landscapes.<br />
THE NEED FOR CONSERVATION A CTION IN COMMERCIAL LANDSCAPES<br />
NGOs need to take a lead <strong>in</strong> the development of conservation <strong>in</strong> commercial landscapes <strong>in</strong><br />
Indonesia for three reasons. Firstly the development of commercial landscapes is a problem<br />
9
for the Indonesian government, torn between the need to earn revenue and develop a country<br />
still suffer<strong>in</strong>g from the impact of the economic crash <strong>in</strong> the late 1990s and concern about loss<br />
of natural resources and <strong>in</strong>ternational op<strong>in</strong>ion. The result<strong>in</strong>g dilemma means the future of the<br />
patchwork of forest and agriculture that covers Sumatra is still very much <strong>in</strong> the balance and<br />
the government is actively look<strong>in</strong>g for viable solutions, although few are available. Second,<br />
the key government organisation responsible for wildlife protection <strong>in</strong> such areas (the KSDA)<br />
is seriously under-funded and frequently overlooked <strong>in</strong> favour of their higher profile colleagues<br />
work<strong>in</strong>g <strong>in</strong> better known reserves and National Parks. Whilst tiger areas <strong>in</strong> Sumatra such as<br />
Ker<strong>in</strong>ci-Seblat National Park and Leuser National Park have been the focus of multi-million<br />
dollar fund<strong>in</strong>g programmes, the less glamorous KSDA struggles to operate on a m<strong>in</strong>imal<br />
budget despite operat<strong>in</strong>g <strong>in</strong> a far larger and possibly more difficult area. Thirdly, an<br />
understandable hesitancy on the part of conservation organisations to engage with<br />
commercial organisations is restrict<strong>in</strong>g the search for solutions and despite the importance of<br />
understand<strong>in</strong>g how <strong>tigers</strong> and other species survive outside protected areas this field is still<br />
relatively unexplored. Consequently there is little experience and few guidel<strong>in</strong>es on how to<br />
develop the conditions that enable coexistence between wildlife and human <strong>in</strong>terests and this<br />
forms a clear management void. It is therefore essential to raise the profile of wildlife <strong>in</strong><br />
commercial landscapes through such projects as this, demonstrat<strong>in</strong>g that the two are not<br />
completely <strong>in</strong>compatible and develop<strong>in</strong>g guidel<strong>in</strong>es for other areas to follow.<br />
10
PROJECT BACKGROUND<br />
THE ZOOLOGICAL SOCIETY OF LONDON<br />
The Zoological Society of London is a registered British charity with three primary areas of<br />
<strong>in</strong>terest:<br />
1. Zoological collections (London Zoo, Whipsnade Safari Park)<br />
2. Scientific research and education (Institute of Zoology)<br />
3. Field conservation (Conservation Programmes)<br />
The Jambi Tiger Project represents all three aspects of the society; <strong>in</strong> the zoo, members of<br />
the public can see <strong>Sumatran</strong> <strong>tigers</strong>, with gate revenues contribut<strong>in</strong>g to core funds that allow<br />
the society to support research and conservation. The Institute of Zoology is an <strong>in</strong>ternationally<br />
renowned centre for research, with specialists <strong>in</strong> large carnivore ecology, conservation<br />
macroecology, genetics and many other discipl<strong>in</strong>es. Conservation Programmes then l<strong>in</strong>ks the<br />
zoo and research aspects whilst also br<strong>in</strong>g<strong>in</strong>g <strong>in</strong> external fund<strong>in</strong>g to form a number of<br />
science-based conservation programmes based <strong>in</strong> situ around the world.<br />
PT ASIATIC PERSADA<br />
PT Asiatic Persada (AP) is an oil palm plantation company orig<strong>in</strong>ally formed <strong>in</strong> 1979 under the<br />
name of PT Bangun Desa Utama, (PT BDU). It subsequently acquired two subsidiaries, PT<br />
Maju Perkasa Sawit (MPS) and PT Jammer Tulen (JT) which were added <strong>in</strong> 1985 and 1986<br />
respectively, tak<strong>in</strong>g the total concession size to 27,000 hectares after which the company<br />
changed its name to Asiatic Persada <strong>in</strong> 1988. Initial oil palm plant<strong>in</strong>gs took place <strong>in</strong> the same<br />
year with the f<strong>in</strong>al plant<strong>in</strong>gs <strong>in</strong> 1996. In 1994 a central process<strong>in</strong>g mill was placed on site and<br />
production started <strong>in</strong> 1997. Pacific Rim Palm Oil Limited, (PRPOL), acquired a majority<br />
hold<strong>in</strong>g of 51% <strong>in</strong> AP <strong>in</strong> early 2000 and took over management <strong>in</strong> February 2000. Major forest<br />
fires <strong>in</strong> 1997, destruction of young plant<strong>in</strong>gs by wild pigs and poor ma<strong>in</strong>tenance of plant<strong>in</strong>gs<br />
dur<strong>in</strong>g the economic crisis reduced the orig<strong>in</strong>al area of cultivated land to approximately<br />
9000ha. PRPOL’s <strong>in</strong>itial work has been to concentrate on the rehabilitation of exist<strong>in</strong>g areas<br />
prior to extend<strong>in</strong>g plant<strong>in</strong>gs. However, the plantation plans to <strong>in</strong>crease production <strong>in</strong> the<br />
com<strong>in</strong>g years from 45,000 tonnes of crude palm oil (CPO) to 63,000 tonnes <strong>in</strong> <strong>2004</strong>. Between<br />
2002-6 the area under cultivation is expected to rise to a f<strong>in</strong>al planted area of 22,953 ha (85%<br />
of the concession). It is with<strong>in</strong> the context of this expansion that develop<strong>in</strong>g management<br />
practices conducive to conservation are so important.<br />
AP and PRPOL have already demonstrated a commitment to environmental issues. AP<br />
operates under ISO 9000 and was recently awarded ISO 14000. As a company, PRPOL are<br />
committed not to develop natural forest with the ability to regenerate, specialised ecosystems<br />
or vegetation that serves important environmental functions. They also aim to promote forest<br />
regeneration, genetic diversity and <strong>in</strong>tend to create a series of <strong>in</strong>terl<strong>in</strong>k<strong>in</strong>g conservation areas<br />
constitut<strong>in</strong>g 15% of the concession with unplanted buffer zones along all rivers. Furthermore,<br />
PRPOL have stated they <strong>in</strong>tend to reduce hunt<strong>in</strong>g and trapp<strong>in</strong>g and implement specific<br />
management schemes for endangered species (PRPOL 2003).<br />
COLLABORATION BETWEEN PT ASIATIC PERSADA AND <strong>ZSL</strong><br />
In 2000 an environmental audit conducted for PRPOL by LTS International Ltd. identified 30<br />
species of conservation concern likely to be present on site <strong>in</strong>clud<strong>in</strong>g <strong>tigers</strong>, clouded leopards,<br />
sun bears, Malay tapirs and crested firebacks. AP then actively approached the conservation<br />
community for help and advice specifically for the tiger issue and the options of translocation,<br />
11
compensation or <strong>in</strong> situ conservation were discussed. Chris Carbone of the Zoological<br />
Society of London (<strong>ZSL</strong>) then visited the site <strong>in</strong> 2001 and a policy of <strong>in</strong> situ conservation was<br />
established. Initially a team of Indonesian conservation scouts was recruited on site and<br />
jo<strong>in</strong>ed by a British volunteer consultant, Robert Gordon. Together they conducted low level<br />
camera trapp<strong>in</strong>g, funded by AP and <strong>ZSL</strong>, which confirmed the existence of at least four adult<br />
<strong>tigers</strong> with<strong>in</strong> the concession and began an anti-poach<strong>in</strong>g programme, remov<strong>in</strong>g snares and<br />
patroll<strong>in</strong>g tiger habitats.<br />
12<br />
RESEARCH PROGRAMME 2002-<strong>2004</strong><br />
The <strong>in</strong>itial results conv<strong>in</strong>ced <strong>ZSL</strong> both of Asiatic’s commitment to the project and of its<br />
importance for tiger conservation and led <strong>in</strong> 2002 to an application to LIPI to carry out<br />
research on <strong>tigers</strong> at Asiatic Persada. LIPI granted a permit for one year (later extended for<br />
two six month periods to two years) and <strong>ZSL</strong> recruited a full time field conservation manager,<br />
obta<strong>in</strong>ed funds from external fund<strong>in</strong>g bodies and brought the project <strong>in</strong>to the <strong>ZSL</strong> Carnivores<br />
and People Programme. The <strong>ZSL</strong> / Asiatic Jambi Tiger Project now has <strong>in</strong> place a total of 20<br />
hard work<strong>in</strong>g and enthusiastic staff dedicated to tiger conservation. The <strong>ZSL</strong> and Asiatic staff<br />
share the workload, assist<strong>in</strong>g each other with the patrols and scientific survey efforts as<br />
necessary. The managerial and <strong>in</strong>frastructural support provided by PT Asiatic Persada is<br />
<strong>in</strong>valuable to the project as a whole, provid<strong>in</strong>g an environment where fieldwork can be carried<br />
out efficiently and safely, with accommodation, access to telephone and email<br />
communications, and account<strong>in</strong>g, secretarial and personnel services all provided. In return,<br />
<strong>ZSL</strong> has <strong>in</strong>vested heavily <strong>in</strong> the project, br<strong>in</strong>g<strong>in</strong>g <strong>in</strong> core fund<strong>in</strong>g as well as grants from<br />
external funders. Together we form an almost unique conservation-<strong>in</strong>dustry partnership that is<br />
collect<strong>in</strong>g some of the first vital data on for tiger conservation outside protected areas <strong>in</strong><br />
Sumatra whilst rapidly ga<strong>in</strong><strong>in</strong>g the attention of the national and <strong>in</strong>ternational communities and<br />
provid<strong>in</strong>g a glimmer of hope for the tiger <strong>in</strong> Indonesia.<br />
LOCATION<br />
PROJECT SITE<br />
The study is located with<strong>in</strong> and around the 27,000 hectare oil palm concession owned by AP<br />
<strong>in</strong> Jambi Prov<strong>in</strong>ce on the island of Sumatra, Indonesia, approximately 90 km from the city of<br />
Jambi. The nearest protected areas are Berbak National Park (119km) and Ker<strong>in</strong>ci-Seblat<br />
National Park (170 km).
HABITAT TYPES<br />
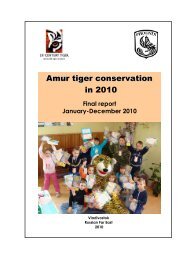
Figure 1 - Location of study site with<strong>in</strong> Sumatra<br />
Not all of the AP concession is covered by oil palm crop. At time of writ<strong>in</strong>g, oil palm covered<br />
about 10,000 ha, or approximately 40% of the concession. The rema<strong>in</strong><strong>in</strong>g 60% consists of<br />
two ma<strong>in</strong> habitat classes:<br />
• “Degraded secondary forest” – areas previously belong<strong>in</strong>g to a logg<strong>in</strong>g<br />
concession and s<strong>in</strong>ce unused. These areas are a macaranga-dom<strong>in</strong>ated low<br />
canopy with a thick under story of g<strong>in</strong>gers, bamboos and palms<br />
• “Scrub” - areas cleared <strong>in</strong> the past for plant<strong>in</strong>g, but s<strong>in</strong>ce re-covered <strong>in</strong> thick,<br />
bamboo-dom<strong>in</strong>ated scrub<br />
13
14<br />
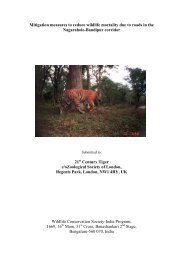
Figure 2 - Broad habitat types with<strong>in</strong> the study area: from top; oil<br />
palm crop, secondary forest, scrub re-growth<br />
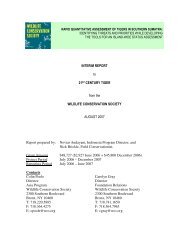
Most of the non-oil palm habitat is concentrated <strong>in</strong> two of the five estates; Jammer Tulen and<br />
Bung<strong>in</strong> (see Figure 3). The current tiger research is based <strong>in</strong> these two estates, although<br />
<strong>report</strong>s of tiger activity have also been made <strong>in</strong> Tanjung Johor estate. The Asialog concession<br />
consists of secondary forest, with a relatively thick undergrowth and broken canopy, but the<br />
height of the canopy is noticeably different from areas with<strong>in</strong> the plantation.
Figure 3 - PT Asiatic Persada and adjo<strong>in</strong><strong>in</strong>g forest concession<br />
show<strong>in</strong>g the five estates and broad habitat types<br />
15
16<br />
PROJECT GOALS AND OBJECTIVES<br />
PROJECT VISION<br />
The project takes the assumptions expla<strong>in</strong>ed <strong>in</strong> the <strong>in</strong>troduction that:<br />
• Successful conservation cannot be conducted <strong>in</strong> isolation from economic development<br />
• Successful conservation requires an effective, coord<strong>in</strong>ated strategy <strong>in</strong> both protected<br />
AND non protected areas<br />
• Commercial landscapes are a key form of unprotected area, represent<strong>in</strong>g both a major<br />
potential threat to many conservation <strong>in</strong>terests as well as a vital component <strong>in</strong><br />
economic development. However, they also have the potential and ability to improve<br />
coexistence with conservation concerns.<br />
The vision of the project is therefore to use good science and good field data to aid the<br />
development of conservation understand<strong>in</strong>g and management <strong>in</strong> unprotected areas <strong>in</strong><br />
particular, allow<strong>in</strong>g the formulation of an <strong>in</strong>tegrated conservation strategy that covers both<br />
traditional protected conservation areas as well as sub-optimal commercial and other<br />
unprotected areas.<br />
Initially the project is focus<strong>in</strong>g upon the particular issues of tiger conservation and oil palm<br />
production. The first objectives therefore focus on try<strong>in</strong>g to understand how and why <strong>tigers</strong><br />
are surviv<strong>in</strong>g <strong>in</strong> commercial landscapes and what can be done to ensure this situation<br />
persists whilst conflict rema<strong>in</strong>s at a m<strong>in</strong>imum.<br />
INITIAL OBJECTIVES<br />
The <strong>in</strong>itial objectives as stated <strong>in</strong> the orig<strong>in</strong>al proposal to LIPI were:<br />
1. Obta<strong>in</strong> measures of the size, distribution and mobility of wild pig / tiger prey<br />
populations<br />
2. Monitor pig diet<br />
3. Measure pig crop damage<br />
4. Estimate f<strong>in</strong>ancial costs of keep<strong>in</strong>g pigs<br />
5. Understand tiger population, feed<strong>in</strong>g and rang<strong>in</strong>g ecology<br />
6. Inform plantation workers on tiger safety<br />
7. Develop recommendations on pig control<br />
8. Understand the impacts of pig cull<strong>in</strong>g for tiger conservation <strong>in</strong> Sumatra<br />
9. Strengthen the capacity of the Indonesian research / conservation team<br />
MODIFIED OBJECTIVES<br />
As time progressed and the project developed, it became clear that these objectives were<br />
rather optimistic for the <strong>in</strong>itial one year time period or even the two years follow<strong>in</strong>g extensions.<br />
In addition, as the project developed and the situation was better understood, new research
angles not considered <strong>in</strong> the orig<strong>in</strong>al proposal became more important and follow<strong>in</strong>g<br />
discussion with LIPI certa<strong>in</strong> aspects of the orig<strong>in</strong>al proposal were altered (for example a radio<br />
track<strong>in</strong>g component became a central objective <strong>in</strong> mid 2003). For the purpose of this <strong>report</strong><br />
the above objectives have therefore been re-grouped <strong>in</strong>to four ma<strong>in</strong> objectives which are then<br />
covered by the results <strong>in</strong> this <strong>report</strong>. These objectives are:<br />
Objective 1: Establish the <strong>in</strong>frastructure, foundations and base data for a long-term<br />
tiger research project (cover<strong>in</strong>g <strong>in</strong>itial objectives 6 and 9)<br />
Establishment of the Jambi Tiger Project was formed by the collaboration of two organisations<br />
with very different objectives that had never worked together before and <strong>in</strong> an area where<br />
almost noth<strong>in</strong>g was known from previous literature. This objective therefore laid the<br />
foundations for all further research through four ma<strong>in</strong> aims:<br />
1. Establishment of a jo<strong>in</strong>t research / conservation programme between <strong>ZSL</strong> and Asiatic<br />
2. Establishment and development of a research team on site<br />
3. Establishment and development of a permanent monitor<strong>in</strong>g / patroll<strong>in</strong>g team on site<br />
4. Establishment of communication and <strong>in</strong>formation channels between conservation and<br />
the plantation<br />
Objective 2: Provision of a basic ecological picture of the conservation status of the<br />
study site (not <strong>in</strong> <strong>in</strong>itial objectives)<br />
As well as a lack of experience <strong>in</strong> NGO-commercial company collaboration, there is almost no<br />
<strong>in</strong>formation on the basic ecological condition of oil palm habitats. This objective therefore<br />
aimed to establish basic <strong>in</strong>formation on:<br />
1. Species diversity<br />
2. Species distribution<br />
3. Threats to conservation<br />
4. Relative abundance<br />
Objective 3: Understand tiger prey ecology and <strong>in</strong>teractions on the site (cover<strong>in</strong>g <strong>in</strong>itial<br />
objectives 1,2,3)<br />
Prey availability has been shown to be one of the key factors <strong>in</strong> determ<strong>in</strong><strong>in</strong>g tiger success<br />
(Karanth & Stith 1999) with a close relationship between prey and tiger density (Sunquist et<br />
al. 1999). Initial data from 2001 suggested that the oil palm supports a particularly high<br />
density of wild pig (Sus scrofa) which benefit from eat<strong>in</strong>g both fallen fruit and sapl<strong>in</strong>g trees<br />
(Ickes 2001). S<strong>in</strong>ce wild pig are a common prey item for <strong>tigers</strong> <strong>in</strong> other studies it has been<br />
hypothesised that their high density around oil palm is key to the survival of <strong>tigers</strong> <strong>in</strong> this study<br />
area. However, pigs are also a key species because they are perceived as a major pest for<br />
the plantation who consequently would like to see their numbers as low as possible. This may<br />
lead to conflict between tiger requirements and commercial requirements. Prey studies are<br />
therefore be<strong>in</strong>g concentrated on the pig population, try<strong>in</strong>g to determ<strong>in</strong>e population size and<br />
extent of damage to the plantation. Assessment of tiger prey status is covered with three ma<strong>in</strong><br />
aims:<br />
1 Calculate the abundance of pigs and other potential tiger prey us<strong>in</strong>g the<br />
plantation habitat<br />
17
18<br />
2 Understand the impacts pigs and other species have on oil palm<br />
production<br />
3 Produce guidel<strong>in</strong>es on the likely impacts of pig-control on tiger<br />
populations together with recommendations for the reduction of conflict.<br />
Objective 3: Understand tiger ecology <strong>in</strong> and around an oil palm concession (cover<strong>in</strong>g<br />
<strong>in</strong>itial objective 5)<br />
Determ<strong>in</strong><strong>in</strong>g the basic population parameters of a tiger population is clearly an essential first<br />
step when beg<strong>in</strong>n<strong>in</strong>g a tiger study. However, we are also particularly <strong>in</strong>terested <strong>in</strong> how the<br />
<strong>tigers</strong> are surviv<strong>in</strong>g <strong>in</strong> a commercial landscape. Such <strong>in</strong>formation is key if we are to ensure<br />
their survival is cont<strong>in</strong>ued. The fourth objective therefore attempts to estimate the number of<br />
<strong>tigers</strong> us<strong>in</strong>g the area and also to trap, radio-collar and track a subsection of the population to<br />
determ<strong>in</strong>e how they use the oil palm and surround<strong>in</strong>g habitats.<br />
1 Estimation of the number of <strong>tigers</strong> us<strong>in</strong>g the plantation<br />
2 Investigate rang<strong>in</strong>g <strong>patterns</strong> and habitat use.<br />
Rema<strong>in</strong><strong>in</strong>g objectives:<br />
Objectives 4,7 and 8 could not be attempted at this time. These are long term<br />
objectives that will require the collection of several years more data before sensible<br />
recommendations and quantifications can be made.
PROJECT FUNDING AND SUPPORT<br />
Dur<strong>in</strong>g the two years of research, the Jambi Tiger Project has received numerous back<strong>in</strong>g:<br />
The project is sponsored <strong>in</strong> Indonesia by LIPI-Biology and was run under a<br />
research permit issued by LIPI (the Indonesian Institute of Sciences).<br />
The project is hosted by PT Asiatic Persada who provide some of the<br />
<strong>in</strong>frastructure on site.<br />
Support has also been given by the PHKA and BKSDA Jambi, with specific<br />
permission for radio collar<strong>in</strong>g granted by the PHKA <strong>in</strong> Jakarta whilst the Jambi<br />
BKSDA are cont<strong>in</strong>ually <strong>in</strong>volved <strong>in</strong> the research, second<strong>in</strong>g two members of staff<br />
to the project.<br />
Core fund<strong>in</strong>g for salaries and some equipment is provided by <strong>ZSL</strong><br />
Fund<strong>in</strong>g for prey research for 2003 and prey research and tiger rang<strong>in</strong>g studies <strong>in</strong><br />
<strong>2004</strong> was granted by the Save the Tiger Fund<br />
Fund<strong>in</strong>g for tiger rang<strong>in</strong>g research for 2003 and <strong>2004</strong> was granted by 21 st<br />
Century Tiger<br />
Fund<strong>in</strong>g for development and tra<strong>in</strong><strong>in</strong>g of an anti-poach<strong>in</strong>g and monitor<strong>in</strong>g team <strong>in</strong><br />
<strong>2004</strong> was granted by the Rh<strong>in</strong>o and Tiger Conservation Fund (RTCF)<br />
Fund<strong>in</strong>g for veter<strong>in</strong>ary and trapp<strong>in</strong>g consultants to jo<strong>in</strong> the project <strong>in</strong> 2003 and<br />
<strong>2004</strong> was granted by the Tufton Charitable Trust.<br />
Additional fund<strong>in</strong>g and support was granted by BSI Travel, the International Zoo<br />
Veter<strong>in</strong>ary Group and Chess<strong>in</strong>gton Zoo.<br />
19
20<br />
GENERAL METHODS<br />
CAMERA TRAPPING<br />
Camera trapp<strong>in</strong>g is an <strong>in</strong>creas<strong>in</strong>gly widely used technique used for monitor<strong>in</strong>g elusive prey <strong>in</strong><br />
habitats where visibility is poor, based on cameras that can be left <strong>in</strong> the field and are<br />
triggered to take a photograph when passed by an animal. The result<strong>in</strong>g photographs can<br />
either give a rough <strong>in</strong>dication of relative abundance (Carbone et al. 2001), an estimate of<br />
m<strong>in</strong>imum population size based on <strong>in</strong>dividual recognition or sophisticated estimates of density<br />
based on capture mark recapture if data are sufficient (Karanth 1995). Cameras are already<br />
<strong>in</strong> use for tiger research e.g. (Karanth & Nichols 1998) but are also used for a variety of other<br />
species <strong>in</strong>clud<strong>in</strong>g bears (Mace et al. 1994), small carnivores (Moruzzi et al. 2002) and<br />
ungulates (O'Brien et al. 2003). In this study, 44 “Camtrakker” cameras were used with<br />
passive sensors (i.e. they are triggered by a comb<strong>in</strong>ation of heat and movement). However,<br />
due to various problems with the cameras (see Problems with “Camtrakker” camera traps<br />
p.90) there were rarely 44 <strong>in</strong> cameras <strong>in</strong> operation simultaneously. The results from the<br />
cameras were used to help achieve all of the project objectives.<br />
Cameras were set up <strong>in</strong> one of two ways. Some cameras, referred to <strong>in</strong> the text as “Tiger<br />
cameras” were used to target <strong>tigers</strong> and were set up on tracks with known tiger activity,<br />
particularly at junctions to maximise the chances of a tiger pass<strong>in</strong>g. Ideally such cameras<br />
should be set up <strong>in</strong> pairs to allow both sides of recognisable animals to be photographed<br />
(Karanth & Nichols 2002); however, the tiger cameras were primarily set up to keep track of<br />
already known <strong>tigers</strong> rather than to survey new areas, therefore cameras were set up s<strong>in</strong>gly<br />
but over a larger area. Other cameras, referred to as “Prey” or “random” cameras were set up<br />
randomly so as to m<strong>in</strong>imise bias <strong>in</strong> the species targeted or the chances of photograph<strong>in</strong>g<br />
<strong>in</strong>dividuals. These cameras were set up <strong>in</strong> grids of sixteen cameras <strong>in</strong> a 4x4 configuration,<br />
with 500m spac<strong>in</strong>g between cameras. The grids were then placed <strong>in</strong> target areas along UTM<br />
gridl<strong>in</strong>es. The actual camera position was flexible with<strong>in</strong> 100m of the randomly chosen po<strong>in</strong>t<br />
to avoid plac<strong>in</strong>g cameras <strong>in</strong> positions with almost no chance of any photographs (for example<br />
<strong>in</strong> the middle of a thick bush) and cameras were placed on animal trails, tracks, water<strong>in</strong>g<br />
holes or cross<strong>in</strong>g po<strong>in</strong>ts with<strong>in</strong> this leeway. In general, cameras placed with<strong>in</strong> the oil palm<br />
could almost always be placed at the exact random po<strong>in</strong>t due to the openness of the habitat,<br />
whereas cameras <strong>in</strong> the thicker scrub often had to be placed away from the pre-chosen po<strong>in</strong>t<br />
due to accessibility.
Figure 4 - Map of study area show<strong>in</strong>g randomly placed camera grids<br />
(blue) and non random tiger cameras (black).<br />
Figure 5 - The two types of camera used on the project: Camtrakkers<br />
(left)and Trailmaster Photoscouts. Follow<strong>in</strong>g persistent theft and<br />
vandalism some cameras are now set up <strong>in</strong> metal cages, sunk <strong>in</strong>to<br />
concrete bases (right).<br />
In almost all cases, cameras were attached to trees about 1-2m from the expected path of the<br />
animal and generally about 30-70cm above the ground (depend<strong>in</strong>g on vegetation length).<br />
Cameras were aimed at an animal the size of a crawl<strong>in</strong>g or crouch<strong>in</strong>g human.<br />
Details on the date of <strong>in</strong>stallation, film name and location were recorded, the camera secured<br />
aga<strong>in</strong>st theft with a cha<strong>in</strong> and a polite notice request<strong>in</strong>g f<strong>in</strong>ders not to disturb was nailed<br />
above the camera. Cameras were generally left 1-2 weeks before check<strong>in</strong>g on the film and<br />
21
attery status, although this varied for cameras expected to run out sooner. In total, “Prey”<br />
cameras were left <strong>in</strong> position for one month, giv<strong>in</strong>g a maximum of 496 trap nights (16x31), if<br />
every camera worked for every night. “Tiger” cameras were more permanent and left<br />
<strong>in</strong>def<strong>in</strong>itely when a successful location was identified.<br />
Once films were f<strong>in</strong>ished they were developed <strong>in</strong> Jambi and the negatives scanned <strong>in</strong>to a<br />
central database. Details of every <strong>in</strong>dividual on each photograph are entered <strong>in</strong>to the<br />
database and all records l<strong>in</strong>ked with the scanned image.<br />
The number of camera trap nights and trapp<strong>in</strong>g rates could then be calculated <strong>in</strong> two ways.<br />
Firstly, a simple count of the number of 24 hour periods each camera was left <strong>in</strong> the field can<br />
be used. However, on many occasions a camera will have run out of film, or batteries, or had<br />
stopped work<strong>in</strong>g whilst still <strong>in</strong> the field. Therefore us<strong>in</strong>g the actual number of trap nights<br />
overestimates the amount of time cameras were actually operational <strong>in</strong> the field. The effective<br />
number of trap nights is therefore calculated as the time when the camera was def<strong>in</strong>itely<br />
work<strong>in</strong>g (see Table 1). Use of a test card when check<strong>in</strong>g cameras is therefore particularly<br />
important s<strong>in</strong>ce if a camera is taken down without check<strong>in</strong>g it is still work<strong>in</strong>g, all of the trap<br />
nights between the last photo and the date taken down have to be discarded as we cannot be<br />
confident the camera was work<strong>in</strong>g dur<strong>in</strong>g this period. All referrals to trap nights <strong>in</strong> this <strong>report</strong><br />
refer to effective trap nights unless stated otherwise.<br />
22<br />
Table 1 - Calculation of effective camera trap nights<br />
Day Event Negative<br />
number<br />
1 Camera set up and tested with test card 1<br />
2 Animal passes 2<br />
4 Animal passes 3<br />
7 Animal passes 4<br />
8 Batteries die<br />
9 Animal passes<br />
10 Camera checked, batteries replaced and camera<br />
tested with test card<br />
5<br />
12 Animal passes 6<br />
14 Animal passes 7<br />
15 Animal passes 8<br />
16 Animal passes 9<br />
20 Animal photo, film ends 10<br />
21 Animal passes<br />
24 Animal passes<br />
25 Camera checked, film replaced, camera tested<br />
with test card<br />
1<br />
27 Animal passes 2<br />
29 Animal passes<br />
31 Camera checked, tested with test card and taken<br />
<strong>in</strong><br />
Actual trap nights 31<br />
Effective trap nights 23<br />
SECONDARY SIGN SURVEYS<br />
Trap nights<br />
7 effective trap<br />
nights<br />
10 effective trap<br />
nights<br />
6 effective trap<br />
nights<br />
Secondary signs (footpr<strong>in</strong>ts, faeces, scrapes etc.) of wildlife are recorded whilst walk<strong>in</strong>g<br />
known distances along man-made tracks. Footpr<strong>in</strong>ts are identified us<strong>in</strong>g a collection of<br />
mammal footpr<strong>in</strong>t ID guides and all tracks are measured to allow later check<strong>in</strong>g for false<br />
identifications. Records are also classed accord<strong>in</strong>g to confidence, with 1 be<strong>in</strong>g a positive<br />
identification and 3 be<strong>in</strong>g a guess.
Figure 6 - Record<strong>in</strong>g tiger tracks (left) and tapir tracks (right)<br />
LINE TRANSECTS<br />
A group of methods commonly used for estimat<strong>in</strong>g wildlife density and abundance are<br />
quadrat-based methods, such as strip transects or po<strong>in</strong>t transects, whereby all <strong>in</strong>dividuals<br />
with<strong>in</strong> a set distance from a transect l<strong>in</strong>e or po<strong>in</strong>t are counted and densities estimated by<br />
divid<strong>in</strong>g the total count by the area surveyed (e.g. see Caro 1999 or Bergstrom & Skarpe<br />
1999). However, such methods assume that all <strong>in</strong>dividuals with<strong>in</strong> the surveyed area are<br />
recorded, an assumption rarely met and impossible to test us<strong>in</strong>g the survey data (Thomas et<br />
al. 200). Furthermore, such methods are wasteful s<strong>in</strong>ce to <strong>in</strong>crease the probability of<br />
record<strong>in</strong>g all <strong>in</strong>dividuals the surveyed area has to be very small, thereby discard<strong>in</strong>g up to 60-<br />
80% of observations (Anderson et al. 2001). An extension of quadrat-based methods are l<strong>in</strong>e<br />
and po<strong>in</strong>t transects <strong>in</strong> which the perpendicular distance to the sight<strong>in</strong>g is recorded (Buckland<br />
et al. 1993). Assum<strong>in</strong>g that objects are spaced randomly with respect to the transect and that<br />
detection probability at distance 0 is 100%, the <strong>in</strong>creas<strong>in</strong>g number of missed sight<strong>in</strong>gs with<br />
<strong>in</strong>creas<strong>in</strong>g distance can be modelled us<strong>in</strong>g a detection function and thus the proportion of<br />
missed sight<strong>in</strong>gs estimated. In this study, l<strong>in</strong>e transects were primarily used for the prey<br />
biology objective, s<strong>in</strong>ce they have been previously used to determ<strong>in</strong>e a pig population <strong>in</strong>dex <strong>in</strong><br />
Australia (Choquenot et al. 1993) and to estimate pig density <strong>in</strong> lowland ra<strong>in</strong>forest <strong>in</strong> Malaysia<br />
(Ickes 2001). However, spotlight transects were also useful for monitor<strong>in</strong>g overall biodiversity<br />
around the plantation.<br />
Transects <strong>in</strong> this study were all conducted by road s<strong>in</strong>ce large distances needed to be<br />
covered to obta<strong>in</strong> any sight<strong>in</strong>gs but also because animals are frequently less concerned by<br />
vehicles compared to humans on foot. Ideally, <strong>in</strong> order to meet the assumption sight<strong>in</strong>gs are<br />
distributed <strong>in</strong>dependently from the transect, transects should not be conducted by road s<strong>in</strong>ce<br />
many animals move away from roads (and a few move towards roads) (Buckland et al. 1993).<br />
However, random transects were not an option even <strong>in</strong> the relatively open oil palm so man<br />
made tracks had to be used. The use of small tracks has been shown not to give significantly<br />
different density estimates <strong>in</strong> other studies (Maddox, <strong>in</strong> prep.). S<strong>in</strong>ce pigs appeared to be<br />
primarily active at night, transects were driven <strong>in</strong> the dark both <strong>in</strong> the even<strong>in</strong>g and early <strong>in</strong> the<br />
morn<strong>in</strong>g. Each transect was driven at a speed of about 15kph with two observers on the<br />
vehicle roof with one 1.5 million candle power spotlight each. For each transect, the distance<br />
driven, time and habitat type were recorded and the perpendicular distance from the transect<br />
to each sight<strong>in</strong>g group noted (Buckland et al. 1993). Distance estimation was made by eye.<br />
23
Ideally, transects would be placed <strong>in</strong> the same areas as alternative survey methods such as<br />
the 2x2 km trapp<strong>in</strong>g areas used for random camera traps (above) and CMR (below).<br />
However, these areas were too small to allow transects to be conducted completely with<strong>in</strong><br />
them therefore transect surveys were conducted at a larger scale and driven throughout the<br />
plantation <strong>in</strong> oil palm, scrub and forest habitats. Placement of transects was heavily biased to<br />
oil palm habitats s<strong>in</strong>ce few roadworthy tracks were available <strong>in</strong> other habitats. The l<strong>in</strong>e<br />
transects are therefore used primarily to support and calibrate other survey methods used <strong>in</strong><br />
the oil palm, although some comparisons of densities <strong>in</strong> other habitats could also be drawn.<br />
Data from transects were entered <strong>in</strong>to a database and analysed us<strong>in</strong>g Distance software<br />
(Laake et al. 1998).<br />
EXPERTISE<br />
24<br />
WILDLIFE CAPTURES<br />
All wildlife captures have been carried out under the supervision of either the Jambi KSDA,<br />
Bart Schleyer (a professional wildlife trapper orig<strong>in</strong>ally from WCS Russia) or Dr. John Lewis<br />
(a veter<strong>in</strong>arian from the International Zoo Veter<strong>in</strong>ary Group specialis<strong>in</strong>g <strong>in</strong> large mammal<br />
anaesthesia). For some captures all three were <strong>in</strong> attendance.
TRAINING<br />
Figure 7 - Bart Schleyer, wildlife trapp<strong>in</strong>g consultant (left) and John<br />
Lewis, veter<strong>in</strong>arian consultant (right)<br />
Bart and John provided <strong>in</strong>tensive tra<strong>in</strong><strong>in</strong>g to both the research team and the KSDA on wildlife<br />
trapp<strong>in</strong>g techniques, dart<strong>in</strong>g and the use of anaesthesia. Initial tra<strong>in</strong><strong>in</strong>g was provided <strong>in</strong> March<br />
2003 at the Veter<strong>in</strong>ary Tra<strong>in</strong><strong>in</strong>g for Wildlife Professionals Workshop <strong>in</strong> Jambi jo<strong>in</strong>tly organised<br />
with FFI Indonesia where lectures were given by John, Bart and veter<strong>in</strong>arians from Taman<br />
Safari with practical demonstrations on zoo animals. Attendees <strong>in</strong>cluded the Jambi KSDA,<br />
PolHut from various National Parks, government veter<strong>in</strong>arians from Jambi and members of<br />
the Jambi Tiger Project and FFI Tiger teams. John then provided further tra<strong>in</strong><strong>in</strong>g on dart gun<br />
use for the Jambi KSDA at Asiatic Persada whilst Bart and John spent a total of 4 months<br />
<strong>in</strong>tensively tra<strong>in</strong><strong>in</strong>g the <strong>ZSL</strong> team. Tom Maddox also attended further tra<strong>in</strong><strong>in</strong>g <strong>in</strong> the UK with<br />
John, assist<strong>in</strong>g with various anaesthetisations at zoos <strong>in</strong> the UK. As a result the team is now<br />
competent at captur<strong>in</strong>g, anaesthetis<strong>in</strong>g, handl<strong>in</strong>g, process<strong>in</strong>g and releas<strong>in</strong>g large mammals.<br />
25
REMOTE DART GUN<br />
26<br />
Figure 8 - John Lewis of the IZVG demonstrat<strong>in</strong>g tiger anaesthesia at<br />
the "Veter<strong>in</strong>ary Tra<strong>in</strong><strong>in</strong>g for Wildlife Professionals" workshop <strong>in</strong><br />
Jambi 2003<br />
Figure 9 - Dart gun tra<strong>in</strong><strong>in</strong>g with the Jambi KSDA<br />
Two capture methods were attempted <strong>in</strong> 2003. The first was a remote-controlled video dartgun,<br />
developed by KORA (a Swiss group deal<strong>in</strong>g with the conservation and management of<br />
carnivores <strong>in</strong> Switzerland) who k<strong>in</strong>dly provided one on loan. This device consists of a<br />
modified dart gun complete with a motion sensor, video monitor, aim<strong>in</strong>g controls and <strong>in</strong>fra-red
light, and reduces the stress experienced by the animal dur<strong>in</strong>g capture to a m<strong>in</strong>imum. The<br />
apparatus is controlled from a hide approximately 200 metres away by a hidden operator. If<br />
any animal walks <strong>in</strong> front of the device, the motion sensor alerts the operator who can then<br />
fire the dart us<strong>in</strong>g the video camera and remote controls to adjust the aim. Experience <strong>in</strong><br />
Switzerland has shown that the darted animal, unaware of a human presence, quickly falls<br />
asleep, usually with<strong>in</strong> metres of the target site.<br />
The remote dart gun was set up between 18:00 and 8:00 the follow<strong>in</strong>g morn<strong>in</strong>g on a total of<br />
14 nights with three to four people monitor<strong>in</strong>g the gun area from the hide us<strong>in</strong>g the video<br />
monitor. It was first tested <strong>in</strong> the Jammer Tulen part of the plantation, then moved to Asialog.<br />
To attract <strong>tigers</strong> to the site, the team tried a variety of bait<strong>in</strong>g methods <strong>in</strong>clud<strong>in</strong>g non-liv<strong>in</strong>g bait<br />
(variously fresh meat, offal, fish and durian fruit), live bait (a young wild pig <strong>in</strong> a tiger-proof<br />
crate), bait trails (1 km blood trails) and an audio predator caller play<strong>in</strong>g record<strong>in</strong>gs of a piglet<br />
and a distressed adult pig.<br />
LEG-HOLD TRAPS<br />
The second method used was the humane leg-hold trap; the most widely used and successful<br />
capture method <strong>in</strong> radio-telemetry studies of <strong>tigers</strong> <strong>in</strong> Russia. These consist of a loop of<br />
cushioned heavy-duty wire laid over a hole <strong>in</strong> the ground and attached to a tree, with tension<br />
provided by a small spr<strong>in</strong>g. They are triggered when weight is placed on a trigger <strong>in</strong> the<br />
middle of the loop. Trigger<strong>in</strong>g the leg-hold was not pa<strong>in</strong>ful and was usually tested on a human<br />
foot.<br />
To m<strong>in</strong>imise stress <strong>in</strong> any capture, the leg-holds were modified, firstly by padd<strong>in</strong>g the footloop<br />
with plastic tub<strong>in</strong>g and secondly by attach<strong>in</strong>g a weight between the loop and the tree.<br />
The weight then acted as a shock absorber, ensur<strong>in</strong>g that any tiger caught could not jar its<br />
weight aga<strong>in</strong>st the tree. Most importantly, all leg-holds were also fitted with trap transmitters.<br />
These gave off a signal when the trap was triggered and ensured the capture team could<br />
respond as quickly as possible and m<strong>in</strong>imise the time the tiger spent <strong>in</strong> the trap. All leg-holds<br />
were also modified so that although any animal could trigger one, only someth<strong>in</strong>g with a paw<br />
the size of a tiger would be caught.<br />
Up to thirteen leg-holds were set at any one time, rema<strong>in</strong><strong>in</strong>g open for up to 24 hours a day. All<br />
were placed <strong>in</strong> the Jammer Tulen area of the plantation on small tracks. Monitor<strong>in</strong>g of the trap<br />
transmitter signals was carried out 24 hours a day by at least two people from a hill that<br />
provided coverage of all transmitters. No attempts were made to attract <strong>tigers</strong> to the leg-hold<br />
traps (although “cat lure” scent was used at some leg-hold sites <strong>in</strong> the hope that it might<br />
<strong>in</strong>terest a pass<strong>in</strong>g tiger). Instead, leg-holds were placed on tracks known through track<br />
records to be used by <strong>tigers</strong>, and branches were used as makeshift road barriers to guide the<br />
<strong>tigers</strong> over the trap site.<br />
27
Figure 10 – Remote dart gun (left) and Bart Schleyer tra<strong>in</strong><strong>in</strong>g <strong>ZSL</strong> and KSDA <strong>in</strong> the<br />
sett<strong>in</strong>g of a leg hold trap (right , below)<br />
LIVE BAITING<br />
Live bait<strong>in</strong>g both <strong>in</strong>creases the chances of a capture and decreases the effort required by<br />
trappers, thus mak<strong>in</strong>g monitor<strong>in</strong>g easier and a response to a trapped animal faster. It<br />
generally works on the basis that a tiger almost always returns to a large kill. Therefore, by<br />
sett<strong>in</strong>g traps around a freshly killed animal the chances of trapp<strong>in</strong>g a return<strong>in</strong>g tiger were<br />
extremely high. A bait animal too large to be consumed <strong>in</strong> one sitt<strong>in</strong>g therefore has to be<br />
used. This is tethered <strong>in</strong> an area with good visibility and access to maximise the chance of a<br />
tiger detect<strong>in</strong>g it and then left with the only visits be<strong>in</strong>g to check, feed and water the prey<br />
animal. Once the animal has been killed by a tiger, a boma (enclosure) is set up around the<br />
carcass, with obvious entrance po<strong>in</strong>ts around which several leg hold traps and trap<br />
transmitters are set. Tigers almost always returned the follow<strong>in</strong>g night after the kill and thus<br />
the capture team can be constantly monitor<strong>in</strong>g the trap transmitter signal with the capture kit<br />
ready for an immediate response.<br />
Initially, live bait<strong>in</strong>g was not considered due to the ethical considerations and because a tiger<br />
had been caught the previous year without live bait. However, <strong>in</strong> 2003 621 trap nights were<br />
required for one tiger. In <strong>2004</strong> we had trapped three times this effort and still had no success<br />
therefore <strong>in</strong> the f<strong>in</strong>al week of the trapp<strong>in</strong>g period live bait trapp<strong>in</strong>g was tried. Firstly a natural<br />
prey species was considered, such as a wild pig. However, the only pigs that we captured<br />
28
would not have been at all manageable – they were large, strong and very aggressive which<br />
would have made daily feed<strong>in</strong>g and especially transportation to the bait site extremely<br />
problematic. S<strong>in</strong>ce the concerns about us<strong>in</strong>g domestic bait were considered to be less<br />
important <strong>in</strong> this particular site s<strong>in</strong>ce domestic cows are not kept <strong>in</strong> the area, a young,<br />
castrated, male cow be<strong>in</strong>g fattened for slaughter was purchased. The cow was extremely<br />
placid and was easily taken and tethered to a site <strong>in</strong> Jammer Tulen. The site (Simpang<br />
Harimau) was chosen for the high level of shade comb<strong>in</strong>ed with be<strong>in</strong>g the meet<strong>in</strong>g po<strong>in</strong>t of<br />
three known tiger trails.<br />
Around the cow (but out of its range) several trap sites were set up <strong>in</strong> a circular configuration,<br />
with areas between the traps blocked off with brushwood, form<strong>in</strong>g a boma with traps at the<br />
entrances. Some of the traps were set on the off-chance that they would catch an <strong>in</strong>com<strong>in</strong>g<br />
tiger, but the advice from Bart was that an <strong>in</strong>com<strong>in</strong>g tiger would generally creep as close as<br />
possible to the prey before rush<strong>in</strong>g it thus mak<strong>in</strong>g it unlikely to get caught <strong>in</strong> a trap, even if it<br />
triggered it. Instead, the expectation was that a capture was most likely on a return<strong>in</strong>g tiger<br />
therefore after a kill the rema<strong>in</strong><strong>in</strong>g traps would be set <strong>in</strong> preparation. As with all leg hold traps,<br />
each was fitted with a trap transmitter.<br />
The cow was then supervised by scouts throughout the day who collected food for it whilst a<br />
water bucket (sunk <strong>in</strong>to the ground to avoid it be<strong>in</strong>g accidentally tipped over) was replenished<br />
twice a day. At night the cow was left alone to maximise the chance of a tiger com<strong>in</strong>g, but<br />
fitted with a radio collar <strong>in</strong> case it was stolen or managed to free itself. Trap transmitters<br />
around the boma were monitored throughout the night. The cow was left for 6 trap nights with<br />
no trapp<strong>in</strong>g success. A small group of dhole (wild dog) approached dur<strong>in</strong>g the day but these<br />
ran away when they saw the scouts guard<strong>in</strong>g the cow. It is not known whether they were<br />
attracted by the cow or were simply mov<strong>in</strong>g down the path (where they have been frequently<br />
photographed <strong>in</strong> the past). The cow has s<strong>in</strong>ce been sold on.<br />
In addition to <strong>ZSL</strong>’s trial with live bait, the Asiatic scouts also set a goat as live bait <strong>in</strong> a<br />
different area. In this case the goat was simply tethered <strong>in</strong> a shaded area near exist<strong>in</strong>g traps<br />
<strong>in</strong> the hope it would <strong>in</strong>crease capture chances. It was observed, fed and watered throughout<br />
the day <strong>in</strong> the same manner as the cow. However, due to the illness of the scout who ran this<br />
operation the goat was only <strong>in</strong> the field for three trap nights with no trapp<strong>in</strong>g success.<br />
Figure 11 - Live bait<br />
29
PANEL TRAPS<br />
The third capture method used was a panel trap method (Sweitzer et al. 1997) whereby large<br />
pen traps are used, capable of trapp<strong>in</strong>g more than one pig <strong>in</strong> each trap. Four of the traps<br />
were placed <strong>in</strong> the 2x2 trapp<strong>in</strong>g sites at sites thought to maximise captures and a variety of<br />
baits were used <strong>in</strong>clud<strong>in</strong>g fruit and vegetables, fish, peanut butter and scraps from the<br />
plantation canteen. When captured, pigs can be isolated one at a time <strong>in</strong> the trap “neck” and<br />
anaesthetised before mark<strong>in</strong>g and releas<strong>in</strong>g.<br />
Bait and<br />
trap door<br />
trigger<br />
30<br />
Hold<strong>in</strong>g pen<br />
Optional division partition<br />
Neck<br />
Trap door<br />
Figure 12 – Completed panel pig trap (without door)
ANAESTHETICS AND MEDICAL DRUGS<br />
A comprehensive anaesthetic, animal health and drug manual was written for the Jambi Tiger<br />
Project by John Lewis with a page devoted to each species as well as detailed advice on<br />
emergency drugs (to stimulate breath<strong>in</strong>g, heart etc.), antibiotics and pa<strong>in</strong>killers. Fund<strong>in</strong>g from<br />
the Tufton Charitable Trust allowed provision of a range of anaesthetics and drugs as well as<br />
a comprehensive capture and animal health kit. In general, <strong>in</strong>jectable drugs used were<br />
“Zolatil” (tiletam<strong>in</strong>e/zolazepam) or “Zolatil” and Medetomad<strong>in</strong>e for most species, ketam<strong>in</strong>e and<br />
Medetomad<strong>in</strong>e for <strong>tigers</strong> and other cat species. Zolatil has wide safety marg<strong>in</strong>s although gives<br />
a slow recovery, medatomad<strong>in</strong>e is a muscle relaxant with a reversal agent that speeds up<br />
<strong>in</strong>duction and makes recovery quicker. Ketam<strong>in</strong>e and Medetomad<strong>in</strong>e is one of the safest drug<br />
comb<strong>in</strong>ations to use for cats s<strong>in</strong>ce it does not cause fitt<strong>in</strong>g as often, a common side effect of<br />
other commonly used drugs (such as xylaz<strong>in</strong>e), and can be used <strong>in</strong> very low volumes which is<br />
much easier to adm<strong>in</strong>ister.<br />
In addition, John Lewis provided a self designed air-based gas anaesthesia kit (Lewis, <strong>2004</strong>).<br />
Runn<strong>in</strong>g on isoflurane and air, this kit (Figure 13) allowed anaesthesia to be prolonged if<br />
necessary and also <strong>in</strong>creased safety (animals could be quickly fitted with a mask more easily<br />
and effectively than <strong>in</strong>jected with more anaesthetic) and also made recovery smoother s<strong>in</strong>ce<br />
gas anaesthetics leave the system almost immediately. Additional important kit <strong>in</strong>clude a<br />
rectal thermometer and pulseoximeter to monitor core temperature, blood oxygen levels and<br />
pulse (also pictured below), laryngoscope, endotracheal tubes and surgical stitch<strong>in</strong>g kits.<br />
Figure 13 - Field anaesthesia kit (left) and <strong>in</strong> use on a juvenile wild<br />
pig (right)<br />
RADIO TRACKING<br />
Radio track<strong>in</strong>g is carried out us<strong>in</strong>g a Telonics receiver and Yagi (directional) antennae. Two<br />
antennae are available; a hand held antennae and a large extendable antennae from Televilt.<br />
Animal locations are determ<strong>in</strong>ed by record<strong>in</strong>g two or more bear<strong>in</strong>gs on the signal. Bear<strong>in</strong>gs<br />
are generally taken from raised areas, rotat<strong>in</strong>g the antennae until the direction of the<br />
strongest signal is obta<strong>in</strong>ed. The bear<strong>in</strong>g of the signal is recorded along with the grid<br />
reference of the location the bear<strong>in</strong>g was taken from. Multiple bear<strong>in</strong>gs from different<br />
locations are taken and “triangulated” us<strong>in</strong>g LOCATE software. If two bear<strong>in</strong>gs are taken, the<br />
<strong>in</strong>tersect shows the approximate location of the signal. If three or more bear<strong>in</strong>gs are taken<br />
LOCATE calculates a 95% confidence ellipse represent<strong>in</strong>g the accuracy of the fix. When<br />
calculat<strong>in</strong>g a range from fixes, the top 5% outliers are removed and a M<strong>in</strong>imum Convex<br />
Polygons drawn around the rema<strong>in</strong><strong>in</strong>g fixes us<strong>in</strong>g the Animal Movement extension of ArcView<br />
3.2.<br />
31
OVERVIEW<br />
32<br />
Figure 14 - Radio track<strong>in</strong>g us<strong>in</strong>g the extendable antennae (left) and<br />
tak<strong>in</strong>g a bear<strong>in</strong>g (right)<br />
DATA HANDLING – PROJECT DATABASE<br />
A central component of the project is the central database, an Access-based database which<br />
holds all of the project data. The database is accessed through a central switchboard menu<br />
which allows users to press a button to enter data, view monthly results etc. All data are<br />
backed up weekly onto an external hard disk and is also replicated on three computers.
DATABASE FUNCTIONS<br />
The database has three functions:<br />
Figure 15 - Ma<strong>in</strong> menu for the database<br />
1. Data storage<br />
2. Facilitation of daily project runn<strong>in</strong>g<br />
3. Results production<br />
The primary function is to be the central <strong>in</strong>formation store for the project. Almost every class<br />
of <strong>in</strong>formation collected dur<strong>in</strong>g the project is stored both on paper datasheets and with<strong>in</strong> the<br />
database. All data entry is conducted through forms, which means data entry po<strong>in</strong>ts can be<br />
written <strong>in</strong> Indonesian whilst the data actually rema<strong>in</strong>s <strong>in</strong> English (see Figure 16 for an<br />
example of camera trap and photo data entry forms).<br />
33
34<br />
Figure 16 - Data entry forms for camera trap runn<strong>in</strong>g and photograph<br />
entry. The forms are <strong>in</strong> two languages and each feeds <strong>in</strong>to multiple<br />
tables<br />
The second function is carried out us<strong>in</strong>g queries and <strong>report</strong>s to provide the project workers<br />
with up to date <strong>in</strong>formation. For example, the database will currently provide:
• Summary of the current positions of all cameras, calculat<strong>in</strong>g the number of days s<strong>in</strong>ce<br />
they were checked, batteries were changed, films changed etc. (Figure 17).<br />
• Photo-database browser, l<strong>in</strong>k<strong>in</strong>g photographs to <strong>in</strong>formation <strong>in</strong> the database therefore<br />
allow<strong>in</strong>g users to browse through all photographs by species etc.<br />
• Summary of transects not yet completed this month as well as which transects were<br />
least recently patrolled.<br />
• Summary of all wildlife sign from the previous month, allow<strong>in</strong>g project workers to keep<br />
up to date on the latest tiger evidence etc. without personally talk<strong>in</strong>g to every scout or<br />
check<strong>in</strong>g every datasheet.<br />
• Last location calculated for each radio tracked animal allow<strong>in</strong>g trackers to head straight<br />
to the last known position before beg<strong>in</strong>n<strong>in</strong>g a new search.<br />
• Summary of current locations of all wildlife traps if <strong>in</strong> use<br />
Figure 17 - Summary of cameras currently <strong>in</strong> the field with options to<br />
pr<strong>in</strong>t the <strong>report</strong> or view a l<strong>in</strong>ked map<br />
The third function is to produce up to date results at the touch of a button, allow<strong>in</strong>g for faster<br />
and more efficient <strong>report</strong> production. This is the last feature to be developed and is still under<br />
construction, but current outputs <strong>in</strong>clude:<br />
• Summaries of all survey effort (kms of transects patrolled, number of photographs taken,<br />
number of radio track<strong>in</strong>g fixes collected, number of animals captured etc.)<br />
• The number of species recorded by camera traps over time<br />
• An up-to-date species list based on all survey methods together with distribution map<br />
• An up-to-date summary of all illegal activity recorded together with a distribution map<br />
• Encounter rates of animal sign and illegal activity over time<br />
• Camera trapp<strong>in</strong>g rates for every species over time<br />
• Up-to-date ranges for radio tracked animals<br />
• Summary of wildlife captures<br />
35
36<br />
Figure 18 – Database results page summaris<strong>in</strong>g all illegal activity<br />
recorded to date
CAMERA RESOURCES AVA ILABLE<br />
SURVEY EFFORT<br />
CAMERA TRAPPING<br />
Table 2- Summary of current camera resources<br />
Owner Camera type Status Number of cameras<br />
APWM Camtrakker Work<strong>in</strong>g 12<br />
<strong>ZSL</strong> Camtrakker Work<strong>in</strong>g 4<br />
<strong>ZSL</strong> Camtrakker Sometimes work<strong>in</strong>g 8<br />
<strong>ZSL</strong> Camtrakker Not Work<strong>in</strong>g 11<br />
<strong>ZSL</strong> Camtrakker Stolen 10<br />
<strong>ZSL</strong> Photoscout Work<strong>in</strong>g 21<br />
<strong>ZSL</strong> Photoscout Stolen 1<br />
There are currently 37 work<strong>in</strong>g cameras on the project, 12 of which are permanently stationed<br />
at known tiger locations around the plantation and run by the scout team. The rema<strong>in</strong><strong>in</strong>g<br />
cameras are used <strong>in</strong> various locations as a survey tool. No camera will work 100% reliably<br />
however there are also 8 cameras that work so irregularly that they cannot be used for survey<br />
work. These are generally just placed <strong>in</strong> likely tiger areas <strong>in</strong> the hope they will be occasionally<br />
triggered when someth<strong>in</strong>g passes.<br />
CAMERA LOCATIONS<br />
Overall, 298 camera locations have been used over the course of the study. Most effort has<br />
been concentrated <strong>in</strong> the areas set aside for conservation and the border<strong>in</strong>g forest habitats<br />
(Figure 19).<br />
37
CAMERA TRAPPING EFFORT<br />
38<br />
Figure 19 - Map of all positions used for camera trapp<strong>in</strong>g. Red<br />
cameras denote randomly chosen locations, black were non<br />
random.<br />
With<strong>in</strong> these locations, 7625 effective camera trap nights have been carried out (although<br />
cameras were <strong>in</strong> the field for over 12000 trap nights), with most effort concentrated <strong>in</strong> 2003<br />
and <strong>2004</strong> when more camera resources were available (Table 3 and Figure 20).<br />
Table 3 - Camera trapp<strong>in</strong>g effort<br />
Forest concession Plantation<br />
Year Non Random Total Non Random Total Grand<br />
random<br />
random<br />
Total<br />
2001 59 0 59 155 155 214<br />
2002 16 0 16 235 59 294 310<br />
2003 634 363 997 2066 1400 3466 4463<br />
<strong>2004</strong> 450 287 737 1364 537 1901 2638<br />
Grand<br />
Total<br />
1159 650 1809 3820 1996 5816 7625
Trap nights<br />
1200<br />
1000<br />
800<br />
600<br />
400<br />
200<br />
0<br />
Figure 20 - Number of camera trap nights conducted over time<br />
J<br />
F<br />
M<br />
A<br />
M<br />
J<br />
J<br />
A<br />
S<br />
O<br />
N<br />
D<br />
J<br />
F<br />
M<br />
A<br />
M<br />
J<br />
J<br />
A<br />
S<br />
O<br />
N<br />
D<br />
J<br />
F<br />
M<br />
A<br />
M<br />
J<br />
J<br />
A<br />
S<br />
O<br />
N<br />
D<br />
J<br />
F<br />
M<br />
A<br />
M<br />
J<br />
J<br />
A<br />
S<br />
O<br />
N<br />
D<br />
PHOTOGRAPHS OBTA INED<br />
2001 2002 2003 <strong>2004</strong><br />
Month<br />
Camera trap nights<br />
Effective camera trap nights<br />
The camera trapp<strong>in</strong>g photograph dataset available for analysis consists of two ma<strong>in</strong> parts:<br />
• Data from 2001-2002 were collected us<strong>in</strong>g 4-6 camera traps on an opportunistic<br />
basis, primarily to confirm the presence or absence of <strong>tigers</strong>. Few details were<br />
recorded on camera trap location or dates therefore photographs could not be “georeferenced”<br />
(matched to a location), thereby restrict<strong>in</strong>g the use of these data for any<br />
detailed analysis (although some could be geo-referenced retrospectively).<br />
• From 2003 fund<strong>in</strong>g was used to purchase a further 38 camera traps which arrived <strong>in</strong><br />
late January. Data were recorded on the positions and dates of use for these<br />
cameras allow<strong>in</strong>g photos to be geo-referenced and the calculation of trap rates.<br />
These data form the basis for most of the analysis <strong>in</strong> this <strong>report</strong>.<br />
• Occasionally more recent photographs are not geo-referenced. This is usually due to<br />
a lag <strong>in</strong> data entry, or due to a m<strong>in</strong>or error <strong>in</strong> data entry which stops the database<br />
match<strong>in</strong>g photographs with location records. We are currently remov<strong>in</strong>g these<br />
glitches.<br />
At the time of writ<strong>in</strong>g 9526 photographs were available for analysis, of which 72% were georeferenced.<br />
Analyses are generally carried out on <strong>in</strong>dependent photographs of <strong>in</strong>dividuals<br />
rather than photographs (for example one photograph may show two different <strong>in</strong>dividuals)<br />
therefore Table 4 gives a breakdown of all photographs and <strong>in</strong>dividuals captured on film. Only<br />
the geo-referenced photographs were used for analyses, apart from when look<strong>in</strong>g at species<br />
presence / absence or numbers of <strong>in</strong>dividual <strong>tigers</strong> on site. A complete list of every subject<br />
photographed can be seen <strong>in</strong> Appendix II.<br />
Table 4 - Breakdown of photographic results<br />
Total photos taken 9526<br />
Total <strong>in</strong>dividuals photographed 11224<br />
Average <strong>in</strong>dividuals per photo 1.18<br />
Total geo-referenced photos 6901<br />
39
40<br />
Total geo-referenced <strong>in</strong>dividual 8269<br />
Overall % photos geo-referenced 72.44<br />
LINE TRANSECTS<br />
So far, data for 76 l<strong>in</strong>e transects cover<strong>in</strong>g a total of 390.3 km conducted over approximately<br />
40 hours are available for analysis. More transects have been carried out but have not yet<br />
been entered <strong>in</strong>to the database. Habitat types for each transect were divided <strong>in</strong>to four habitats<br />
rather than three s<strong>in</strong>ce a large proportion of transects were driven along the forest / oil palm<br />
border road.<br />
Table 5 - Summary of l<strong>in</strong>e transect effort<br />
Habitat Distance driven (km) Number of transects<br />
conducted<br />
Forest 15.3 3<br />
Oil Palm 242.5 37<br />
Oil palm/Forest 89.4 18<br />
Scrub 43.1 18<br />
Total 390.3 76<br />
TRANSECTS WALKED<br />
SECONDARY SIGNS<br />
Records of transects walked have been kept s<strong>in</strong>ce 2002, however, from May <strong>2004</strong> the<br />
transect team was properly equipped us<strong>in</strong>g funds from the RTCF and a new system of data<br />
entry started. Results presented here therefore only represent transects patrolled s<strong>in</strong>ce this<br />
date. Patrols prior to this date have yet to be analysed.<br />
Between May and October, 2665 kms were patrolled on foot or motorbike with<strong>in</strong> the study site<br />
(Table 6)<br />
Table 6 - Patrols conducted between May - October <strong>2004</strong><br />
Forest concession Plantation<br />
Year Month Foot Motorbike Total Foot Motorbike Total Total<br />
<strong>2004</strong> May 68.5 102.4 170.9 244.3 244.3 415.2<br />
June 61.8 116.9 178.7 216.3 12.1 228.4 407.1<br />
July 64.3 201.3 265.6 266.3 28.2 294.5 560.1<br />
August 61.8 144 205.8 266.8 12.1 278.9 484.7<br />
September 51.5 124.7 176.2 209.2 12.1 221.3 397.5<br />
October 48.1 159.2 207.3 180.9 12.1 193 400.3<br />
Total 356 848.5 1204.5 1383.8 76.6 1460.4 2664.9<br />
WILDLIFE SIGNS A ND ILLEGAL ACTIVITY RECORDED<br />
2718 tracks, 3935 faeces, 389 sight<strong>in</strong>gs and 69 illegal activity events have been recorded<br />
s<strong>in</strong>ce the project begun. However, analysis of encounter rates is only conducted on records<br />
collected dur<strong>in</strong>g the patrols shown above.
TRAP NIGHTS<br />
WILDLIFE CAPTURES<br />
Trapp<strong>in</strong>g effort for leg hold traps was far greater <strong>in</strong> <strong>2004</strong> than 2003, with 2276 trap nights <strong>in</strong><br />
three different areas compared to just 621 trap nights <strong>in</strong> one area <strong>in</strong> 2003. Pen traps for pigs<br />
were opened for 60 trap nights. The remote dart gun was operated for 14 trap nights.<br />
Table 7 – Leg hold trapp<strong>in</strong>g effort<br />
ENCOUNTER RATES AND CAPTURES<br />
Year Region Habitat Total trap nights<br />
2003 Jammer Tulen Scrub 621<br />
All 621<br />
<strong>2004</strong> Asialog Forest 744<br />
Bung<strong>in</strong> Scrub 701<br />
Jammer Tulen Scrub 831<br />
All 2276<br />
Encounter rates (animals tripp<strong>in</strong>g traps) were similar <strong>in</strong> both years; <strong>in</strong> 2003 traps were<br />
triggered approximately once every 21 trap nights and <strong>in</strong> <strong>2004</strong> about once every 19 days. The<br />
overall capture rate was higher <strong>in</strong> <strong>2004</strong> with one capture every 380 trap nights compared to<br />
once every 621 trap nights <strong>in</strong> 2003, however, the capture rate for <strong>tigers</strong> was lower <strong>in</strong> <strong>2004</strong><br />
with no <strong>tigers</strong> caught despite 3 near misses and over three times the capture effort.<br />
Table 8 - Summary of trap triggers and captures 2003-<strong>2004</strong><br />
Year Region Species Total Total Encounter rate (Trap Trap rate (Trap<br />
triggers captures nights / trigger) nights / trigger)<br />
2003 J. Tulen B<strong>in</strong>turong 3 0 207 0<br />
Dog 2 0 311 0<br />
Human 6 0 104 0<br />
Leop. Cat 1 0 621 0<br />
Civet 1 0 621 0<br />
Mongoose 1 0 621 0<br />
Pig 5 0 124 0<br />
Porcup<strong>in</strong>e 4 0 155 0<br />
Tiger 3 1 207 621<br />
Unknown 3 0 207 0<br />
Total 29 1 21 621<br />
<strong>2004</strong> Asialog Civet 1 0 677 0<br />
Pig 5 0 135 0<br />
Tapir 2 2 339 339<br />
Tiger 2 0 339 0<br />
Unknown 21 0 32 0<br />
Bung<strong>in</strong> Bearded 1 1 701 701<br />
Pig<br />
Civet 1 1 701 701<br />
Pig 22 0 32 0<br />
Ra<strong>in</strong> 2 1 351 701<br />
Tapir 1 0 701 0<br />
Unknown 15 0 47 0<br />
J. Tulen Dhole 1 0 831 0<br />
Domestic 1 1 831 831<br />
dog<br />
Person 2 0 416 0<br />
Pig 22 0 38 0<br />
41
42<br />
Unknown 21 0 40 0<br />
Vehicle 2 0 416 0<br />
Total 122 6 19 380<br />
In total, 8 captures were made <strong>in</strong> <strong>2004</strong>; 6 from leg hold traps, one by the pen trap for pigs and<br />
one was found alive <strong>in</strong> a hunters’ snare. No <strong>tigers</strong> were caught by the remote dart gun <strong>in</strong><br />
2003, which was almost certa<strong>in</strong>ly due to the failure of all the techniques expected to attract a<br />
tiger to the site, but one tiger was caught us<strong>in</strong>g the leg hold traps after 553 trap nights. This<br />
was fairly quick compared to a comparable capture attempts <strong>in</strong> Russia where <strong>tigers</strong> were<br />
caught once every 2730 trap nights (Goodrich et al. 2001) however, by the end of <strong>2004</strong> the<br />
trapp<strong>in</strong>g rate had fallen to a more comparable 1/2276 trap nights.<br />
Table 9 - Summary of captures <strong>in</strong> 2003-<strong>2004</strong><br />
Year Date Species Name/ID Sex Age Animal Method Region Radio<br />
weight<br />
collared?<br />
2003 02/05/2003 Tiger Slamet Male 6-7 148 Leg Plantation Y<br />
years<br />
hold<br />
<strong>2004</strong> 06/07/<strong>2004</strong> Pig<br />
(wild)<br />
<strong>2004</strong> 13/07/<strong>2004</strong> Malayan<br />
tapir<br />
<strong>2004</strong> 18/07/<strong>2004</strong> Malayan<br />
tapir<br />
<strong>2004</strong> 24/07/<strong>2004</strong> Bearded<br />
pig<br />
<strong>2004</strong> 27/07/<strong>2004</strong> Malayan<br />
tapir<br />
<strong>2004</strong> 09/08/<strong>2004</strong> Bearded<br />
pig<br />
<strong>2004</strong> 27/08/<strong>2004</strong> Pig<br />
(wild)<br />
<strong>2004</strong> 29/08/<strong>2004</strong> Pig<br />
(wild)<br />
Chrispy<br />
Bacon<br />
Stubborn<br />
Mole<br />
Male Young<br />
adult<br />
65 Leg<br />
hold<br />
Female Adult Leg<br />
hold<br />
Sheryl Female Adult Leg<br />
hold<br />
Bellamy Male Young<br />
adult<br />
Shergar Female Young<br />
adult<br />
Beardy Male Young<br />
adult<br />
Sausage Male Young<br />
adult<br />
72 Hunter's<br />
snare<br />
Leg<br />
hold<br />
105 Leg<br />
hold<br />
85 Leg<br />
hold<br />
Midget Male Juvenile 20 Cage<br />
trap<br />
NOTES ON INJURIES DUE TO FOOT LOOP TRAPS<br />
ID marks<br />
Plantation Y 1 Orange<br />
tag on right<br />
ear<br />
Asialog Y White ear<br />
tag <strong>in</strong> left<br />
ear<br />
Asialog N Yellow ear<br />
tag on left<br />
ear<br />
Plantation N Orange ear<br />
tag on right<br />
ear<br />
Plantation Y Yellow ear<br />
tag on right<br />
ear<br />
Plantation N None<br />
Plantation Y Orange ear<br />
tag <strong>in</strong> right<br />
ear<br />
Plantation N Yellow ear<br />
tag on right<br />
ear with "01"<br />
There is some understandable concern over the use of foot loops <strong>in</strong> wildlife capture, however,<br />
on the advice of the trapp<strong>in</strong>g consultant and vet foot loops were still deemed preferable to<br />
cage trapp<strong>in</strong>g due to the higher chance of capture comb<strong>in</strong>ed with the possibly more serious<br />
risks associated with box trapp<strong>in</strong>g (such as tooth breakage). Dur<strong>in</strong>g the two capture periods<br />
only one animal showed serious wounds due to the foot cable. This was the bearded pig that<br />
subsequently died under anaesthetic. It was thought that this pig suffered <strong>in</strong>juries because<br />
• The weight that was meant to act as a shock absorber had become jammed and was<br />
no longer effective<br />
• The trap transmitters were late arriv<strong>in</strong>g. This was one of the traps without a<br />
transmitter and thus the response was not as fast as it should have been.<br />
After John’s arrival (therefore for all captures except the first wild pig and tapir) we had anti<br />
<strong>in</strong>flammatory, pa<strong>in</strong> kill<strong>in</strong>g and long act<strong>in</strong>g antibiotic drugs which were adm<strong>in</strong>istered to all
captures as standard. These would have ensured aga<strong>in</strong>st any discomfort for the subsequent<br />
24 hours follow<strong>in</strong>g capture and <strong>in</strong>fection for up to one week. One wild pig had <strong>in</strong>juries on the<br />
foot that warranted a few stitches. It is thought these were primarily <strong>in</strong>flicted on our approach<br />
and dart<strong>in</strong>g s<strong>in</strong>ce the pig was extremely aggressive and repeatedly charged. This pig<br />
(Sausage) was successfully radio collared and was active until he slipped his collar <strong>in</strong> late<br />
November.<br />
Further evidence of recovery follow<strong>in</strong>g capture can be seen by the tapir “Sheryl”. Although not<br />
radio collared, she has s<strong>in</strong>ce been seen approximately 2.5 km from the capture site with a<br />
scarred but healthy foot (Figure 21)<br />
CASUALTIES<br />
Figure 21 - The captured and tagged tapir that was not radio collared.<br />
The snare scar can be seen on the left front foot.<br />
Unfortunately two fatalities occurred dur<strong>in</strong>g the capture period. The first was a bearded pig<br />
(Beardy, 9 th August) that did not recover from the anaesthetic despite a vet be<strong>in</strong>g present.<br />
Throughout the anaesthetic this <strong>in</strong>dividual’s breath<strong>in</strong>g kept stopp<strong>in</strong>g for no obvious reason.<br />
Each time a few chest compressions started the breath<strong>in</strong>g aga<strong>in</strong> until the f<strong>in</strong>al time when<br />
chest compressions had no effect. Dopram (a breath<strong>in</strong>g stimulant) had no effect.<br />
In addition, one of the radio collared tapir has s<strong>in</strong>ce died. On the 22 nd August after the signal<br />
had been stationary for some time a team went <strong>in</strong> to the forest to look for the animal on foot.<br />
The rema<strong>in</strong>s of the carcass were found but were too decomposed to determ<strong>in</strong>e a cause of<br />
death. Possible causes of death if connected to her capture are:<br />
43
44<br />
Accord<strong>in</strong>g to John, tapirs have complications due to anaesthetic more frequently than<br />
other species and many of the complications are not fully understood. One example<br />
is the tapir digestive system occasionally fails several days after anaesthetic.<br />
The tapir was caught just before John Lewis arrived. She was therefore not<br />
adm<strong>in</strong>istered carprofen (anti-<strong>in</strong>flammatory drug) or antibiotics s<strong>in</strong>ce neither Bart or the<br />
rest of the team had been tra<strong>in</strong>ed <strong>in</strong> their use at that time. It is therefore possible that<br />
the abrasions caused by the foot snare became <strong>in</strong>fected and led to death. All<br />
subsequent captures were given antibiotics.<br />
RADIO TRACKING<br />
S<strong>in</strong>ce the beg<strong>in</strong>n<strong>in</strong>g of the project, six animals have been radio collared, of which three are<br />
still be<strong>in</strong>g tracked (Table 7). 280 trips have been undertaken to obta<strong>in</strong> fixes and of these the<br />
tapir (Shergar) has most successful fixes with 65 locations, over half of which have an error of<br />
below 200 metres.<br />
Table 7 - Summary of all animals collared dur<strong>in</strong>g the study<br />
Species Name Date caught Still collared? Total Total fixes (error % fixes with<br />
fixes
OBJECTIVE 1: INFRASTRUCTURE AND FOUNDATIONS<br />
ESTABLISHMENT OF COLLABORATIVE CONSERVAT ION PROGRAMME<br />
COLLABORATIONS AND PARTNERSHIPS<br />
PT Asiatic Persada<br />
The primary collaboration is with PT Asiatic Persada, and <strong>in</strong> particular with their<br />
environmental unit team headed by Volta Bone. The <strong>ZSL</strong> team is now fully <strong>in</strong>tegrated with the<br />
Asiatic conservation team, with a daily programme comb<strong>in</strong><strong>in</strong>g both research, monitor<strong>in</strong>g and<br />
anti-poach<strong>in</strong>g carried out by both <strong>ZSL</strong> and Asiatic personnel. Asiatic Persada have shown a<br />
strong concern for the <strong>tigers</strong> that use their concession and their commitment to help<strong>in</strong>g the<br />
research has been <strong>in</strong>valuable.<br />
Central government<br />
Some of the projects most important l<strong>in</strong>ks have also been formed with the PHKA <strong>in</strong> Jakarta<br />
and the Jambi KSDA. This has <strong>in</strong>cluded the secondment to two KSDA staff members; one<br />
specialis<strong>in</strong>g <strong>in</strong> anti poach<strong>in</strong>g and law enforcement and the other specialis<strong>in</strong>g <strong>in</strong> research.<br />
Furthermore, the KSDA had a strong <strong>in</strong>volvement <strong>in</strong> the capture periods <strong>in</strong> 2003 and <strong>2004</strong>,<br />
with several members attend<strong>in</strong>g a tra<strong>in</strong><strong>in</strong>g workshop held jo<strong>in</strong>tly by Flora and Fauna<br />
International and <strong>ZSL</strong> which <strong>in</strong>cluded specialist tra<strong>in</strong><strong>in</strong>g <strong>in</strong> the use of their capture equipment<br />
from Dr. John Lewis of the International Zoo Veter<strong>in</strong>ary Group. KSDA participation cont<strong>in</strong>ued<br />
when the capture period began, with one member usually on site when capture attempts were<br />
started.<br />
Figure 22 - KSDA jo<strong>in</strong><strong>in</strong>g <strong>in</strong> with the capture period <strong>in</strong> <strong>2004</strong><br />
45
46<br />
PT Asialog<br />
Figure 23 - Head of KSDA Jambi visits the project <strong>in</strong> <strong>2004</strong><br />
L<strong>in</strong>ks have also been established with the conservation unit with<strong>in</strong> PT Asialog, the owners of<br />
the forest concession neighbour<strong>in</strong>g the plantation. The <strong>tigers</strong> that use the plantation land<br />
frequently move <strong>in</strong>to this forest area. Asialog also have a conservation team and one member<br />
of their team was seconded to the <strong>ZSL</strong> team between October 2002 and mid 2003,<br />
contribut<strong>in</strong>g to all research activities. Furthermore, with the support of the Asialog<br />
conservation manager, <strong>ZSL</strong> have expanded many of their research activities <strong>in</strong>to Asialog, with<br />
regular transect and camera trap surveys carried out <strong>in</strong> areas border<strong>in</strong>g the plantation.<br />
Local residents<br />
The term “local residents” could be used to cover a wide range of people <strong>in</strong>habit<strong>in</strong>g the area.<br />
Presently, <strong>ZSL</strong> is concentrat<strong>in</strong>g on build<strong>in</strong>g relationships <strong>in</strong> particular with the Orang Bath<strong>in</strong><br />
Sembilan (OBS) people who live and work both with<strong>in</strong> the plantation and also with<strong>in</strong> the forest<br />
concession. The OBS are commonly acknowledged as the <strong>in</strong>digenous community. Several<br />
OBS members are presently employed with<strong>in</strong> the conservation team by Asiatic Persada, two<br />
of whom work primarily with <strong>ZSL</strong>. Furthermore, regular trips have been made by one member<br />
of the team to OBS dwell<strong>in</strong>gs teach<strong>in</strong>g children to read <strong>in</strong> an attempt to learn more about their<br />
lifestyle and needs as preparation for future community conservation plans.
Local government<br />
Figure 24 - Suku Anak Dalam / Orang Bath<strong>in</strong> Sembilan <strong>in</strong> plantation<br />
Efforts have also been made to publicise the project with the local government, with meet<strong>in</strong>gs<br />
with the head of the Jambi Forestry Department followed by a socialisation meet<strong>in</strong>g for<br />
members of local government, press and other organisations at the Forestry Offices <strong>in</strong> <strong>2004</strong><br />
Other organisations<br />
Figure 25 - Socialisation meet<strong>in</strong>g, Jambi<br />
Over the past year <strong>ZSL</strong> have been build<strong>in</strong>g relationships with several other Indonesian and<br />
Asian-based conservation organisations. These <strong>in</strong>clude Flora and Fauna International with<br />
whom a jo<strong>in</strong>t veter<strong>in</strong>ary tra<strong>in</strong><strong>in</strong>g workshop was held <strong>in</strong> March 2003 <strong>in</strong> Jambi, WWF Indonesia<br />
and Malaysia (with a visit to the Malaysian WWF tiger-oil palm project <strong>in</strong> 2002), Conservation<br />
International and representatives of the Perbak<strong>in</strong> hunt<strong>in</strong>g club. <strong>ZSL</strong> has also been <strong>in</strong><br />
communication with Birdlife Indonesia and Birdlife International who also have <strong>in</strong>terests <strong>in</strong> the<br />
Jambi area.<br />
47
LOGISTICS<br />
48<br />
Vehicles<br />
After purchas<strong>in</strong>g a Daihatsu <strong>in</strong> 2002 this was sold aga<strong>in</strong> <strong>in</strong> <strong>2004</strong> (as unsuitable for off-road<br />
work) and a second hand Toyota Land Cruiser and new Mitsubishi L200 were purchased with<br />
money donated by the Rh<strong>in</strong>o and Tiger Conservation Fund, Save the Tiger Fund and 21 st CT.<br />
In addition, <strong>ZSL</strong> owns three Honda motorbikes for local travel.<br />
Accommodation and office<br />
Figure 26 – Project vehicles. The Daihatsu (far left) was sold and the<br />
Toyota (centre) purchased <strong>in</strong>stead. The Mitsubishi (right) was<br />
funded by STF and 21 st CT donations<br />
Accommodation and office space was <strong>in</strong>itially provided by PT Asiatic Persada for all project<br />
members. However, <strong>in</strong> late 2003 CDC, the then parent company of PRPOL, donated funds<br />
for a new, purpose built office with<strong>in</strong> the plantation, <strong>in</strong>clud<strong>in</strong>g accommodation for project<br />
members and guests, work, storage and social areas. The plantation cont<strong>in</strong>ues to provide<br />
accommodation for three project members elsewhere.<br />
Figure 27 - New purpose built multi-use build<strong>in</strong>g and office (centre,<br />
below left) and orig<strong>in</strong>al office (below right)
Other<br />
The project is also fully equipped with a VHF radio system, a complete wildlife capture and<br />
anaesthesia kit, desktop computer, GPS and various other equipment.<br />
TEAM MEMBERS<br />
RESEARCH PROGRAMME TEAM<br />
S<strong>in</strong>ce the beg<strong>in</strong>n<strong>in</strong>g of the project <strong>in</strong> 2001 a number of employees have worked on the<br />
project. The project was <strong>in</strong>itiated by Dr. Chris Carbone with field work conducted by Rob<br />
Gordon. In 2002 Sarah Christie <strong>in</strong>corporated the project <strong>in</strong>to the <strong>ZSL</strong> Carnivores and People<br />
Programme of which she is the head. Dr. Tom Maddox was appo<strong>in</strong>ted project manager and<br />
was <strong>in</strong>itially assisted by Satrio Wijamukti who then left <strong>in</strong> late 2003. Also <strong>in</strong> 2003 Elva Gemita<br />
and Adnun Salampessy jo<strong>in</strong>ed the project as research assistants and <strong>in</strong> <strong>2004</strong> Dolly Priatna<br />
was appo<strong>in</strong>ted co-project manager and Rio Arman jo<strong>in</strong>ed as the project mechanic.<br />
Figure 28 – Current <strong>ZSL</strong> research team. Clockwise from top left;<br />
Tom Maddox, Dolly Priatna, Adnun Salampessy, Rio Arman, Elva<br />
Gemita<br />
49
TASKS<br />
The primary tasks of the research team are to complete the objectives of the research<br />
programme, therefore they are <strong>in</strong> charge of most camera trapp<strong>in</strong>g, wildlife captures and radio<br />
track<strong>in</strong>g, wildlife surveys, data entry and analysis.<br />
TRAINING<br />
We are attempt<strong>in</strong>g to get the research team as much tra<strong>in</strong><strong>in</strong>g as possible. Satrio Wijamukti<br />
received a three month English course <strong>in</strong> 2003 and <strong>in</strong> late <strong>2004</strong> Elva Gemita was accepted<br />
onto a conservation course <strong>in</strong> the UK (start<strong>in</strong>g 2005). Adnun Salampessy attended a field<br />
tra<strong>in</strong><strong>in</strong>g course with the <strong>Sumatran</strong> Tiger Conservation Project <strong>in</strong> Way Kambas <strong>in</strong> late <strong>2004</strong>. All<br />
team members have also received <strong>in</strong>tensive tra<strong>in</strong><strong>in</strong>g on wildlife trapp<strong>in</strong>g, handl<strong>in</strong>g and<br />
anaesthesia from both a highly experienced tiger trapper and large cat anaesthetist and the<br />
research team now forms a capable wildlife handl<strong>in</strong>g unit, each member with a specific role.<br />
COLLABORATION<br />
The Jambi KSDA have been <strong>in</strong>vited to second a technician to the research team on a full time<br />
basis and funds are available to f<strong>in</strong>ance this. Due to other duties a technician has not been<br />
available full time but technicians have jo<strong>in</strong>ed the research team on regular occasions.<br />
50
STRUCTURE<br />
ANTI-POACHING AND WILDLIFE MONITORING (APWM) TEAM<br />
Figure 29- The APWM team and Wildan, team leader<br />
The Anti Poach<strong>in</strong>g and Wildlife Monitor<strong>in</strong>g (APWM) team consists of 14 staff jo<strong>in</strong>tly run by<br />
Asiatic Persada and <strong>ZSL</strong> (Table 8). Staff come jo<strong>in</strong>tly from a plantation background and/or<br />
come from local Orang Bath<strong>in</strong> Sembilan communities. Scouts are divided <strong>in</strong>to four teams of<br />
three and all teams work on a staggered 4 day week (2 days daylight patrols, 1 night patrol, 1<br />
day off) mean<strong>in</strong>g that at least one team is on patrol every day and night.<br />
TASKS<br />
Table 8- Management of the APWM scout team<br />
Asiatic <strong>ZSL</strong><br />
Recruitment Work plan<br />
Salaries Tra<strong>in</strong><strong>in</strong>g<br />
Day to day management Equipment<br />
The work plan and tasks are summarised <strong>in</strong> a separate document written by <strong>ZSL</strong> <strong>in</strong> Bahasa<br />
and English. It describes the job titles, responsibilities, timetables and daily work protocol. The<br />
primary task of the APWM unit is to conduct daily patrols, both for base monitor<strong>in</strong>g of wildlife<br />
<strong>in</strong> the area and to serve as an anti-poach<strong>in</strong>g / illegal activity unit. The secondary task is to<br />
provide backup to the research team and the Asiatic environmental unit when extra staff are<br />
required.<br />
Patrols are known as “Patrol transects” as they are a comb<strong>in</strong>ation of scientific data collection<br />
and conservation patroll<strong>in</strong>g and protection. Conducted on a daily basis, with the scout leader<br />
giv<strong>in</strong>g daily <strong>in</strong>structions they <strong>in</strong>volve ,Asiatic-employed conservation scouts walk<strong>in</strong>g or rid<strong>in</strong>g<br />
(on motorbike) pre-def<strong>in</strong>ed transect routes start<strong>in</strong>g at 7am. Marked routes are patrolled by a<br />
s<strong>in</strong>gle three-man team with each team carry<strong>in</strong>g a patrol pack consist<strong>in</strong>g of datasheets,<br />
mammal track guide and a tape measure. The patrol programme was developed by <strong>ZSL</strong> and<br />
51
the head of the AP scouts, cover<strong>in</strong>g almost all non-palm areas with<strong>in</strong> Asiatic Persada and<br />
border<strong>in</strong>g areas of Asialog. The patrol transects cover a network of over 170 km of mapped<br />
tracks and paths. Each transect patrol has been classified accord<strong>in</strong>g to priority, with high<br />
priority transects visited every two weeks and low priority transects once per month.<br />
Dur<strong>in</strong>g the transect data are collected on:<br />
52<br />
• Direct observations of all species of <strong>in</strong>terest (record<strong>in</strong>g species, number <strong>in</strong> group and<br />
perpendicular distance to the centre of the transect l<strong>in</strong>e (Buckland et al. 1993))<br />
• Animal footpr<strong>in</strong>ts, faeces or other secondary sign (record<strong>in</strong>g footpr<strong>in</strong>t measurements<br />
and collect<strong>in</strong>g all carnivore and pig faeces for dietary analysis) (Karanth & Nichols<br />
2002)<br />
• Any signs of illegal activity (such as snares, bird trapp<strong>in</strong>g, forest clearance with the<br />
relevant authorities <strong>in</strong>formed if necessary). If possible, traps etc. are removed<br />
immediately.<br />
Night patrols are conducted rather differently with more emphasis on anti-poach<strong>in</strong>g than<br />
wildlife data collection. Scouts always use motorbikes at night and patrol a flexible route. Any<br />
poach<strong>in</strong>g activities encountered that can be dealt with immediately are done so, however<br />
most require the call<strong>in</strong>g of Asiatic security to assist with action.<br />
All data are entered <strong>in</strong>to the project database through one scout dedicated to computer work.<br />
EQUIPMENT<br />
Figure 30 – APWM Scouts on patrol<br />
The team is now operational and fully equipped us<strong>in</strong>g fund<strong>in</strong>g from the Rh<strong>in</strong>o and Tiger<br />
Conservation Fund and some contributions from Asiatic Persada. Each team is now equipped<br />
with two motorbikes, a VHF radio, GPS, field cloth<strong>in</strong>g and datasheets.<br />
TRAINING<br />
A two week offsite tra<strong>in</strong><strong>in</strong>g programme has been booked with the <strong>Sumatran</strong> Tiger<br />
Conservation Project <strong>in</strong> Way Kambas for December <strong>2004</strong>.
COLLABORATION<br />
As with the research team, the Jambi KSDA have been <strong>in</strong>vited to second a PolHut member of<br />
staff to the APWM team to assist with authority on patrols. A s<strong>in</strong>gle ranger has been assigned<br />
to the team and is generally present 1-2 days per week.<br />
NEWSLETTERS<br />
COMMUNICATION AND IN FORMATION<br />
The ma<strong>in</strong> channel of news from the conservation unit to the local communities is through a<br />
monthly newsletter. Asiatic Persada already has notice boards set up all over the concession<br />
and every month <strong>ZSL</strong> summarise news on latest wildlife sight<strong>in</strong>gs, current activities, guests<br />
and other news on a s<strong>in</strong>gle leaflet that is displayed <strong>in</strong> all notice boards. The newsletters are<br />
also used for advis<strong>in</strong>g communities on wildlife conflict. For example, a recent newsletter<br />
(Figure 31) tackled the problem of a sun bear that was raid<strong>in</strong>g poultry <strong>in</strong> one village. The letter<br />
gave <strong>in</strong>formation about sun bears, what to do if encountered and what the course of action<br />
be<strong>in</strong>g followed was. <strong>ZSL</strong> eventually assisted the KSDA to capture the bear and translocate it.<br />
MEETINGS<br />
Close communication is cont<strong>in</strong>ued with the Asiatic and PRPOL environmental staff, as well as<br />
with the Asiatic estates, security and human resources managers. When environmental<br />
meet<strong>in</strong>gs are held with<strong>in</strong> the company <strong>ZSL</strong> is always represented.<br />
53
54<br />
Figure 31 - Recent newsletter giv<strong>in</strong>g <strong>in</strong>formation on bear conflict <strong>in</strong><br />
the plantation
SPECIES LIST<br />
OBJECTIVE 2: BASE ECOLOGICAL DATA<br />
SPECIES DIVERSITY<br />
Basic monitor<strong>in</strong>g of the diversity of species with<strong>in</strong> the study area is carried out us<strong>in</strong>g the<br />
results from the camera traps and secondary sign surveys. The results show that despite<br />
be<strong>in</strong>g a work<strong>in</strong>g, commercial landscape, the oil palm / scrub / forest matrix is still able to<br />
support a wide range of mammal species <strong>in</strong>clud<strong>in</strong>g several endangered species <strong>in</strong>clud<strong>in</strong>g the<br />
tiger, clouded leopard, fish<strong>in</strong>g cat and dhole. Overall, 44 mammals have been recorded on<br />
the project, with a further two species (fly<strong>in</strong>g lemur - Cynocephalus variegates and western<br />
tarsier - Tarsius bancanus) hav<strong>in</strong>g been recorded on orig<strong>in</strong>al audit species lists but not yet<br />
confirmed by this project. Although no effort has been made to systematically survey other<br />
taxa, a few <strong>in</strong>terest<strong>in</strong>g species have been recorded opportunistically, <strong>in</strong>cluded the crestless<br />
fireback (Lophura erythrophthalma) which was photographed for the first time ever, as far as we are<br />
aware. In general, camera traps were good at record<strong>in</strong>g species presence for medium and<br />
large sized mammals, however they failed to record most of the arboreal species which were<br />
either picked up by patrol transects or secondary sign surveys. Secondary sign surveys also<br />
picked up most species, but could not be used to dist<strong>in</strong>guish between some species (such as<br />
the three civet species) and aga<strong>in</strong> missed most arboreal species. Direct sight<strong>in</strong>gs recorded<br />
the fewest species but were useful for add<strong>in</strong>g arboreal, nocturnal species. A summary of all<br />
species recorded through these methods is shown <strong>in</strong> Table 9. At this stage, efforts were only<br />
made to record the diversity of larger mammals, however, small mammals recorded have<br />
been <strong>in</strong>cluded whilst non mammalian species are shown <strong>in</strong> species of reptile and birds<br />
recorded dur<strong>in</strong>g the surveys are <strong>in</strong>cluded for <strong>in</strong>terest <strong>in</strong> Table 10.<br />
Table 9 - Complete list of mammal species recorded s<strong>in</strong>ce the project<br />
started<br />
Order Common name Lat<strong>in</strong> name Photos Faeces Footpr<strong>in</strong>ts Sight<strong>in</strong>gs Total<br />
Artiodactyla<br />
Carnivora<br />
Bearded pig Sus barbatus 343 5 348<br />
Greater mouse<br />
deer<br />
Tragulus napu 12 12 1 25<br />
Lesser mouse<br />
deer<br />
Tragulus javanicus 14 14<br />
Muntjac Muntiacus muntjak 87 16 185 7 295<br />
Pig (wild) Sus scrofa 1607 391 34 48 2080<br />
Sambar Cervus unicolor 22 19 467 6 514<br />
Banded palm civet Diplogale derbyanus 2 18 20<br />
B<strong>in</strong>turong Artictis b<strong>in</strong>turong 10 1 11<br />
Clouded leopard Neofelis nebulosa 2 1 10 13<br />
Common palm Paradoxurus<br />
56 1007 167 46 1276<br />
civet<br />
hermaphroditus<br />
Dhole Cuon alp<strong>in</strong>us 26 2 6 1 35<br />
Domestic cat Felis cattus 8 34 42<br />
Domestic dog Canis familiaris 54 5 3 62<br />
Fish<strong>in</strong>g cat Prionailurus viverr<strong>in</strong>us 1 1<br />
Golden cat Catopuma temm<strong>in</strong>ckii 1 1 2<br />
Hairy nosed otter Lutra sumatrana 1 2 3<br />
Leopard cat Prionailurus<br />
bengalensis<br />
199 607 204 88 1098<br />
Malay Civet Vivera tangalunga 17 3 2 22<br />
Short tailed<br />
mongoose<br />
Herpestes brachyurus 24 11 2 37<br />
Small-clawed otter Aonyx c<strong>in</strong>erea 1 1<br />
55
Smooth otter Lutra perspicillata 3 7 2 12<br />
Sun bear Helarctos malayanus 27 3 73 3 106<br />
Tiger Panthera tigris 104 24 159 4 291<br />
Yellow throated<br />
marten<br />
Martes flavigula 1 1 2<br />
Insectivora Moon rat Ech<strong>in</strong>osorex<br />
2 2<br />
56<br />
gymnurus<br />
Perissodactyla Malayan tapir Tapirus <strong>in</strong>dicus 54 4 344 1 403<br />
Pholidota Pangol<strong>in</strong> Manis javanica 3 6 1 10<br />
Primate Agile gibbon Hylobates agilis 2 2<br />
Banded langur Presbytis melalophos 1 10 11<br />
Long tailed<br />
macaque<br />
Macaca fascicularis 36 6 8 50<br />
Pig tailed<br />
Macaca nemestr<strong>in</strong>a 694 2 12 13 721<br />
Rodentia<br />
Scandentia<br />
macaque<br />
Siamang Hylobates syndactylus 5 5<br />
Silvered langur Presbytis cristata 1 1<br />
Slow loris Nycticebus coucang 2 2<br />
Black-eared Nannosciurus<br />
1 1<br />
pigmy squirrel melanotis<br />
East Asian<br />
porcup<strong>in</strong>e<br />
Hystrix brachyura 135 3 143 6 287<br />
Long tailed<br />
porcup<strong>in</strong>e<br />
Trichys fascilulata 1 1 2<br />
Plante<strong>in</strong> squirrel Calosciurus notatus 8 8<br />
Prevost’s squirrel Calosciurus prevostii 3 3<br />
Red giant fly<strong>in</strong>g<br />
squirrel<br />
Petaurista petaurista 1 1<br />
Red sp<strong>in</strong>y rat Maxomys surifer 1 1<br />
Three striped<br />
ground squirrel<br />
Lariscus <strong>in</strong>sig<strong>in</strong>s 4 4<br />
Common tree Tupaia glis 1 3 4<br />
shrew<br />
Large tree shrew Tupaia tana 2 2<br />
Total 3545 2106 1872 312 7835
Figure 32 - Examples of mammalian species recorded by camera<br />
trap. From top left; tiger, tapir, dhole, sun bear, clouded leopard,<br />
leopard cat, banded palm civet, pangol<strong>in</strong><br />
57
58<br />
Table 10 - Non mammalian species recorded dur<strong>in</strong>g the study<br />
Class: Common name Lat<strong>in</strong> name Photos Faeces Footpr<strong>in</strong>ts Sight<strong>in</strong>gs Total<br />
Birds<br />
Argus pheasant Argusianus argus 5 5<br />
Black eagle Ict<strong>in</strong>aetus malayensis 1 1<br />
Crested partridge Rollulus rouloul 4 4<br />
Crested serpent<br />
eagle<br />
Spilornis cheela 1 1<br />
Crestless Fireback Lophura<br />
3 3<br />
erythrophthalma<br />
Dollar bird Eurystomus orientalis 1 1<br />
Emerald Dove Chalcophaps <strong>in</strong>dica 4 4<br />
Greater coucal Centropus s<strong>in</strong>ensis 1 1<br />
Jungle fowl Gallus gallus 126 1 1 128<br />
Rh<strong>in</strong>oceros Hornbill Buceros rh<strong>in</strong>oceros 2 4 6<br />
White breasted<br />
waterhen<br />
Amauronis phoenicurus 13 13<br />
White throated<br />
k<strong>in</strong>gfisher<br />
Halcyon smyrnensis 1 1<br />
Wreathed hornbill Aceros undulatus 1 1 2<br />
Reptiles Blood python Python curtus<br />
brongersmai<br />
1 1<br />
Monitor lizard Varanus salvator 5 1 10 7 23<br />
Reticulated python Python reticulartis 1 1<br />
Total 164 2 10 20 196<br />
SPECIES IDENTIFICATION RATE<br />
Figure 33 - Non mammalian species of <strong>in</strong>terest recorded dur<strong>in</strong>g the<br />
study. From left: Argus pheasant, Crestless fireback, monitor lizard<br />
Present<strong>in</strong>g a list of species also requires some sort of explanation of how complete it is. To<br />
check this, the rate of species identification (based on camera trap data only) was exam<strong>in</strong>ed<br />
to look for any levell<strong>in</strong>g off. The results (Figure 34) show that data based on all camera trap<br />
records levelled off at just over 40 species at around 6000 trap nights, with no new species<br />
recorded for the last 2000 trap nights. This suggests that the species list is fairly<br />
comprehensive for species that can be surveyed by camera trap. However, camera<br />
placement was important; with non randomly placed cameras levell<strong>in</strong>g off at about 30<br />
species, whilst <strong>in</strong>sufficient effort had been carried out on randomly placed cameras to see a<br />
levell<strong>in</strong>g off. Furthermore, although records from the plantation appear to have levelled off,<br />
records from the forest may not have levelled off by the end of trapp<strong>in</strong>g.
All species<br />
45<br />
40<br />
35<br />
30<br />
25<br />
20<br />
15<br />
10<br />
5<br />
Figure 34 - Rate of species identification with <strong>in</strong>creas<strong>in</strong>g trapp<strong>in</strong>g<br />
effort<br />
0<br />
0 1000 2000 3000 4000 5000 6000 7000 8000 9000<br />
WILDLIFE SIGN ENCOUNTER RATES<br />
Trap nights<br />
All cameras<br />
Randomly placed cameras<br />
Non randomly placed cameras<br />
Cameras <strong>in</strong> plantation<br />
Cameras <strong>in</strong> forest<br />
Figure 35 – Long tailed porcup<strong>in</strong>e, the last species to have been<br />
picked up by camera trapp<strong>in</strong>g after approximately 6000 trap nights<br />
RELATIVE ABUNDANCE<br />
Although patrols have been conducted for nearly three years, the patrol team was not<br />
equipped or <strong>in</strong>structed properly until funded with Rh<strong>in</strong>o and Tiger Conservation Fund money<br />
<strong>in</strong> early <strong>2004</strong>. Therefore, although data area available for previous months, analysis has thus<br />
far only been conducted s<strong>in</strong>ce May <strong>2004</strong>. Encounter rates are therefore fairly low for all<br />
wildlife sign, however, tracks are commonly seen and sufficient data are available to show<br />
encounter rates for some of the large mammals of primary <strong>in</strong>terest (Figure 36 to Figure 38). In<br />
addition, results are presented for faeces collected <strong>in</strong> recent months<br />
59
Tracks per km patrolled<br />
Tracks per km patrolled<br />
60<br />
0.05<br />
0.045<br />
0.04<br />
0.035<br />
0.03<br />
0.025<br />
0.02<br />
0.015<br />
0.01<br />
0.005<br />
0.25<br />
0.2<br />
0.15<br />
0.1<br />
0.05<br />
0<br />
0<br />
Figure 36 - Encounter rates of tiger tracks <strong>2004</strong><br />
May June July August September October November<br />
<strong>2004</strong><br />
Figure 37 – Encounter rates of Malayan tapir tracks <strong>2004</strong><br />
May June July August September October November<br />
<strong>2004</strong><br />
Forest concession<br />
Plantation<br />
Forest concession<br />
Plantation
Tracks per km patrolled<br />
0.08<br />
0.07<br />
0.06<br />
0.05<br />
0.04<br />
0.03<br />
0.02<br />
0.01<br />
0<br />
Figure 38 - Encounter rates of Sun Bear tracks <strong>2004</strong><br />
May June July August September October November<br />
<strong>2004</strong><br />
Table 11 - Faeces collected dur<strong>in</strong>g patrol transects<br />
Species Faeces<br />
collected<br />
Clouded leopard 1<br />
Common palm civet 11<br />
Dhole 1<br />
East Asian<br />
1<br />
porcup<strong>in</strong>e<br />
Leopard cat 10<br />
Malayan tapir 1<br />
Muntjac 1<br />
Pig (wild) 11<br />
Pig tailed macaque 1<br />
Sambar 3<br />
Tiger 7<br />
Total 48<br />
Forest concession<br />
Plantation<br />
At this stage wildlife sign data are too sparse for any thorough analysis, however, as patrols<br />
cont<strong>in</strong>ue and data are entered <strong>in</strong>to the database, encounter rates are updated cont<strong>in</strong>uously<br />
allow<strong>in</strong>g project managers to monitor evidence of various species on a daily basis and by mid<br />
2005 the dataset will be able to be used to analyse variation <strong>in</strong> abundance over time.<br />
PHOTOGRAPHIC PROPORT IONS<br />
A second analysis of abundance can be carried out by simply look<strong>in</strong>g at the proportions of<br />
photographs of each subject. This analysis needs no <strong>in</strong>formation on camera locations or time<br />
<strong>in</strong> the field but assumes that the chance of photograph<strong>in</strong>g each species is equal relative to its<br />
abundance. By restrict<strong>in</strong>g the results to the top ten most photographed subjects from all<br />
photos (Figure 39) shows that wild pig were the most photographed species, although two<br />
endangered species (tiger and tapir) were <strong>in</strong> the top ten.<br />
61
62<br />
Bearded pig, 10%<br />
Figure 39 - Top ten most photographed mammals (exclud<strong>in</strong>g people)<br />
East Asian porcup<strong>in</strong>e, 4%<br />
Domestic dog, 1%<br />
Common palm civet, 2%<br />
Leopard cat, 6%<br />
Malayan tapir, 2%<br />
Pig tailed macaque, 21%<br />
Muntjac, 3%<br />
Tiger, 3%<br />
USE OF RANDOM / NON RANDOM CAMERAS<br />
Pig (wild), 48%<br />
A more robust analysis of abundance requires the calculation of trapp<strong>in</strong>g rates (photos /<br />
camera / 24 hours). Ideally surveys of abundance would only use randomly placed cameras<br />
to m<strong>in</strong>imise bias <strong>in</strong>troduced by selective camera placement (for example, a good place for<br />
photograph<strong>in</strong>g <strong>tigers</strong> may be a bad place for photograph<strong>in</strong>g pigs). However, random camera<br />
trapp<strong>in</strong>g was not an effective tool for all species, therefore <strong>in</strong>itial abundance estimates were<br />
compared between random and non random cameras. S<strong>in</strong>ce random camera trapp<strong>in</strong>g has<br />
not been carried out at all times on the project, data were restricted to 2003 and <strong>2004</strong> when<br />
comparisons could be made. The trap nights available for comparison are summarised <strong>in</strong><br />
Table 12 whilst Table 13 shows the trapp<strong>in</strong>g rates for each of the ma<strong>in</strong> species, illustrated by<br />
Figure 40.<br />
Table 12 - Trap nights used for comparison of random / random<br />
trapp<strong>in</strong>g rates<br />
Non random trap<br />
nights<br />
4515<br />
Random 2587<br />
Total trap nights 7101<br />
Table 13 - Overall trapp<strong>in</strong>g rates from random and non random<br />
placed cameras<br />
Non random cameras Random cameras All cameras<br />
Species Photos Photos/trap night Photos Photos/trap night Photos Photos/trap night<br />
Wild pig 856 0.19 669 0.26 1525 0.215<br />
Person (unknown) 691 0.15 31 0.01 722 0.102<br />
Pig tailed macaque 512 0.11 114 0.04 626 0.088<br />
Bearded pig 235 0.05 108 0.04 343 0.048
Leopard cat 124 0.03 45 0.02 169 0.024<br />
Muntjac 34 0.01 48 0.02 82 0.012<br />
Tiger 68 0.02 0 0.00 68 0.010<br />
Tapir 49 0.01 0 0.00 49 0.007<br />
Dhole 25 0.01 1 0.00 26 0.004<br />
Sun bear 21 0.00 3 0.00 24 0.003<br />
Sambar 16 0.00 5 0.00 21 0.003<br />
Photos / trap night<br />
0.30<br />
0.25<br />
0.20<br />
0.15<br />
0.10<br />
0.05<br />
0.00<br />
Wild pig Person<br />
(unknown)<br />
Figure 40 - Overall trapp<strong>in</strong>g rates from randomly and non-randomly<br />
placed cameras 2003-4<br />
Pig tailed<br />
macaque<br />
Non random cameras<br />
Random cameras<br />
All cameras<br />
Bearded pig Leopard cat Muntjac Tiger Tapir Dhole Sun bear Sambar<br />
These results confirm that wild pig are the most abundant species on site, with bearded pig<br />
the next most common likely tiger prey species. The most abundant carnivore was the<br />
leopard cat, although <strong>tigers</strong> were the most abundant endangered species. However,<br />
comparison of the random and non-random survey methods show that random cameras are<br />
not suitable for all species; people, <strong>tigers</strong>, tapir and dhole were all either never or rarely<br />
photographed by randomly placed cameras, presumably because of a preference for walk<strong>in</strong>g<br />
on large tracks or roads. However, wild pigs and muntjac were more common on randomly<br />
placed cameras, suggest<strong>in</strong>g an aversion to tracks. Unfortunately rely<strong>in</strong>g on placed cameras<br />
for trapp<strong>in</strong>g rates for <strong>tigers</strong> and other species <strong>in</strong>cludes an <strong>in</strong>herent bias (for example, some<br />
people may be better at choos<strong>in</strong>g tiger locations that others) and restricts further comparisons<br />
between species surveyed by random cameras, however, s<strong>in</strong>ce no data were available for<br />
species such as <strong>tigers</strong> from random cameras there was no other choice.<br />
RELATIVE ABUNDANCE OVER TIME<br />
Dur<strong>in</strong>g the project a worry<strong>in</strong>g decrease <strong>in</strong> the number of tiger photographs has been noted<br />
over time. To <strong>in</strong>vestigate this further, trapp<strong>in</strong>g rates were calculated on a monthly basis for<br />
<strong>tigers</strong>, as well as some of the other large mammals of conservation <strong>in</strong>terest, their likely ma<strong>in</strong><br />
prey (pigs) and human activity to <strong>in</strong>vestigate whether there really was a decl<strong>in</strong>e over time and<br />
any possible reasons.<br />
63
Photos / camera trap night<br />
Photos / trap night<br />
64<br />
0.20<br />
0.18<br />
0.16<br />
0.14<br />
0.12<br />
0.10<br />
0.08<br />
0.06<br />
0.04<br />
0.02<br />
0.00<br />
0.08<br />
0.07<br />
0.06<br />
0.05<br />
0.04<br />
0.03<br />
0.02<br />
0.01<br />
0.00<br />
Figure 41 - Variation <strong>in</strong> overall trapp<strong>in</strong>g rate over time for <strong>tigers</strong><br />
January<br />
February<br />
March<br />
April<br />
May<br />
June<br />
July<br />
August<br />
September<br />
October<br />
November<br />
December<br />
January<br />
February<br />
March<br />
April<br />
May<br />
June<br />
July<br />
August<br />
September<br />
October<br />
November<br />
December<br />
January<br />
February<br />
March<br />
April<br />
May<br />
June<br />
July<br />
August<br />
September<br />
October<br />
November<br />
December<br />
January<br />
February<br />
March<br />
April<br />
May<br />
June<br />
July<br />
August<br />
September<br />
October<br />
November<br />
December<br />
2001 2002 2003 <strong>2004</strong><br />
Figure 42 - Variation <strong>in</strong> overall trapp<strong>in</strong>g rate over time for sun bears<br />
January<br />
February<br />
March<br />
April<br />
May<br />
June<br />
July<br />
August<br />
September<br />
October<br />
November<br />
December<br />
January<br />
February<br />
March<br />
April<br />
May<br />
June<br />
July<br />
August<br />
September<br />
October<br />
November<br />
December<br />
January<br />
February<br />
March<br />
April<br />
May<br />
June<br />
July<br />
August<br />
September<br />
October<br />
November<br />
December<br />
January<br />
February<br />
March<br />
April<br />
May<br />
June<br />
July<br />
August<br />
September<br />
October<br />
November<br />
December<br />
2001 2002 2003 <strong>2004</strong>
0.05<br />
0.05<br />
0.04<br />
0.04<br />
0.03<br />
0.03<br />
0.02<br />
0.02<br />
0.01<br />
0.01<br />
0.00<br />
Figure 43 - Variation <strong>in</strong> overall trapp<strong>in</strong>g rate over time for tapirs<br />
January<br />
February<br />
March<br />
April<br />
May<br />
June<br />
July<br />
August<br />
September<br />
October<br />
November<br />
December<br />
January<br />
February<br />
March<br />
April<br />
May<br />
June<br />
July<br />
August<br />
September<br />
October<br />
November<br />
December<br />
January<br />
February<br />
March<br />
April<br />
May<br />
June<br />
July<br />
August<br />
September<br />
October<br />
November<br />
December<br />
January<br />
February<br />
March<br />
April<br />
May<br />
June<br />
July<br />
August<br />
September<br />
October<br />
November<br />
December<br />
Trapp<strong>in</strong>g rate (photos/trap night)<br />
0.04<br />
0.03<br />
0.03<br />
0.02<br />
0.02<br />
0.01<br />
0.01<br />
0.00<br />
2001 2002 2003 <strong>2004</strong><br />
Figure 44 - Variation <strong>in</strong> overall trapp<strong>in</strong>g rate over time for dhole<br />
January<br />
February<br />
March<br />
April<br />
May<br />
June<br />
July<br />
August<br />
September<br />
October<br />
November<br />
December<br />
January<br />
February<br />
March<br />
April<br />
May<br />
June<br />
July<br />
August<br />
September<br />
October<br />
November<br />
December<br />
January<br />
February<br />
March<br />
April<br />
May<br />
June<br />
July<br />
August<br />
September<br />
October<br />
November<br />
December<br />
January<br />
February<br />
March<br />
April<br />
May<br />
June<br />
July<br />
August<br />
September<br />
October<br />
November<br />
December<br />
2001 2002 2003 <strong>2004</strong><br />
65
Photos / camera trapp<strong>in</strong>g night<br />
Photos / camera trapp<strong>in</strong>g night<br />
66<br />
0.80<br />
0.70<br />
0.60<br />
0.50<br />
0.40<br />
0.30<br />
0.20<br />
0.10<br />
0.00<br />
0.35<br />
0.30<br />
0.25<br />
0.20<br />
0.15<br />
0.10<br />
0.05<br />
0.00<br />
Figure 45 - Variation <strong>in</strong> trapp<strong>in</strong>g rate over time for wild pigs<br />
January<br />
February<br />
March<br />
April<br />
May<br />
June<br />
July<br />
August<br />
September<br />
October<br />
November<br />
December<br />
January<br />
February<br />
March<br />
April<br />
May<br />
June<br />
July<br />
August<br />
September<br />
October<br />
November<br />
December<br />
January<br />
February<br />
March<br />
April<br />
May<br />
June<br />
July<br />
August<br />
September<br />
October<br />
November<br />
December<br />
January<br />
February<br />
March<br />
April<br />
May<br />
June<br />
July<br />
August<br />
September<br />
October<br />
November<br />
December<br />
2001 2002 2003 <strong>2004</strong><br />
Figure 46 - Variation <strong>in</strong> trapp<strong>in</strong>g rate over time for bearded pigs<br />
January<br />
February<br />
March<br />
April<br />
May<br />
June<br />
July<br />
August<br />
September<br />
October<br />
November<br />
December<br />
January<br />
February<br />
March<br />
April<br />
May<br />
June<br />
July<br />
August<br />
September<br />
October<br />
November<br />
December<br />
January<br />
February<br />
March<br />
April<br />
May<br />
June<br />
July<br />
August<br />
September<br />
October<br />
November<br />
December<br />
January<br />
February<br />
March<br />
April<br />
May<br />
June<br />
July<br />
August<br />
September<br />
October<br />
November<br />
December<br />
2001 2002 2003 <strong>2004</strong>
Trapp<strong>in</strong>g rate (photos / trap night)<br />
Trapp<strong>in</strong>g rate (photos / trap night)<br />
0.03<br />
0.03<br />
0.02<br />
0.02<br />
0.01<br />
0.01<br />
0.00<br />
1.40<br />
1.20<br />
1.00<br />
0.80<br />
0.60<br />
0.40<br />
0.20<br />
0.00<br />
Figure 47 - Variation <strong>in</strong> trapp<strong>in</strong>g rate over time for Sambar<br />
January<br />
February<br />
March<br />
April<br />
May<br />
June<br />
July<br />
August<br />
September<br />
October<br />
November<br />
December<br />
January<br />
February<br />
March<br />
April<br />
May<br />
June<br />
July<br />
August<br />
September<br />
October<br />
November<br />
December<br />
January<br />
February<br />
March<br />
April<br />
May<br />
June<br />
July<br />
August<br />
September<br />
October<br />
November<br />
December<br />
January<br />
February<br />
March<br />
April<br />
May<br />
June<br />
July<br />
August<br />
September<br />
October<br />
November<br />
December<br />
2001 2002 2003 <strong>2004</strong><br />
Figure 48 - Variation <strong>in</strong> trapp<strong>in</strong>g rate over time for people (not<br />
<strong>in</strong>clud<strong>in</strong>g conservation / plantation workers)<br />
Forest concession Plantation<br />
January<br />
February<br />
March<br />
April<br />
May<br />
June<br />
July<br />
August<br />
September<br />
October<br />
November<br />
December<br />
January<br />
February<br />
March<br />
April<br />
May<br />
June<br />
July<br />
August<br />
September<br />
October<br />
November<br />
December<br />
January<br />
February<br />
March<br />
April<br />
May<br />
June<br />
July<br />
August<br />
September<br />
October<br />
November<br />
December<br />
January<br />
February<br />
March<br />
April<br />
May<br />
June<br />
July<br />
August<br />
September<br />
October<br />
November<br />
December<br />
2001 2002 2003 <strong>2004</strong><br />
The results (Figure 41 to Figure 48) appear to confirm that trapp<strong>in</strong>g rates of <strong>tigers</strong> have<br />
<strong>in</strong>deed drastically decl<strong>in</strong>ed over the course of the project with trapp<strong>in</strong>g rates fall<strong>in</strong>g almost to<br />
zero <strong>in</strong> <strong>2004</strong>. The reasons are not immediately clear. Trapp<strong>in</strong>g rates for other large mammals<br />
such as tapir and sun bear are <strong>in</strong>termittent but do not show any downward trend, nor do the<br />
likely ma<strong>in</strong> prey species, pigs. Data for sambar are poor but aga<strong>in</strong> there is no obvious decl<strong>in</strong>e.<br />
Data for humans are less clear. In 2003 human presence appeared very high, particularly <strong>in</strong><br />
the forest border<strong>in</strong>g the plantation. Numbers are lower aga<strong>in</strong> <strong>in</strong> <strong>2004</strong>, but with a similar peak<br />
of activity around the end of the wet season (April). The data do not show, therefore, a clear<br />
67
correlation between human presence and tiger decl<strong>in</strong>e, although the high activity levels <strong>in</strong><br />
2003 at the same time tiger trapp<strong>in</strong>g rates fell markedly warrant further <strong>in</strong>vestigation.<br />
However, although worry<strong>in</strong>g for tiger conservation on site, data from wildlife signs should also<br />
be considered. These show that <strong>tigers</strong> are still present <strong>in</strong> and around the plantation and have<br />
been recorded every month for which data were available (see Figure 36) suggest<strong>in</strong>g that<br />
<strong>tigers</strong> have not completely disappeared from the area. Possible alternative explanations<br />
<strong>in</strong>clude lower photographic rates for reasons unrelated to density (problems with camera<br />
traps, decreased use of trails by <strong>tigers</strong>) or possibly localised movement of <strong>tigers</strong> away from<br />
previously good camera trapp<strong>in</strong>g areas.<br />
An <strong>in</strong>terest<strong>in</strong>g aside is the apparent <strong>in</strong>crease <strong>in</strong> both dhole and bearded pigs over time.<br />
Bearded pigs were not evident <strong>in</strong> the area at all before 2003, but after this time have been<br />
photographed extremely frequently. This may <strong>in</strong>dicate a movement <strong>in</strong>to the area by the pigs,<br />
which are known for migratory behaviour. Dhole, as an endangered species, are possibly<br />
even more <strong>in</strong>terest<strong>in</strong>g. Also appear<strong>in</strong>g <strong>in</strong> mid 2003 they have gradually <strong>in</strong>creased <strong>in</strong> trapp<strong>in</strong>g<br />
frequency and are now fairly commonly sighted <strong>in</strong> the two plantation set aside areas<br />
(although almost never <strong>in</strong> the forest concession). This is comparable to similar medium-sized<br />
carnivore species elsewhere such as wild dogs <strong>in</strong> Africa, which also appear to do better <strong>in</strong><br />
marg<strong>in</strong>al / disturbed habitats and <strong>in</strong> particular <strong>in</strong> the absence of larger carnivores. The<br />
presence of dhole may well be a direct result of the absence of tiger.<br />
68<br />
ABSOLUTE DENSITY ESTIMATES FROM LINE TRANSECTS<br />
For a m<strong>in</strong>ority of species, actual densities could be calculated from l<strong>in</strong>e transects. These<br />
could only be calculated for the most commonly sighted species (recommended to be >50<br />
sight<strong>in</strong>gs (Buckland et al. 1993) but <strong>in</strong> this <strong>report</strong> analysis has also been carried out for<br />
species with fewer sight<strong>in</strong>gs s<strong>in</strong>ce the results still had fairly low coefficients of variation) were<br />
analysed us<strong>in</strong>g Distance (Laake et al. 1998) to provide actual estimates of density for the<br />
most common species. Densities could be calculated for wild pigs, leopard cats, domestic<br />
cats and common palm civets. S<strong>in</strong>ce pigs are dealt with <strong>in</strong> a separate section, only the results<br />
for the small carnivores are presented here (Figure 49). Interest<strong>in</strong>gly, the results for leopard<br />
cats differ from the relative estimates from camera traps, with l<strong>in</strong>e transects show<strong>in</strong>g leopard<br />
cats to be most abundant <strong>in</strong> the oil palm crop and absent from the forest. This is likely to be a<br />
reflection of the difficulty of conduct<strong>in</strong>g l<strong>in</strong>e transects <strong>in</strong> forests where perpendicular visibility<br />
was almost nil.
Density (no./sq.km.)<br />
14<br />
12<br />
10<br />
8<br />
6<br />
4<br />
2<br />
0<br />
Leopard cats<br />
Figure 49 - Estimated densities (+/- SE) of small carnivores <strong>in</strong>side<br />
and outside the oil palm crop, calculated from night transect data<br />
Domestic cats<br />
Common palm civets<br />
Forest Oil Palm Oil palm / forest Scrub<br />
Habitat<br />
SPECIES DISTRIBUTION INSIDE AND OUTSIDE THE PLANTATION<br />
SPECIES PRESENCE / A BSENCE<br />
Contrary to some expectations, many species were recorded with<strong>in</strong> the plantation concession<br />
as well as outside <strong>in</strong> the forest which may be considered more “natural” habitat. Of the<br />
mammals, 83% of species recorded <strong>in</strong> the area were recorded <strong>in</strong>side the plantation<br />
concession. Some species were only recorded <strong>in</strong>side the plantation, with the forest only<br />
hous<strong>in</strong>g 88% of species recorded <strong>in</strong> the area. Species found only outside the plantation<br />
concession <strong>in</strong>cluded clouded leopard, banded palm civet, long tailed porcup<strong>in</strong>e and Argus<br />
pheasant, although all of these species were represented by just one or two photographs <strong>in</strong><br />
total. Percentages for birds and reptiles are also given (Table 14) although few conclusions<br />
can be drawn given the survey methods used.<br />
Table 14 - Percentage of total known species <strong>in</strong> the area recorded<br />
<strong>in</strong>side and outside the plantation concession<br />
Forest<br />
concession<br />
Plantation<br />
Birds 40% 70%<br />
Mammals 88% 83%<br />
Reptiles 50% 100%<br />
Although many species are surviv<strong>in</strong>g with<strong>in</strong> the plantation, this is not to say oil palm itself is<br />
good for conservation or even comparable to forest habitat. The reason species are surviv<strong>in</strong>g<br />
<strong>in</strong> the concession is because there are non oil palm habitats rema<strong>in</strong><strong>in</strong>g, as shown by Table<br />
15, which shows that of the mammals recorded <strong>in</strong> the concession, 52% of them were never<br />
recorded <strong>in</strong> oil palm, but only 4% (a s<strong>in</strong>gle species – the common tree shrew – and not from a<br />
taxa comprehensively surveyed) were unique to oil palm. Species occurr<strong>in</strong>g with<strong>in</strong> the<br />
69
concession but not with<strong>in</strong> oil palm crop itself <strong>in</strong>clude the tiger, tapir, pangol<strong>in</strong> and dhole. For<br />
distribution maps of all the major families, please see Appendix III.<br />
70<br />
Table 15 - Proportion of species with<strong>in</strong> the plantation concession<br />
recorded <strong>in</strong> the oil palm crop itself and <strong>in</strong> non oil palm habitats (from<br />
camera trap data only)<br />
Non oil<br />
palm<br />
Oil palm<br />
Birds 83% 50%<br />
Mammals 96% 48%<br />
Reptiles 100% 0%<br />
RELATIVE ABUNDANCE INSIDE AND OUTSIDE THE PLANTATION CONCESSION<br />
Camera trapp<strong>in</strong>g rates were also used to compare abundance <strong>in</strong> the plantation concession<br />
with the forest concession border<strong>in</strong>g it. Ideally, only data from the randomly placed cameras<br />
would have been used to survey all species to remove the chance of any accidental bias<br />
<strong>in</strong>troduced by plac<strong>in</strong>g cameras, however exam<strong>in</strong>ation of random vs. non random cameras<br />
(above) showed that some of the larger mammals could not be realistically surveyed us<strong>in</strong>g<br />
randomly placed cameras. Therefore, trapp<strong>in</strong>g rates for compar<strong>in</strong>g between sites were<br />
calculated us<strong>in</strong>g random cameras only if possible but non random cameras for species that<br />
were not sensitive to the random method (Table 17).<br />
Table 16 - Trapp<strong>in</strong>g effort used to <strong>in</strong>vestigate differences <strong>in</strong>side and<br />
outside the plantation<br />
Random Non<br />
random<br />
Forest 650 1159<br />
Plantation 1196 3820<br />
Table 17 - Comparison of trapp<strong>in</strong>g rates <strong>in</strong>side and outside the<br />
plantation concession<br />
Species Forest Plantation Survey method<br />
Person (unknown) 0.25 0.12 Non random<br />
Wild pig 0.03 0.33 Random<br />
Pig tailed<br />
0.04 0.05 Random<br />
macaque<br />
Leopard cat 0.06 0.02 Random<br />
Bearded pig 0.01 0.05 Random<br />
Tiger 0.02 0.02 Non random<br />
Muntjac 0.02 0.02 Random<br />
Tapir 0.03 0.01 Non random<br />
Sun bear 0.01 0.00 Non random<br />
Sambar 0.01 0.00 Non random<br />
Dhole 0.00 0.01 Non random
Trapp<strong>in</strong>g rate<br />
0.35<br />
0.30<br />
0.25<br />
0.20<br />
0.15<br />
0.10<br />
0.05<br />
0.00<br />
Person<br />
(unknown)<br />
Figure 50 - Relative abundance of species <strong>in</strong>side and outside the<br />
plantation concession<br />
Wild pig Pig tailed<br />
macaque<br />
Forest<br />
Plantation<br />
Leopard cat Bearded pig Tiger Muntjac Tapir Sun bear Sambar Dhole<br />
Although not yet compared statistically, the results show that <strong>patterns</strong> are beg<strong>in</strong>n<strong>in</strong>g to<br />
emerge for some species. Firstly, it is clear that species do not <strong>in</strong> general prefer the more<br />
“natural” forest habitat compared to the scrubby plantation habitats. The only species more<br />
commonly photographed <strong>in</strong> the forest were man (primarily Suku Anak Dalam), tapir and<br />
leopard cat (although leopard cats were an unusual example – compar<strong>in</strong>g randomly placed<br />
camera results showed more cats <strong>in</strong> the plantation and none <strong>in</strong> the forest where as the nonrandom<br />
cameras showed more <strong>in</strong> the forest; presumably leopard cats were just more likely to<br />
use paths <strong>in</strong> the thicker forest). However, several species appear to show a preference for the<br />
plantation. Most noticeable is the much higher trapp<strong>in</strong>g rates of the pig species <strong>in</strong>side the<br />
plantation compared to the forest concession. But of the species of conservation <strong>in</strong>terest,<br />
dhole are also much more commonly photographed <strong>in</strong> the plantation and <strong>tigers</strong> were slightly<br />
more common <strong>in</strong>side the plantation too.<br />
THREATS TO CONSERVAT ION<br />
S<strong>in</strong>ce patrols began, illegal activities recorded can be classified <strong>in</strong>to ten broad categories<br />
(Table 18) with the ma<strong>in</strong> activities encountered be<strong>in</strong>g land clearance / burn<strong>in</strong>g or direct<br />
hunt<strong>in</strong>g.<br />
Table 18 - Types of illegal activity recorded <strong>in</strong> the area<br />
Type Number of records<br />
Bird trapp<strong>in</strong>g 3<br />
Burnt area 12<br />
Clear<strong>in</strong>g 14<br />
Fish poison<strong>in</strong>g 1<br />
Gaharu collect<strong>in</strong>g 1<br />
Hunt<strong>in</strong>g 14<br />
Illegal logg<strong>in</strong>g 13<br />
Settlement<br />
(temporary)<br />
3<br />
71
72<br />
Shoot<strong>in</strong>g 2<br />
Snare 6<br />
Grand Total 69<br />
Unfortunately, due to a misunderstand<strong>in</strong>g with the Asiatic environmental manager, much of<br />
the data on illegal activities has been recorded <strong>in</strong> a different format and is at present<br />
unavailable for analysis. Of the data collected s<strong>in</strong>ce the patrol team started <strong>in</strong> earnest,<br />
encounter rates of on average 0.004 activities per km patrolled were be<strong>in</strong>g recorded.<br />
However, it is suspected the real rates are far higher and these will be available when the<br />
data have been collated.<br />
Year Month Distance patrolled Total Records / km<br />
(km)<br />
records<br />
<strong>2004</strong> May 417 6 0.019<br />
June 407.1 0 0<br />
July 560.1 2 0.003<br />
August 484.7 2 0.003<br />
September 397.5 0 0<br />
October 400.3 0 0<br />
Total 2666.7 10 0.004<br />
In general, there are serious problems with illegal activities. Hunt<strong>in</strong>g and snar<strong>in</strong>g are generally<br />
kept under control by the conservation team, but illegal land clearance is happen<strong>in</strong>g daily<br />
<strong>in</strong>side the plantation concession and especially <strong>in</strong> the conservation set aside areas which<br />
probably appear to be unused. Resolution of such issues is beyond either the conservation<br />
team or even the plantation security and various attempts are be<strong>in</strong>g made to <strong>in</strong>volve the<br />
police, military and local government officials <strong>in</strong> an attempt to resolve the problem.
Figure 51 - Examples of snare wounds seen on tiger (neck) and bear<br />
(right front foot) with<strong>in</strong> the plantation<br />
Figure 52 – Conservation team f<strong>in</strong>d<strong>in</strong>g a snare (left), and a local<br />
hunter photographed <strong>in</strong> the conservation area<br />
Figure 53 - Examples of illegal land clearance currently happen<strong>in</strong>g <strong>in</strong><br />
the plantation conservation area<br />
73
PREY DIVERSITY<br />
74<br />
OBJECTIVE 3: TIGER PREY ECOLOGY<br />
PREY AVAILABILITY WITHIN THE STUDY AREA<br />
Data presented under objective 2 demonstrated that there were a number of potential prey<br />
species available to <strong>tigers</strong> with<strong>in</strong> the study area. Of the species recorded, wild pig, bearded<br />
pig, sambar, muntjac, porcup<strong>in</strong>e, macaques, palm civet and even dhole are recorded prey<br />
species for <strong>tigers</strong> (Sunquist et al. 1999).<br />
PREY ABUNDANCE<br />
Figure 54 - Possible prey species exist<strong>in</strong>g with<strong>in</strong> the study site<br />
Subject Lat<strong>in</strong> name<br />
Agile gibbon Hylobates agilis<br />
Banded leaf monkey Presbytis melalophos<br />
Banded palm civet Diplogale derbyanus<br />
Bearded pig Sus barbatus<br />
B<strong>in</strong>turong Artictis b<strong>in</strong>turong<br />
Common palm civet Paradoxurus hermaphroditus<br />
Dhole Cuon alp<strong>in</strong>us<br />
Domestic cat Felis cattus<br />
Domestic dog Canis familiaris<br />
East Asian porcup<strong>in</strong>e Hystrix brachyuran<br />
Greater mouse deer Tragulus napu<br />
Long tailed macaque Macaca fascicularis<br />
Malay Civet Vivera tangalunga<br />
Malayan tapir Tapirus <strong>in</strong>dicus<br />
Muntjac Muntiacus muntjak<br />
Pangol<strong>in</strong> Manis javanica<br />
Pig (wild) Sus scrofa<br />
Pig tailed macaque Macaca nemestr<strong>in</strong>a<br />
Sambar Cervus unicolor<br />
Studies of relative abundance have been successful and were presented under objective two,<br />
show<strong>in</strong>g that wild pig are the most common likely prey species with bearded pig appear<strong>in</strong>g<br />
relatively recently and fast becom<strong>in</strong>g the second major prey candidate. However, studies of<br />
absolute prey densities were not entirely successful. In the first plan, local hunters were<br />
employed to live capture, mark and release pigs <strong>in</strong> an attempt to carry out a mark-recapture<br />
survey. Attempts to catch pigs with local hunters were carried out between November 2002<br />
and February 2003, us<strong>in</strong>g a hunter from Jambi with a team of 5-6 men and fifty wire funnel<br />
traps. The traps were then set <strong>in</strong> l<strong>in</strong>es between the oil palm and forest habitats and on animal<br />
trails with<strong>in</strong> scrub habitat. Captured animals were then bound by the trotters before remov<strong>in</strong>g<br />
from the trap. They were then marked and released. However, despite a huge <strong>in</strong>vestment of<br />
time and limited capture success, this trapp<strong>in</strong>g period was deemed to be unsuccessful and<br />
was stopped <strong>in</strong> early February. There were two primary problems. Firstly and most<br />
importantly the methods used by local hunters were found to be less humane than first<br />
thought. Although used to capture pigs live for market, the funnel traps were found to be still<br />
highly stressful for the pigs and there were serious concerns about the long term impacts of<br />
capture and restra<strong>in</strong>t – issues that are not usually considered for pigs due for slaughter at
market. The concerns were partly due to the stress <strong>in</strong>curred by experienc<strong>in</strong>g a capture and<br />
handl<strong>in</strong>g whilst conscious and partly because the requirement to mark pigs meant they were<br />
handled more extensively than pigs caught for market. The second problem was that the<br />
funnel capture technique was <strong>in</strong> fact far more restrictive <strong>in</strong> where it could be applied. The<br />
hunters capture the pigs by channell<strong>in</strong>g them towards the traps. This works well <strong>in</strong> dense<br />
scrub where pig trails can be identified and blocked but <strong>in</strong> the more open habitats of forest<br />
and oil palm the undergrowth was not thick enough to be able to channel pigs towards the<br />
traps. Consequently, not all areas of <strong>in</strong>terest could be surveyed us<strong>in</strong>g this technique. By<br />
February 2003 only six pigs had been caught us<strong>in</strong>g the funnel method. Only one adult pig<br />
was successfully marked and released and one pig died as a result of be<strong>in</strong>g captured (despite<br />
be<strong>in</strong>g <strong>in</strong> the trap for less than one hour). The hunters were be<strong>in</strong>g offered 200 000 Rp ($20)<br />
per pig successfully caught, marked and released but they decided it was not worth the effort<br />
or risk and the project <strong>in</strong> turn decided the method was too harmful to cont<strong>in</strong>ue.<br />
Follow<strong>in</strong>g the failure of the first method, a s<strong>in</strong>gle prototype panel trap was built by the<br />
plantation workshop between March and April. The trap was trialled and adjusted <strong>in</strong> May<br />
before be<strong>in</strong>g returned for modification and to act as a template for three more. The traps were<br />
then set to co<strong>in</strong>cide with the presence of the veter<strong>in</strong>ary consultant <strong>in</strong> mid <strong>2004</strong>. However,<br />
aga<strong>in</strong> trapp<strong>in</strong>g was unsuccessful, with only one capture made. It is suspected that either the<br />
choice of bait or pig suspicion was a key limit<strong>in</strong>g factor. Pre-bait<strong>in</strong>g is an essential part of the<br />
trapp<strong>in</strong>g process (Sweitzer et al. 2000) and various baits were trialled for effectiveness. These<br />
<strong>in</strong>clude fruits (jackfruit, durian, p<strong>in</strong>eapple and banana), fish, maize, cassava, peanut butter<br />
and waste food from the plantation canteen. However, no bait achieved obvious success,<br />
even when placed outside the trap. This may be a consequence of the high abundance of<br />
alternative food (loose oil palm fruit lies on the ground <strong>in</strong> most areas) or it may simply show<br />
the cautiousness of the pigs. The only pig to be caught was a very young juvenile.<br />
However, estimates of abundance were possible from camera traps (see objective 1) and l<strong>in</strong>e<br />
transects gave some estimates of density. To compare the two, only photographs of potential<br />
prey taken by randomly placed cameras were used dur<strong>in</strong>g the time transects were also<br />
carried out (Figure 55). These were compared with estimates of actual pig density obta<strong>in</strong>ed<br />
from night transects (Figure 56). The results show that when us<strong>in</strong>g randomly placed cameras<br />
only, the difference <strong>in</strong> abundance between wild pigs and other potential prey species is even<br />
larger, possibly because pigs do not use the open tracks favoured by the carnivores. They<br />
also show that the estimate of pig abundance <strong>in</strong> the plantation scrub (the habitat with the<br />
highest rate of tiger photos) is higher than if calculated us<strong>in</strong>g all cameras, possibly show<strong>in</strong>g<br />
that pigs particularly avoid the tracks <strong>in</strong> these areas. Estimates of relative abundance from<br />
cameras are <strong>in</strong> broad agreement with the l<strong>in</strong>e transects (Figure 56), show<strong>in</strong>g low densities <strong>in</strong><br />
the forest and the high densities <strong>in</strong> and around the oil palm. However, estimates from scrub<br />
habitats do not agree. It is suspected these results are confounded by the low sample sizes<br />
and consequent large error marg<strong>in</strong>s associated with the l<strong>in</strong>e transect data, caused by a lack<br />
of driveable tracks <strong>in</strong> these habitats.<br />
Relatively few studies of pig density <strong>in</strong> comparable habitats have been published for<br />
comparison. However, one study <strong>in</strong> a topical woodland / agricultural landscape used transects<br />
to estimate densities of between 2.2 and 3.5 pigs per square kilometre (Caley 1993),<br />
estimates very similar to those <strong>in</strong> the oil palm and to some extent the scrub <strong>in</strong> this study. The<br />
only other study to look at pigs associated with oil palm also used l<strong>in</strong>e transects to calculate<br />
estimates of between 27 and 47 pigs per square kilometre across two years <strong>in</strong> a Malaysian<br />
forest / oil palm border (Ickes 2001). However, there were no <strong>report</strong>ed predators <strong>in</strong> this study<br />
site. At this stage, the data from this project are not sufficient to draw too many conclusions<br />
from these comparisons, nor can good calibrations of camera trapp<strong>in</strong>g data be calculated. It is<br />
therefore important that the com<strong>in</strong>g year provides better estimates of absolute density, either<br />
through capture mark recapture or by <strong>in</strong>creas<strong>in</strong>g l<strong>in</strong>e transect effort and success.<br />
75
Photos/100 trap nights<br />
No photos/100 trap nights<br />
76<br />
60<br />
50<br />
40<br />
30<br />
20<br />
10<br />
0<br />
60<br />
50<br />
40<br />
30<br />
20<br />
10<br />
0<br />
Figure 55 - Relative abundance of potential prey species from<br />
randomly placed cameras (plantation forest was not surveyed by<br />
this method)<br />
Pig (wild)<br />
Pig tailed macaque<br />
Bearded pig<br />
East Asian porcup<strong>in</strong>e<br />
Muntjack<br />
Long tailed macaque<br />
Common Palm Civet<br />
Domestic dog<br />
Malay Civet<br />
Sambar<br />
Oil Palm Plantation scrub Asialog forest<br />
Figure 56 – Comparison of wild pig abundance estimates us<strong>in</strong>g night<br />
transects (open bars, +/- SE) and camera trap <strong>in</strong>dices (filled bars)<br />
Oil Palm Scrub Oil palm / forest Forest<br />
Habitat<br />
Note: Oil palm / forest boundary habitat was not surveyed by camera traps<br />
Camera traps<br />
L<strong>in</strong>e transects<br />
4.5<br />
4<br />
3.5<br />
3<br />
2.5<br />
2<br />
1.5<br />
1<br />
0.5<br />
0<br />
Density (pigs/sq.km.)
DISTRIBUTION OF PREY SPECIES<br />
Distribution of prey species has already been discussed <strong>in</strong> objective 1 and can be seen <strong>in</strong> the<br />
distribution maps <strong>in</strong> the appendix. In general, pigs were shown to prefer oil palm habitats or<br />
the scrubby set aside areas <strong>in</strong> the oil palm concession. Densities <strong>in</strong> the forest did not seem as<br />
high.<br />
MOVEMENTS OF PREY SPECIES<br />
Three potential prey species were captured and radio collared. Unfortunately radio collars did<br />
not fit pigs properly; bearded pigs could not be collared at all (even slight tighten<strong>in</strong>g of the<br />
collar caused restriction to breath<strong>in</strong>g, yet the collar could still easily slide off the head) whilst<br />
one wild pig was collared for about two weeks before he managed to pull the collar off and<br />
another was fitted with a makeshift harness collar which lasted for longer but still the pig<br />
managed to free itself with<strong>in</strong> 3 months. Consequently we are not conv<strong>in</strong>ced that movement<br />
data provided for pigs are necessarily complete. However, the collared tapir has been tracked<br />
successfully for 4 months s<strong>in</strong>ce its capture and we are confident we have mapped most of its<br />
range.<br />
Figure 57- Ranges for wild pig (Chrispy Bacon, Sausage) and tapir<br />
(Shergar) from radio track<strong>in</strong>g fixes<br />
Table 19 - Home ranges (95% MCP ) for three tiger prey species from<br />
radio track<strong>in</strong>g data<br />
Species Name 95% MCP (km 2 )<br />
Tapir Shergar 6.2<br />
Wild pig Chrispy Bacon 5.4<br />
Wild pig Sausage 6.6<br />
77
The prey radio track<strong>in</strong>g study is far from complete, but prelim<strong>in</strong>ary results show that both pigs<br />
radio collared stayed fairly close to the forest border but spent almost all of their time <strong>in</strong><br />
marg<strong>in</strong>al oil palm / scrub habitats. Ranges for both were similar, about 5-6 square kilometres,<br />
but data were <strong>in</strong>sufficient to be sure these were f<strong>in</strong>al ranges. Both pigs spent some time<br />
around the capture site before mov<strong>in</strong>g 2-3 kilometres to a new area. Almost no data area<br />
available on tapir, but results so far obta<strong>in</strong>ed from Shergar show that she appears to have a<br />
similar range to the pigs of around six square kilometres. Interest<strong>in</strong>gly she appears to be<br />
entirely restricted to the scrubby area of the plantation set aside land and although rang<strong>in</strong>g<br />
close to the forest has not yet been recorded <strong>in</strong>side.<br />
78<br />
IMPACTS OF PREY SPEC IES ON THE PLANTATION<br />
Although a complete programme design has been drawn up and all equipment purchased,<br />
studies of plantation losses to pigs have been hampered by the requirement to work closely<br />
and cont<strong>in</strong>uously with the plantation staff, with both sides also try<strong>in</strong>g to achieve many other<br />
objectives.<br />
So far, a detailed plan of the study has been drawn up and translated <strong>in</strong>to Indonesian. A<br />
succession of meet<strong>in</strong>gs have been held with estate managers and agronomists and all<br />
appear agreed on the general approach. There are two ma<strong>in</strong> foci; of major concern to the<br />
plantation are losses of sapl<strong>in</strong>gs, trees under two years old that are planted <strong>in</strong>to the field. As a<br />
develop<strong>in</strong>g plantation, many of the trees are young and managers compla<strong>in</strong> that many are<br />
be<strong>in</strong>g damaged or killed by pigs. This is a particularly important impact because loss of a<br />
young tree means an effective loss of 20-25 years of production from that tree. Replacement<br />
of s<strong>in</strong>gle sapl<strong>in</strong>gs is time consum<strong>in</strong>g and expensive and also puts <strong>in</strong>dividual trees out of synch<br />
with neighbour<strong>in</strong>g trees. Crucially, no effective prevention method is known, although several<br />
semi-effective measures are employed. The second focus is of more <strong>in</strong>terest to the<br />
conservationists. This concentrates on the losses of fallen oil palm fruit to pigs and other<br />
species. Although this presents a potentially expensive loss to the plantation, it is comparably<br />
much lower than sapl<strong>in</strong>g losses and fairly easily resolved by tighten<strong>in</strong>g up harvest<strong>in</strong>g<br />
practices so is seen as the lesser problem. However, fallen fruit is more likely to be the most<br />
valuable food source for pigs and thus represents an important potential conflict.<br />
To look at the sapl<strong>in</strong>g losses, plots of trees of different ages and <strong>in</strong> different locations have<br />
been identified <strong>in</strong> the field. These will be fitted with a range of potential protection measures.<br />
Once marked, plantation workers will then beg<strong>in</strong> survey<strong>in</strong>g the palms on a weekly basis to<br />
note damage, us<strong>in</strong>g damage ID cards drawn up by the company agronomist and <strong>ZSL</strong>.<br />
Factors <strong>in</strong>fluenc<strong>in</strong>g losses will be analysed us<strong>in</strong>g factorial analysis.<br />
Fallen fruit studies will be carried out through exclusion studies. Four electric fences have<br />
been purchased, each sufficient to isolate half a block of oil palm (approximately 15 hectares).<br />
Fruit will be harvested as usual, but fallen fruit left beh<strong>in</strong>d will also be gathered and weighed,<br />
enabl<strong>in</strong>g comparisons between fenced and non fenced areas.<br />
Due to the difficulties <strong>in</strong> sett<strong>in</strong>g up a collaborative project, a s<strong>in</strong>gle researcher has been hired<br />
to concentrate on losses to pest species <strong>in</strong> September <strong>2004</strong>. Assum<strong>in</strong>g permissions are<br />
obta<strong>in</strong>ed, the first results should be available later <strong>in</strong> late 2005.
Figure 58 - Example of serious sapl<strong>in</strong>g damage caused by pigs and<br />
one method of semi-effective prevention<br />
79
80<br />
OBJECTIVE 4: TIGER ECOLOGY<br />
TIGER POPULATION ESTIMATE<br />
Figure 41 <strong>in</strong> the general monitor<strong>in</strong>g section showed that although <strong>tigers</strong> were one of the top<br />
ten most photographed mammals <strong>in</strong> the study area, the trapp<strong>in</strong>g rates appeared to be fall<strong>in</strong>g<br />
steadily over time. It is possible to derive an estimate of actual density from trapp<strong>in</strong>g rate data<br />
(Carbone et al, 2001) and although this method has its disadvantages (Jennelle et al, 2002) <strong>in</strong><br />
the absence of sufficient data for mark recapture it can be used to translate trapp<strong>in</strong>g rates <strong>in</strong>to<br />
some k<strong>in</strong>d of comparable density estimates. Therefore, us<strong>in</strong>g the method described by<br />
Carbone et al trapp<strong>in</strong>g rates for each year were translated <strong>in</strong>to densities per square kilometre<br />
(Table 20) and plotted together with the camera effort (Figure 59). Initial results from 2001-2<br />
suggested tiger density on site were extremely high, comparable to the densities <strong>in</strong> the Indian<br />
tiger reserves of Nagrahole and Rathambore. However, results from 2003 – <strong>2004</strong> saw a<br />
decl<strong>in</strong>e <strong>in</strong> density to almost zero.<br />
Table 20 - Yearly calculated tiger densities based on camera trapp<strong>in</strong>g<br />
rate<br />
Year Tiger Trapp<strong>in</strong>g Photos/trap night Trap nights/photo Density (<strong>tigers</strong>/100 sq.km)<br />
photos effort<br />
2001 14 214 0.0700 15 11.98<br />
2002 22 251 0.0700 11 16.66<br />
2003 67 2700 0.0200 40 4.05<br />
<strong>2004</strong> 1 1814 0.0004 1814 0.06<br />
Overall 104 4979 0.0209 48 3.34<br />
Density (<strong>tigers</strong>/100 sq. km.)<br />
18<br />
16<br />
14<br />
12<br />
10<br />
8<br />
6<br />
4<br />
2<br />
0<br />
Figure 59 - Tiger density calculated by yearly trapp<strong>in</strong>g rates<br />
2001 2002 2003 <strong>2004</strong> Overall<br />
Year<br />
Density (<strong>tigers</strong>/100 sq.km)<br />
Trapp<strong>in</strong>g effort<br />
6000<br />
5000<br />
4000<br />
3000<br />
2000<br />
1000<br />
0<br />
Trap nights (tiger cameras only)
INDIVIDUAL RECOGNITION<br />
Estimates of tiger abundance can be taken one step further us<strong>in</strong>g <strong>in</strong>dividual recognition.<br />
Us<strong>in</strong>g stripes to identify <strong>in</strong>dividuals (Frankl<strong>in</strong> et al. 1999), eight <strong>in</strong>dividuals have been<br />
positively identified for each side. These are thought to represent at least n<strong>in</strong>e <strong>tigers</strong> (s<strong>in</strong>ce<br />
one of the “left only” identifications is almost certa<strong>in</strong>ly different from one of the “right only”<br />
photos) (Table 21). Four of the <strong>tigers</strong> are resident, permanent adults (two males, two females)<br />
that regularly use land with<strong>in</strong> the oil palm concession and account for the vast majority (78%)<br />
of tiger photographs. The others likely form a mixture of dependent cubs from the resident<br />
females and rarely sighted <strong>in</strong>dependent adults who are suspected to be from previous litters.<br />
However, search effort has been restricted to the non-palm plantation habitats (about 15000<br />
ha) and only a small strip of the forest concession border<strong>in</strong>g these areas. It is therefore<br />
probable that several more exist deeper <strong>in</strong> the forest. Furthermore, with two exceptions,<br />
photographs of mothers with cubs have not been obta<strong>in</strong>ed, presumably because the cameras<br />
cannot be set with less than a 20 second delay, mean<strong>in</strong>g cubs walk<strong>in</strong>g close beh<strong>in</strong>d their<br />
mother are missed. Older cubs (such as “Mambo” and “Eve”), however, walk a few m<strong>in</strong>utes<br />
beh<strong>in</strong>d their mother and do get photographed. Therefore, based on track records and on<br />
scout sight<strong>in</strong>gs, several more <strong>tigers</strong> are known to have used the plantation s<strong>in</strong>ce the start of<br />
the project, but have not been captured on film. In summary, a m<strong>in</strong>imum of eight <strong>tigers</strong> have<br />
been photographed on one given side, but evidence of at least 16 adults and cubs has been<br />
collected over the last two years. A summary of all <strong>tigers</strong> known and their suspected<br />
relationships is presented <strong>in</strong> Table 22.<br />
Table 21 - Composition of tiger photographs taken by camera traps<br />
Tiger Side photographed Sex Age Last seen % total<br />
Left Right<br />
Wendy 17 9 F Adult 12 August 2003 26.53%<br />
Slamet 9 13 M Adult 19 September 2003<br />
Tiga Jari 8 8 F Adult 11 July 2003<br />
Flash 6 6 Adult 16 March 2003<br />
Mambo 6 1 U Young adult 04 April 2003<br />
Eve 2 4 U Young adult 25 March 2003<br />
22.45%<br />
16.33%<br />
12.24%<br />
7.14%<br />
6.12%<br />
Unidentified 4 0 4.08%<br />
Mo 0 2 F Adult 30 August 2003 2.04%<br />
Shakira 1 0 F Adult 08 February 2003<br />
1.02%<br />
Subuh 0 1 F Young adult No date 1.02%<br />
Wendy cub A1 1 0 U Cub No date 1.02%<br />
Grand Total 54 44 100%<br />
Table 22 - Summary of all known <strong>tigers</strong> <strong>in</strong> the Asiatic Persada area <strong>in</strong><br />
the last two years. Permanent residents with<strong>in</strong> the oil palm are<br />
highlighted.<br />
ID Status Sex Age Area Notes<br />
Flash Resident Male Adult Jammer Tulen,<br />
NW Asialog<br />
Probably father of Wendy’s cubs.<br />
Not been photographed s<strong>in</strong>ce March<br />
81
Wendy Resident Female Adult Jammer Tulen,<br />
palm border,<br />
NW Asialog<br />
- Wendy<br />
cub A1<br />
- Wendy<br />
cub A2<br />
- Wendy<br />
cub B1<br />
- Wendy<br />
cub B2<br />
- Wendy<br />
cub B3<br />
Shakira Female? Young<br />
adult?<br />
82<br />
follow<strong>in</strong>g regular photographs<br />
previously.<br />
Bred at least twice. Often near oil<br />
palm habitat.<br />
Unknown 1 st litter present when project began.<br />
Photographed once whilst with<br />
mother.<br />
Unknown 1 st litter present when project began.<br />
Photographed twice whilst with<br />
mother. By Nov 01 looked fully<br />
grown but still with mother.<br />
Unknown Second litter born ~ April 2002.<br />
Seen by scouts <strong>in</strong> August 2002 but<br />
no camera trap records. Tracks<br />
<strong>in</strong>dicate not all three survived?<br />
Second litter born ~ April 2002.<br />
Seen by scouts <strong>in</strong> August 2002 but<br />
no camera trap records. Tracks<br />
<strong>in</strong>dicate not all three survived?<br />
Second litter born ~ April 2002.<br />
Seen by scouts <strong>in</strong> August 2002 but<br />
no camera trap records. Tracks<br />
<strong>in</strong>dicate not all three survived?<br />
NW Asialog Possibly Wendy cub A1. Def<strong>in</strong>itely<br />
not A2. Stripe <strong>patterns</strong> similar to<br />
Wendy<br />
Subuh Female? Unknown Jammer Tulen Photographed once <strong>in</strong> 2001. Stripes<br />
similar to Wendy and seen <strong>in</strong> her<br />
area. Cub from previous litter?<br />
Unidentified<br />
Female Young Jammer Tulen Possibly other side of Shakira –<br />
1<br />
adult?<br />
stripes similar<br />
Unidentified<br />
2<br />
Unknown Unknown Jammer Tulen Can’t match but poor quality<br />
Slamet Male Adult, 6-7<br />
yrs<br />
Bung<strong>in</strong>, NE<br />
Asialog, at least<br />
once <strong>in</strong> Jammer<br />
Tulen<br />
Radio collared <strong>in</strong> May 2003. Lost<br />
collar <strong>in</strong> Dec 2003 / Jan <strong>2004</strong><br />
Tiga Jari Resident Female Adult Bung<strong>in</strong>, prob.<br />
NE Asialog<br />
Three toes on one foot<br />
Eve Tiga Jari Female Sub adult Bung<strong>in</strong> Orig<strong>in</strong>ally seen associated with Tiga<br />
cub A1<br />
Jari <strong>in</strong> Bung<strong>in</strong> – probably her cub.<br />
Mambo Tiga Jari Unknown Sub adult Bung<strong>in</strong>, Jammer Orig<strong>in</strong>ally seen associated with Tiga<br />
cub A2<br />
Tulen<br />
Jari <strong>in</strong> Bung<strong>in</strong> – probably her cub.<br />
Most recently seen <strong>in</strong> Jammer<br />
Tulen.<br />
Mo Resident? Female Adult? Asialog, south Never seen <strong>in</strong>side the plantation.<br />
of Bung<strong>in</strong> Seen on a camera trap that Slamet<br />
also appears on wit h<strong>in</strong> 24 hours of<br />
one another<br />
Therefore, <strong>in</strong> the <strong>in</strong>itial years of the study at least 4 breed<strong>in</strong>g adults were present <strong>in</strong> a study<br />
area of about 100 km 2 but an estimated 14 <strong>in</strong>dividuals have used the area at some po<strong>in</strong>t (the<br />
approximate area surveyed by cameras not <strong>in</strong>clud<strong>in</strong>g oil palm crop habitat), which tallies fairly<br />
well with the density estimates. However, as with the camera trapp<strong>in</strong>g rates, photographs of<br />
<strong>in</strong>dividual <strong>tigers</strong> have all but disappeared. In the last year a s<strong>in</strong>gle photograph has been
obta<strong>in</strong>ed (Mambo). Track records (Figure 36) show <strong>tigers</strong> are still present <strong>in</strong> the area but<br />
either they are avoid<strong>in</strong>g camera traps or densities have fallen so low so as to make camera<br />
trapp<strong>in</strong>g a very rare event.<br />
The potential reasons for this decl<strong>in</strong>e are varied and <strong>in</strong> many cases data are <strong>in</strong>sufficient to<br />
prove one way or the other. One possible answer is that <strong>tigers</strong> have simply shifted activities<br />
beyond the study area. It is hoped that a wide rang<strong>in</strong>g survey <strong>in</strong> 2005 and will answer if this is<br />
the case. A common reason for tiger decl<strong>in</strong>e is prey shortage, however, camera trapp<strong>in</strong>g<br />
rates at least do not show any sign of reduction for either pig species (<strong>in</strong> fact bearded pigs<br />
have <strong>in</strong>creased) or for Cervidae species. More likely is the <strong>in</strong>fluence of human activities –<br />
camera trap rates do not show any major <strong>in</strong>crease <strong>in</strong> human presence <strong>in</strong> the tiger areas<br />
(apart from a rise when <strong>tigers</strong> first appeared to disappear) but the huge extent of illegal<br />
logg<strong>in</strong>g and clear<strong>in</strong>g currently underway <strong>in</strong> both the forest concession and unplanted<br />
plantation areas are likely to be hav<strong>in</strong>g a strong impact.<br />
RANGE CALCULATION<br />
RANGING PATTERNS<br />
<strong>Rang<strong>in</strong>g</strong> <strong>patterns</strong> could be calculated from camera traps for the four most photographed<br />
<strong>tigers</strong> and from radio track<strong>in</strong>g fixes for Slamet, the radio collared tiger. Comb<strong>in</strong><strong>in</strong>g all available<br />
data and us<strong>in</strong>g m<strong>in</strong>imum convex polygons to estimate ranges shows the results <strong>in</strong> Figure 60.<br />
These show fairly similar ranges for all <strong>tigers</strong> (around 12-14 km 2 except for Tiga Jari who was<br />
only photographed <strong>in</strong> a very small area). Camera traps are extremely restricted <strong>in</strong> their<br />
reliability as a range estimate tool s<strong>in</strong>ce the range is limited by the user’s placement of<br />
cameras. However, radio track<strong>in</strong>g data from Slamet gave negligible differences <strong>in</strong> the<br />
estimate of his range (Figure 61) and comparison with the camera distribution (Figure 19)<br />
shows that ranges were not just restricted to the area surveyed (<strong>in</strong> other words, cameras<br />
outside this area did not record the <strong>tigers</strong>) suggest<strong>in</strong>g that the range estimates may be fairly<br />
accurate. If so, this would form very low ranges, with other tiger ranges vary<strong>in</strong>g from about<br />
30km 2 for females and 200km 2 for males <strong>in</strong> the only other radio track<strong>in</strong>g study (Chundawat,<br />
1999) whilst <strong>in</strong> other areas ranges can exceed 1000km 2 . Slamet was monitored until<br />
December 2003 when he slipped his collar. Before this he was occasionally sighted on<br />
camera traps look<strong>in</strong>g fit, healthy and well fed (Figure 62) but s<strong>in</strong>ce the collar loss neither<br />
Slamet or any other tiger has been photographed <strong>in</strong> that region.<br />
83
84<br />
Figure 60 - Tiger ranges (calculated from camera trap data and radio<br />
track<strong>in</strong>g fixes where available) for the four most photographed<br />
<strong>in</strong>dividuals<br />
Table 23 – Tiger ranges as calculated from camera traps and radio track<strong>in</strong>g data where<br />
available<br />
Individual Sex Area (km 2 )<br />
Slamet Male 12.2<br />
Tiga Jari Female 1.7<br />
Flash Male 14.2<br />
Wendy Female 14.0
Figure 61 - Calculation of Slamet's range from camera traps<br />
(cameras) and radio track<strong>in</strong>g fixes (triangles)<br />
Figure 62 - "Slamet" wear<strong>in</strong>g a radio collar<br />
85
CAMERA TRAPPING RATES IN DIFFERENT HABITATS<br />
86<br />
Table 24 - Trapp<strong>in</strong>g rates (photos/100 trap nights)for <strong>tigers</strong> <strong>in</strong>side<br />
and outside the plantation us<strong>in</strong>g two camera placement methods<br />
Region Habitat Non random cameras Randomly placed cameras Overall<br />
Forest concession Forest 2.26 0.00 1.92<br />
Forest total 2.26 0.00 1.92<br />
Plantation Forest 1.08 1.08<br />
Palm 0.00 0.00<br />
Scrub 3.54 0.00 2.83<br />
Plantation total 3.08 0.00 2.06<br />
Total 2.90 0.00 2.04<br />
Photos/100 trap nights<br />
4<br />
3.5<br />
3<br />
2.5<br />
2<br />
1.5<br />
1<br />
0.5<br />
0<br />
Figure 63 - Camera trapp<strong>in</strong>g rates <strong>in</strong> different habitats from “tiger”<br />
cameras only<br />
Palm Plantation scrub Plantation forest Asialog forest<br />
Habitat<br />
Tiger cameras<br />
Prey cameras<br />
Overall<br />
The results show that most tiger photos are taken <strong>in</strong>side the plantation <strong>in</strong> the scrub habitats,<br />
one of the two habitats with the highest density of pigs. However, <strong>tigers</strong> were never<br />
photographed <strong>in</strong>side the oil palm crop where pig densities were also high. Furthermore, <strong>tigers</strong><br />
were never photographed from the randomly placed or “prey” cameras, substantially reduc<strong>in</strong>g<br />
the number of trap nights from which data were available.<br />
ACTIVITY PATTERNS AS DETERMINED BY CAMERA TRAPS<br />
Tigers around the oil palm are primarily active at night, however there is still significant activity<br />
dur<strong>in</strong>g the day when humans are also active, with 60% of photographs taken at night, 40% <strong>in</strong><br />
the day. Activity periods have so far been similar between males and females (based on 24<br />
samples), although there is a slight tendency for females to be active earlier <strong>in</strong> the night and<br />
males later. Times for daylight photographs are unrepresented s<strong>in</strong>ce the date stamp is<br />
frequently bleached out from the negative.
Table 25 - Times <strong>tigers</strong> are photographed<br />
18:00-22:00 22:00-02:00 02:00-06:00 06:00- 10:00 14:00-18:00 Total<br />
Female 43% 21% 7% 21% 7% 100%<br />
Male 40% 0% 30% 20% 10% 100%<br />
Total 42% 13% 17% 21% 8% 100%<br />
87
88<br />
REFERENCES<br />
Anderson, D. R., Burnham, K. P., Lubow, B. C., Thomas, L., Corn, P. S., Medica, P. A. &<br />
Marlow, R. W. 2001 Field trials of l<strong>in</strong>e transect methods applied to estimation of desert<br />
tortoise abundance. Journal of Wildlife Management 65, 583-597.<br />
Bergstrom, R. & Skarpe, C. 1999 The abundance of large wild herbivores <strong>in</strong> a semi-arid<br />
savanna <strong>in</strong> relation to seasons, pans and livestock. African Journal of Ecology 37, 12-26.<br />
Buckland, S. T., Anderson, D. R., Burnham, K. P. & Laake, J. L. 1993 Distance sampl<strong>in</strong>g:<br />
estimat<strong>in</strong>g abundance of biological populations. London: Chapman and Hall.<br />
Caley, P. 1993 Population-Dynamics of Feral Pigs (Sus Scrofa) <strong>in</strong> a Tropical River<strong>in</strong>e Habitat<br />
Complex. Wildlife Research 20, 625-636.<br />
Carbone, C., Christie, S., Conforti, K., Coulson, T., Frankl<strong>in</strong>, N., G<strong>in</strong>sberg, J. R., Griffiths, M.,<br />
Holden, J., Kawanishi, K., K<strong>in</strong>naird, M., Laidlaw, R., Lynam, A., Macdonald, D. W., Martyr, D.,<br />
McDougal, C., Nath, L., O'Brien, T., Seidensticker, J., Smith, D. J. L., Sunquist, M., Tilson, R.<br />
& Shahrudd<strong>in</strong>, W. N. W. 2001 The use of photographic rates to estimate densities of <strong>tigers</strong><br />
and other cryptic mammals. Animal Conservation 4, 75-79.<br />
Caro, T. M. 1999 Densities of mammals <strong>in</strong> partially protected areas: the Katavi ecosystem of<br />
western Tanzania. Journal of Applied Ecology 36, 205-217.<br />
Casson, A. 1999 The hesitant boom: Indonesia's oil palm sub-sector <strong>in</strong> an era of economic<br />
crisis and political change, pp. 75. Bogor: Centre for International Forestry Research.<br />
Choquenot, D., Kilgour, R. J. & Luk<strong>in</strong>s, B. S. 1993 An Evaluation of Feral Pig Trapp<strong>in</strong>g.<br />
Wildlife Research 20, 15-22.<br />
Frankl<strong>in</strong>, N., Bastoni, Sriyanto, Dwiatmo Siswomartono, Manansang, J. & Tilson, R. 1999<br />
Us<strong>in</strong>g tiger stripes to identify <strong>in</strong>dividual <strong>tigers</strong>. In Rid<strong>in</strong>g the Tiger: Tiger conservation <strong>in</strong><br />
human-dom<strong>in</strong>ated landscapes (ed. J. Seidensticker, S. Christie & P. Jackson). Cambridge:<br />
Cambridge University Press.<br />
Glastra, R., Wakker, E. & Richert, W. 2002 Oil Palm Plantations and Deforestation <strong>in</strong><br />
Indonesia: what role do Europe and Germany play? An update of the 1998 "Lipsticks from the<br />
Ra<strong>in</strong>forest" <strong>report</strong>, pp. 52: WWF Germany.<br />
Goodrich, J. M., Kerley, L. L., Schleyer, B. O., Miquelle, D. G., Quigley, K. S., Smirnov, Y. N.,<br />
Nikolaev, I. G., Quigley, H. B. & Hornocker, M. G. 2001 Capture and chemical anesthesia of<br />
Amur (Siberian) <strong>tigers</strong>. Wildlife Society Bullet<strong>in</strong> 29, 533-542.<br />
Ickes, K. 2001 Hyper-abundance of native wild pigs (Sus scrofa) <strong>in</strong> a lowland dipterocarp ra<strong>in</strong><br />
forest of pen<strong>in</strong>sular Malaysia. Biotropica 33, 682-690.<br />
Karanth, K. U. 1995 Estimat<strong>in</strong>g Tiger Panthera-Tigris Populations From Camera-Trap Data<br />
Us<strong>in</strong>g Capture-Recapture Models. Biological Conservation 71, 333-338.<br />
Karanth, K. U. & Nichols, J. D. 1998 Estimation of tiger densities <strong>in</strong> India us<strong>in</strong>g photographic<br />
captures and recaptures. Ecology 79, 2852-2862.<br />
Karanth, K. U. & Stith, B. M. 1999 Prey depletion as a critical det erm<strong>in</strong>ant of tiger population<br />
viability. In Rid<strong>in</strong>g the tiger: tiger conservation <strong>in</strong> a human-dom<strong>in</strong>ated landscape (ed. J.<br />
Seidensticker, S. Christie & P. Jackson). Cambridge: Cambridge University Press.<br />
Karanth, U. K. & Nichols, J. D. (ed.) 2002 Monitor<strong>in</strong>g <strong>tigers</strong> and their prey: a manual for<br />
researchers, managers and conservationists <strong>in</strong> tropical Asia. Bangalore: Centre for Wildlife<br />
Studies.<br />
Laake, T. L., Derry, J. F., Buckland, S. T., Borchers, D. L., Anderson, D. R., Burnham, K. P.,<br />
Str<strong>in</strong>dberg, S., Hedley, S. L., Burt, M. L., Marques, F., Pollard, J. H. & Fewster, R. M. 1998<br />
Distance 3.5. St. Andrews: Research Unit for Wildlife Population Assessment, University of<br />
St. Andrews, UK.
Lewis, John C.M. <strong>2004</strong> Field use of isoflurane and air anaesthetic equipment <strong>in</strong> wildlife.<br />
Journal of Zoo and Wildlife Medic<strong>in</strong>e 35 (3), 303-311<br />
Mace, R. D., M<strong>in</strong>ta, S. C., Manley, T. L. & Aune, K. E. 1994 Estimat<strong>in</strong>g Grizzly Bear<br />
Population-Size Us<strong>in</strong>g Camera Sight<strong>in</strong>gs. Wildlife Society Bullet<strong>in</strong> 22, 74-83.<br />
Maddox, T. M. 2002 The ecology of cheetahs and other large carnivores <strong>in</strong> a pastoralistdom<strong>in</strong>ated<br />
buffer zone. In Anthropology. London: University of London.<br />
Moruzzi, T. L., Fuller, T. K., DeGraaf, R. M., Brooks, R. T. & Li, W. J. 2002 Assess<strong>in</strong>g<br />
remotely triggered cameras for survey<strong>in</strong>g carnivore distribution. Wildlife Society Bullet<strong>in</strong> 30,<br />
380-386.<br />
O'Brien, T., Wibisono, H. T. & K<strong>in</strong>naird, M. F. 2003 Crouch<strong>in</strong>g <strong>tigers</strong>, hidden prey: <strong>Sumatran</strong><br />
tiger and prey populations <strong>in</strong> a tropical forest landscape. Animal Conservation 6, 131-139.<br />
Potter, L. & Lee, J. 1999 Oil-Palm <strong>in</strong> Indonesia: its role <strong>in</strong> forest conversion and the fires of<br />
1997/98, pp. 41. Jakarta: WWF Indonesia.<br />
PRPOL. 2003 Environmental and social handbook: Pacific Palm Oil.<br />
Seidensticker, J. 1987 Bear<strong>in</strong>g witness: observations on the ext<strong>in</strong>ction of Panthera tigris<br />
balica and Panthera tigris sondaica. In Tigers of the world: the biology, biopolitics,<br />
management and conservation of an endangered species (ed. R. L. Tilson & U. S. Seal), pp.<br />
1-8. New Jersey: Noyes Publications.<br />
Seidensticker, J. & Suyono, I. 1980 The Javan tiger and the Meru Betiri Reserve, a plan for<br />
management, pp. 167. Gland: IUCN.<br />
Sunquist, M., Karanth, K. U. & Sunquist, F. 1999 Ecology, behaviour and resilience of the<br />
tiger and its conservation needs. In Rid<strong>in</strong>g the tiger: tiger conservation <strong>in</strong> a human-dom<strong>in</strong>ated<br />
landscape (ed. J. Seidensticker, S. Christie & P. Jackson). Cambridge: CUP.<br />
Sutherland, W. J. (ed.) 1996 Ecological census techniques: a handbook . Cambridge:<br />
Cambridge University Press.<br />
Sweitzer, R. A., Gonzales, B. J., Gardner, I. A., VanVuren, D., Waithman, J. D. & Boyce, W.<br />
M. 1997 A modified panel trap and immobilization technique for captur<strong>in</strong>g multiple wild pig.<br />
Wildlife Society Bullet<strong>in</strong> 25, 699-705.<br />
Sweitzer, R. A., Van Vuren, D., Gardner, I. A., Boyce, W. M. & Waithman, J. D. 2000<br />
Estimat<strong>in</strong>g sizes of wild pig populations <strong>in</strong> the North and Central Coast regions of California.<br />
Journal of Wildlife Management 64, 531-543.<br />
Thomas, L., Buckland, S. T., Burnham, K. P., Anderson, D. R., Laake, J. L., Borchers, D. L. &<br />
Str<strong>in</strong>dberg, S. L. 2002 Distance sampl<strong>in</strong>g. Encyclopedia of environmetrics 1, 544-552.<br />
Wakker, E. 1999 Forest fires and the expansion of Indonesia's oil-palm plantations, pp. 20.<br />
Jakarta: WWF Indonesia.<br />
Western, D. 1989 Conservation without parks: wildlife <strong>in</strong> the rural landscape. In Conservation<br />
for the 21st Century (ed. D. Western & M. C. Pearl). New York: Oxford University Press.<br />
White, G. C. & Burnham, K. P. 1999 Program MARK: survival estimation from populations of<br />
marked animals. Bird Study 46, 120-139.<br />
Woodroffe, R. & G<strong>in</strong>sberg, J. R. 1998 Edge effects and the ext<strong>in</strong>ction of populations <strong>in</strong>side<br />
protected areas. Science 280, 2126-2128.<br />
Zoological Society of London. 2003a Pigs, palms, people and <strong>tigers</strong>: survival of the <strong>Sumatran</strong><br />
tiger <strong>in</strong> a commercial landscape., pp. 6. London: Zoological Society of London.<br />
Zoological Society of London. 2003b Special <strong>report</strong> on the successful capture, radio-collar<strong>in</strong>g<br />
and release of a <strong>Sumatran</strong> tiger, pp. 14. London: Zoological Society of London.<br />
89
90<br />
APPENDICES<br />
PROBLEMS WITH “CAMTRAKKER” CAMERA TRAPS<br />
One of the ma<strong>in</strong> problems of 2003 was the reliability of the camera traps chosen for the<br />
research. “Camtrakkers” are a well known brand of camera trap. They were selected partly for<br />
their <strong>in</strong>creased security compared to other cameras but also because they used by various<br />
other conservation bodies <strong>in</strong> tropical conditions, despite be<strong>in</strong>g primarily designed for the<br />
American hunt<strong>in</strong>g market. Consider<strong>in</strong>g they are one of the most expensive models on the<br />
market their performance was particularly disappo<strong>in</strong>t<strong>in</strong>g. The problems came <strong>in</strong> three ma<strong>in</strong><br />
areas:<br />
Reliability:<br />
• Of 6 cameras bought <strong>in</strong> the last two years, 5 of 6 (83%) have broken beyond use.<br />
The last camera is extremely <strong>in</strong>sensitive and cannot be triggered deliberately, but<br />
occasionally still takes photos <strong>in</strong> the field..<br />
• From the shipment of 38 cameras that arrived <strong>in</strong> January 2003, 9 cameras (23%)<br />
were not work<strong>in</strong>g on arrival.<br />
• One year later, 13 (35%) have now needed to be returned for repair. However, tak<strong>in</strong>g<br />
<strong>in</strong>to account the fact we have had 8 stolen, the failure rate of the rema<strong>in</strong><strong>in</strong>g cameras<br />
is 43%.<br />
• Of the repaired and returned cameras, a further 1 was not work<strong>in</strong>g on arrival.<br />
• Of 38 cameras only 4 have caused no problems with<strong>in</strong> the first year. However, two of<br />
these were stolen with<strong>in</strong> a few months. Remov<strong>in</strong>g the 8 stolen cameras from the<br />
calculation leaves the result that only 2 (6%) of our shipment has worked satisfactorily<br />
for one year.<br />
• Of 44 cameras we are left with 16 work<strong>in</strong>g <strong>in</strong> the field and 4 “assumed work<strong>in</strong>g” (i.e.<br />
newly returned but no films yet developed)<br />
“Misfir<strong>in</strong>g”:<br />
• On some occasions “misfires” (photographs with no apparent subject) could occur<br />
due to vegetation warm<strong>in</strong>g and mov<strong>in</strong>g <strong>in</strong> the w<strong>in</strong>d or due to an animal pass<strong>in</strong>g by too<br />
fast to photograph. However, the former is usually easy to spot whilst the latter is not<br />
thought to occur regularly (we frequently photograph motorbikes driv<strong>in</strong>g by for<br />
example – there can’t be many animals mov<strong>in</strong>g much faster than this). Most misfires<br />
appear to be caused by a camera malfunction, with the camera tak<strong>in</strong>g photographs<br />
until the film ends at regular or fairly regular <strong>in</strong>tervals. Sometimes entire films are<br />
used up with<strong>in</strong> a few hours of set up and on occasion cameras rapidly take a<br />
succession of photos (with no delay) whilst be<strong>in</strong>g set up despite be<strong>in</strong>g turned off! This<br />
appears to be an issue with only certa<strong>in</strong> cameras despite some of these be<strong>in</strong>g<br />
extremely difficult to trigger deliberately.<br />
• 889 of 5113 negatives conta<strong>in</strong> no subject<br />
• This accounts for over 17% of all photographs taken and is our second most common<br />
reason for a camera to be triggered (Figure 64)
Person (conservation)<br />
Time / Date stamp:<br />
Figure 64 – Proportion of photographs accounted for by misfires and<br />
non-exposures compared to the ma<strong>in</strong> other subjects<br />
Accidental photo<br />
Leopard cat<br />
Bearded pig<br />
Test card<br />
Pig tailed macaque<br />
Jungle fowl<br />
Person (plantation)<br />
Person (unknown)<br />
Tiger<br />
East Asian porcup<strong>in</strong>e<br />
Long tailed macaque<br />
Out of focus<br />
No exposure<br />
Pig (wild)<br />
Misfire (no subject)<br />
• The time/date stamp is our only reference match<strong>in</strong>g photographs to records of where<br />
cameras were placed at the time. Without it, the location of most photographs cannot<br />
be determ<strong>in</strong>ed and thus the use of the image for most of our research questions is<br />
highly restricted.<br />
• Of films where the date appeared at least once (i.e. the time/date stamp was turned<br />
on), 1195 of 5113 or 23% of negatives have the time/date stamp bleached out. This<br />
does not <strong>in</strong>clude photographs for which the date could be worked out based on<br />
previous and subsequent photographs.<br />
• Date bleach<strong>in</strong>g most often occurs <strong>in</strong> photographs taken dur<strong>in</strong>g the day. 43% of<br />
photographs taken <strong>in</strong> the day have no time/date stamp.<br />
• Bleach<strong>in</strong>g is not dependent on the developer and occurs at developers <strong>in</strong> the UK and<br />
Indonesia equally.<br />
Insensitivity:<br />
• After sett<strong>in</strong>g up, cameras are tested by a human hold<strong>in</strong>g a sign show<strong>in</strong>g the date and<br />
location. If the camera cannot be triggered manually (tak<strong>in</strong>g <strong>in</strong>to account the 10<br />
m<strong>in</strong>ute “warm up” period mentioned <strong>in</strong> the <strong>in</strong>structions) it is recorded as <strong>in</strong>sensitive.<br />
• 12 of 16 cameras (75%) currently work<strong>in</strong>g <strong>in</strong> the field have caused problems when<br />
try<strong>in</strong>g to test.<br />
• Insensitivity is of particular importance when compar<strong>in</strong>g “trapp<strong>in</strong>g” results from<br />
different areas. At present we have no way of know<strong>in</strong>g whether a relative lack of<br />
photographs from one area represents a low density of <strong>tigers</strong> or whether it simply<br />
shows where we put our poorest cameras!<br />
91
Common name Lat<strong>in</strong> name Total<br />
photos<br />
92<br />
LIST OF ALL SUBJECTS PHOTOGRAPHED<br />
Total<br />
<strong>in</strong>dividuals<br />
Average<br />
<strong>in</strong>dividuals<br />
per photo<br />
Total georeferenced<br />
<strong>in</strong>dividuals<br />
% total georeferenced<br />
photos<br />
% total georeferenced<br />
<strong>in</strong>dividuals<br />
Accidental<br />
photo<br />
334 334 1.00 211 3.06% 2.55%<br />
Misfire (no<br />
subject)<br />
2485 2486 1.00 1966 28.49% 23.78%<br />
Motorbike<br />
(nonplantation)<br />
13 13 1.00 13 0.19% 0.16%<br />
Motorbike<br />
(plantation /<br />
conservation)<br />
58 62 1.07 61 0.83% 0.74%<br />
No exposure 1382 1382 1.00 41 0.59% 0.50%<br />
Out of focus 100 100 1.00 82 1.19% 0.99%<br />
Person<br />
(conservation)<br />
783 982 1.25 816 9.45% 9.87%<br />
Person<br />
(plantation)<br />
251 331 1.32 289 3.35% 3.49%<br />
Person<br />
(unknown)<br />
603 978 1.62 720 6.78% 8.71%<br />
Test card 502 502 1.00 462 6.69% 5.59%<br />
Vehicle (nonplantation)<br />
25 26 1.04 26 0.36% 0.31%<br />
Vehicle<br />
(plantation /<br />
conservation)<br />
77 77 1.00 66 0.96% 0.80%<br />
Wreathed<br />
hornbill<br />
Aceros undulates 1 1 1.00 1 0.01% 0.01%<br />
White Amauronis<br />
12 14 1.17 13 0.16% 0.16%<br />
breasted<br />
waterhen<br />
phoenicurus<br />
Argus Argusianus<br />
2 3 1.50 3 0.03% 0.04%<br />
pheasant argus<br />
Rh<strong>in</strong>oceros Buceros<br />
2 2 1.00 2 0.03% 0.02%<br />
Hornbill rh<strong>in</strong>oceros<br />
Plante<strong>in</strong> Calosciurus<br />
8 8 1.00 8 0.12% 0.10%<br />
squirrel notatus<br />
Domestic dog Canis familiaris 33 47 1.42 32 0.33% 0.39%<br />
Greater Centropus<br />
1 1 1.00 1 0.01% 0.01%<br />
coucal s<strong>in</strong>ensis<br />
Sambar Cervus unicolor 28 29 1.04 18 0.25% 0.22%<br />
Emerald Dove Chalcophaps<br />
<strong>in</strong>dica<br />
4 4 1.00 3 0.04% 0.04%<br />
Dhole Cuon alp<strong>in</strong>us 21 29 1.38 26 0.29% 0.31%<br />
Banded palm Diplogale<br />
2 2 1.00 2 0.03% 0.02%<br />
civet<br />
derbyanus<br />
Domestic cat Felis cattus 5 5 1.00 5 0.07% 0.06%<br />
Jungle fowl Gallus gallus 109 130 1.19 123 1.51% 1.49%<br />
Sun bear Helarctos<br />
malayanus<br />
35 39 1.11 27 0.38% 0.33%<br />
Short tailed Herpestes<br />
25 25 1.00 24 0.35% 0.29%<br />
mongoose brachyurus<br />
East Asian Hystrix<br />
137 147 1.07 134 1.83% 1.62%<br />
porcup<strong>in</strong>e brachyuran<br />
Three striped<br />
ground<br />
squirrel<br />
Lariscus <strong>in</strong>sig<strong>in</strong>s 4 4 1.00 4 0.06% 0.05%<br />
Crestless Lophura<br />
2 3 1.50 3 0.03% 0.04%<br />
Fireback erythrophthalma<br />
Long tailed Macaca<br />
44 68 1.55 35 0.36% 0.42%<br />
macaque fascicularis<br />
Pig tailed Macaca<br />
nemestr<strong>in</strong>a<br />
507 759 1.50 647 6.25% 7.82%
macaque<br />
Pangol<strong>in</strong> Manis javanica 2 3 1.50 3 0.03% 0.04%<br />
Yellow<br />
throated<br />
marten<br />
Martes flavigula 2 2 1.00 1 0.01% 0.01%<br />
Red sp<strong>in</strong>y rat Maxomys surifer 1 1 1.00 1 0.01% 0.01%<br />
Muntjac Muntiacus<br />
muntjak<br />
84 95 1.13 86 1.12% 1.04%<br />
Clouded Neofelis<br />
2 2 1.00 2 0.03% 0.02%<br />
leopard nebulosa<br />
Tiger Panthera tigris 112 113 1.01 102 1.46% 1.23%<br />
Common Paradoxurus 57 57 1.00 56 0.81% 0.68%<br />
palm civet hermaphroditus<br />
Banded Presbytis<br />
1 1 1.00 1 0.01% 0.01%<br />
langur melalophos<br />
Leopard cat Prionailurus<br />
bengalensis<br />
193 194 1.01 184 2.65% 2.23%<br />
Crested<br />
partridge<br />
Rollulus rouloul 1 4 4.00 4 0.01% 0.05%<br />
Bearded pig Sus barbatus 168 349 2.08 308 2.26% 3.72%<br />
Pig (wild) Sus scrofa 1201 1701 1.42 1558 16.11% 18.84%<br />
Malayan tapir Tapirus <strong>in</strong>dicus 54 54 1.00 48 0.70% 0.58%<br />
Lesser mouse Tragulus<br />
15 15 1.00 14 0.20% 0.17%<br />
deer<br />
javanicus<br />
Greater<br />
mouse deer<br />
Tragulus napu 9 11 1.22 11 0.13% 0.13%<br />
Long tailed Trichys<br />
1 1 1.00 1 0.01% 0.01%<br />
porcup<strong>in</strong>e fascilulata<br />
Common tree<br />
shrew<br />
Tupaia glis 1 1 1.00 1 0.01% 0.01%<br />
Large tree<br />
shrew<br />
Tupaia tana 2 2 1.00 2 0.03% 0.02%<br />
Monitor lizard Varanus salvator 6 6 1.00 5 0.07% 0.06%<br />
Malay Civet Vivera<br />
tangalunga<br />
19 19 1.00 17 0.25% 0.21%<br />
93
DISTRIBUTION MAPS<br />
Canidae distribution...................................................................................................................................................................................................................................................................................................................2<br />
Cercopithecidae and Hylobates distribution.......................................................................................................................................................................................................................................................................3<br />
Cervidae distribution.................................................................................................................................................................................................................................................................................................................4<br />
Felidae distribution.....................................................................................................................................................................................................................................................................................................................5<br />
Mustelidae distribution .............................................................................................................................................................................................................................................................................................................6<br />
Suidae distribution......................................................................................................................................................................................................................................................................................................................7<br />
Tapiridae distribution................................................................................................................................................................................................................................................................................................................8<br />
Ursidae distribution....................................................................................................................................................................................................................................................................................................................9<br />
Viverridae distribution ........................................................................................................................................................................................................................................................................................................... 10<br />
Other small mammals (Lorisidae, Manidae, Hystricidae, Tragulidae) distribution............................................................................................................................................................................................. 11<br />
Human camera trap photos and illegal activity distribution ....................................................................................................................................................................................................................................... 12
CANIDAE DISTRIBUTION<br />
2
3<br />
CERCOPITHECIDAE AND HYLOBATES DISTRIBUTION
CERVIDAE DISTRIBUTIO N<br />
4
5<br />
FELIDAE DISTRIBUTION
MUSTELIDAE DISTRIBUTION<br />
6
7<br />
SUIDAE DISTRIBUTION
TAPIRIDAE DISTRIBUTION<br />
8
9<br />
URSIDAE DISTRIBUTION
VIVERRIDAE DISTRIBUTION<br />
10
11<br />
OTHER SMALL MAMMAL D ISTRIBUTION<br />
(Lorisidae, Manidae, Hystricidae, Tragulidae)
HUMAN AND ILLEGAL ACTIVITY DISTRIBUTION<br />
12