Genomic Selection 101 - Department of Animal Science
Genomic Selection 101 - Department of Animal Science
Genomic Selection 101 - Department of Animal Science

You also want an ePaper? Increase the reach of your titles
YUMPU automatically turns print PDFs into web optimized ePapers that Google loves.
<strong>Genomic</strong> <strong>Selection</strong> <strong>101</strong><br />
Basics and experiences in cattle<br />
Van Eenennaam BMM 2/15/2012<br />
breeding systems<br />
Alison Van Eenennaam, Ph.D.<br />
Cooperative Extension Specialist<br />
<strong>Animal</strong> Biotechnology and <strong>Genomic</strong>s<br />
<strong>Department</strong> <strong>of</strong> <strong>Animal</strong> <strong>Science</strong><br />
University <strong>of</strong> California, Davis<br />
(530) 752-7942<br />
alvaneenennaam@ucdavis.edu<br />
http://animalscience.ucdavis.edu/animalbiotech/
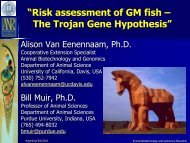
Phenotyping animals is so much<br />
more fun than phenotyping plants…<br />
Van Eenennaam BMM 2/15/2012<br />
<strong>Animal</strong> Biotechnology and <strong>Genomic</strong>s Education
Relative to plants – animal<br />
breeders really have it hard<br />
Long generation interval<br />
Cannot self (at least domestic livestock can’t!)<br />
Have limited family sizes (<strong>of</strong>ten one <strong>of</strong>fspring/yr)<br />
Cannot make RILs easily in domestic livestock<br />
Certainly can’t make double haploids (except fish)<br />
Expensive to phenotype<br />
Can’t measure milk production on bulls<br />
Can’t indiscriminately discard unwanted ones<br />
Most traits seem to obey infinitesimal model<br />
Van Eenennaam BMM 2/15/2012<br />
<strong>Animal</strong> Biotechnology and <strong>Genomic</strong>s Education
But the end product is so<br />
much more satisfying!<br />
Van Eenennaam BMM 2/15/2012<br />
<strong>Animal</strong> Biotechnology and <strong>Genomic</strong>s Education
Overview<br />
Introduction to cattle breeding<br />
<strong>Genomic</strong> selection<br />
Practical questions for breeders<br />
– Dairy Industry as a genomic selection success story<br />
– Beef Industry as an “opportunity for improvement”<br />
What does the future hold<br />
Note: I have drawn a lot <strong>of</strong> my material from published literature and would<br />
highly recommend you read the references listed at the bottom <strong>of</strong> the slide<br />
to more fully understand this brief overview <strong>of</strong> complex concepts.<br />
Van Eenennaam BMM 2/15/2012<br />
<strong>Animal</strong> Biotechnology and <strong>Genomic</strong>s Education
Van Eenennaam BMM 2/15/2012<br />
MILK<br />
MEAT<br />
Holstein -<br />
Dairy<br />
Angus -<br />
Beef<br />
<strong>Animal</strong> Biotechnology and <strong>Genomic</strong>s Education
Van Eenennaam BMM 2/15/2012<br />
EPD = expected<br />
progeny difference<br />
<strong>Animal</strong> Biotechnology and <strong>Genomic</strong>s Education
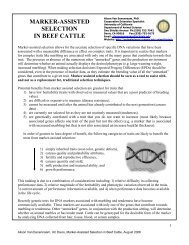
Before 2010: Marker-assisted<br />
selection using 1-100 SNPs<br />
Meat Tenderness<br />
Quality Grade (Marbling)<br />
Beef Cattle Feed Efficiency<br />
Meat Yield<br />
Disease Resistance<br />
Dairy Form<br />
Milk and Milk Component Yield<br />
Van Eenennaam BMM 2/15/2012<br />
<strong>Animal</strong> Biotechnology and <strong>Genomic</strong>s Education
One marbling SNP called GeneStar<br />
“*” refers to copy <strong>of</strong> desirable SNP<br />
Which would you rather have???<br />
A bull that is<br />
‘homozygous’ for a<br />
positive genetic variant<br />
with a low-accuracy EPD<br />
<strong>of</strong> +3, or<br />
Or an unrelated bull<br />
carrying no copies <strong>of</strong><br />
that genetic variant with<br />
a low-accuracy EPD <strong>of</strong><br />
+3<br />
Van Eenennaam BMM 2/15/2012<br />
**<br />
<strong>Animal</strong> Biotechnology and <strong>Genomic</strong>s Education
Both are important!!<br />
The ‘homozygous’ bull is a source <strong>of</strong> favorable<br />
form <strong>of</strong> one <strong>of</strong> the genetic variants. Can<br />
eventually be used to create homozygous calves<br />
The other bull contributes other favorable<br />
“marbling” genes, which will improve the other<br />
genes affecting the trait.<br />
Breeding the marker-associated form <strong>of</strong> the<br />
gene into the bull that has no copies should<br />
improve the trait by combining all <strong>of</strong> the good<br />
forms <strong>of</strong> the genes together in one animal<br />
Van Eenennaam BMM 2/15/2012<br />
<strong>Animal</strong> Biotechnology and <strong>Genomic</strong>s Education
What was wrong with this<br />
MAS model?<br />
Problem with traditional Marker-assisted selection<br />
(MAS) approaches is the effect <strong>of</strong> individual<br />
quantitative trait loci (QTL) on complex traits, such<br />
as yield, are likely to be small.<br />
A large number <strong>of</strong> QTL are necessary to explain the<br />
genetic variation in these traits<br />
The usefulness <strong>of</strong> information from a sparse marker<br />
map in outbreeding species is also limited because<br />
the linkage phase between the marker and the QTL<br />
must be established for every family<br />
Van Eenennaam BMM 2/15/2012<br />
<strong>Animal</strong> Biotechnology and <strong>Genomic</strong>s Education
<strong>Genomic</strong> selection<br />
Alternative is to trace all segments <strong>of</strong><br />
the genome with markers<br />
Divide genome into chromosome<br />
segments based on marker intervals<br />
Capture all QTL = all genetic variance<br />
Marker density must be sufficiently high to<br />
ensure that all QTL are in linkage disequilibrium<br />
(LD) with a SNP marker<br />
Meuwissen, T. H. E., B. J. Hayes, and M. E. Goddard.<br />
2001. Prediction <strong>of</strong> Total Genetic Value Using Genome-<br />
Wide Dense Marker Maps. Genetics, Vol. 157, 1819-1829<br />
Van Eenennaam BMM 2/15/2012<br />
<strong>Animal</strong> Biotechnology and <strong>Genomic</strong>s Education
Wrong Expert Predictions<br />
I think there's a world market for about five<br />
computers.<br />
Thomas J. Watson, chairman <strong>of</strong> the board <strong>of</strong> IBM. 1943<br />
There is no reason anyone would want a<br />
computer in their home.<br />
Ken Olson, president <strong>of</strong> Digital Equipment Corp. 1977<br />
The cost for a genome scan (defined as 18<br />
chromosomes* 7 markers (i.e. 126<br />
markers!) * $4/marker) = $504<br />
Ben Hayes and Mike Goddard, 2003. Evaluation <strong>of</strong> marker assisted selection in<br />
pig enterprises. Livestock Production <strong>Science</strong> 81:197-211.<br />
Van Eenennaam BMM 2/15/2012<br />
<strong>Animal</strong> <strong>Genomic</strong>s and Biotechnology Education
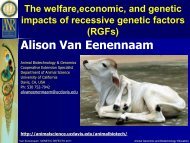
Potential benefits <strong>of</strong> genomics are<br />
greatest for economically-<br />
important traits that:<br />
Are difficult or<br />
expensive to measure<br />
Cannot be measured<br />
until late in life or after<br />
the animal is dead<br />
Are not currently<br />
selected for because<br />
they are not routinely<br />
measured and so there<br />
are no selection<br />
criteria available<br />
Have low heritability<br />
Van Eenennaam BMM 2/15/2012<br />
Yep, looks like<br />
all <strong>of</strong> ‘em were<br />
susceptible<br />
<strong>Animal</strong> Biotechnology and <strong>Genomic</strong>s Education
<strong>Genomic</strong> selection is enabled by high-<br />
throughput genotyping technology<br />
The sequencing <strong>of</strong> the bovine genome allowed<br />
for the development <strong>of</strong> a 50,000 SNP chip<br />
Can simultaneously test 50,000 markers – rather<br />
than one<br />
Van Eenennaam BMM 2/15/2012<br />
<strong>Animal</strong> Biotechnology and <strong>Genomic</strong>s Education
Illumina has a<br />
50,000 (50K)<br />
and a 770,000<br />
(700K) SNP<br />
chip for cattle<br />
Hayes and Goddard. 2009.<br />
Mapping genes for complex traits<br />
in domestic animals and their use<br />
in breeding programmes. Nature<br />
Reviews Genetics 10, 381-391<br />
Van Eenennaam BMM 2/15/2012<br />
<strong>Animal</strong> Biotechnology and <strong>Genomic</strong>s Education
Practical questions for<br />
breeders<br />
How many phenotypic records are required in the<br />
initial experiment (reference population) used to<br />
estimate the effect <strong>of</strong> chromosome segments?<br />
Van Eenennaam BMM 2/15/2012<br />
<strong>Animal</strong> Biotechnology and <strong>Genomic</strong>s Education
Accuracy <strong>of</strong> the prediction<br />
equation proportional to:<br />
Th 2<br />
ML<br />
T: total number <strong>of</strong> records in the training population<br />
h 2 : heritability <strong>of</strong> the trait<br />
L : length <strong>of</strong> chromosomes (in Morgans)<br />
M: ~ 2N e (effective population size)<br />
Goddard, M. E. 2009. <strong>Genomic</strong> selection: prediction <strong>of</strong> accuracy and<br />
maximisation <strong>of</strong> long term response. Genetica 136:245-257.<br />
Van Eenennaam BMM 2/15/2012<br />
<strong>Animal</strong> Biotechnology and <strong>Genomic</strong>s Education
Effective population size<br />
estimates for cattle<br />
Breed N e Breed N e<br />
Angus 136 Brown Swiss 61<br />
Charolais 110 Guernsey 76<br />
Hereford 97 Holstein 99<br />
Limousin 174 Jersey 73<br />
Red Angus 85 Norwegian Red 106<br />
Brahman 115 Gir 133<br />
Nelore 86<br />
Beef Master 106 Merino (sheep) ~ Big (> 100)<br />
Santa Gertrudis 107 Ben Hayes<br />
(pers. comm.)<br />
Genome-Wide Survey <strong>of</strong> SNP Variation Uncovers the Genetic Structure <strong>of</strong> Cattle Breeds. 2009<br />
The Bovine HapMap Consortium. <strong>Science</strong> 3245: 528-532. Supporting Online Material. Table S1.<br />
http://www.sciencemag.org/content/suppl/2009/04/22/324.5926.528.DC1<br />
Van Eenennaam BMM 2/15/2012<br />
<strong>Animal</strong> Biotechnology and <strong>Genomic</strong>s Education
Effect <strong>of</strong> number <strong>of</strong> animals on accuracy <strong>of</strong><br />
prediction equation (for a N e <strong>of</strong> 100)<br />
Goddard, M. E., and B. J. Hayes. 2009. Mapping genes for complex traits in domestic animals and<br />
their use in breeding programmes. Nature Reviews Genetics 10: 381-391.<br />
Van Eenennaam BMM 2/15/2012<br />
<strong>Animal</strong> Biotechnology and <strong>Genomic</strong>s Education
Effect <strong>of</strong> population size and heritability on the<br />
number <strong>of</strong> animals required in the training<br />
population (for an accuracy <strong>of</strong> 0.7)<br />
Goddard, M. E., and B. J. Hayes. 2009. Mapping genes for complex traits in domestic animals<br />
and their use in breeding programmes. Nature Reviews Genetics 10: 381-391.<br />
Van Eenennaam BMM 2/15/2012<br />
<strong>Animal</strong> Biotechnology and <strong>Genomic</strong>s Education
There is also an effect <strong>of</strong> trait architecture<br />
The accuracy <strong>of</strong> predicting genetic values is higher for traits with a<br />
proportion <strong>of</strong> large effects (e.g. proportion black and fat percentage)<br />
than for a trait with no loci <strong>of</strong> large effect (e.g. overall type), provided<br />
the method <strong>of</strong> analysis takes advantage <strong>of</strong> the distribution <strong>of</strong> loci effects.<br />
Hayes, B. J., J. Pryce, A. J. Chamberlain, P. J. Bowman, and M. E. Goddard. 2010. Genetic Architecture<br />
<strong>of</strong> Complex Traits and Accuracy <strong>of</strong> <strong>Genomic</strong> Prediction: Coat Colour, Milk-Fat Percentage, and Type in<br />
Holstein Cattle as Contrasting Model Traits. Plos Genet 6<br />
Van Eenennaam BMM 2/15/2012<br />
<strong>Animal</strong> Biotechnology and <strong>Genomic</strong>s Education
Maybe R.A. Fisher was onto<br />
something?<br />
Van Eenennaam BMM 2/15/2012<br />
If a nearly<br />
infinitesimal model<br />
is correct as seems<br />
to be the case for<br />
most quantitative<br />
traits; then large<br />
sample sizes will be<br />
needed to achieve<br />
high accuracy<br />
<strong>Animal</strong> Biotechnology and <strong>Genomic</strong>s Education
Number <strong>of</strong> effects >>><br />
number <strong>of</strong> records<br />
When we come to estimate the allelic<br />
effects <strong>of</strong> all <strong>of</strong> these markers, we are<br />
faced with estimating many effects in a<br />
data set <strong>of</strong> limited size, and there are not<br />
enough degrees <strong>of</strong> freedom to fit all<br />
marker effects simultaneously<br />
Need methods that can deal with that<br />
Van Eenennaam BMM 2/15/2012<br />
<strong>Animal</strong> Biotechnology and <strong>Genomic</strong>s Education
Statistical methods for<br />
genomic selection<br />
A number <strong>of</strong> approaches have been proposed for<br />
estimating the single marker or haplotype effects<br />
across chromosome segment effects for genomic<br />
selection. The key differences between these<br />
approaches is the assumption they make about<br />
the variances <strong>of</strong> haplotype or single marker<br />
effects across chromosome segments, and<br />
whether is some proportion <strong>of</strong> markers that have<br />
a zero effect.<br />
Van Eenennaam BMM 2/15/2012<br />
<strong>Animal</strong> Biotechnology and <strong>Genomic</strong>s Education
Dairy industry has successfully<br />
implemented genomic selection<br />
Validation: Purpose is<br />
to estimate the<br />
correlation between<br />
the prediction and the<br />
true genetic merit<br />
Training 1:<br />
Old Progeny Tested Bulls<br />
Training 2:<br />
Old & New Progeny Tested Bulls<br />
Van Eenennaam BMM 2/15/2012<br />
r 0<br />
r 1<br />
Validation:<br />
New Progeny<br />
Tested Bulls<br />
Application:<br />
New Sire<br />
Candidates<br />
Slide courtesy <strong>of</strong> Marc Thallman, US MARC<br />
<strong>Animal</strong> Biotechnology and <strong>Genomic</strong>s Education
Dairy industry<br />
suited to WGS<br />
• High use <strong>of</strong> AI<br />
• Clear selection goal<br />
• One breed used extensively<br />
• Large number <strong>of</strong> high accuracy A.I. sires for training<br />
• Extensive, uniform collection <strong>of</strong> data on traits<br />
• Central evaluation (AIPL) receiving genotypes<br />
• Obvious way to increase rate <strong>of</strong> genetic gain<br />
• AI companies funding the genotyping because they<br />
get a clear cost savings in terms <strong>of</strong> young sire<br />
program<br />
Van Eenennaam BMM 2/15/2012<br />
<strong>Animal</strong> Biotechnology and <strong>Genomic</strong>s Education
Young sire<br />
Parent Average<br />
A S<br />
x<br />
A D<br />
Mendelian Sampling ?<br />
Accuracy 0.20<br />
Breeding value prediction in<br />
Dairy Sires<br />
x<br />
Birth 5 years; $50,000 cost Birth;
<strong>Genomic</strong> selection can help breeders<br />
identify individuals with superior<br />
breeding values at a young age<br />
ΔG = intensity <strong>of</strong> selection X<br />
Van Eenennaam BMM 2/15/2012<br />
accuracy <strong>of</strong> selection X<br />
stand. dev. genetic variation<br />
generation interval
<strong>Genomic</strong> selection can<br />
double rate <strong>of</strong> genetic gain<br />
Rate <strong>of</strong> genetic gain ΔG<br />
ΔG = (i m r m +i f r f)/ (L m + L f) genetic standard deviation/year<br />
= (2*0.8 + 0)/ (6+2) = 0.2 s.d./year (progeny test)<br />
= (2*0.6 + 0.8*0.6)/ (2+2) = 0.42 (genomic selection)<br />
i = intensity <strong>of</strong> selection<br />
r = accuracy <strong>of</strong> selection<br />
L = generation interval<br />
Modified from Goddard. (2009) BIF Meeting<br />
<strong>Animal</strong> Biotechnology and <strong>Genomic</strong>s Education
Practical questions for<br />
breeders<br />
How many phenotypic records are required in the initial<br />
experiment (reference population) used to estimate the<br />
effect <strong>of</strong> chromosome segments?<br />
How <strong>of</strong>ten do we need to re-estimate the<br />
chromosome segment effects?<br />
Van Eenennaam BMM 2/15/2012<br />
<strong>Animal</strong> Biotechnology and <strong>Genomic</strong>s Education
How <strong>of</strong>ten is it necessary to re-<br />
estimate the marker effects?<br />
Meuwissen, T. H. E., B. J. Hayes, and M. E. Goddard. 2001. Prediction <strong>of</strong> Total Genetic<br />
Value Using Genome-Wide Dense Marker Maps. Genetics, Vol. 157, 1819-1829<br />
Van Eenennaam BMM 2/15/2012<br />
<strong>Animal</strong> Biotechnology and <strong>Genomic</strong>s Education
Markers can predict family relationships between<br />
animals, independently <strong>of</strong> LD between the markers<br />
and QTL (i.e. due to family relationships or linkage)<br />
Additivegenetic<br />
relationships<br />
between<br />
training and<br />
validation<br />
animals was<br />
found to be<br />
a good<br />
indicator <strong>of</strong><br />
accuracy<br />
Habier, D., J. Tetens, F.-R. Seefried, P. Lichtner, and G. Thaller. 2010. The impact <strong>of</strong> genetic relationship information<br />
on genomic breeding values in German Holstein cattle. Genetics <strong>Selection</strong> Evolution 42: Article No.: 5
In general accuracy is higher<br />
when:<br />
A large number <strong>of</strong> animals and high-quality<br />
phenotypic records available for training<br />
Trait is highly heritable<br />
Small effective population size so small number<br />
<strong>of</strong> chromosome segments to track<br />
There are genetic relationships (linkage)<br />
between training and selection candidates<br />
Small number <strong>of</strong> QTL affecting the trait so there<br />
is a marker associated with every QTL<br />
Retrain the prediction equation every generation<br />
Van Eenennaam BMM 2/15/2012 <strong>Animal</strong> <strong>Genomic</strong>s and Biotechnology Education
<strong>Animal</strong> Biotechnology and <strong>Genomic</strong>s Education
The Beef<br />
Cattle Industry<br />
Little use <strong>of</strong> AI<br />
Relatively few high accuracy sires for training<br />
Multiple competing selection goals – cow/calf, feedlot,<br />
processor – little data/value sharing between sectors<br />
Few/no records on many economically-relevant traits<br />
Many breeds, some small with limited resources<br />
Crossbreeding is important<br />
No one wants to pay as value is not recovered by breeder<br />
A perfect storm is a confluence <strong>of</strong> events that<br />
drastically aggravates a situation<br />
Van Eenennaam BMM 2/15/2012<br />
<strong>Animal</strong> Biotechnology and <strong>Genomic</strong>s Education
Practical questions for<br />
breeders<br />
How many phenotypic records are required in the initial<br />
experiment (reference population) used to estimate the<br />
effect <strong>of</strong> chromosome segments?<br />
How <strong>of</strong>ten do we need to re-estimate the chromosome<br />
segment effects?<br />
Does it work across breeds/strain/cultivars?<br />
Van Eenennaam BMM 2/15/2012<br />
NO<br />
at least not with 50K in cattle
Marker location relative to the gene <strong>of</strong> interest in<br />
two breeds when using the 50K SNP chip assay does<br />
not work across breeds<br />
“Our results suggest that the most accurate genomic predictions are<br />
achieved when phenotypes from all populations are combined in one<br />
training set, while for more diverged populations a higher marker density (in<br />
the case <strong>of</strong> cattle >300,000 SNP) is required.”<br />
de Roos, A.P.W., B.J. Hayes, and M. E. Goddard. 2009. Reliability <strong>of</strong> <strong>Genomic</strong><br />
Predictions Across Multiple Populations. Genetics. 183(4): 1545–1553<br />
Van Eenennaam BMM 2/15/2012<br />
<strong>Animal</strong> Biotechnology and <strong>Genomic</strong>s Education
Lead Today with 50K<br />
1. Birth weight<br />
2. Weaning weight<br />
3. Weaning maternal (milk)<br />
4. Calving ease direct<br />
5. Calving ease maternal<br />
6. Marbling<br />
7. Backfat thickness<br />
8. Ribeye area<br />
9. Carcass weight<br />
10. Tenderness<br />
11. Postweaning average daily gain<br />
12. Daily feed intake<br />
13. Feed efficiency (net feed intake)<br />
50K SNP chip assays<br />
50,000 SNPs spread<br />
throughout genome ($139)
Practical questions for<br />
breeders<br />
How many phenotypic records are required in the initial<br />
experiment (reference population) used to estimate the<br />
effect <strong>of</strong> chromosome segments?<br />
How <strong>of</strong>ten do we need to re-estimate the chromosome<br />
segment effects?<br />
Does it work across breeds/strain/cultivars?<br />
How many markers do you need – 50K, 770K,<br />
whole genome?<br />
What about less expensive reduced panels – can<br />
they work?<br />
Van Eenennaam BMM 2/15/2012
1. Dry Matter Intake<br />
2. Birth Weight<br />
3. Mature Height<br />
4. Mature Weight<br />
5. Milk<br />
6. Scrotal Circumference<br />
7. Weaning Weight<br />
8. Yearling Weight<br />
9. Marbling<br />
10. Ribeye Area<br />
11. Fat Thickness<br />
12. Carcass Weight<br />
13. Tenderness<br />
14. Percent Choice (quality grade)<br />
15. Heifer Pregnancy<br />
16. Maternal Calving Ease<br />
17. Direct Calving Ease<br />
18. Docility<br />
19. Average Daily Gain<br />
20. Feed Efficiency<br />
21. Yearling Height<br />
22. Scrotal Circumfrence<br />
384 SNP<br />
~$40<br />
<strong>Animal</strong> Biotechnology and <strong>Genomic</strong>s Education
Reduced SNP panels: Accuracy <strong>of</strong> direct genomic<br />
value (DGV) <strong>of</strong> dairy bulls using subsets <strong>of</strong> 5,000<br />
or less <strong>of</strong> best SNP for each trait<br />
Accuracy<br />
Number <strong>of</strong> SNP<br />
Traits :<br />
Protein %<br />
ASI (Australian <strong>Selection</strong> Index)<br />
APR (Australian Pr<strong>of</strong>it Rank)<br />
Predictions based on<br />
Reduced SNP panels: Percentage <strong>of</strong> the highest<br />
ranked SNP that are shared between sets <strong>of</strong> traits*<br />
for subsets including 500, 1,000, 5,000 or 10,000 SNP<br />
* Dairy traits included:<br />
1. Protein<br />
2. Protein %<br />
3. Survival<br />
4. Fat %<br />
5. Milk<br />
6. Overall Type<br />
7. APR (Australian Pr<strong>of</strong>it Rank)<br />
8. ASI (Australian <strong>Selection</strong> Index)<br />
9. Fat<br />
Few SNPs were in<br />
common between<br />
the trait-specific<br />
subsets<br />
Moser, G., M. S. Khatkar, B. J. Hayes, and H. W. Raadsma. 2010. Accuracy <strong>of</strong> direct genomic values in<br />
Holstein bulls and cows using subsets <strong>of</strong> SNP markers. Genetics <strong>Selection</strong> Evolution 42.
Summary <strong>of</strong> what the literature is<br />
telling us about genomic selection<br />
Prediction equations derived in one breed do not predict<br />
accurate GEBVs when applied to other breeds<br />
Combining breeds into one large multi-breed reference<br />
population may give reasonable accuracies in purebreds<br />
To find markers that are in LD with QTL across diverged<br />
breeds, such as Holstein, Jersey, and Angus, will require high<br />
density SNPs (>300,000 informative markers in cattle)<br />
If markers are picking up family relationships (linkage), then<br />
the accuracy <strong>of</strong> marker-based selection will decay over<br />
generations within a breed/line/cultivar<br />
Few <strong>of</strong> the “best” markers for one trait are common to<br />
another so “reduced panels” will need to be designed for<br />
imputation not single trait selection<br />
Van Eenennaam BMM 2/15/2012 <strong>Animal</strong> <strong>Genomic</strong>s and Biotechnology Education
Marker location relative to the gene <strong>of</strong> interest in two<br />
breeds when using the (A) 50K SNP chip assay (markers<br />
spaced at ~ 70 kb intervals), or (B) the high density 700<br />
K SNP chip assay (markers spaced at ~ 5 kb intervals)<br />
Van Eenennaam BMM 2/15/2012<br />
<strong>Animal</strong> Biotechnology and <strong>Genomic</strong>s Education
It may be necessary to go to whole<br />
genome resequencing – select with<br />
the causative SNPs (rather than LD)?<br />
Cost is likely to get to as low as $1000/animal<br />
Whole genome data >40% more accurate than<br />
dense SNP chips<br />
Need to use Bayesian approaches to estimate SNP<br />
effects<br />
Predictions remained accurate in populations 10<br />
generations removed from the reference population<br />
Meuwissen, T. and M. Goddard. 2010. Accurate<br />
prediction <strong>of</strong> genetic values for complex traits by<br />
whole-genome resequencing. Genetics 183:623-631.<br />
Van Eenennaam BMM 2/15/2012 <strong>Animal</strong> <strong>Genomic</strong>s and Biotechnology Education
Practical questions for breeders –<br />
some still unanswered!<br />
How many phenotypic records are required in the initial<br />
experiment (reference population) used to estimate the<br />
effect <strong>of</strong> chromosome segments?<br />
How <strong>of</strong>ten do we need to re-estimate the chromosome<br />
segment effects?<br />
Does it work across breeds/strain/cultivars?<br />
How many markers do you need – reduced panel (eg.<br />
3K), 50K, 770K, whole genome?<br />
How much can you afford to pay? (and who pays)<br />
Does this technology change optimal breeding<br />
program design? Absolutely need a multi-trait<br />
$selection index based on breeding objective.<br />
Van Eenennaam BMM 2/15/2012
Questions?<br />
Van Eenennaam BMM 2/15/2012 <strong>Animal</strong> <strong>Genomic</strong>s and Biotechnology Education