Methods Fast food menus and nutritional quality - Fast Food FACTS
Methods Fast food menus and nutritional quality - Fast Food FACTS
Methods Fast food menus and nutritional quality - Fast Food FACTS

You also want an ePaper? Increase the reach of your titles
YUMPU automatically turns print PDFs into web optimized ePapers that Google loves.
We used a variety of data sources <strong>and</strong> methods<br />
to provide the most comprehensive <strong>and</strong> objective<br />
analysis possible of the United States fast <strong>food</strong><br />
market. These data enabled us to thoroughly<br />
document <strong>and</strong> evaluate the <strong>menus</strong> <strong>and</strong> marketing<br />
practices of the nation’s largest fast <strong>food</strong><br />
restaurants.<br />
Our methods included analyzing the <strong>nutritional</strong> <strong>quality</strong> of<br />
restaurant menu items; analyzing data on media exposure<br />
<strong>and</strong> spending from syndicated sources (i.e., The Nielsen<br />
Company, comScore Inc. <strong>and</strong> Arbitron Inc); conducting<br />
content analyses of TV advertisements, company websites,<br />
internet banner advertising, social <strong>and</strong> viral media, <strong>and</strong><br />
mobile marketing applications; commissioning an audit of<br />
marketing practices inside fast <strong>food</strong> restaurants across the<br />
United States; evaluating syndicated data from The NPD<br />
Group, a market research company, documenting menu item<br />
purchases; <strong>and</strong> conducting a survey of parents about their<br />
fast <strong>food</strong> purchases for their children. We supplemented these<br />
analyses by collecting information from company websites,<br />
monitoring the business <strong>and</strong> consumer press, <strong>and</strong> visiting<br />
numerous fast <strong>food</strong> restaurants <strong>and</strong> calling their consumer<br />
helplines. Finally, we combined these data to evaluate the<br />
<strong>nutritional</strong> <strong>quality</strong> of fast <strong>food</strong> purchases by <strong>and</strong> for young<br />
people <strong>and</strong> the marketing environment that influences both<br />
healthy <strong>and</strong> unhealthy fast <strong>food</strong> consumption.<br />
We did not have access to <strong>food</strong> industry proprietary documents,<br />
including privately commissioned market research, media,<br />
<strong>and</strong> marketing plans or other strategic documents. Therefore,<br />
we did not attempt to interpret fast <strong>food</strong> companies’ goals or<br />
objectives for their marketing practices.<br />
In this report, we document: 1) fast <strong>food</strong> restaurant <strong>menus</strong> <strong>and</strong><br />
the <strong>nutritional</strong> <strong>quality</strong> of menu items; 2) the extent of children’s<br />
<strong>and</strong> adolescents’ exposure to the most common forms of<br />
fast <strong>food</strong> marketing, including exposure for African American<br />
<strong>and</strong> Hispanic youth; 3) the specific products promoted <strong>and</strong><br />
marketing messages conveyed in traditional media, new<br />
media, <strong>and</strong> inside the restaurants; <strong>and</strong> 4) marketing outcomes,<br />
including restaurant visits, customer loyalty <strong>and</strong> the <strong>nutritional</strong><br />
<strong>quality</strong> of the menu items purchased by customers.<br />
Scope of the analysis<br />
The Nielsen Company (Nielsen) identifies 187 restaurants<br />
in the Quick Serve Restaurant (QSR) category (Product<br />
Classification Code [PCC] = G330). We could not conduct a<br />
comprehensive analysis of such a large number of restaurants;<br />
therefore, we identified the restaurants with the highest sales<br />
revenues <strong>and</strong> greatest marketing exposure to examine in<br />
detail. We first obtained 2008 sales data for the 50 largest fast<br />
<strong>food</strong> restaurants in the United States using figures estimated<br />
for QSR Magazine. 1 We then assessed the amount of TV<br />
<strong>Methods</strong><br />
advertising viewed by children for these restaurants in 2008<br />
<strong>and</strong> 2009 using gross ratings points (GRPs) from Nielsen. In<br />
addition to GRPs for companies classified as Quick Serve<br />
Restaurants by Nielsen, we also obtained data for Starbucks<br />
<strong>and</strong> Dunkin’ Donuts, which are included in the QSR Restaurant<br />
Top 50, but are classified by Nielsen as coffee/donut retail<br />
shops (PCC = G716). We identified twelve restaurants for the<br />
comprehensive analysis that included the ten restaurants with<br />
the highest sales in 2008 <strong>and</strong> two additional restaurants that<br />
ranked in the top 10 for volume of TV advertising viewed by<br />
children in 2009. We also conducted a more limited analysis<br />
of the 20 restaurants with the highest sales in 2008.<br />
The data reflect marketing practices used to promote fast <strong>food</strong><br />
restaurants from January 1, 2008, through July 30, 2010. The<br />
majority of the analyses assess practices during the calendar<br />
year of 2009; specific time frames examined for each type<br />
of data are described in the <strong>Methods</strong> for each analysis. We<br />
chose this time frame because the Children’s <strong>Food</strong> <strong>and</strong><br />
Beverage Advertising Initiative (CFBAI) was scheduled to be<br />
fully implemented by January 1, 2009. 2 <strong>Food</strong> companies that<br />
joined the initiative pledged to improve product nutrition <strong>and</strong><br />
advertising to children.<br />
<strong>Fast</strong> <strong>food</strong> menu items <strong>and</strong> marketing practices change<br />
continuously. The information presented in this report does<br />
not include most new products or product reformulations,<br />
advertising campaigns, website redesigns, <strong>and</strong> other<br />
marketing programs introduced after January 2010.<br />
<strong>Fast</strong> <strong>food</strong> <strong>menus</strong> <strong>and</strong> <strong>nutritional</strong> <strong>quality</strong><br />
We obtained lists of all menu items <strong>and</strong> corresponding nutrition<br />
information for the twelve restaurants in our comprehensive<br />
analysis from restaurant <strong>menus</strong> posted on company websites<br />
as of January 15, 2010. <strong>Fast</strong> <strong>food</strong> restaurants typically<br />
have extensive <strong>menus</strong> with numerous types of <strong>food</strong>s. To<br />
systematically evaluate these <strong>menus</strong>, we defined <strong>food</strong><br />
categories to describe different types of menu items. We<br />
also identified special <strong>menus</strong>, consisting of individual menu<br />
items promoted together as a group within the full menu (e.g.,<br />
a dollar/value menu or healthy menu). As restaurants varied<br />
widely in their reporting of nutrition information for individual<br />
menu items, we st<strong>and</strong>ardized all restaurant <strong>menus</strong> to include<br />
comparable information for items on all <strong>menus</strong>.<br />
<strong>Food</strong> categories<br />
All menu items were assigned to one of fifteen <strong>food</strong> categories<br />
according to whether it appeared on a special menu for<br />
children (i.e., kids’ meal or menu) or the main menu, the eating<br />
occasion when the <strong>food</strong> is typically consumed (breakfast,<br />
lunch/dinner or snack), <strong>and</strong> whether it is typically consumed<br />
alone, as a main dish, or as part of a meal in addition to a<br />
main dish (i.e., sides). We also classified types of beverages<br />
<strong>Fast</strong> <strong>Food</strong> <strong>FACTS</strong> 17
separately from <strong>food</strong>. We defined beverages as any item that<br />
could be consumed using a straw.<br />
■ Menu items offered in kids’ meals were classified as a<br />
kids’ main dish, kids’ side or kids’ beverage. Additional<br />
“children’s” sized items on the menu, but not offered as part<br />
of a kids’ meal, were also classified as kids’ items.<br />
■ Items traditionally consumed in the morning were classified<br />
as breakfast main dishes <strong>and</strong> breakfast sides (e.g., egg<br />
dishes, pancakes <strong>and</strong> hash browns). Some restaurants<br />
serve breakfast items all day <strong>and</strong> others serve these items<br />
only in the morning. Breakfast meals contained more than<br />
one breakfast item served together as one menu item, such<br />
as a pancake platter with sausage.<br />
■ Items traditionally consumed as the main item in a lunch or<br />
dinner meal were classified as lunch/dinner main dishes.<br />
Lunch/dinner meals contained a main dish <strong>and</strong> side<br />
served together as one menu item, such as a chicken strip<br />
basket with french fries.<br />
■ Lunch/dinner sides <strong>and</strong> side beverages are items typically<br />
consumed in addition to a main dish at lunch or dinner.<br />
Common sides include french fries <strong>and</strong> fruit; common side<br />
beverages include soft drinks, milk <strong>and</strong> water.<br />
■ Menu items that could be consumed on their own at nonmeal<br />
times or after a meal were classified as snacks,<br />
snack beverages <strong>and</strong> sweet snacks. Items classified as<br />
snacks typically contained the word “snack” in their name<br />
(e.g., McDonald’s Snack Wraps or KFC Snackers); snack<br />
beverages included ice cream <strong>and</strong> other frozen beverages;<br />
<strong>and</strong> sweet snacks included all dessert items as well as<br />
sweet baked goods, such as donuts <strong>and</strong> muffins.<br />
■ Due to the number of options available on many of the<br />
restaurant <strong>menus</strong>, coffee beverages were also classified as<br />
a separate <strong>food</strong> category <strong>and</strong> include lattes, cappuccinos<br />
<strong>and</strong> mochas. Frozen coffee beverages (e.g., frappuccinos)<br />
were classified as snack beverages <strong>and</strong> plain coffee as a<br />
side beverage.<br />
Special <strong>menus</strong><br />
In addition to individual menu items, many restaurants also<br />
promote a specific subset of items as a special menu. In<br />
addition to kids’ <strong>menus</strong>, many restaurants also promote<br />
dollar/value <strong>menus</strong>, or groups of individual items offered at a<br />
special price (e.g., Dollar, 99¢ or $5 Footlong <strong>menus</strong>). Some<br />
restaurants also promote healthy <strong>menus</strong>, or groups of items<br />
designated as healthier in some way (e.g., low(er) in calories,<br />
low(er) fat, or diet). Additionally, a few restaurants have <strong>menus</strong><br />
for special eating occasions (e.g., snack or late-night <strong>menus</strong>).<br />
Researchers identified all special <strong>menus</strong> presented on<br />
company websites as of March 2010. We did not categorize<br />
limited time pricing promotions for individual menu items as<br />
special <strong>menus</strong>. Combo meals or special combinations of<br />
<strong>Methods</strong><br />
individual items also were not categorized as special <strong>menus</strong><br />
unless they were promoted on the company websites. This<br />
categorization was used to identify ongoing restaurant-wide<br />
special <strong>menus</strong>.<br />
Menu st<strong>and</strong>ardization<br />
Most of the twelve restaurants in our analyses reported total<br />
grams or ounces, calories, fat, saturated fat, trans fat, sugar,<br />
sodium, protein, <strong>and</strong> fiber per menu item or serving. Most<br />
restaurants also reported lists of ingredients for many of their<br />
menu items. The ingredient lists were needed to obtain the<br />
proportion of fruit/vegetable/nuts content for the NPI score, a<br />
measure of <strong>nutritional</strong> <strong>quality</strong> (see p. 17). When this information<br />
was not available on the website <strong>and</strong> the item appeared to<br />
contain unprocessed fruits, nuts, or vegetables, we contacted<br />
the restaurant customer service representatives to obtain<br />
ingredient lists. In a few instances, we could not determine<br />
the fruit/vegetable/nuts content from the ingredients list <strong>and</strong><br />
purchased the individual menu items to weigh the different<br />
<strong>food</strong> components.<br />
To st<strong>and</strong>ardize menu items across different chains, we<br />
made several adjustments to the items as reported by some<br />
restaurants. Appendix A (Table A.1) lists specific adjustments<br />
made to each restaurant’s menu. Following are the general<br />
principles applied to all <strong>menus</strong>.<br />
■ Only regular menu items are included. If an item was<br />
listed as a regional or limited time item, it was not included<br />
unless the item was also promoted in both national television<br />
<strong>and</strong> on in-store signs.<br />
■ Regular menu items <strong>and</strong> kids’ menu items are listed<br />
separately. If an item was only available on the kids’ menu,<br />
it was not included in the regular menu analysis. Kids’ items<br />
that were also available for sale on the regular menu (e.g.,<br />
a regular hamburger or 16-ounce beverage) were included<br />
on both <strong>menus</strong>.<br />
■ All sizes of all items are listed as separate menu items.<br />
This includes drinks, sides, <strong>and</strong> s<strong>and</strong>wiches.<br />
■ All individual menu items are listed separately. If a<br />
restaurant sold a combination of items as a meal (e.g., a<br />
kids’ meal or combo meal that contains a s<strong>and</strong>wich, side<br />
item, <strong>and</strong> a drink), those combinations were not included as<br />
individual menu “items” unless they were also listed on the<br />
restaurants’ website <strong>menus</strong> as one item. Examples of meals<br />
listed as individual menu items include breakfast platters<br />
(e.g., pancakes <strong>and</strong> sausage) <strong>and</strong> chicken strip baskets<br />
that automatically come with french fries.<br />
■ Menu items with multiple components that were<br />
listed separately on some <strong>menus</strong> are combined into<br />
one item. Examples include salads with dressing <strong>and</strong><br />
croutons <strong>and</strong> chicken nuggets with sauce. If the item had<br />
a default combination (i.e., specific extra items that were<br />
<strong>Fast</strong> <strong>Food</strong> <strong>FACTS</strong> 18
automatically included with the main item), the default<br />
combination was used. If the item was typically offered with<br />
different choices (e.g., type of salad dressing or sauce),<br />
the item is reported as two separate items for both the<br />
healthiest <strong>and</strong> least nutritious options according to NPI<br />
score (e.g., chicken nuggets with barbecue sauce <strong>and</strong><br />
chicken nuggets with ranch sauce). If the <strong>menus</strong> did not<br />
clearly indicate a default option, researchers contacted the<br />
restaurant customer service representatives to determine if<br />
they did have a default combination.<br />
■ Menu items are presented in several different ways<br />
if consumers typically customize them by choosing<br />
individual ingredients (e.g., deli s<strong>and</strong>wiches or pizzas).<br />
Any featured combinations were included as one menu<br />
item (e.g., “meat lovers’” or “Hawaiian” pizza). Additionally,<br />
the most <strong>and</strong> least nutritious combinations of ingredients<br />
according to NPI score are listed as two separate menu<br />
items. For example, a deli s<strong>and</strong>wich with whole-grain bread,<br />
no cheese, <strong>and</strong> no sauce, as well as the same s<strong>and</strong>wich<br />
with a high-fat bread, cheese, <strong>and</strong> mayonnaise are listed<br />
separately. Similarly, pizzas with different crust options are<br />
listed as separate menu items that include the most <strong>and</strong><br />
least nutritious crusts.<br />
■ Both the default <strong>and</strong> healthier options are listed as<br />
separate menu items if the restaurant provided an<br />
option on its menu to improve the overall <strong>nutritional</strong><br />
<strong>quality</strong> of a specific item (e.g., a s<strong>and</strong>wich without the<br />
usual mayonnaise or an egg dish made with egg whites).<br />
■ A menu item is converted to a one-person portion size<br />
when listed as one item to be consumed by more than<br />
one person (e.g., a large pizza or family-sized appetizer).<br />
If the restaurant provided a suggested number of people<br />
the item would serve, we divided the nutrition information<br />
by that number to calculate one portion. Items indicated as<br />
“family-sized” were divided by 4. For items that did not have<br />
a suggested number of servings, we used another menu<br />
item that was indicated as a one-person item to identify an<br />
appropriate per-person portion. For example, the size of a<br />
“personal pan pizza” was used to calculate a one-person<br />
portion size for larger pizzas.<br />
■ A one-person portion size is calculated by combining<br />
menu items that were listed individually but are typically<br />
consumed in multiples (e.g., chicken pieces). If the<br />
restaurant promoted meals containing multiple pieces of the<br />
same item, those meal suggestions were used to calculate<br />
a one-person portion of the menu item. If the items were<br />
typically sold in a family size or bucket, the criteria cited<br />
above were used to calculate the one-person portion.<br />
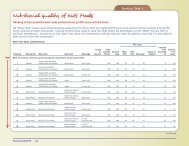
NutritioNal <strong>quality</strong><br />
We also evaluated the <strong>nutritional</strong> <strong>quality</strong> of kids’ meals <strong>and</strong><br />
individual menu items on restaurant <strong>menus</strong> according to<br />
<strong>Methods</strong><br />
several criteria. The Nutrient Profiling Index (NPI) score<br />
provided an evaluation of the overall <strong>nutritional</strong> composition<br />
of individual menu items. The NPI score is based on the<br />
nutrition rating system established by Rayner <strong>and</strong> colleagues<br />
for the <strong>Food</strong> St<strong>and</strong>ards Agency in the United Kingdom. 3 We<br />
also compared total calories <strong>and</strong> total sodium for kids’<br />
meals <strong>and</strong> menu items against st<strong>and</strong>ards established by the<br />
Institute of Medicine’s (IOM) School Meal guidelines to identify<br />
reasonable portion sizes for children <strong>and</strong> adolescents. 4<br />
Additionally, we calculated the energy density <strong>and</strong> the sugar<br />
content, saturated fat content, <strong>and</strong> trans fat content of<br />
menu items to highlight differences among individual nutrients<br />
within the NPI score. Lastly, we evaluated menu items<br />
according to other established criteria for <strong>nutritional</strong> <strong>quality</strong>.<br />
The following describes each of these criteria in more detail.<br />
NPI score<br />
The NPI score was calculated for each menu item. The score<br />
provides a measure of the overall <strong>nutritional</strong> <strong>quality</strong> of <strong>food</strong>s<br />
<strong>and</strong> beverages. It is adapted from the Nutrient Profiling model<br />
(NP) currently used by the U.K. Office of Communications<br />
(OFCOM) to identify nutritious <strong>food</strong>s that are appropriate<br />
to advertise to children on TV. 5 The model has also been<br />
approved by <strong>Food</strong> St<strong>and</strong>ards Australia New Zeal<strong>and</strong> to<br />
identify products that are permitted to use health claims in<br />
their marketing. 6 The NP model provides one score for a<br />
product based on total calories <strong>and</strong> proportion of both healthy<br />
<strong>and</strong> unhealthy nutrients <strong>and</strong> specific <strong>food</strong> groups, including<br />
saturated fat, sugar, fiber, protein, sodium, <strong>and</strong> unprocessed<br />
fruit, nut, <strong>and</strong> vegetable content. All menu items, including<br />
individual items in kids’ meals, received individual NPI scores.<br />
The NP model has several advantages over other nutrient<br />
profiling systems. University of Oxford nutrition researchers<br />
developed the model independently of <strong>food</strong> industry funding.<br />
Its development <strong>and</strong> scoring method is publicly documented<br />
<strong>and</strong> transparent. It has been validated to reflect the judgment<br />
of professional nutritionists. 7 The model also produces a<br />
continuous score that provides a relative evaluation of products,<br />
in contrast to threshold models that simply classify <strong>food</strong>s as<br />
“good” or “bad.” In addition, the model includes only nutrients<br />
that are reasonable <strong>and</strong> well-justified based on existing<br />
nutrition science. In particular, the model does not award<br />
points for micronutrient fortification, thereby discouraging<br />
companies from adding vitamins <strong>and</strong> minerals to inherently<br />
unhealthy products. Fortification has occurred in some recently<br />
introduced products (e.g., Jelly Belly Sport jelly beans with<br />
carbohydrates, electrolytes, <strong>and</strong> vitamins B & C, or Diet Coke<br />
Plus with niacin, vitamins B6 & B12, zinc, <strong>and</strong> magnesium). A<br />
detailed description of the model design, scoring method, <strong>and</strong><br />
benefits is available at www.cerealfacts.org. 8<br />
The interpretation of the original scores produced by the NP<br />
model are not intuitively obvious to the layperson because<br />
the model is reverse scored (i.e., a higher score indicates a<br />
<strong>Fast</strong> <strong>Food</strong> <strong>FACTS</strong> 19
product of worse <strong>nutritional</strong> <strong>quality</strong>). The NP range extends<br />
from a high of +34 to a low of –15. In addition, a score of<br />
3 points or lower identifies healthy <strong>food</strong>s that are allowed<br />
to be advertised to children in the United Kingdom. For the<br />
purpose of these analyses, we created an NP Index (NPI)<br />
score using the following formula: NPI score = (–2) * NP score<br />
+ 70. For example, a relatively nutritious <strong>food</strong>s with an NP<br />
score of -3 would receive an NPI score of 76 (-2 * -3 + 70).<br />
This recalculation produces a score from 0 (poorest <strong>nutritional</strong><br />
<strong>quality</strong>) to 100 (highest <strong>nutritional</strong> <strong>quality</strong>) that is easier to<br />
interpret <strong>and</strong> compare.<br />
To identify menu items with a healthy nutrient composition, we<br />
used the cut-offs established by the U.K. OFCOM to identify<br />
healthy products. 9 Only <strong>food</strong> products with an NP score of 3<br />
or lower <strong>and</strong> beverages with an NP score of 0 or lower are<br />
permitted to be advertised on children’s TV programs in the<br />
United Kingdom or during programs with a disproportionate<br />
number of viewers under 16 years old. This score translates to<br />
a revised NPI score of 64 or higher for <strong>food</strong> products <strong>and</strong> 70<br />
or higher for beverages.<br />
Calorie <strong>and</strong> sodium upper limits<br />
We also established maximum acceptable upper limits of<br />
calories <strong>and</strong> sodium for kids’ meals <strong>and</strong> individual menu items<br />
<strong>and</strong> identified any menu items that exceeded these upper<br />
limits. Children’s menu items were evaluated as part of a total<br />
meal that included all possible combinations of individual<br />
menu items available with a kids’ meal (typically a main dish,<br />
side, <strong>and</strong> beverage). All other menu items were evaluated<br />
individually.<br />
Table 1 provides the maximum acceptable levels of calories<br />
<strong>and</strong> sodium for a) kids’ meals served to both preschool <strong>and</strong><br />
elementary school-age children; b) lunch or dinner main<br />
dishes or meals; c) breakfast main dishes or meals; <strong>and</strong> d)<br />
sides, beverages, snack <strong>food</strong>s, <strong>and</strong> sweet snacks. These<br />
criteria are based on the recommendations for upper limits<br />
of calories <strong>and</strong> sodium for school meals served as part of the<br />
National School Lunch Program established by the Institute of<br />
Medicine (IOM) Committee on School Meals. 10<br />
Table 1. Maximum acceptable calories <strong>and</strong> sodium for kids’ meals <strong>and</strong> individual menu items<br />
<strong>Methods</strong><br />
On an average visit to a fast <strong>food</strong> restaurant, 36% of children<br />
under 6, 21% of children between 6 <strong>and</strong> 12, <strong>and</strong> 2% of<br />
children between 13 <strong>and</strong> 17 order kids’ meals. 11 Because<br />
preschool-age children require fewer calories compared to<br />
older children, we established separate kids’ meal criteria<br />
for elementary school-age <strong>and</strong> preschool-age children.<br />
We assumed that most adolescents would order from the<br />
restaurants’ main <strong>menus</strong>, <strong>and</strong> therefore set the criteria for main<br />
menu items based on recommended calories <strong>and</strong> sodium for<br />
this age group.<br />
■ Kids’ meals for elementary school-age children. The<br />
recommended maximum levels for lunch meals served<br />
to 5- to 10-year-olds specified in the IOM School Meals<br />
report were used to set the limits for elementary school-age<br />
children. 12<br />
■ Kids’ meals for preschool-age children. To calculate<br />
maximum acceptable calories <strong>and</strong> sodium for kids’ meals<br />
served to preschool-age children, we used the same<br />
method reported in the IOM School Meals report. The<br />
USDA recommends that a moderately active 2- to 5-yearold<br />
child should consume 1,275 calories daily 13 <strong>and</strong> should<br />
not consume more than 1,700 mg of sodium. 14 Children<br />
consume on average 32% of their daily calories at lunch; 15<br />
therefore, the maximum acceptable levels for kids’ meals<br />
served to preschoolers are 410 calories <strong>and</strong> 544 mg of<br />
sodium.<br />
■ Lunch/dinner main dishes <strong>and</strong> breakfast items on the<br />
regular menu. To set limits for evaluating lunch/dinner<br />
<strong>and</strong> breakfast items for young people from 12 to 17 years,<br />
we averaged IOM recommendations for two age groups<br />
(11 to 13 <strong>and</strong> 14 to 18) for maximum amounts of calories<br />
<strong>and</strong> sodium for specific meals on the regular menu. No<br />
recommendations are available for individual meal items;<br />
therefore, we used recommended maximum amounts for<br />
meals to set limits for main dish lunch/dinner <strong>and</strong> breakfast<br />
items. Most visitors to fast <strong>food</strong> restaurants order 2.4 main<br />
dish items on average at an eating occasion. 16 As a result,<br />
these limits represent the most calories <strong>and</strong> sodium that any<br />
young person should consume from one main dish item,<br />
especially if he or she also orders a side <strong>and</strong>/or beverage.<br />
Maximum calories Maximum sodium (mg)<br />
Kids’ meals<br />
Elementary school-age children (per meal) 650 636<br />
Preschool-age children (per meal) 410 544<br />
Regular menu items*<br />
lunch or dinner main dishes (per individual item or meal) 700 720<br />
Breakfast main dishes (per individual item or meal) 500 480<br />
Sides, snacks <strong>and</strong> beverages (per individual item) 350 340<br />
*Based on recommended upper limits for adolescents.<br />
<strong>Fast</strong> <strong>Food</strong> <strong>FACTS</strong> 20
■ Individual items served as snacks, beverages, or sides.<br />
The average daily level recommended for a moderately<br />
active 13- to 17-year-old is 2,300 calories; 17 <strong>and</strong> the<br />
recommended upper limit for sodium intake is 2,250 mg. 18<br />
Because young people consume on average 30% of their<br />
daily calories through snacks, 19 <strong>and</strong> children consume on<br />
average two snacks per day, 20 the maximum acceptable<br />
levels for a snack, beverage, or side consumed in addition<br />
to a main dish item is 350 calories <strong>and</strong> 340 mg of sodium for<br />
adolescents.<br />
Additional <strong>nutritional</strong> <strong>quality</strong> measures<br />
To provide more detailed information about specific nutrients<br />
in each kids’ meal or individual menu item, we also calculated<br />
the proportion of sugar by weight in each <strong>food</strong> or beverage<br />
<strong>and</strong> report grams of saturated fat <strong>and</strong> trans fat. The tentative<br />
nutrition st<strong>and</strong>ards proposed by the Interagency Working<br />
Group on <strong>Food</strong> Marketed to Children recommend that <strong>food</strong>s<br />
marketed to children must contain: 21<br />
■ 1 g or less <strong>and</strong> less than 15% of calories from saturated fat<br />
■ 0 g of trans fat<br />
■ No more than 13 g of added sugars, or 26% of total grams of<br />
<strong>food</strong> by weight for <strong>food</strong>s with a portion size less than 50 g<br />
■
media spending <strong>and</strong> youth exposure to advertising for fast<br />
<strong>food</strong> restaurants in 2008 <strong>and</strong> 2009, as well as a comprehensive<br />
picture of the traditional media marketing practices of the<br />
twelve restaurants in our full analysis for 2009.<br />
Advertising spending <strong>and</strong> TV advertising<br />
exposure by restaurant<br />
Nielsen tracks media spending on television, radio,<br />
magazine, newspaper, free st<strong>and</strong>ing insert (FSI) coupons,<br />
outdoor advertising <strong>and</strong> the internet. We licensed these data<br />
for 2008 <strong>and</strong> 2009 for all fast <strong>food</strong> restaurants, including the<br />
187 companies in Nielsen’s QSR classification code <strong>and</strong><br />
Starbucks <strong>and</strong> Dunkin’ Donuts. The data provide a measure<br />
of all fast <strong>food</strong> advertising spending.<br />
To measure exposure to fast <strong>food</strong> TV advertising, we also<br />
licensed gross rating points (GRP) data from Nielsen for<br />
the same period <strong>and</strong> restaurants. GRPs measure the total<br />
audience delivered by a br<strong>and</strong>’s media schedule. It is<br />
expressed as a percentage of the population that is exposed<br />
to each commercial over a specified period of time across all<br />
types of TV programming. They are the advertising industry’s<br />
st<strong>and</strong>ard measure to assess audience exposure to advertising<br />
campaigns; <strong>and</strong> Nielsen is the most widely used source for<br />
these data. 22 GRPs, therefore, provide an objective outside<br />
assessment of advertising exposure. In addition, GRPs can<br />
be used to measure advertisements delivered to a specific<br />
audience, e.g., specific age groups <strong>and</strong> African Americans<br />
(also known as target rating points or TRPs). They provide<br />
a “per capita” measure to examine relative exposure among<br />
groups. For example, if a restaurant had 2,000 GRPs in 2009<br />
for 2- to 11-year-olds <strong>and</strong> 1,000 GRPs for 25- to 49-year-olds,<br />
then we can conclude that children saw twice as many ads for<br />
that restaurant in 2009 as compared to adults.<br />
The GRP measure differs from the measure used to evaluate<br />
<strong>food</strong> industry compliance with their CFBAI pledges. The<br />
pledges apply only to advertising in children’s TV programming<br />
as defined by audience composition (i.e., programs in which<br />
at least 25% to 50% of the audience are under age 12);<br />
approximately half of all advertisements viewed by children<br />
under 12 years old occur during children’s programming. 23<br />
In contrast, GRPs measure children’s total exposure to<br />
advertising during all types of TV programming. Therefore,<br />
evaluating GRPs will determine children’s exposure to all TV<br />
advertising by participating companies, not only advertising<br />
that aired during children’s programming.<br />
In the TV advertising analyses, we obtained 2008 <strong>and</strong> 2009<br />
GRP data by age group <strong>and</strong> race for all fast <strong>food</strong> restaurants.<br />
We first obtained total GRPs for the following age groups: 2-5<br />
years, 6-11 years, 12-17 years, 18-24 years <strong>and</strong> 25-49 years.<br />
These data combine exposure to national (network, cable, <strong>and</strong><br />
syndicated) <strong>and</strong> local (spot market) television. In addition, we<br />
identified national television GRPs for African Americans (2-11<br />
years, 12-17 years, 18-24 years, <strong>and</strong> 25-49 years), as well as<br />
<strong>Methods</strong><br />
whites in the same age groups. Nielsen does not provide spot<br />
market GRPs for African Americans. Finally, we obtained GRPs<br />
for advertisements that aired on Spanish-language television<br />
for each age group. GRPs for Spanish-language television are<br />
calculated based on Nielsen’s Hispanic audience estimates.<br />
Nielsen calculates GRPs as the sum total of all advertising<br />
exposures for all individuals within a demographic group,<br />
including multiple exposures for individuals (i.e., gross<br />
impressions), divided by the size of the population times 100.<br />
For an audience not trained in advertising measurement,<br />
GRPs may be difficult to interpret. Therefore, we also use GRP<br />
data to calculate the following TV advertising measures:<br />
Average advertising exposure. This measure is calculated<br />
by dividing total GRPs for a demographic group during a<br />
specific time period by 100. It provides a measure of ads<br />
viewed by the average individual in that demographic group<br />
during the time period measured. For example, if Nielsen<br />
reports 2,000 GRPs for 2- to 5-year-olds for a restaurant in<br />
2008, we can conclude that the average 2- to 5-year-old<br />
viewed 20 ads for that restaurant in 2008.<br />
Targeted GRP ratios. As GRPs provide a per capita measure<br />
of advertising exposure for specific demographic groups, we<br />
also used GRPs to measure relative exposure to advertising<br />
between demographic groups. We report the following<br />
targeted GRP ratios:<br />
■ Preschool child-to-adult targeted ratio = GRPs for 2-5 years/<br />
GRPs for 25-49 years<br />
■ Child-to-adult targeted ratio = GRPs for 6-11 years/GRPs<br />
for 25-49 years<br />
■ Teen-to-adult targeted ratio = GRPs for 12-17 years/GRPs<br />
for 25-49 years<br />
■ African-American-to-white child targeted ratio = GRPs for<br />
African American 2-11 years/GRPs for white 2-11 years<br />
(national GRPs only)<br />
■ African-American-to-white-teen targeted ratio = GRPs for<br />
African American 12-17 years/GRPs for white 12-17 years<br />
(national GRPs only).<br />
A targeted ratio greater than 1.0 indicates that the average<br />
person in the group of interest (e.g., the child in the childto-adult<br />
ratio) viewed more advertisements than the average<br />
person in the comparison group (the adult). A targeted ratio of<br />
less than 1.0 indicates that the person in the group of interest<br />
viewed fewer ads. For example, a child-to-adult targeted ratio<br />
of 2.0 indicates that children viewed twice as many ads as<br />
adults viewed.<br />
To assess potential targeted marketing to specific age or<br />
racial groups, we compared differences among demographic<br />
groups in exposure to advertising for specific restaurants to<br />
those that would be expected given each group’s average<br />
TV viewing time. If the targeted ratio was significantly greater<br />
<strong>Fast</strong> <strong>Food</strong> <strong>FACTS</strong> 22
than the relative difference in the amount of TV viewed by<br />
each group, we can conclude that the advertiser may have<br />
designed a media plan to reach this specific demographic<br />
group more often than would naturally occur. The average<br />
weekly amount of time spent viewing television in 2009 was<br />
obtained from Nielsen Market Breaks for each age <strong>and</strong><br />
demographic group in the analysis.<br />
TV advertising exposure by product<br />
In addition to the Nielsen GRP data at the restaurant level<br />
described above, we also obtained GRPs at the br<strong>and</strong> variant<br />
level for national advertising in 2009 for the twelve restaurants<br />
in our detailed analysis. Nielsen includes up to three specific<br />
menu items, promotions (e.g., KFC $4 Fill-up Box), <strong>and</strong>/or tieins<br />
(e.g., “SpongeBob SquarePants” toy) in their br<strong>and</strong> variant<br />
classification. Therefore, these data also provide exposure to<br />
television advertising that promotes specific menu items <strong>and</strong><br />
promotions.<br />
Based on the descriptions provided by Nielsen, we<br />
categorized all advertisements into product types. In<br />
some cases, Nielsen did not provide enough information to<br />
categorize the advertisements. For these advertisements,<br />
a researcher viewed copies of individual advertisements to<br />
determine the appropriate product type. For advertisements<br />
that could be classified as more than one product type, we<br />
prioritized in the following order:<br />
■ Br<strong>and</strong>ing only. The restaurant as a whole is the main<br />
point of the ad. <strong>Food</strong> may be pictured, but no specific <strong>food</strong><br />
products are mentioned.<br />
■ Promotion only. A toy giveaway or other third-party tie-in<br />
is the main point of the ad. <strong>Food</strong> may be pictured, but no<br />
specific <strong>food</strong> products are mentioned.<br />
■ Kids’ meal. Mentions a kids’ meal, either with or without<br />
specific kids’ meal menu items.<br />
■ Dollar/value menu. Mentions a value menu, dollar menu or<br />
other special pricing for a group of individual menu items,<br />
including mentions of the entire menu or specific items<br />
included on the value menu.<br />
■ Healthy meal/menu. Mentions a healthy menu, menu item,<br />
or healthy version of a meal.<br />
■ Combo/family/value meal. Mentions a meal (for one or<br />
more people) that includes more than one type of menu<br />
item.<br />
■ Breakfast menu. Mentions more than one individual<br />
breakfast item or a breakfast meal.<br />
■ Late-night/snack menu. Mentions items suggested to be<br />
consumed late at night or as a snack (either as part of a<br />
special menu or as indicated by the item name).<br />
<strong>Methods</strong><br />
■ Individual menu items. Any individual menu items or line<br />
of items, not classified as one of the above.<br />
■ Unclear. Specific product type could not be determined<br />
TV advertising content analysis<br />
To evaluate the messages <strong>and</strong> marketing techniques used<br />
in the TV advertisements, we conducted a content analysis<br />
of both English- <strong>and</strong> Spanish-language TV advertising for<br />
the twelve restaurants. Using the AdScope database from<br />
Kantar Media, 24 we obtained digital copies of all fast <strong>food</strong><br />
advertisements from these companies that aired nationally<br />
in the United States from July 1, 2008, through December<br />
31, 2009. Research assistants viewed each ad to remove<br />
duplicates, including 15-second shortened versions of<br />
30-second ads. In addition, ads with the same creative<br />
execution but different promotions added to the end of the ad<br />
were catalogued as duplicates. The basic version of the ad<br />
(excluding the promotion) was retained for analysis. Distinct<br />
promotions were noted but not included in the final content<br />
analysis unless the promotion was present in all versions of<br />
the ad. Finally, ads which aired before October 1, 2008, were<br />
removed from the analysis, as these were less likely to have<br />
continued airing in 2009.<br />
We used the coding manual developed for a previous research<br />
study to analyze cereal advertising as the basis for the coding<br />
manual for the present study. 25 Researchers first examined<br />
a sample of fast <strong>food</strong> advertisements to identify additional<br />
messages <strong>and</strong> marketing techniques that appeared in fast<br />
<strong>food</strong> ads but were not included in the previous manual.<br />
Three coders were trained to review the advertisements <strong>and</strong><br />
code them for all items in the manual. In four pre-test group<br />
sessions, the project manager <strong>and</strong> coders evaluated twelve<br />
fast <strong>food</strong> advertisements during each session. These ads were<br />
selected from fast <strong>food</strong> advertisements for the restaurants in<br />
our analysis that aired in 2010, immediately following the ads<br />
included in our content analysis. Following these sessions,<br />
the project manager revised <strong>and</strong> finalized the coding manual.<br />
The final coding manual included eight main categories:<br />
■ Identifying information, such as restaurant name.<br />
■ Main <strong>food</strong> in the ad. Main <strong>food</strong> was selected by choosing<br />
the menu item depicted or mentioned most, <strong>and</strong>/or that<br />
played the most integral role in the ad. If multiple items<br />
were promoted equally, three items or fewer were listed<br />
individually <strong>and</strong> four or more items were coded as part of a<br />
menu/line of items.<br />
■ Selling point, or direct benefit of the product. Coders<br />
chose as many selling points as were present in the ad.<br />
These included: new/improved if the ad introduced a new<br />
product or an improvement in an old one; value/cheap if<br />
the ad highlighted the price of the product, such as “buy<br />
one get one free”, “now for the low price of…” or “only 99<br />
<strong>Fast</strong> <strong>Food</strong> <strong>FACTS</strong> 23
cents;” health/nutrition included claims about the nutrition,<br />
nutrients, or health outcomes of consuming the product;<br />
<strong>quality</strong> <strong>food</strong> if the ad used natural, fresh, real, <strong>quality</strong>, or<br />
similar words to describe the <strong>food</strong>; comparison/unique<br />
for claims that the product(s) were superior to that of the<br />
competition or suggestions that the restaurant <strong>and</strong>/or menu<br />
item were unique; filling/lots of <strong>food</strong> if the ad suggested that<br />
the <strong>food</strong> promoted was filling or satisfying <strong>and</strong>/or mentioned<br />
the large size of the <strong>food</strong> or portion; convenience if the ad<br />
promoted more than typical fast <strong>food</strong> convenience, such as<br />
using technology to simplify or expedite <strong>food</strong> purchasing<br />
(e.g. ordering online <strong>and</strong> mobile ordering applications);<br />
low-fat/low-calorie for suggestions that the product assists<br />
in weight loss <strong>and</strong> other claims about fat or calorie content;<br />
helping the community or others when the ad suggested<br />
helping the community, helping others, or portrayed any<br />
charitable benefit from purchasing the <strong>food</strong>; <strong>and</strong> limited<br />
time special offers for short-term price promotions, giveaways,<br />
<strong>and</strong> new products that “won’t be here long.”<br />
■ Product associations, or indirect benefits of the product<br />
suggested in the ad. Coders chose as many product<br />
associations as were present in the ad. These included:<br />
physical activity when the ad portrayed, suggested or<br />
encouraged physical activity in any way; family bonding<br />
or promoting family ties, love, spending time together,<br />
including separate from mealtimes; fun/cool claims,<br />
typically made implicitly by depicting enjoyable social<br />
occasions, excitement or adventure, st<strong>and</strong>ing out in a<br />
crowd, superiority, <strong>and</strong> pop-culture references; humor if<br />
the ad included comedic elements, obvious or subtle, irony<br />
or sarcasm; <strong>and</strong> adults as negative or incompetent if the<br />
ad belittled or poked fun at adult figures, parents or other<br />
authority figures.<br />
■ Target audience, or the type of person to which the ad<br />
appears to appeal most. These included: perceived age<br />
group targeted including children, adults-only (reserved<br />
for ads clearly targeting adults <strong>and</strong> no one else), parents,<br />
<strong>and</strong> all other for ads that could appeal to teens <strong>and</strong>/<br />
or adults; gender as identified by the person in the ad<br />
purchasing <strong>and</strong>/or consuming the <strong>food</strong>; race as identified<br />
by the person in the ad purchasing <strong>and</strong>/or consuming the<br />
<strong>food</strong>. If actors did not purchase or consume <strong>food</strong> in the ad,<br />
the gender <strong>and</strong> race of the main character(s) were coded.<br />
■ Third party tie-ins, br<strong>and</strong> characters <strong>and</strong> spokespeople.<br />
Third party tie-ins included appearances by: celebrities,<br />
including famous actors, athletes <strong>and</strong> musicians; movies/<br />
TV shows/video games when the ad featured any of these;<br />
licensed characters when a character from a TV, movie,<br />
or video game was featured in the ad as part of a special<br />
promotion (e.g., a “Shrek” toy in a kids’ meal); charity when<br />
charitable organizations (e.g., the Girl Scouts) or donations<br />
to a charity were featured in the ad; other entertainment<br />
for ads that featured tie-ins with games (e.g., Monopoly),<br />
theme parks, or other types of entertainment (not already<br />
<strong>Methods</strong><br />
specified); other sports for ads that featured a team, sports<br />
organization or sporting event (e.g., NBA, Olympics); <strong>and</strong><br />
other <strong>food</strong> br<strong>and</strong>s when the ad featured a <strong>food</strong> br<strong>and</strong><br />
not owned by the fast <strong>food</strong> restaurant (e.g., Doritos,<br />
Minute Maid). In addition, we coded br<strong>and</strong> characters<br />
for fictional characters or mascots associated specifically<br />
with the br<strong>and</strong> or intrinsic to the identity of the br<strong>and</strong> (e.g.,<br />
Ronald McDonald), <strong>and</strong> spokespeople for individuals who<br />
regularly represent the br<strong>and</strong> in commercials (e.g., Jared<br />
from Subway)<br />
■ Eating behaviors that were portrayed or suggested (or<br />
not). These included: family meals, including depictions<br />
or suggestions of a family eating a meal together; <strong>food</strong><br />
consumed to code whether or not <strong>food</strong> is shown being<br />
eaten; place of consumption to describe where the <strong>food</strong><br />
was apparently consumed (i.e., in the restaurant, at a table,<br />
in front of the TV/computer, in the car, or other place); time<br />
of consumption to describe when the <strong>food</strong> was consumed<br />
(i.e., breakfast, lunch, dinner, late at night, anytime, snack,<br />
or unclear). Additionally, coders indicated whether <strong>food</strong><br />
was the primary focus of the ad, defined as whether the<br />
<strong>food</strong> was shown up close in the ad more than 50% of the<br />
time.<br />
■ Websites referenced, either suggested or depicted on the<br />
screen. All references to websites were recorded, including<br />
reference to third-party sites.<br />
Formal pilot testing was conducted using a sample of 40 ads<br />
from the final inventory. Krippendorf’s alpha 26 was used to<br />
measure inter-rater reliability. As inter-rater reliability results<br />
were good, final reliability testing commenced. The final<br />
reliability sample included 126 ads, or 20% of the full sample.<br />
Each coder coded this same subset of ads. Krippendorf’s<br />
Alpha values ranged from .33 (fair) to 1.00 (perfect) agreement<br />
with 62% of the items receiving substantial to almost perfect<br />
agreement (.61 or higher) <strong>and</strong> only 3% receiving values in<br />
the fair range of agreement (.21 to .40). Items with Alpha<br />
values lower than .60 were discussed <strong>and</strong> redefined for clarity<br />
prior to moving forward with the final coding. The remaining<br />
advertisements were r<strong>and</strong>omly assigned to the three coders<br />
<strong>and</strong> final coding occurred over a three-week period.<br />
Spanish-language advertisements. A native Spanish<br />
speaker who is fluent in English coded the Spanish-language<br />
ads. The Spanish-language coder used the same coding<br />
manual <strong>and</strong> completed the same training as the Englishlanguage<br />
coders <strong>and</strong> also coded a sample of 30 Englishlanguage<br />
ads used in the reliability test group. Reliability<br />
testing of the responses for the Spanish-language coder<br />
showed similar Krippendorf’s alpha values as those of the<br />
English-language coders: a range of .33 to 1.00, with 49%<br />
of the items receiving substantial to almost perfect agreement<br />
<strong>and</strong> only 5% receiving values in the fair range of agreement<br />
(.21 to .40). As in the English-language analysis, items with<br />
Alpha values lower than .60 were discussed <strong>and</strong> clarified prior<br />
<strong>Fast</strong> <strong>Food</strong> <strong>FACTS</strong> 24
to conducting the final Spanish-language coding. Coding<br />
occurred over three weeks.<br />
Nutrient content of menu items in TV<br />
ads<br />
To assess the nutrient content of menu items featured in TV<br />
ads, we combined the data obtained in the content analysis<br />
to identify the main <strong>food</strong>(s) depicted in the ads, the Nielsen<br />
data on national GRPs by age <strong>and</strong> ethnicity for these ads<br />
in 2009, <strong>and</strong> the nutrient content data obtained in the menu<br />
composition analysis.<br />
We first obtained the following nutrition information for each<br />
main <strong>food</strong> featured in TV ads that aired nationally in 2009: total<br />
calories, sodium (mg), saturated fat (g), <strong>and</strong> total sugar (g). If<br />
the main <strong>food</strong> in the ad referred to more than one menu item<br />
in our menu composition analysis, we calculated the median<br />
values of the nutrient information for all applicable menu<br />
items. For example, if an ad featured all ice cream sundaes<br />
on the restaurant menu, we calculated the median calories,<br />
sodium, saturated fat <strong>and</strong> sugar for all sundaes in our menu<br />
composition analysis. Similarly, if the ad did not specify a<br />
size or variation of individual <strong>food</strong>s (e.g., different sauces<br />
served with chicken nuggets), we calculated median values<br />
for all variations of the menu item in our menu composition<br />
analysis. In a few instances, a main <strong>food</strong> featured on TV ads<br />
did not appear on the regular restaurant <strong>menus</strong> in January<br />
2010 <strong>and</strong> therefore nutrition data were not available in our<br />
menu composition analysis. If the ad was supported by more<br />
than 25 GRPs in 2009, we contacted the restaurant to obtain<br />
nutrition information for those menu items.<br />
If an ad referenced more than one main <strong>food</strong>, coders viewed<br />
the ad to determine whether it appeared to encourage<br />
consumption of more than one item or provided examples<br />
of different variations of the same type of <strong>food</strong>. Generally,<br />
if the ad prominently featured main <strong>food</strong>s from more than<br />
one <strong>food</strong> category (e.g., a main dish <strong>and</strong> a beverage, side<br />
or dessert), it was coded as encouraging consumption of<br />
items from each <strong>food</strong> category. However, if the ad depicted<br />
more than one version of <strong>food</strong>s from the same category (e.g.,<br />
three s<strong>and</strong>wiches or three sweet snacks), it was coded as<br />
encouraging consumption of just one item.<br />
To calculate the nutrient content of individual ads, we used<br />
different procedures according to whether the ad appeared<br />
to encourage consumption of one type of <strong>food</strong> (e.g., one of a<br />
variety of s<strong>and</strong>wiches) or more than one <strong>food</strong> (e.g., a s<strong>and</strong>wich<br />
<strong>and</strong> a side). If the ad encouraged consumption of one <strong>food</strong>,<br />
we averaged the nutrient information for all main <strong>food</strong>s<br />
presented. If the ad encouraged consumption of more than<br />
one <strong>food</strong>, we added the nutrient information for all main <strong>food</strong>s<br />
presented to obtain total calories, sodium, saturated fat <strong>and</strong><br />
sugar. In a few instances, ads promoted more than one <strong>food</strong><br />
category <strong>and</strong> more than one main <strong>food</strong> within the categories.<br />
For those ads, we averaged the nutrient information for main<br />
<strong>Methods</strong><br />
<strong>food</strong>s within each category <strong>and</strong> added the average of the<br />
<strong>food</strong> categories together.<br />
We then used 2009 GRPs by age group <strong>and</strong> ethnicity for<br />
each ad to calculate the weighted average number of<br />
total calories, sugar calories, saturated fat calories <strong>and</strong><br />
sodium per ad viewed by children, teens, adults, <strong>and</strong> African<br />
American youth on English-language TV <strong>and</strong> Hispanic youth<br />
on Spanish-language TV for each restaurant in our analysis.<br />
These measures provide a comparison of the nutrient content<br />
of <strong>food</strong>s featured in ads viewed by different demographic<br />
groups for different restaurants. We also multiplied the<br />
weighted average measures for each ad viewed by the<br />
average number of ads viewed per day for each restaurant<br />
<strong>and</strong> demographic group to provide total calories <strong>and</strong> sodium<br />
viewed in fast <strong>food</strong> TV ads daily.<br />
Radio advertising exposure<br />
To underst<strong>and</strong> young people’s exposure to radio advertising<br />
from the twelve fast <strong>food</strong> restaurants in our analysis, we<br />
purchased radio data from two media research firms: Arbitron<br />
<strong>and</strong> Nielsen. Arbitron is the country’s leading provider of radio<br />
measurement services. The firm surveys a r<strong>and</strong>om sample<br />
of households in each of its 300 metropolitan areas (which<br />
generally correspond to the Metropolitan Statistical Areas<br />
defined by the United States Office of Management <strong>and</strong><br />
Budget). For the majority of markets, survey participants fill<br />
out a paper diary, noting their listening habits over the course<br />
of seven days. Survey participants must be aged 12 years<br />
or older. In 2009, Arbitron processed over 1.1 million diaries<br />
for inclusion in its estimates. 27 We obtained a license from<br />
Arbitron that covers local spot radio advertising in 2009 for all<br />
300 metropolitan areas.<br />
While Arbitron provides listenership data for specific markets,<br />
stations, <strong>and</strong> formats, the firm does not track advertising<br />
activities of specific companies. To obtain data on individuals’<br />
exposure to radio advertising for the twelve restaurants in our<br />
analysis, we used Nielsen’s Monitor-Plus AdViews system.<br />
Nielsen uses Arbitron’s data <strong>and</strong> matches it to their own<br />
tracking of commercial units to provide radio advertising<br />
measurement for local spot radio. 28 In 2009, Nielsen monitored<br />
radio advertising in 39 markets <strong>and</strong> covered at least twenty<br />
stations in each market. These 39 markets represent 60%<br />
of the U.S. population, as estimated by Arbitron; 29 <strong>and</strong> 38 of<br />
these covered markets rank in the top 50 by population.<br />
Through the AdViews system, we obtained GRPs <strong>and</strong><br />
impressions (or total advertising exposure for all individuals<br />
combined) for each restaurant in each market. Furthermore,<br />
we broke out GRPs for the following age groups separately:<br />
12-17 years; 18-24 years; <strong>and</strong> 25-49 years. AdViews does not<br />
provide radio data for children under 12 <strong>and</strong> does not break<br />
out African American listenership separately. To calculate<br />
the average exposure by age group for individuals in the<br />
39 markets examined, we first excluded data from markets<br />
<strong>Fast</strong> <strong>Food</strong> <strong>FACTS</strong> 25
with very low exposure, defined as any markets where the<br />
advertiser did not reach a minimum of 100 GRPs in any of the<br />
three defined age groups. We then calculated the universal<br />
estimate (UE) for each market <strong>and</strong> age group by dividing<br />
impressions by GRPs. The UE is a population estimate for<br />
each market. For each advertiser <strong>and</strong> age group, we added<br />
up these UEs to arrive at a total UE. We then added up all<br />
impressions for each advertiser <strong>and</strong> age group <strong>and</strong> divided<br />
it by the total UE. The resulting GRPs provide a snapshot of<br />
the level of marketing activity that each advertiser engages in<br />
across a significant number of major U.S. markets. We also<br />
report the number of major markets that make up these GRPs.<br />
Internet <strong>and</strong> other digital media<br />
We analyzed content <strong>and</strong> exposure for youth-targeted marketing<br />
on the internet: restaurant (i.e., company-sponsored) websites,<br />
banner advertising on other (i.e., third-party) websites, <strong>and</strong><br />
social media marketing. Additionally, we provide examples of<br />
mobile marketing conducted by fast <strong>food</strong> restaurants.<br />
Restaurant websites<br />
We located the main website for each restaurant in our<br />
analysis by typing the restaurant name into a search engine.<br />
We then explored the main pages for any secondary websites<br />
linked to that restaurant. For example, links on McDonalds.<br />
com connected to secondary sites, including McWorld.com,<br />
HappyMeal.com, Ronald.com, 365Black.com, MyInspirasian.<br />
com, MeEncanta.com, McDonaldsAllAmerican.com, RMHC.<br />
org, <strong>and</strong> Passport2Play.com. For the purposes of this analysis,<br />
a website is defined as all pages containing the same stem<br />
URL. For example, HappyMeal.com is the website of interest,<br />
<strong>and</strong> HappyMeal.com/#play is an example of a secondary<br />
page contained within the site.<br />
We obtained data on exposure to these websites from the<br />
comScore Media Metrix Key Measures Report. 30 The company<br />
captures the internet behavior of a representative panel of<br />
about one million users in the United States. 31 It is the nation’s<br />
largest existing internet audience measurement panel. The<br />
firm collects data at both the household <strong>and</strong> individual level<br />
using Session Assignment Technology, which can identify<br />
computer users without requiring them to log in. The company<br />
uses these panel data to extrapolate its findings to the total<br />
U.S. population. Companies participating with comScore<br />
can also have census tags placed on their web content <strong>and</strong><br />
advertisements to further refine audience estimates. Using<br />
the comScore panel, we were able to identify which websites<br />
<strong>and</strong> advertisements individual users were exposed to <strong>and</strong><br />
examine exposure for both children <strong>and</strong> adults in the same<br />
household. The Media Metrix database provides internet<br />
exposure data for any websites visited by at least 30 of<br />
their panel members in a given quarter. 32 Media Metrix also<br />
provides exposure information by visitor age <strong>and</strong> ethnicity for<br />
larger volume websites.<br />
<strong>Methods</strong><br />
We first searched the comScore Media Metrix database to<br />
identify the fast <strong>food</strong> restaurant websites for which exposure<br />
data were available from January through December 2009.<br />
We collected the following data using the Media Metrix Key<br />
Measures Report for available fast <strong>food</strong> websites during this<br />
time period:<br />
■ Total unique visitors. The estimated number of different<br />
individuals who visited any website during the reporting<br />
period.<br />
■ Total visits. The total number of times that each unique<br />
visitor visited a website with at least a 30-minute break<br />
between times of access during the reporting period.<br />
■ Average minutes per visit. The average number of minutes<br />
spent on the website for each visit.<br />
■ Average pages viewed per visitor. The average number<br />
of pages viewed during a month by each person visiting the<br />
website (across all visits during the month).<br />
■ Average visits per unique visitor. The average number of<br />
visits to the website during the month per unique visitor.<br />
In addition, when enough website traffic was recorded in a<br />
given quarter, we also collected these measures separately<br />
for children ages 2-11 years, 12-17 years, <strong>and</strong> all youth (2-<br />
17 years), <strong>and</strong> for African American youth ages 2-17 years.<br />
During the period examined, data were not available from<br />
comScore for Hispanic visitors. For each of the demographic<br />
groups with data, we also report a composition index, which<br />
measures the extent to which child (2-11 years), teen (12- 17<br />
years) or youth (2-17 years) visitors to a website are over- or<br />
underrepresented compared to all visitors (over 2 years) <strong>and</strong><br />
the extent to which African American 2- to 17-year-old visitors<br />
to a website are over- or underrepresented compared to all<br />
2- to 17-year-old visitors.<br />
For each website in our analysis, we report the following<br />
website exposure measures:<br />
■ Average unique visitors per month for all youth 2-11<br />
years, 12-17 years, 2-17 years <strong>and</strong> African Americans 2-17<br />
years. This measure was calculated by adding average<br />
total unique visitors per month, as reported quarterly by<br />
comScore, from January through December 2009 for each<br />
demographic group divided by the number of quarters for<br />
which these data were available for each website.<br />
■ Average visits per month, 33 average pages per month,<br />
<strong>and</strong> average time spent per visit 34 for each unique visitor.<br />
Average monthly numbers, as reported by comScore for<br />
each quarter, were divided by the number of quarters for<br />
which data were available for each website. The company<br />
only reports these data for the larger demographic<br />
groups. If separate data were not available for the specific<br />
demographic group, we used the information for the next<br />
largest demographic group. For example, if data were not<br />
available for 2- to 11-year-olds specifically, we report the<br />
<strong>Fast</strong> <strong>Food</strong> <strong>FACTS</strong> 26
data for 2- to 17-year-olds or, in a few cases, all persons<br />
(ages older than 2).<br />
■ Composition indices were calculated for all youth 2-11<br />
years, 12-17 years, 2-17 years <strong>and</strong> for African American<br />
youth 2-17 years. We first calculated the percentage of<br />
visitors from a particular demographic group visiting a<br />
website by averaging the number of monthly unique visitors<br />
to the website for that demographic group <strong>and</strong> dividing<br />
this number by the average monthly unique visitors to<br />
the total internet during the four quarters of 2009 for the<br />
same demographic group. Composition indices were then<br />
calculated by dividing the percentage of total internet visitors<br />
for each age group (2-11 years, 12-17 years, <strong>and</strong> 2-17 years)<br />
who visited that website by the percentage of all visitors<br />
(age 2+) to the total internet who visited the same website.<br />
African American composition indices were calculated by<br />
dividing the percentage of African Americans 2-17 years<br />
on the total internet who visited a particular website by the<br />
percentage of all youth 2-17 years on the total internet who<br />
visited the same website. This number was then multiplied<br />
by 100. Composition indices greater than 100 signify that the<br />
demographic group was overrepresented on a website in<br />
relation to the comparison group; <strong>and</strong> composition indices<br />
less than 100 signify that it was underrepresented. For<br />
example, if 40% of African Americans 2-17 years visited<br />
HappyMeal.com, but 20% of all youth 2-17 years visited<br />
HappyMeal.com, the African American composition index for<br />
HappyMeal.com would be 200. Therefore, the percentage<br />
of African American youth visitors to HappyMeal.com would<br />
be twice as high as the percentage of all youth visitors to<br />
HappyMeal.com; <strong>and</strong> African American youth would be<br />
overrepresented on HappyMeal.com.<br />
Restaurant website content analysis<br />
To systematically assess the techniques used to engage<br />
children on websites from the restaurants in our analysis,<br />
we first used the comScore data to identify the restaurant<br />
websites that children visited most frequently <strong>and</strong> for the<br />
longest periods of time. To identify sites focused only on<br />
children, we browsed through the pages of each site <strong>and</strong><br />
categorized all sites based on whether they targeted children<br />
directly. Sites targeting children generally had cartoon<br />
content with animated characters, interactive games, music,<br />
<strong>and</strong> messages directed specifically at children. A site was<br />
not categorized as child-targeted if it predominantly had<br />
instructions for mothers, contained only recipes, had no<br />
games, had little to no graphical content, or a combination of<br />
these characteristics. If a site met the criteria for being childtargeted,<br />
but also had content directed towards parents, we<br />
included it. However, when child-targeted pages appeared on<br />
another primarily adult-targeted website, we did not identify<br />
the website as child-targeted. For example, although some<br />
pages on the McDonald’s main site advertised the Happy<br />
Meal, it was not child-targeted overall.<br />
<strong>Methods</strong><br />
In addition to the sites classified as child-targeted because of<br />
their content, we added sites that were among the top 10 fast<br />
<strong>food</strong> restaurant websites visited most often by 2- to 17-yearolds<br />
during February 2010, according to comScore’s internet<br />
traffic data; all these websites belonged to one of the twelve<br />
restaurants in our analysis. The only adjustment we made to<br />
this list was to substitute Subway.com with SubwayFreshBuzz.<br />
com. While Subway.com had a significant number of visitors,<br />
only SubwayFreshBuzz.com appeared on Subway’s TV<br />
advertising. In addition, comScore’s “source/loss” data<br />
indicated that a substantial portion of traffic was redirected<br />
to SubwayFreshBuzz.com from the company’s main site.<br />
Qualitative analysis confirmed that SubwayFreshBuzz.<br />
com appeared to be the company’s consumer-oriented site<br />
while Subway.com was designed for information about the<br />
corporation.<br />
Each website has only one homepage but can have many<br />
secondary pages. We excluded pages we assessed as<br />
irrelevant to the marketing of fast <strong>food</strong>s. These included<br />
corporate content; store locators; search functions; pages<br />
about the company or founder; non-U.S. company information;<br />
pages containing <strong>food</strong> allergy <strong>and</strong> sensitivity information; <strong>and</strong><br />
privacy policies, terms of use, <strong>and</strong> official rules. In addition,<br />
when more than one page on a site contained very similar<br />
content, such as menu items or videos that all featured the<br />
same character <strong>and</strong> format, we only included the first page<br />
of the content <strong>and</strong> noted the number of instances of similar<br />
content.<br />
During March <strong>and</strong> April 2010, three coders collected all<br />
pages on each website included in this study. They recorded<br />
a page as a video if it had movement, or if an activity on the<br />
page required clicking the mouse. They recorded it as a PDF<br />
if the page was static.<br />
Coding procedure. We developed coding criteria for online<br />
marketing techniques based on categories described<br />
in previous analyses of children’s websites, 35 36 digital<br />
marketing techniques, 37 <strong>and</strong> online advergames. 38 39 We also<br />
added questions based on our observations from an initial<br />
exploration of the websites, the codebook from the TV content<br />
analysis, <strong>and</strong> the codebook for an analogous content analysis<br />
of cereal websites. 40 On each site we coded the following five<br />
categories:<br />
■ Engagement techniques included (e.g., games, viral<br />
videos, Flash animation <strong>and</strong> music).<br />
■ Featured third parties (including charities, licensed<br />
characters, TV/movies <strong>and</strong> other entertainment), celebrities,<br />
br<strong>and</strong> spokespeople <strong>and</strong> spokes-characters.<br />
■ Products present including kids' meals, promotions,<br />
individual menu items <strong>and</strong> br<strong>and</strong>ing only.<br />
■ Selling points made directly about the restaurants <strong>and</strong>/or<br />
their products including value, health <strong>and</strong> nutrition claims,<br />
new/improved <strong>and</strong> weight loss.<br />
<strong>Fast</strong> <strong>Food</strong> <strong>FACTS</strong> 27
■ Messages (or product associations) that imply other<br />
benefits of the restaurants <strong>and</strong>/or their products including<br />
fun, cool, physical activity <strong>and</strong> humor.<br />
Reliability assessment. Four coders tested the coding<br />
instrument on pages included in the study <strong>and</strong> refined the<br />
instrument to address discrepancies. They then coded<br />
additional pages from different websites included in the study<br />
<strong>and</strong> final clarifications were made to the coding instrument.<br />
The coders reassessed the content of all websites under<br />
consideration. We used Krippendorff’s alpha intercoder<br />
reliability statistic to evaluate the coding of all child-targeted<br />
fast-<strong>food</strong> websites. The statistics on our assessment measures<br />
ranged between .7 <strong>and</strong> 1, indicating substantial to perfect<br />
agreement.. Coders resolved any uncertainty they had during<br />
coding by consensus discussions.<br />
Banner advertising on third-party<br />
websites<br />
Banner advertisements are purchased by companies to<br />
promote their products on other companies’ websites.<br />
These banners, which are displayed along the border of a<br />
webpage, often invoke attention-grabbing Flash animation.<br />
They typically feature a particular menu item or line of items,<br />
or a special promotion such as the opportunity to win money<br />
or other prizes. An effective banner ad is one that induces a<br />
large proportion of viewers to click the ad <strong>and</strong> consequently<br />
be redirected to the advertiser’s website.<br />
Ad Metrix, another comScore product, monitors the same<br />
panel of users as comScore Media Metrix, but tracks any<br />
advertisements that are completely downloaded <strong>and</strong> viewable<br />
on a user’s web browser. Ad Metrix, therefore, measures<br />
individual exposure to banner ads presented in rich media (SWF<br />
files) <strong>and</strong> traditional image-based ads (JPEG <strong>and</strong> GIF files). It<br />
does not capture text, video, or html-based ads. Ad Metrix also<br />
identifies the unique user viewing the advertisement, the thirdparty<br />
website on which the advertisement was viewed, <strong>and</strong> the<br />
company sponsoring the advertisement. In addition, Ad Metrix<br />
captures copies of the actual ads.<br />
The Product Dictionary from comScore was used to determine<br />
the banner advertisements of interest. The company provided<br />
banner advertisement data for each restaurant in our analysis.<br />
For some restaurants, comScore also provided detailed data<br />
for specific menu items or promotions. For example, in the<br />
case of McDonald’s, comScore provided exposure data<br />
for Chicken McNugget banner ads <strong>and</strong> HappyMeal.com<br />
banner ads in addition to data for all McDonald’s banner<br />
ads combined. The company provides data for banner ads<br />
for any fast <strong>food</strong> restaurant, menu item or promotion in its<br />
dictionary that was viewed at least ten times by comScore<br />
panel members on the internet or on a specific publisher site.<br />
Data for exposure to these banner ads were extracted from<br />
the comScore Ad Metrix Advertiser Report. 41 The company<br />
<strong>Methods</strong><br />
began reporting these data by product category for fast<br />
<strong>food</strong> restaurants in June 2009; therefore, we were able to<br />
obtain information for the ten months from June 2009 through<br />
March 2010. During this time period, Ad Metrix did not report<br />
demographic information about the individuals who were<br />
exposed to these advertisements. Consequently, we cannot<br />
differentiate between exposure by any specific age group,<br />
including children, adolescents or African Americans.<br />
Measures available from comScore for each month include<br />
total display ad views, or the number of advertisements fully<br />
downloaded <strong>and</strong> viewed on publisher websites; advertising<br />
exposed unique visitors, or the number of different<br />
individuals exposed to advertisements on a publisher website;<br />
<strong>and</strong> average frequency of ad views per unique visitor by<br />
fast <strong>food</strong> advertiser. This information is available for the total<br />
internet <strong>and</strong> for individual publisher websites.<br />
As we could not separate ads viewed by age group, we<br />
identified the websites on which the advertisements appeared<br />
that were disproportionately targeted to youth (i.e., youth<br />
websites). We defined a youth website as a website that<br />
met one of two conditions: 1) It was identified by comScore<br />
as an entertainment website for youth ages 2-17 years or as<br />
a teen community website during the period examined; or<br />
2) the proportion of visitors ages 2-17 years to the website<br />
exceeded the total percentage of visitors to the internet aged<br />
2-17 years during the time period examined. Because we are<br />
unable to differentiate between ads viewed by young people<br />
versus adults, we instead assume that advertising on youth<br />
websites will be viewed disproportionately by young people.<br />
From the comScore data, we calculated the following<br />
measures for each fast <strong>food</strong> product (including websites,<br />
menu items <strong>and</strong> promotions) for which banner advertising<br />
was found. Total numbers were also calculated for all of a<br />
restaurant’s products:<br />
■ Average unique viewers per month 42 was calculated by<br />
taking an average of the monthly unique viewers of a given<br />
product’s advertisements from June 2009 through March<br />
2010.<br />
■ Average number of ads viewed per month was calculated<br />
by taking an average of the average frequency of ad views<br />
by viewer for the fast <strong>food</strong> restaurant product each month<br />
from June 2009 through March 2010.<br />
■ Percentage of ads viewed on youth websites was<br />
calculated by dividing the fast <strong>food</strong> restaurant product’s<br />
total display ad views that appeared on youth websites by<br />
their total display ad views that appeared on all websites<br />
from June 2009 through March 2010.<br />
■ Total average ads viewed on youth websites per month<br />
was calculated by dividing total display ad views on youth<br />
websites by the number of months for which data were<br />
available.<br />
<strong>Fast</strong> <strong>Food</strong> <strong>FACTS</strong> 28
Banner advertising content analysis<br />
We also analyzed the content of the banner ads that appeared<br />
on third-party websites. Using a comScore Ad Metrix Advertiser<br />
report, we obtained copies of all ads appearing between<br />
June 2009 <strong>and</strong> March 2010 that were produced by the twelve<br />
restaurants in our analysis. We organized the ads according<br />
to comScore’s product category definitions. These categories<br />
are specific to each restaurant, <strong>and</strong> generally relate either to<br />
a particular menu item (for example “Happy Meal”), or to a<br />
specific website (such as Burger King’s “ClubBK.com”).<br />
After ranking the ads according to number of exposed unique<br />
viewers, we selected all ads that met one of the following three<br />
criteria: 1) the ad was one of the twenty most often viewed<br />
ads for its respective company; 2) the ad was one of the ten<br />
most often viewed ads within any category related to children,<br />
teens, ethnic groups, or dollar/value menu products; or 3) the<br />
ad was one of the five most often viewed ads for any other<br />
product category. From this list we eliminated duplicate ads<br />
whose content exactly matched the content of an ad that was<br />
included in the analysis.<br />
We used a modified version of the coding manual used for the<br />
TV ads, excluding sections that were not relevant to internet<br />
ads <strong>and</strong> adding new codes as appropriate for the medium.<br />
The modified coding manual included five categories from the<br />
TV coding manual, as well as a new category for engagement<br />
techniques:<br />
■ Main product or promotion.<br />
■ Perceived target audience, in particular age <strong>and</strong> ethnicity<br />
groups.<br />
■ Selling points.<br />
■ Engagement techniques. This category included<br />
questions about movement within the banner ad (e.g.,<br />
static versus Flash animation) <strong>and</strong> interactive features of<br />
the ad. Examples of such features are an embedded poll or<br />
quiz, a link to order <strong>food</strong> online, a “rollover” that responds to<br />
movements of the viewer’s mouse, a game within the ad or a<br />
link to a game, a code to unlock features at an advergaming<br />
site, a link to a video, <strong>and</strong> a link to a social networking site.<br />
One research assistant was trained on the coding procedures<br />
in a series of practice sessions administered by experienced<br />
TV coders who had already established good inter-rater<br />
reliability. During each session, both the trainee <strong>and</strong> the<br />
experienced coders coded a sample of advertisements,<br />
<strong>and</strong> then discussed the results. The trainers identified any<br />
coding problems or inconsistencies in the trainee’s coding<br />
<strong>and</strong> clarified areas of confusion. This process was repeated<br />
until the project manager determined that the new coder<br />
had a thorough underst<strong>and</strong>ing of the coding procedure, as<br />
evidenced by high percent agreement with experienced<br />
coders on the practice coding. The research assistant then<br />
coded all banner ads.<br />
Social media<br />
<strong>Methods</strong><br />
For the purposes of our study, we adopted Kaplan <strong>and</strong><br />
Haenlein’s definition of social media: “Social Media is a group<br />
of Internet-based applications that build on the ideological<br />
<strong>and</strong> technological foundations of Web 2.0, <strong>and</strong> that allow the<br />
creation <strong>and</strong> exchange of User Generated Content.” 43<br />
We examined marketing activities that fast <strong>food</strong> restaurants<br />
engage in on three major social media websites: Facebook,<br />
Twitter, <strong>and</strong> YouTube. These three are the leading websites<br />
in their fields (social networking, micro blogging, <strong>and</strong> video<br />
sharing, respectively) <strong>and</strong> are used as marketing vehicles<br />
for the twelve companies in our analysis. Registration with all<br />
three sites is limited to persons aged 13 <strong>and</strong> older.<br />
Facebook is the largest social networking site with more<br />
than 500 million users worldwide. 44 Members have their own<br />
pages where they can present information about themselves,<br />
post links to other sites, upload photos <strong>and</strong> videos, <strong>and</strong><br />
write messages. Members connect with other members<br />
by becoming “friends,” thereby incorporating them in their<br />
network.<br />
Similarly, individual Facebook users can become a fan of<br />
a br<strong>and</strong> by clicking a “like” button on the br<strong>and</strong>’s page. A<br />
thumbnail photo of that individual is then visible on the br<strong>and</strong><br />
page in the “people who like this” section. Any time the<br />
br<strong>and</strong> modifies its page, for example by adding a feature or<br />
posting a comment, that activity shows up in the individual’s<br />
“news feed,” or personalized Facebook home page. Similarly,<br />
anytime the individual interacts with the br<strong>and</strong> page, this<br />
action shows up in the “news feeds” of all of his or her friends.<br />
The br<strong>and</strong> also shows up on the individual’s Facebook page<br />
as something that he or she “likes.”<br />
A typical br<strong>and</strong> page consists of a number of tabs, each<br />
containing different content including messages from the<br />
br<strong>and</strong> <strong>and</strong> from fans of the br<strong>and</strong>, photos, videos, events,<br />
polls, quizzes, <strong>and</strong> applications.<br />
Twitter is a micro blogging service that has more than 145<br />
million registered users worldwide. 45 Twitter users publish<br />
140-character messages, called “tweets,” that are posted<br />
on their own profile pages. Users can “follow” each other. By<br />
doing so, an author subscribes to another author’s tweets.<br />
These “followed” tweets then are published on the Twitter<br />
home pages of all of an author’s “followers.” Twitter users may<br />
also access the tweets of authors whom they follow through<br />
their mobile phones, with text messages, third-party Twitter<br />
applications, or Twitter’s own mobile platform.<br />
While Twitter does have a “promoted tweets” advertising<br />
platform that was launched in 2010 with Starbucks as an initial<br />
partner, we focused instead on the microblogging pages, as<br />
described above, which fast <strong>food</strong> restaurants can use, free<br />
of charge.<br />
<strong>Fast</strong> <strong>Food</strong> <strong>FACTS</strong> 29
YouTube is a website that enables users to view, upload,<br />
<strong>and</strong> share videos. The fast <strong>food</strong> restaurants in our analysis<br />
have created customized channels on YouTube with playlists<br />
of videos available for viewing. While anyone can watch the<br />
videos without registering, registered users can “subscribe”<br />
to a channel <strong>and</strong> receive alerts anytime a new video is posted.<br />
YouTube accounted for nearly 40% of the 33.2 billion videos<br />
watched online during December 2009. 46<br />
Social media data collection. Because social media are<br />
so new, <strong>and</strong> marketing techniques employing them are still<br />
evolving, it is difficult to procure data to measure exposure<br />
<strong>and</strong> impact. Among advertisers that use social media, there<br />
is no clear consensus on the key metrics to use. Because<br />
user information is kept private, none of the sites provide<br />
demographic information about followers of a particular br<strong>and</strong>’s<br />
page. Similarly, comScore does not provide demographic<br />
information for any of their measurements at the page level.<br />
We identified <strong>and</strong> tracked fast <strong>food</strong> restaurant pages on each<br />
of the three social media sites over a 29-week period from<br />
December 22, 2009 to July 30, 2010, capturing information<br />
that is publicly available once a week. For Facebook, we<br />
tracked the number of likes for each fast <strong>food</strong> restaurant’s<br />
page(s). For Twitter, we tracked the number of followers of<br />
each br<strong>and</strong>’s Twitter page(s). And for YouTube, we recorded<br />
the following data: number of subscribers, <strong>and</strong> upload views<br />
(number of views for all uploaded videos).<br />
We also conducted content analyses of each media. For<br />
Facebook <strong>and</strong> Twitter, we identified the specific products<br />
(special <strong>menus</strong>, meals, time of day, individual menu items,<br />
<strong>and</strong> lines of items) featured <strong>and</strong> links included in posts that<br />
directed users to external websites. We also identified all<br />
value promotions (including coupons, special limited-time<br />
price promotions, <strong>and</strong> any other posts that mentioned specific<br />
prices). Finally, we identified the engagement techniques<br />
employed by each media. For Facebook, these include tabs,<br />
photos, videos, polls, <strong>and</strong> profile pictures. For Twitter, these<br />
include contests specifically designed for Twitter users <strong>and</strong><br />
customer service interactions.<br />
The Facebook content analysis was performed using screen<br />
captures saved weekly while gathering the data for br<strong>and</strong><br />
fans. We looked at pages from January through March 2010<br />
that had at least 100,000 fans.<br />
For Twitter, we created a program to download the most recent<br />
3,000 tweets written by each fast <strong>food</strong> restaurant from Twitter’s<br />
servers to analyze the content of tweets published in 2009. We<br />
limited our analysis to accounts that had a minimum of 1,000<br />
followers. We recovered all 2009 tweets for all restaurants,<br />
with the exception of Dunkin’ Donuts <strong>and</strong> Starbucks (the @<br />
Starbucks account) due to their exceptionally high volume.<br />
We downloaded a sizable sample of over 1,941 of Starbucks’<br />
2009 tweets (59% of the total 2009); however, we could only<br />
download Dunkin’ Donuts’ tweets from February 2010, so its<br />
tweets are excluded from the content analysis. Wendy’s @<br />
WendysRestaurant is also excluded from the content analysis<br />
because the program was unable to retrieve the restaurant’s<br />
2009 tweets.<br />
To perform the content analysis for YouTube, we used the<br />
coding manual for the TV content analysis. We limited our<br />
analysis to all videos uploaded to YouTube by the fast <strong>food</strong><br />
restaurants in 2009 that had a minimum of 5,000 views,<br />
Furthermore, we measured the frequency with which<br />
restaurants engaged with individuals through social media by<br />
presenting the frequency of posts on Facebook from January 1,<br />
2010 through March 31, 2010; the number of tweets per week<br />
in 2009; <strong>and</strong> the number of videos posted on YouTube in 2009.<br />
Social media footprint. We also present a footprint of the<br />
social media activities of each restaurant, incorporating the<br />
quantitative data collected. We created a bubble chart that<br />
shows the relative size of each company’s installed <strong>and</strong><br />
engaged fan base as determined by the number of Facebook<br />
fans, Twitter followers, <strong>and</strong> 2009 upload views on YouTube.<br />
Mobile marketing<br />
<strong>Methods</strong><br />
We examined three methods used by restaurants to target cell<br />
phone users: banner ads on mobile web sites, smartphone<br />
applications, <strong>and</strong> text messaging.<br />
■ Mobile banner ads: These advertisements appear at the<br />
top or bottom of third-party mobile web pages. Similar to<br />
internet banner ads, they are graphic display ads (commonly<br />
accepted file types are GIF, Animated GIF, JPEG, <strong>and</strong> PNG)<br />
that click through to a page designated by the advertiser.<br />
Companies typically maintain mobile websites that can be<br />
accessed through cell phones <strong>and</strong> that are separate from<br />
their internet websites.<br />
■ Smartphone applications: These are operating systemspecific<br />
(e.g. iPhone <strong>and</strong> Android) applications that may<br />
be downloaded to mobile phones. They act as st<strong>and</strong>-alone<br />
programs <strong>and</strong> may perform a number of different functions,<br />
including games, store locators, <strong>and</strong> ordering platforms.<br />
■ Text messaging: The Short Message Service (SMS)<br />
enables brief messages (160 characters or fewer) to be<br />
sent between mobile phones <strong>and</strong> other SMS-enabled<br />
devices. While the technology is primarily used to transmit<br />
messages between private parties, it can also be used<br />
to communicate with companies to make payments,<br />
make inquiries from a service provider such as Google<br />
or F<strong>and</strong>ango, <strong>and</strong>, most significantly for our purposes, to<br />
place orders with a restaurant.<br />
Mobile banner ads. We purchased mobile advertising data<br />
from comScore. The firm’s Ad Metrix Mobile product tracks<br />
banner ads on more than 1,000 mobile URLs. These sites<br />
include all sites linked to a mobile service provider’s portal<br />
(effectively a carrier-specific home page for accessing<br />
the mobile internet). The company automatically collects<br />
<strong>Fast</strong> <strong>Food</strong> <strong>FACTS</strong> 30
data from these defined portal websites every six hours,<br />
or approximately 120 times per month. Copies of the<br />
advertisements are captured <strong>and</strong> stored as a static image<br />
<strong>and</strong> classified four ways: by the company that owns the<br />
product being advertised, the division responsible for the<br />
product being advertised, the br<strong>and</strong> name of the product<br />
being advertised, <strong>and</strong> the product itself.<br />
Another product from comScore, Mobile Metrix, determines<br />
the top mobile websites as ranked by number of unique<br />
visitors. In order to determine this number, comScore meters<br />
the phones of a panel of participants aged 18 years <strong>and</strong><br />
older <strong>and</strong> automatically captures their activity. The observed<br />
population of metered phones only includes smartphone data<br />
from comScore panelists using RIM, Microsoft, Palm, Google,<br />
<strong>and</strong> Symbian platforms. Smartphones are cell phones that<br />
run operating systems <strong>and</strong> offer advanced capabilities with<br />
PC-like functionality such as the iPhone.<br />
In our analysis, we used a comScore measure from Ad<br />
Metrix to describe mobile ad frequency: ad index. Ad index<br />
indicates relative share of presence of the advertisement on<br />
a given mobile website. This is established by comparing the<br />
frequency with which a particular advertisement appears on<br />
a mobile website as compared to all other advertisements<br />
on the same website. The ad index therefore acts as a<br />
benchmark: Any number above 100 indicates a greater<br />
observed presence than expected, while a number below 100<br />
indicates the converse.<br />
We also used comScore’s Ad Metrix Mobile to identify fast<br />
<strong>food</strong> mobile website banner ads, the sites that they were<br />
advertised on, <strong>and</strong> the ad index for each restaurant advertiser<br />
on each website. We then removed duplicate ads with the<br />
same content but formatted as a different size <strong>and</strong> coded all<br />
unique banner ads using the coding manual developed for<br />
internet banner ads.<br />
Smartphone applications. We purchased an iPhone which<br />
we used to download all applications available that were<br />
produced by the twelve restaurants in our analysis. Content<br />
analysis of these applications documents the features <strong>and</strong><br />
capabilities of each, including ordering ability, store locators,<br />
nutrition information, games, <strong>and</strong> special offers.<br />
The bi-annual iTunes Application Tracker report from comScore<br />
details the most popular, as defined by number downloaded,<br />
applications available for the iPhone <strong>and</strong> iPod Touch. The<br />
Tracker collects data for more than 5,000 iTunes applications<br />
through comScore's panel of two million persons. The product<br />
details application-specific information, such as projected total<br />
population <strong>and</strong> projected demographics of application users.<br />
For fast <strong>food</strong> restaurant applications with enough activity,<br />
comScore collects data from its online panel of iTunes users to<br />
measure the population of 12- to 17-year-olds who have these<br />
applications installed on their phones. ComScore has not<br />
included individuals who have downloaded applications <strong>and</strong><br />
<strong>Methods</strong><br />
then deleted them when calculating the number of projected<br />
users; this metric represents the installed user base only. We<br />
also report the percentage of all application users who are<br />
12-17 years.<br />
Text messaging. Text messaging is used by fast <strong>food</strong><br />
restaurants as both an advertising medium <strong>and</strong> an ordering<br />
vehicle. In addition to using our iPhone to download<br />
applications, we also registered our phone number with fast<br />
<strong>food</strong> restaurants to receive text messages. We report which<br />
restaurants use text messaging as an ongoing part of their<br />
marketing efforts.<br />
We identified restaurants that allow individuals to place orders<br />
through text messaging. Some fast <strong>food</strong> restaurants allow<br />
people to send a text message to a short code with the body<br />
of the message containing the details of their order. Alongside<br />
our report of which restaurants use text messaging regularly<br />
to advertise, we also indicate which restaurants have added<br />
SMS to their roster of ordering options.<br />
To underst<strong>and</strong> the ways in which teens access <strong>and</strong> use<br />
SMS services, we obtained data from comScore’s MobiLens<br />
product. Every month, the company surveys mobile<br />
subscribers, aged 13 years <strong>and</strong> older, to recall their mobile<br />
content consumption during the previous month.<br />
We use MobiLens to report the proportion of the teen<br />
population (13-17 years) who received SMS advertisements<br />
on their cell phones each month in 2009. We also report the<br />
proportion of the population who received SMS ads for <strong>food</strong><br />
<strong>and</strong> for restaurants.<br />
Marketing inside restaurants<br />
We conducted a nationally representative audit of in-store<br />
marketing at the twelve fast <strong>food</strong> restaurants in our analysis<br />
to assess marketing messages at the point when consumers<br />
decide what menu items to purchase. The audit consisted of<br />
three main parts: 1) restaurant signs audit, which detailed<br />
menu items, messages <strong>and</strong> promotions on signs inside <strong>and</strong><br />
outside the restaurants; 2) pricing analysis to appraise the<br />
cost of eight comparable items at each restaurant, <strong>and</strong> 3)<br />
sales practices audit to assess the default sides, drinks <strong>and</strong><br />
sizes given when ordering a kids’ meal <strong>and</strong> a combo meal.<br />
We commissioned a market research firm to oversee <strong>and</strong><br />
conduct the in-person restaurant audits. The research<br />
firm specializes in retail research conducted through a<br />
nationwide network of trained, experienced field personnel<br />
in major metropolitan areas. They maintain a comprehensive<br />
<strong>quality</strong> control program to ensure the collection of accurate<br />
data, which includes spot checking the original data <strong>and</strong><br />
calculations, <strong>and</strong> restaurant rechecks when necessary. Field<br />
personnel audited signs <strong>and</strong> pricing in a representative<br />
sample of 1,050 fast <strong>food</strong> restaurants in 37 markets across<br />
the United States, including 100 different locations for each<br />
of the larger restaurants in our analysis (McDonald’s, Burger<br />
<strong>Fast</strong> <strong>Food</strong> <strong>FACTS</strong> 31
King, Subway, Wendy’s, Starbucks, Taco Bell, Pizza Hut,<br />
Dunkin’ Donuts, <strong>and</strong> KFC) <strong>and</strong> 50 locations for each of the<br />
smaller restaurants (Sonic, Domino’s <strong>and</strong> Dairy Queen). Only<br />
restaurants that were free-st<strong>and</strong>ing <strong>and</strong> open year-round were<br />
included in the analysis.<br />
Restaurant signs audit<br />
The restaurant signs audit documented signs inside <strong>and</strong><br />
outside the restaurant. Field personnel underwent training<br />
in audit procedures <strong>and</strong> received a comprehensive field<br />
form together with detailed instructions. Field forms were<br />
customized by restaurant <strong>and</strong> listed individual menu items<br />
compiled from each of the fast <strong>food</strong> restaurants’ online<br />
<strong>menus</strong>. In addition, the form included space to record<br />
any signs that promoted the following menu types without<br />
mentioning specific menu items: breakfast menu for signs<br />
promoting availability of breakfast; late-night menu, which<br />
included signs referencing availability of a late-night menu<br />
or the restaurant having late hours; <strong>and</strong> dollar/value menu,<br />
which included mentions of availability of a dollar/value menu,<br />
combo meal or other value mention in the absence of specific<br />
menu items. Lastly, the field form provided space to write<br />
in any individual menu items present on signs that were not<br />
listed on the field form.<br />
For each menu item <strong>and</strong> type, field personnel indicated the<br />
number of signs which appeared in each of four areas within<br />
the restaurant: 1) the counter area, which included all areas in<br />
front of, around <strong>and</strong> behind the counter inside the restaurant<br />
as well as anything in direct view of customers st<strong>and</strong>ing in<br />
line; 2) all other indoor areas, which included all areas inside<br />
the location other than the ordering/counter area; 3) the drivethru<br />
area, which included signs located in the drive-thru lane<br />
from beginning to end <strong>and</strong> in the area immediately around<br />
the drive-thru menu board; <strong>and</strong> 4) the other outdoor areas,<br />
which included the parking lot, main marquee sign, roof,<br />
ground <strong>and</strong> anything posted in the restaurant windows facing<br />
to the outside.<br />
In addition, field personnel recorded the number of signs with<br />
price or other promotions for each menu item <strong>and</strong> type. Price<br />
promotions included any special price featured with an item<br />
<strong>and</strong> free <strong>food</strong> giveaways, such as “Free fries with the purchase<br />
of a burger.” Other promotions on signs included non-<strong>food</strong><br />
giveaways, sweepstakes, celebrity endorsements, licensed<br />
characters, movie tie-ins <strong>and</strong> games advertised. Finally, field<br />
personnel indicated the number of signs for each menu item<br />
<strong>and</strong> type that included any of the following messages: value,<br />
which included signs that featured value or combo meals,<br />
an item or meal at a low or lower price, or the word “value;”<br />
kids, which included specific mention of a kids’ meal menu<br />
item, toys or other mention of “kids” or “children;” <strong>and</strong> health,<br />
which included signs that referenced the healthiness of menu<br />
items with words such as “healthy,” “low-fat,” “diet,” or “lowcalorie”<br />
as well as any mention of a restaurant’s healthy menu.<br />
Field personnel received the names of the restaurants’ healthy<br />
<strong>menus</strong>. In addition, field personnel recorded information<br />
about any other promotions present in the restaurant.<br />
Nutritional <strong>quality</strong> of menu items on<br />
restaurant signs<br />
To assess the <strong>nutritional</strong> <strong>quality</strong> of menu items featured on<br />
signs at the restaurants, we combined the data obtained<br />
in the audit of menu item signs at the restaurants <strong>and</strong> the<br />
<strong>nutritional</strong> <strong>quality</strong> data obtained in the menu composition<br />
analysis. For each menu item that appeared on restaurant<br />
signs, we obtained the following nutrition information: calories,<br />
sodium, saturated fat, sugar, <strong>and</strong> NPI score. For items offered<br />
in various sizes or different variations (e.g., different sauces<br />
served with chicken nuggets), we calculated median values<br />
for all variations of the menu item in our menu composition<br />
analysis. In a few instances, a menu item that appeared on<br />
restaurant signs in June 2010 did not appear on the regular<br />
restaurant <strong>menus</strong> in January 2010 <strong>and</strong> therefore nutrition<br />
data were not available in our menu composition analysis.<br />
If field personnel found more than five signs promoting that<br />
menu item, we contacted the restaurant to obtain nutrition<br />
information for those menu items.<br />
We then used the number of times that each menu item<br />
appeared on signs at the restaurants to calculate the weighted<br />
average number of total calories, sugar calories, saturated<br />
fat calories, <strong>and</strong> sodium for menu items that appeared on<br />
signs at each restaurant in each location <strong>and</strong> all locations.<br />
We doubled the number of menu items that appeared at<br />
signs in Sonic, Domino’s, <strong>and</strong> Dairy Queen restaurants as<br />
the audit examined 50 restaurants each for these companies,<br />
compared to 100 restaurants for the other companies. These<br />
measures provide a comparison of the <strong>nutritional</strong> <strong>quality</strong> of<br />
<strong>food</strong>s featured in signs at different restaurants <strong>and</strong> in different<br />
locations. Finally, we calculated the percentage of healthy<br />
products on signs by dividing the number of menu items<br />
with a healthy NPI score that appeared on signs by the total<br />
number of menu items that appeared on signs for each<br />
restaurant <strong>and</strong> location within the restaurants.<br />
Pricing analysis<br />
<strong>Methods</strong><br />
In all locations of the in-store marketing audit (excluding the<br />
pizza <strong>and</strong> coffee restaurants), field personnel recorded the<br />
price of eight individual menu items. Researchers provided<br />
field personnel with the eight menu items to be priced during<br />
the audit. These items were chosen to include similar items<br />
across restaurants in the following comparison categories<br />
(when available): 1) main dish salad with chicken; 2)<br />
healthier <strong>and</strong> less healthy versions of the restaurants’ chicken<br />
s<strong>and</strong>wich; 3) the restaurant’s healthiest, moderately unhealthy,<br />
<strong>and</strong> least healthy beef s<strong>and</strong>wich; <strong>and</strong> 4) the healthiest <strong>and</strong><br />
least healthy side (for most restaurants this included a fried<br />
potato <strong>and</strong> a raw fruit or vegetable side such as apples or<br />
<strong>Fast</strong> <strong>Food</strong> <strong>FACTS</strong> 32
side salad). Researchers determined the <strong>nutritional</strong> <strong>quality</strong><br />
of the items to be priced according to NPI scores <strong>and</strong> total<br />
calories. Researchers chose items with similar serving sizes<br />
for comparison. For each item, we calculated the average<br />
retail price recorded across all restaurant locations.<br />
Sales practices audit<br />
The sales practices audit took place in 250 locations of<br />
the five largest restaurant chains: 50 each in McDonald’s,<br />
Burger King, Wendy’s, Subway <strong>and</strong> Taco Bell. The audit was<br />
conducted Monday through Friday during the week of June 14,<br />
2010. Field personnel ordered two different pre-determined<br />
items at each restaurant: a kids’ meal <strong>and</strong> a combo meal.<br />
They received detailed scripts of how to order each item.<br />
The scripts included different menu items to order at each<br />
restaurant, but otherwise were identical. Field personnel<br />
placed all orders at the counter inside the restaurant <strong>and</strong> did<br />
not identify the purpose of their order. After the order was<br />
completed, they recorded employee responses at a location<br />
outside the restaurant.<br />
Field personnel first ordered a kids’ meal without specifying<br />
a desired side or beverage. Similar kids’ meals were ordered<br />
across restaurants: a hamburger kids’ meal at McDonald’s,<br />
Burger King <strong>and</strong> Wendy’s; a crunchy beef taco meal at<br />
Taco Bell; <strong>and</strong> a roast beef s<strong>and</strong>wich meal at Subway. Field<br />
personnel recorded whether the employee automatically<br />
included a specific side <strong>and</strong>/or drink with the meal without<br />
asking any further questions (i.e., the default item) or if the<br />
employee inquired about the side <strong>and</strong> drink desired. If the<br />
employee asked whether the shopper wanted a particular<br />
side(s) or drink(s) (e.g., “Would you like fries or onion rings with<br />
that?”), the field personnel ordered the first side or beverage<br />
offered. If the employee asked an open-ended question<br />
about what side or beverage the shopper wanted, the field<br />
personnel asked, “What sides/drinks can I get?” <strong>and</strong> ordered<br />
the first side or beverage suggested. Researchers provided<br />
field personnel with information about the healthier side <strong>and</strong><br />
drink options available at each restaurant; <strong>and</strong> field personnel<br />
recorded all healthy sides <strong>and</strong> drinks offered by the employee<br />
during the conversation. In addition, field personnel recorded<br />
any suggestions made by the employee to modify the order<br />
such as type of bread, condiments, ordering a larger size, or<br />
ordering additional items. Finally, field personnel recorded the<br />
type <strong>and</strong> size of side <strong>and</strong> beverage received as well as the<br />
size <strong>and</strong> price of the kids’ meal.<br />
After ordering the kids’ meal, field personnel then ordered a<br />
combo meal without requesting a specific side, beverage, or<br />
size. Similar meals were ordered across restaurants: Quarter<br />
Pounder combo meal at McDonald’s, Whopper value meal at<br />
Burger King, quarter pound single combo meal at Wendy’s,<br />
crunchy taco combo meal at Taco Bell, <strong>and</strong> 6-inch roast beef<br />
combo meal at Subway. Field personnel recorded whether the<br />
employee automatically provided a specific size combo meal,<br />
side, <strong>and</strong>/or beverage as the default. If the employee asked<br />
about specific sizes, sides <strong>and</strong>/or beverages (e.g., “Would<br />
you like a small, medium or large?”) field personnel ordered<br />
the first option suggested. If the employee asked an openended<br />
question about the desired size, side <strong>and</strong>/or beverage,<br />
field personnel inquired about the options available <strong>and</strong><br />
ordered the first one offered. The field personnel recorded<br />
all sizes suggested by the employee <strong>and</strong> all healthy sides<br />
offered. Field personnel also recorded any suggestions made<br />
by the employee to upsize the combo meal <strong>and</strong> said “yes” to<br />
these suggestions. In addition, if the employee asked if the<br />
field personnel would like to modify the meal by adding or<br />
substituting menu items, condiments, or types of bread, these<br />
suggestions were recorded. Field personnel recorded the<br />
size <strong>and</strong> price of the combo meal received <strong>and</strong> the type <strong>and</strong><br />
size of the side <strong>and</strong> beverage.<br />
Marketing outcomes<br />
<strong>Methods</strong><br />
To measure the outcomes of restaurants’ marketing practices,<br />
we present data from two different sources: 1) a survey of<br />
parents of 2- to 11-year-olds to underst<strong>and</strong> how often they visit<br />
fast <strong>food</strong> restaurants with their children, the menu items they<br />
purchase, <strong>and</strong> why; <strong>and</strong> 2) market research data purchased<br />
from The NPD Group’s CREST service to quantify the types of<br />
prepared <strong>food</strong> <strong>and</strong> beverage products purchased most often.<br />
<strong>Fast</strong> <strong>food</strong> restaurants visits<br />
We surveyed parents of 2- to 11-year-old children to underst<strong>and</strong><br />
how often they purchase fast <strong>food</strong> for their children <strong>and</strong> which<br />
restaurants they frequent. We also asked what menu items<br />
they purchased for their children during their last visit <strong>and</strong> why<br />
they chose that fast <strong>food</strong> restaurant <strong>and</strong> those menu items.<br />
We examined differences between parents of preschool-age<br />
children (2-5 years) <strong>and</strong> elementary school-age children (6-11<br />
years). We also looked at differences between white, African<br />
American, <strong>and</strong> Hispanic parents. We collected data on visits<br />
to the four largest fast <strong>food</strong> restaurants: McDonald’s, Burger<br />
King, Subway <strong>and</strong> Wendy’s. The survey was conducted on<br />
the internet from August 27 to September 2, 2010.<br />
We recruited a national sample of 300 parents <strong>and</strong><br />
augmented the sample to ensure it included at least 100<br />
Hispanic parents <strong>and</strong> 100 African American parents. Survey<br />
Sampling International (SSI) distributed the survey to its panel<br />
of consumers who agree to participate in ongoing survey<br />
research. 47 SSI recruits its panel members through thous<strong>and</strong>s<br />
of websites to obtain a representative sample of the online<br />
population. The company screens panelists to provide high<strong>quality</strong><br />
respondents <strong>and</strong> minimize fraud. To ensure more<br />
honest responses, panelists do not receive a direct reward for<br />
completing individual surveys. Instead, participants receive<br />
compensation for being active panelists. These rewards range<br />
from charitable donations <strong>and</strong> information to monetary <strong>and</strong><br />
<strong>Fast</strong> <strong>Food</strong> <strong>FACTS</strong> 33
point rewards for overall participation. All participants in this<br />
survey were anonymous, <strong>and</strong> the procedures were approved<br />
by Yale University's Human Subjects Committee..<br />
Participants accessed the survey on the computer through<br />
an email link. The internet was used to distribute the survey<br />
because it provides access to a large, well-represented<br />
sample of the national population, including Hispanics <strong>and</strong><br />
African Americans. Furthermore, internet surveys generally<br />
produce responses of equal or better <strong>quality</strong> compared to<br />
telephone surveys. 48<br />
Survey questions. After completing an informed consent<br />
form, participants first confirmed that they were the parent of<br />
at least one child (2-11 years). Parents then indicated whether<br />
they had purchased lunch or dinner from McDonald’s, Burger<br />
King, Subway, or Wendy’s for one or more of their children<br />
within the past week. Parents who answered “yes” continued<br />
to provide information about their most recent visit to one of<br />
the fast <strong>food</strong> restaurants. Those who had not visited one of<br />
these restaurants in the past week then answered questions<br />
about how often they usually buy fast <strong>food</strong> for their children<br />
from the twelve restaurants in our analysis <strong>and</strong> provided<br />
demographic information.<br />
Parents who had purchased lunch or dinner from one of the<br />
four fast <strong>food</strong> restaurants in the past week for their children<br />
were then asked about their most recent visit, including on<br />
which day of the week the visit occurred, where the restaurant<br />
was located, how they ordered the <strong>food</strong>, where they consumed<br />
the <strong>food</strong>, <strong>and</strong> why they chose that restaurant. Respondents<br />
then provided information about the youngest child for whom<br />
they purchased <strong>food</strong> during that visit. They indicated if <strong>and</strong><br />
why that child wanted to visit the restaurant <strong>and</strong> what type<br />
of menu they ordered for the child (i.e., kids’ meal, dollar/<br />
value menu, combo meal or other). If they ordered from the<br />
kids’ meal or the dollar/value menu, they were then shown a<br />
list of items available on each menu for the restaurant they<br />
visited <strong>and</strong> selected the items they ordered for their youngest<br />
child. They also indicated why they chose to order from that<br />
menu <strong>and</strong> why they chose each of the items they ordered.<br />
Respondents then answered the questions about frequency<br />
of fast <strong>food</strong> restaurant visits <strong>and</strong> demographic information.<br />
Group comparisons. In addition to comparing survey<br />
responses by restaurant visited most recently, we also<br />
compared responses for parents of 2- to 5-year-olds versus<br />
6- to 11-year-olds, <strong>and</strong> white, African American <strong>and</strong> Hispanic<br />
parents when sample size permitted. We used chi-square<br />
analyses <strong>and</strong> Z-tests for proportions to identify significant<br />
differences between restaurants <strong>and</strong> demographic groups.<br />
Menu items purchased at fast <strong>food</strong><br />
restaurants<br />
To identify <strong>and</strong> evaluate the menu items ordered at fast <strong>food</strong><br />
restaurants we obtained data from NPD, one of the world’s<br />
<strong>Methods</strong><br />
largest privately owned market research companies. 49 NPD<br />
provides restaurant behavior data obtained through online<br />
surveys taken by panelists about their meals <strong>and</strong> snacks<br />
prepared away from home “yesterday.” 50 NPD’s panel consists<br />
of more than 1.8 million registered adults <strong>and</strong> teens who have<br />
agreed to participate in its surveys, <strong>and</strong> the panel is updated<br />
daily to add new recruits <strong>and</strong> exclude poor-<strong>quality</strong> respondents.<br />
The company recruits panelists using only opt-in sources (e.g.,<br />
email, website banner ads, etc). Once they register, panelists<br />
must opt-in two more times, demonstrating their commitment,<br />
before they are added to the panel <strong>and</strong> receive surveys.<br />
Every day, NPD receives approximately 2,000 surveys from<br />
panelists, including 1,900 adults <strong>and</strong> 100 teens (13- to 17-yearolds).<br />
51 Parents report the behavior of their children under 13.<br />
Of all respondents, approximately 45% indicate purchasing a<br />
meal or snack (which could include a beverage-only occasion)<br />
the day before taking the survey. 52 NPD reports approximately<br />
285,000 quick-serve restaurant visits annually (including orders<br />
at the restaurant <strong>and</strong> orders from other locations such as by<br />
phone or the internet), including 62,000 for children <strong>and</strong> teens.<br />
Panelists provide the name <strong>and</strong> location of the restaurant<br />
they visited the previous day, <strong>and</strong> note the time of visit <strong>and</strong><br />
how the <strong>food</strong> was obtained, such as by drive-thru, delivery,<br />
or carry-out. 53 They also answer questions about the <strong>food</strong><br />
they purchased such as total price paid, promotions used,<br />
special menu, <strong>and</strong> meal type (e.g., combo meal, kids’ meal<br />
or dollar/value menu), <strong>and</strong> whether the <strong>food</strong> items purchased<br />
were described as healthy. 54 For major chain restaurants, the<br />
survey then displays a current menu for the restaurant visited,<br />
<strong>and</strong> respondents select the items they purchased the previous<br />
day. A few specific questions about menu items are asked<br />
such as size of french fry orders <strong>and</strong> beverages, specific<br />
toppings on pizzas, <strong>and</strong> condiments on s<strong>and</strong>wiches. 55<br />
NPD projects the survey panel data to the U.S. population,<br />
using geographic <strong>and</strong> demographic targets from the U.S.<br />
Census Bureau. 56 The data are also calibrated according<br />
to individual restaurant sales <strong>and</strong> traffic data, to accurately<br />
represent each restaurant’s presence within the industry.<br />
We purchased NPD CREST menu item data for each restaurant<br />
in our analysis <strong>and</strong> for all major fast <strong>food</strong> restaurants combined.<br />
NPD defines a major fast <strong>food</strong> restaurant as one with at least<br />
250 transactions in its sample during a given year. In 2009,<br />
79 restaurants fell into this category. We report measures<br />
for the following demographic groups: Under 6 years, 6-12<br />
years, under 13 years, 13-17 years, 18-24 years, 25-49 years,<br />
all respondents, African American under 18 years, Hispanic<br />
under 18 years, <strong>and</strong> Caucasian under 18 years.<br />
Descriptive information about fast <strong>food</strong><br />
orders by demographic group<br />
We report the following measures by demographic group for<br />
all fast <strong>food</strong> restaurant orders during 2009:<br />
<strong>Fast</strong> <strong>Food</strong> <strong>FACTS</strong> 34
■ Items per eater. Average number of items ordered per visit<br />
per individual.<br />
■ Time of day. Percentage of visits during the following<br />
dayparts: morning meal, lunch, supper, <strong>and</strong> PM snack.<br />
■ Where ordered/where eaten. Percentage of visits where<br />
<strong>food</strong> was ordered at the restaurant, outside the restaurant,<br />
<strong>and</strong> by carry-out, drive-thru, <strong>and</strong> delivery.<br />
■ Special meal type. Percentage of visits that include combo<br />
meals, items from the dollar menu, kids’ menu or other type<br />
of menu. We report this measure for all fast <strong>food</strong> restaurants<br />
<strong>and</strong> all fast <strong>food</strong> restaurants that serve hamburgers.<br />
We provide the following measures for the two-year period<br />
from January 2008 through December 2009:<br />
■ Beverage size. Percentage of meals that included a<br />
beverage in one of the following sizes: can/bottle, small<br />
cup/glass, medium cup/glass, large cup/glass, extra large<br />
cup/glass, or in a box/pouch.<br />
■ Total fry size. Percentage of meals that included french<br />
fries from the dollar menu, from a kids’ meal, small, medium,<br />
large, or extra large.<br />
We also quantify the types of <strong>food</strong>s ordered by different<br />
demographic groups across all fast <strong>food</strong> restaurants. NPD<br />
classifies all restaurants’ individual menu items by <strong>food</strong><br />
type. For example, McDonald’s Big Mac <strong>and</strong> Burger King’s<br />
Whopper with cheese would both be classified as a “large<br />
cheeseburger.” By categorizing <strong>food</strong> in this manner, types<br />
can be compared across restaurants. NPD calculates menu<br />
importance by demographic group for the <strong>food</strong> types most<br />
commonly ordered, which is defined as the percentage of<br />
meals or snacks ordered by the specific demographic group<br />
that included a specific <strong>food</strong> (or beverage) type. Only <strong>food</strong><br />
types ordered by at least 50 panelists in the demographic<br />
group of interest are reported. We present these data for<br />
<strong>Methods</strong><br />
the two-year period from January 2008 through December<br />
2009 for preschool-age children (under 6 years), children (6-<br />
12 years), teens (13-17 years), young adults (18-24 years),<br />
adults (25-49 years), <strong>and</strong> African American, Hispanic <strong>and</strong><br />
white youth (under 18 years).<br />
Nutritional <strong>quality</strong> of menu items<br />
purchased at the restaurants in our<br />
analysis<br />
Finally, we used NPD’s data on menu importance by <strong>food</strong> type<br />
to analyze the <strong>nutritional</strong> <strong>quality</strong> of the <strong>food</strong>s ordered by various<br />
demographic groups at each restaurant in our analysis. NPD<br />
provided a list of the specific menu items ordered by more<br />
than 25 individuals at each restaurant for each <strong>food</strong> type from<br />
January 2008 through December 2009. We then matched<br />
these menu items to the menu composition analysis for each<br />
restaurant to obtain their nutrient information. For <strong>food</strong> types<br />
that included more than one menu item at a restaurant, we<br />
calculated median calories, saturated fat, sugar, sodium,<br />
protein, fiber, <strong>and</strong> NPI score for each restaurant <strong>and</strong> <strong>food</strong> type.<br />
We then multiplied these medians by menu importance for<br />
each <strong>food</strong> type, divided by 100, <strong>and</strong> added the resulting<br />
numbers to obtain a weighted average total content of each<br />
of these nutrients for <strong>food</strong>s purchased during fast <strong>food</strong> visits.<br />
We calculated these numbers by restaurant for the following<br />
demographic groups: preschool-age children (under 6 years),<br />
children (6-12 years), teens (13-17 years), young adults<br />
(18-24 years), adults (25-49 years), <strong>and</strong> white youth (2-17<br />
years), African American youth, <strong>and</strong> Hispanic youth. For the<br />
children’s age groups (under 6 <strong>and</strong> 6-12 years) we provide<br />
a “best case” version of the nutrition of <strong>food</strong>s consumed by<br />
using the nutrition information for <strong>food</strong>s on the children’s menu<br />
whenever they were available.<br />
<strong>Fast</strong> <strong>Food</strong> <strong>FACTS</strong> 35