What are herd bulls accomplishing in multiple sire breeding pastures?
What are herd bulls accomplishing in multiple sire breeding pastures?
What are herd bulls accomplishing in multiple sire breeding pastures?

Create successful ePaper yourself
Turn your PDF publications into a flip-book with our unique Google optimized e-Paper software.
<strong>What</strong> <strong>are</strong> <strong>herd</strong> <strong>bulls</strong><br />
<strong>accomplish<strong>in</strong>g</strong> <strong>in</strong> <strong>multiple</strong><br />
<strong>sire</strong> breed<strong>in</strong>g <strong>pastures</strong>?<br />
D. J. Drake, UCCE Livestock Farm Advisor<br />
.<br />
K. L. Weber, Ph.D. graduate student<br />
Alison Van Eenennaam<br />
Animal Genomics and Biotechnology<br />
Cooperative Extension Specialist<br />
Department of Animal Science<br />
University of California, Davis, CA<br />
Ph: (530) 752-7942<br />
alvaneenennaam@ucdavis.edu<br />
animalscience.ucdavis.edu/animalbiotech<br />
Van Eenennaam Alturas 2/2012<br />
Animal Genomics and Biotechnology Education
Outl<strong>in</strong>e<br />
● Overview of CA Commercial Ranch Project<br />
● Herd bull performance and calf output<br />
● Model<strong>in</strong>g the value of this <strong>in</strong>formation<br />
Van Eenennaam Alturas 2/2012 Animal Biotechnology and Genomics Education
Commercial<br />
Angus <strong>bulls</strong><br />
Van Eenennaam Alturas 2/2012<br />
California Commercial<br />
Data collection:<br />
AAA EPD & pedigree<br />
Sample collection:<br />
For genotyp<strong>in</strong>g<br />
MBV<br />
Meat Animal<br />
Research<br />
Center<br />
2400 cows/<br />
year<br />
Ranch Project<br />
Progeny<br />
Ranch and<br />
harvest data<br />
Collection<br />
Genotyp<strong>in</strong>g<br />
Paternity<br />
Determ<strong>in</strong>ation<br />
Assessment of DNA-enabled approaches<br />
for predict<strong>in</strong>g the genetic merit of <strong>herd</strong><br />
<strong>sire</strong>s on commercial beef ranches<br />
Four ranches:<br />
• Cowley (900 cows)<br />
• Kuck (500 cows)<br />
• Mole-Richardson (700 cows)<br />
• UC Davis (300 cows)<br />
Approximately 100 Angus<br />
<strong>bulls</strong>, and 2,400 cows per<br />
year on project<br />
Animal Genomics and Biotechnology Education
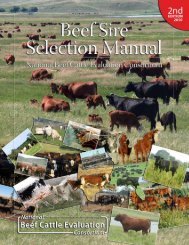
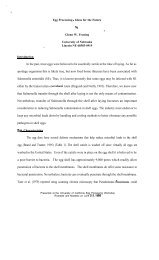
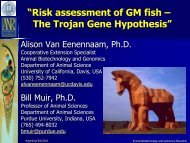
<strong>What</strong> does a California Commercial<br />
Ranch collaborator look like?<br />
Photo taken <strong>in</strong> 1949 at Red Bluff Bull Sale, CA<br />
Generously provided by Cathy Maas from Crowe<br />
Hereford Ranch, Millville, CA.<br />
Van Eenennaam Alturas 2/2012 Animal Genomics and Biotechnology Education
~20 <strong>bulls</strong>/season<br />
Cowley Ranch
~10 <strong>bulls</strong>/season<br />
Kuck Ranch
Mole-Richardson Farms<br />
~30 <strong>bulls</strong>
You choose the bull for the<br />
follow<strong>in</strong>g ranch environment<br />
Predom<strong>in</strong>antly Angus cows<br />
Multi-bull breed<strong>in</strong>g pasture<br />
All <strong>bulls</strong> appe<strong>are</strong>d sound and passed BSE<br />
All <strong>bulls</strong> had acceptable semen quality<br />
Approximately 25:1 cow to bull ratio<br />
Fenced relatively flat breed<strong>in</strong>g <strong>pastures</strong><br />
Calves sold shortly after wean<strong>in</strong>g<br />
Van Eenennaam Alturas 2/2012 Animal Genomics and Biotechnology Education
Here <strong>are</strong> your choices<br />
No. Bull Id & Breed Age CED EPD CED ACC<br />
WN WT<br />
EPD<br />
WN WT<br />
ACC<br />
Sire<br />
1 7183 HH 3.4 0.9 0.12 51.5 0.29 Go Excel<br />
2 2523 AN 4.4 11 0.3 43.0 0.27 New Frontier<br />
3 5374 AN 4.3 8 0.05 37.0 0.05 Integrity<br />
4 8557 AN 4.3 1 0.29 39.0 0.26 Bushwacker<br />
5 9958 AN 2.4 12 0.31 40.0 0.26 Premium Beef<br />
6 9956 AN 2.4 12 0.31 41.0 0.27 Premium Beef<br />
7 9511 AN 3.4 6 0.29 53.0 0.26 Mytty In Focus<br />
8 8219 AN 2.8 5 0.3 40.0 0.27 Premium Beef<br />
9 0442 AN 1.9 6 0.29 41.0 0.27 New Design<br />
10 4594 AN 2.4 7 0.29 45.0 0.28 Mytty In Focus<br />
11 3954 AN 3.3 9 0.24 35.0 0.26 Broadcast<br />
12 7166 HH 3.4 -1.5 0.11 45.5 0.32 Go Excel<br />
13 4677 AN 2.4 8 0.29 35.0 0.27 Total<br />
14 4935 SD 4.3 55.8 0.51 Rider's Dream<br />
15 8553 AN 4.3 0 0.3 44.0 0.27 Bushwacker<br />
16 2694 AN 4.3 6 0.05 45.0 0.05 Dest<strong>in</strong>ation<br />
17 0240 SDX 4.3<br />
18 0239 SDX 4.3<br />
19 2553 AN 4.4 11 0.3 38.0 0.27 New Frontier<br />
20 2695 AN 4.3 6 0.05 45.0 0.05 Dest<strong>in</strong>ation<br />
* EPDs adjusted to Angus for non-Angus <strong>bulls</strong><br />
Van Eenennaam Alturas 2/2012 Animal Genomics and Biotechnology Education
Wean<strong>in</strong>g weight EPDs (---)<br />
Wean wt EPD adjusted to Angus<br />
for non Angus<br />
60<br />
50<br />
40<br />
30<br />
20<br />
10<br />
0<br />
Wean Wt EPD
Actual 205 day weight<br />
performance of calves (---)<br />
Wean wt EPD adjusted to Angus<br />
for non Angus<br />
60<br />
50<br />
40<br />
30<br />
20<br />
10<br />
0<br />
7183 HH<br />
2523 AN<br />
5374 AN<br />
8557 AN<br />
9958 AN<br />
9956 AN<br />
9511 AN<br />
8219 AN<br />
0442 AN<br />
4594 AN<br />
3954 AN<br />
7166 HH<br />
4677 AN<br />
4935 SD<br />
8553 AN<br />
2694 AN<br />
0240 SDX<br />
0239 SDX<br />
2553 AN<br />
2695 AN<br />
80<br />
60<br />
40<br />
20<br />
0<br />
-20<br />
-40<br />
Difference from average actual<br />
205d wean<strong>in</strong>g weight
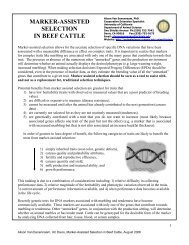
Average number of calves<br />
born per breed<strong>in</strong>g season<br />
Average number of calves born <strong>in</strong> a<br />
breed<strong>in</strong>g season<br />
45<br />
40<br />
35<br />
30<br />
25<br />
20<br />
15<br />
10<br />
5<br />
0<br />
7183 HH<br />
2523 AN<br />
5374 AN<br />
8557 AN<br />
9958 AN<br />
9956 AN<br />
9511 AN<br />
8219 AN<br />
0442 AN<br />
4594 AN<br />
3954 AN<br />
Number of calves Difference <strong>in</strong> 205d wean wt<br />
7166 HH<br />
4677 AN<br />
4935 SD<br />
8553 AN<br />
2694 AN<br />
0240 SDX<br />
0239 SDX<br />
2553 AN<br />
2695 AN<br />
80<br />
60<br />
40<br />
20<br />
0<br />
-20<br />
-40<br />
Difference from average actual 205d<br />
wean<strong>in</strong>g weight
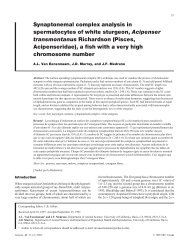
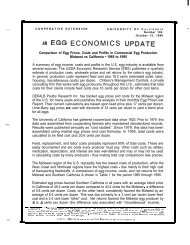
Total 205d wean<strong>in</strong>g weight, no. of<br />
calves, and difference from 205d<br />
wean<strong>in</strong>g weight mean (Figure 2)<br />
Total 205d wean<strong>in</strong>g weight, lbs.<br />
22000<br />
17000<br />
12000<br />
7000<br />
2000<br />
-3000<br />
7183 HH<br />
2523 AN<br />
5374 AN<br />
8557 AN<br />
9958 AN<br />
9956 AN<br />
9511 AN<br />
8219 AN<br />
0442 AN<br />
4594 AN<br />
3954 AN<br />
D Drake, K. Weber and A. Van Eenennaam<br />
Total wean wt Number of calves Difference <strong>in</strong> wean wt<br />
7166 HH<br />
4677 AN<br />
4935 SD<br />
8553 AN<br />
2694 AN<br />
0240 SDX<br />
0239 SDX<br />
2553 AN<br />
2695 AN<br />
60<br />
50<br />
40<br />
30<br />
20<br />
10<br />
0<br />
-10<br />
-20<br />
-30<br />
-40<br />
Number of calves or difference <strong>in</strong> wean wt
Total 205d wean<strong>in</strong>g weight, number of calves, and<br />
difference from 205d wean<strong>in</strong>g weight mean (Figure 3)<br />
RA<br />
RA<br />
Van Eenennaam Alturas 2/2012 Animal Genomics and Biotechnology Education<br />
HH<br />
RA
Table 1. Average bull age at the beg<strong>in</strong>n<strong>in</strong>g of the<br />
breed<strong>in</strong>g season, and number of calves produced<br />
per bull that <strong>sire</strong>d at least one calf on 3 commercial<br />
ranches <strong>in</strong> Northern California <strong>in</strong> 2009 and 2010.<br />
# of<br />
<strong>sire</strong>s<br />
Bull Age Mean<br />
bull<br />
age<br />
Total #<br />
of<br />
calves<br />
Number of<br />
calves per<br />
bull<br />
Ranch Year Season M<strong>in</strong> Max M<strong>in</strong> Max<br />
Aver #<br />
of calves<br />
per<br />
bull/season<br />
1 2009 Spr<strong>in</strong>g 13 1.5 3.1 2.5 ± 0.6 246 6 40 18.9 ± 12.5<br />
1 2009 Fall 19 1.6 3.8 2.9 ± 0.9 345 1 47 18.2 ± 13.9<br />
1 2010 Spr<strong>in</strong>g 19 2.1 5.2 3.4 ± 0.9 366 5 36 19.3 ± 10.7<br />
2 2009 Spr<strong>in</strong>g 8 0.7 9.2 3.5 ± 2.7 139 1 44 17.4 ± 16.6<br />
2 2009 Fall 9 1.4 8.8 4.4 ± 2.2 196 10 48 21.8 ± 11.4<br />
2 2010 Spr<strong>in</strong>g 8 1.7 5.3 2.9 ± 1.2 129 3 28 16.1 ± 9.1<br />
3 2009 Fall 30 1.6 5.6 3.3 ± 10 639 2 54 21.3 ± 13.8<br />
3 2010 Fall 27 1.6 5.2 3.7 ± 1.3 568 1 52 21.0 ± 13.1<br />
3.3 2628 19 ± 2<br />
Additionally, 7.3% <strong>sire</strong>s failed completely (i.e. no calves<br />
<strong>sire</strong>d) <strong>in</strong> any given breed<strong>in</strong>g season.<br />
Van Eenennaam Alturas 2/2012 Animal Genomics and Biotechnology Education
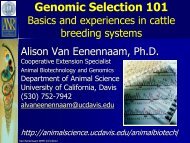
No obvious phenotype associated<br />
Van Eenennaam Alturas 2/2012<br />
with the <strong>bulls</strong> that <strong>sire</strong>d no<br />
offspr<strong>in</strong>g<br />
Animal Genomics and Biotechnology Education
# of calves born/bull – Fall 2009 calv<strong>in</strong>g<br />
Van Eenennaam Alturas 2/2012<br />
Ranch 1 s<strong>in</strong>gle season calf output per bull<br />
2 8 4 5 13 7 6 14 20 19<br />
Animal Genomics and Biotechnology Education
Calf output was moderately repeatable,<br />
and correlated with Scrotal<br />
Circumference EPD<br />
Us<strong>in</strong>g the 20 <strong>bulls</strong> that were <strong>in</strong> use for 2 or 3 breed<strong>in</strong>g seasons<br />
(Figure 2), on Ranch 1 and 2 calculated the repeatability of 5<br />
traits between their 1 st and 2 nd breed<strong>in</strong>g season.<br />
Repeatability<br />
• total adjusted wean<strong>in</strong>g weight r=0.50<br />
• number of calves r=0.50<br />
• mean adjusted wean<strong>in</strong>g weight=0.675<br />
Also analyzed calf output repeatability between the same <strong>bulls</strong> from the<br />
s<strong>in</strong>gle Fall calv<strong>in</strong>g group on Ranch 3 <strong>in</strong> years 1 and 2 (Figure 3).<br />
Repeatability<br />
• number of calves r=0.33<br />
Sire output as total adjusted wean<strong>in</strong>g weight and number of calves were not<br />
well correlated to Angus Association growth EPDs but had moderate<br />
correlation to scrotal circumference EPDs (r=0.42 & 0.38; n=5), respectively.<br />
Van Eenennaam Alturas 2/2012 Animal Genomics and Biotechnology Education
BUT DOES IT PAY?
Modeled the sav<strong>in</strong>gs from us<strong>in</strong>g DNA<br />
<strong>in</strong>formation to cull non-prolific <strong>bulls</strong><br />
Assumptions<br />
Bulls used for 4 years (bought at 18 months of age, used until culled for<br />
age at 5 ½ years old)<br />
Average prolificacy of <strong>bulls</strong> which do produce calves: 20 ± 2 calves/bull<br />
(i.e. average prolificacy across the battery is 18.6 calves/bull)<br />
Percent of <strong>bulls</strong> which produced no calves: 7%<br />
1 breed<strong>in</strong>g season per year<br />
Bull premature death rate: 1%<br />
Bull <strong>in</strong>jury rate: 3%<br />
Average age at <strong>in</strong>jury: 4 years<br />
Annual vet costs: $75/year, $25 if bull died prematurely mid-year<br />
Salvage value<br />
– Non-<strong>in</strong>jured $2000<br />
– Injured $1000<br />
Cost of truck<strong>in</strong>g bull to sale: $50<br />
Sell<strong>in</strong>g commission: $20<br />
Van Eenennaam Alturas 2/2012 Animal Genomics and Biotechnology Education
<strong>What</strong> was modeled?<br />
Paternity test<br />
– Performed once on the entire bull battery<br />
(all <strong>bulls</strong> and calves tested)<br />
– Paternity test price (/head): $10, $15, or $20<br />
– Bulls <strong>are</strong> not replaced if they <strong>are</strong> culled for poor<br />
prolificacy<br />
Bull Purchase price: $3500, $4500, or $5500<br />
Annual feed costs per bull: $425, $525, or $625<br />
Bulls <strong>sire</strong>d an average of 20 calves per year<br />
Van Eenennaam Alturas 2/2012 Animal Genomics and Biotechnology Education
Bull costs<br />
In a <strong>herd</strong> with 7% of<br />
<strong>bulls</strong> consistently<br />
produc<strong>in</strong>g no calves<br />
and the rest of the<br />
<strong>bulls</strong> produc<strong>in</strong>g 20<br />
calves/calf crop on<br />
average:<br />
The average bull will<br />
be used 3.94 years<br />
(3 years, 11 months)<br />
and produce a total<br />
of 73 calves over his<br />
productive life.<br />
Bull<br />
Purchase<br />
Price<br />
Annual<br />
Feed<br />
Costs/<br />
Bull<br />
Average<br />
Lifetime<br />
Bull Costs<br />
(Total)<br />
$3500 $425 $3,583.18 $48.96<br />
$3500 $525 $3,976.71 $54.33<br />
$3500 $625 $4,370.25 $59.71<br />
$4500 $425 $4,583.18 $62.62<br />
$4500 $525 $4,976.71 $68.00<br />
$4500 $625 $5,370.25 $73.37<br />
$5500 $425 $5,583.18 $76.28<br />
$5500 $525 $5,976.71 $81.66<br />
$5500 $625 $6,370.25 $87.04<br />
Average<br />
Lifetime Bull<br />
Costs/ Calf<br />
Produced<br />
Van Eenennaam Alturas 2/2012 Animal Genomics and Biotechnology Education
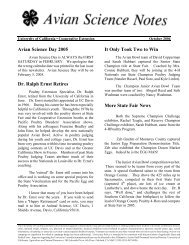
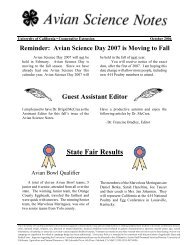
Additional cost of paternity<br />
test<strong>in</strong>g<br />
• In a <strong>herd</strong> with<br />
– 7% of <strong>bulls</strong> consistently produc<strong>in</strong>g no calves<br />
– The rest of the <strong>bulls</strong> produc<strong>in</strong>g 20 calves/calf crop on average<br />
– Purchase price $3500 - Average annual feed costs $425<br />
Whole Battery,<br />
$20/head<br />
Whole Battery,<br />
$15/head<br />
Whole Battery,<br />
$10/head<br />
Additional cost of paternity<br />
test<strong>in</strong>g/calf produced<br />
$25<br />
$20<br />
$15<br />
$10<br />
$5<br />
$0<br />
0% 5% 10% 15% 20% 25%<br />
Cull rate on group tested<br />
For cull rates<br />
up to 25%<br />
(1 <strong>in</strong> 4 <strong>bulls</strong><br />
tested) and<br />
paternity tests<br />
cost<strong>in</strong>g $10-<br />
$20/head, the<br />
cost of test<strong>in</strong>g<br />
is always<br />
greater than<br />
the $ saved by<br />
cull<strong>in</strong>g low<br />
prolificacy <strong>bulls</strong><br />
Van Eenennaam Alturas 2/2012 Animal Genomics and Biotechnology Education
<strong>What</strong> does it take to make<br />
Assumptions:<br />
Annual Feed<br />
Costs/Bull<br />
paternity test<strong>in</strong>g pay?<br />
– 7% of zero prolificacy <strong>bulls</strong><br />
– Other <strong>bulls</strong> produc<strong>in</strong>g 20<br />
calves/calf crop on average<br />
– Purchase price $4500<br />
– Paternity test price $15/head<br />
– Test<strong>in</strong>g the whole battery<br />
and all calves once<br />
Cull rate to<br />
reach breakeven<br />
$425 87.5%<br />
$525 77.0%<br />
$625 68.8%<br />
$825 55.6%<br />
<strong>What</strong> paternity test price would it<br />
take to reach break-even at 7%<br />
and 25% cull rates?<br />
Cull Rate Annual<br />
Feed<br />
Costs/Bull<br />
Paternity<br />
Test<br />
Cost/head<br />
7% $425 $0.76<br />
$525 $0.89<br />
$625 $1.01<br />
$825 $1.28<br />
25% $425 $4.05<br />
$525 $4.62<br />
$625 $5.18<br />
$825 $6.32<br />
Van Eenennaam Alturas 2/2012 Animal Genomics and Biotechnology Education
There <strong>are</strong> other advantages of<br />
DNA-based paternity test<strong>in</strong>g<br />
The use of multi-<strong>sire</strong> breed<strong>in</strong>g pasture is desirable<br />
because:<br />
– Higher fertility<br />
– Elim<strong>in</strong>ation of <strong>sire</strong> failure<br />
– Tighter calv<strong>in</strong>g season<br />
Reduces the need for different breed<strong>in</strong>g <strong>pastures</strong><br />
– Allows for better pasture management<br />
– Less sort<strong>in</strong>g and work<strong>in</strong>g of animals <strong>in</strong>to different groups<br />
DNA test<strong>in</strong>g enables<br />
Can use it determ<strong>in</strong>e which bull is caus<strong>in</strong>g calv<strong>in</strong>g problems<br />
Enables the development of commercial-ranch genetic<br />
evaluations<br />
Van Eenennaam Alturas 2/2012 Animal Genomics and Biotechnology Education
Summary and some learn<strong>in</strong>gs<br />
along the way<br />
1. Bulls produced average of 19 calves (large variation)<br />
• Calf output was moderately repeatable (~0.33-0.5)<br />
• Prolific <strong>bulls</strong> tended to rema<strong>in</strong> prolific, low tended to stay low<br />
2. 7% of <strong>bulls</strong> had no calves – 1 <strong>in</strong> 14<br />
3. Do not use yearl<strong>in</strong>g <strong>bulls</strong> <strong>in</strong> with older <strong>bulls</strong> - older<br />
<strong>bulls</strong> will be dom<strong>in</strong>ant and chance of <strong>in</strong>jury goes up<br />
4. Heifer <strong>bulls</strong> (low CED) often ended up as mature cow<br />
<strong>bulls</strong> despite hav<strong>in</strong>g been selected on CED!!<br />
5. There <strong>are</strong> few EPDs for selection on reproduction<br />
6. Crossbreed<strong>in</strong>g still works! And would be expected to<br />
improve reproduction traits also<br />
7. Paternity test<strong>in</strong>g on commercial ranches for <strong>sire</strong><br />
failure needs to be <strong>in</strong>expensive to be cost-effective<br />
Van Eenennaam Alturas 2/2012 Animal Genomics and Biotechnology Education
USDA Integrated Grant Collaborators<br />
“Integrat<strong>in</strong>g DNA <strong>in</strong>formation <strong>in</strong>to<br />
Beef Cattle Production Systems”<br />
Producer Collaborators:<br />
Jack Cowley, Cowley Rancher, Siskiyou County, CA<br />
Dale, Greg, and Richard Kuck, Kuck Ranch, Siskiyou County, CA<br />
Matt Parker, Mole-Richardson Ranch, Siskiyou County, CA<br />
Processor Collaborators:<br />
Harris Ranch Beef Company, Coal<strong>in</strong>ga, CA<br />
Los Banos Abattoir, Los Banos, CA<br />
Graduate Students<br />
Krist<strong>in</strong>a Weber, Ph.D. Candidate, UC Davis, CA<br />
Other Contributors/Collaborators<br />
Dr. Jerry Taylor, University of Missouri, MO<br />
Dr. Mike Goddard, University of Melbourne and Victorian DPI, Australia<br />
Dr. Darrh Bullock, Extension Professor, University of Kentucky, KY<br />
Dr. Leslie “Bees” Butler, Extension Market<strong>in</strong>g Specialist, UC Davis, CA<br />
Dr. Daniel Drake, University of California Cooperative Extension Livestock Advisor, CA<br />
Dr. Dorian Garrick, Professor, Iowa State University, IA<br />
Dr. John Pollak, US Meat Animal Research Center, Clay Center, NE<br />
Dr. Mark Thallman, US Meat Animal Research Center, Clay Center, NE<br />
Softw<strong>are</strong> Collaborators:<br />
Jim Lowe, Cow Sense Herd Management Softw<strong>are</strong>, NE<br />
Van Eenennaam Alturas 2/2012 Animal Genomics and Biotechnology Education
Questions?<br />
“This project is supported by National Research Initiative Grant no. 2009-55205-<br />
05057 to AVE from the USDA National Institute of Food and Agriculture.”<br />
Van Eenennaam Alturas 2/2012 Animal Genomics and Biotechnology Education
Integrated Program for Reduc<strong>in</strong>g<br />
Bov<strong>in</strong>e Respiratory Disease <strong>in</strong><br />
Beef and Dairy Cattle<br />
Alison Van Eenennaam, Ph.D.<br />
Cooperative Extension Specialist<br />
Animal Biotechnology and Genomics<br />
Department of Animal Science<br />
University of California, Davis<br />
alvaneenennaam@ucdavis.edu<br />
US Bov<strong>in</strong>e Respiratory Disease<br />
Coord<strong>in</strong>ated Agricultural Project<br />
http://www.brdcomplex.org<br />
The “Integrated Program for Reduc<strong>in</strong>g Bov<strong>in</strong>e Respiratory Disease Complex<br />
(BRDC) <strong>in</strong> Beef and Dairy Cattle” Coord<strong>in</strong>ated Agricultural Project is<br />
supported by Agriculture and Food Research Initiative Competitive Grant no.<br />
2011-68004-30367 from the USDA National Institute of Food and Agriculture.<br />
Van Eenennaam Alturas 2/2012<br />
Animal Genomics and Biotechnology Education
Background and<br />
Rationale<br />
“Year <strong>in</strong> and year out, diseases of the respiratory system <strong>are</strong><br />
a major cause of illness and death <strong>in</strong> cattle from 6 weeks to<br />
two years of age. Sadly, this is as true today as it was 30<br />
years ago despite development of new and improved<br />
vacc<strong>in</strong>es, new broad spectrum antibiotics, and <strong>in</strong>creased<br />
fundamental knowledge as to the cause of disease ”<br />
Bov<strong>in</strong>e Respiratory Disease (BRD) has been extensively<br />
studied s<strong>in</strong>ce the 1800s, and yet it rema<strong>in</strong>s prevalent<br />
More effective vacc<strong>in</strong>es have not decreased the morbidity or<br />
mortality of BRD<br />
Mortality has <strong>in</strong>creased as vacc<strong>in</strong>e efficiency has <strong>in</strong>creased<br />
1.4% of all US feedlot cattle perish before reach<strong>in</strong>g harvest<br />
weight<br />
Need to develop new approaches to tackle BRD<br />
Montgomery, D. 2009. Bov<strong>in</strong>e Respiratory Disease & Diagnostic Veter<strong>in</strong>ary Medic<strong>in</strong>e. Proceed<strong>in</strong>gs, The<br />
Range Beef Cow Symposium XXI. December 1, 2 and 3 2009, Casper, WY. Pages 1-6.<br />
Van Eenennaam Alturas 2/2012
Long-term goal is to reduce the<br />
<strong>in</strong>cidence of BRD <strong>in</strong> beef and<br />
dairy cattle by capitaliz<strong>in</strong>g on<br />
recent advances <strong>in</strong> genomics to<br />
enable novel genetic approaches<br />
to select for cattle that <strong>are</strong> less<br />
susceptible to disease<br />
Van Eenennaam Alturas 2/2012<br />
BRD Coord<strong>in</strong>ated<br />
Agricultural Project
Are difficult or<br />
expensive to measure<br />
Cannot be measured<br />
until late <strong>in</strong> life or after<br />
the animal is dead<br />
Are not currently<br />
selected for because<br />
they <strong>are</strong> not rout<strong>in</strong>ely<br />
measured<br />
Have low heritability<br />
Van Eenennaam Alturas 2/2012<br />
Potential benefits of<br />
genomics <strong>are</strong> greatest for<br />
economically-important<br />
traits that:<br />
Yep, looks like<br />
all of ‘em were<br />
susceptible<br />
Animal Genomics and Biotechnology Education
Disease resistance is a very<br />
attractive target trait for<br />
genetic improvement<br />
The presence of genetic variation <strong>in</strong> resistance<br />
to disease, coupled with the <strong>in</strong>creased consumer<br />
pressure aga<strong>in</strong>st the use of drugs, is mak<strong>in</strong>g<br />
genetic solutions to animal health problems<br />
<strong>in</strong>creas<strong>in</strong>gly attractive.<br />
The non-permanent effectiveness of chemical<br />
agent (due to development of resistance by the<br />
pathogen) further contributes to this <strong>in</strong>terest.<br />
Newman, S. and Ponzoni, R.W. 1994. Experience with economic weights. Proc. 5 th<br />
World Congress on Genetics Applied to Livestock Production. 18:217-223.<br />
Van Eenennaam Alturas 2/2012
Other animal <strong>in</strong>dustries<br />
have successfully<br />
targeted selection for<br />
disease resistance<br />
In dairy cattle, selection programs have been<br />
developed to take advantage of genetic variability <strong>in</strong><br />
mastitis resistance, despite the fact that the<br />
heritability of cl<strong>in</strong>ical mastitis is low and mastitis<br />
resistance has an adverse correlation with<br />
production traits<br />
Likewise chicken breeders have long used breed<strong>in</strong>g<br />
to improve resistance to avian lymphoid leucosis<br />
complex and M<strong>are</strong>k’s disease<br />
Stear, M. J., S. C. Bishop, B. A. Mallard, and H. Raadsma. 2001. The susta<strong>in</strong>ability, feasibility<br />
and desirability of breed<strong>in</strong>g livestock for disease resistance. Res Vet Sci 71: 1-7<br />
Van Eenennaam Alturas 2/2012
Need for large<br />
discovery populations<br />
The ready availability of dense s<strong>in</strong>gle nucleotide<br />
polymorphism arrays (i.e. 700 K SNP chips) has given<br />
rise to hitherto unforeseen opportunities to dissect host<br />
variation and identify possible genes contribut<strong>in</strong>g to this<br />
variation us<strong>in</strong>g genome wide association studies<br />
To have the power to mean<strong>in</strong>gfully quantify genetic<br />
variation or perform a genome scan us<strong>in</strong>g a dense SNP<br />
chip it is necessary to have datasets compris<strong>in</strong>g<br />
observations on several thousands of <strong>in</strong>dividuals.<br />
Bishop, S. C., and J. A. Woolliams. 2010. On the genetic <strong>in</strong>terpretation of disease data. Plos<br />
One 5: e8940.<br />
Van Eenennaam Alturas 2/2012
<strong>What</strong> is needed to<br />
develop DNA-tests for<br />
BRD susceptibility?<br />
Large tra<strong>in</strong><strong>in</strong>g/discovery populations with BRD<br />
observations and SNP genotypes = used to<br />
estimate the value of every chromosome fragment<br />
contribut<strong>in</strong>g variation BRD susceptibility. This<br />
allows for prediction of which chromosome<br />
segments regions <strong>are</strong> important for the trait.<br />
Prediction equation = the results of tra<strong>in</strong><strong>in</strong>g can<br />
then be used to predict the genetic merit of new<br />
animals, not conta<strong>in</strong>ed <strong>in</strong> the tra<strong>in</strong><strong>in</strong>g data set<br />
Van Eenennaam Alturas 2/2012
Need for c<strong>are</strong>ful<br />
“case” def<strong>in</strong>ition<br />
For studies of <strong>in</strong>fectious diseases this usually<br />
necessitates utiliz<strong>in</strong>g field data because challenge<br />
experiments of a sufficient scale will not be possible.<br />
However, such field data is very ‘noisy’<br />
– diagnosis of <strong>in</strong>fection or disease may be imprecise; it can be<br />
difficult to determ<strong>in</strong>e when <strong>in</strong>fection of an <strong>in</strong>dividual occurred<br />
– it is often unclear whether or not app<strong>are</strong>ntly healthy <strong>in</strong>dividuals<br />
have been exposed to the <strong>in</strong>fection<br />
These factors add environmental noise to the<br />
epidemiological data.<br />
Bishop, S. C., and J. A. Woolliams. 2010. On the genetic <strong>in</strong>terpretation of disease data. Plos<br />
One 5: e8940.
Accurate diagnosis<br />
(i.e. case def<strong>in</strong>ition)<br />
of BRD is critical for<br />
success of studies<br />
Traditional methods for detect<strong>in</strong>g morbid cattle <strong>in</strong>clude visual<br />
appraisal once or twice daily.<br />
Animals display<strong>in</strong>g nose or eye discharge, depression,<br />
lethargy, emaciated body condition, labored breath<strong>in</strong>g or a<br />
comb<strong>in</strong>ation of these, should be further exam<strong>in</strong>ed<br />
Symptomatic animals with a rectal temperature ≥ 103°F <strong>are</strong><br />
usually considered morbid and given treatment.<br />
All of these diagnostic systems <strong>are</strong> subjective <strong>in</strong> nature.<br />
Confound<strong>in</strong>g factors <strong>in</strong>clude the diligence and astuteness of<br />
those check<strong>in</strong>g the animals, the variability and severity of the<br />
symptoms the animals experience with chronic and acute<br />
BRD, and the disposition of the animals<br />
Van Eenennaam Alturas 2/2012
BRD CAP: BRD<br />
field datasets<br />
Case:control field datasets <strong>are</strong> be<strong>in</strong>g<br />
developed for bov<strong>in</strong>e respiratory disease<br />
– 6000 animals – case:control design<br />
2000 dairy calves diagnosed on a collaborat<strong>in</strong>g dairy calf rear<strong>in</strong>g<br />
ranch (CA)<br />
2000 feedlot cattle diagnosed on a collaborat<strong>in</strong>g feedlot (TX)<br />
1000 dairy (NM) and 1000 beef (NV) case:control animals will be<br />
used to validate loci associated with BRD <strong>in</strong> the discovery<br />
populations<br />
– All will be genotyped on 700K high density SNP chip<br />
Van Eenennaam Alturas 2/2012
Van Eenennaam Alturas 2/2012<br />
Year 1: CA Dairy Calf<br />
Ranch: 70,000 head<br />
capacity<br />
Photo credit: Jessica Davis<br />
Jessica Davis, DVM<br />
Intern at Veter<strong>in</strong>ary Medic<strong>in</strong>e<br />
Teach<strong>in</strong>g and Research<br />
Center, University of<br />
California, Davis; Tul<strong>are</strong><br />
Terry Lehenbauer, DVM<br />
Sharif Aly, DVM<br />
Pat Blanchard, DVM<br />
California Animal Health and<br />
Food Safety Laboratory System
Standardization<br />
of BRD Diagnosis<br />
1000 case and 1000 control 30-60 day old calves<br />
Use Dr. Sheila McGuirk’s calf respiratory scor<strong>in</strong>g chart<br />
– Temperature, eyes, ears, nose, +/- cough<br />
– Additional cl<strong>in</strong>ical signs: tachypnea, dyspnea, position of head,<br />
appetite<br />
– Give score and either enroll or not (5 or greater to enroll as case)<br />
Sample collection<br />
– Blood for DNA extraction and high density SNP genotyp<strong>in</strong>g<br />
– Nasal swab and deep pharyngeal swab to identify viruses (PCR:<br />
IBR, BVD, BRSV, and Corona) and bacteria (Manheimia<br />
haemolytica, Pasteurella multocida, and Histophilus somni, and<br />
Mycoplasma spp.) present <strong>in</strong> the nasopharyngeal and pharyngeal<br />
recesses<br />
Van Eenennaam Alturas 2/2012
Van Eenennaam Alturas 2/2012<br />
http://www.vetmed.wisc.edu/dms/fapm/fapmto<br />
ols/8calf/calf_health_scor<strong>in</strong>g_chart.pdf
Blood collection<br />
Nasal swab<br />
Van Eenennaam Alturas 2/2012<br />
Photo credit: Jessica Davis<br />
Deep<br />
pharyngeal<br />
swab<br />
collection
Sampl<strong>in</strong>g location of deep<br />
pharyngeal swab<br />
To culture organisms associated with BRD, pharyngeal<br />
swabs offer a less <strong>in</strong>vasive, less stressful and more rapid<br />
alternative to broncheoalveolor lavage.<br />
Van Eenennaam Alturas 2/2012<br />
Photo credit: Jessica Davis
Controls<br />
Score control <strong>in</strong> same way as cases (score of 4 or less)<br />
Try to select animals <strong>in</strong> the adjacent hutch, same dairy<br />
of orig<strong>in</strong>, and same sex<br />
Collect samples for control animals <strong>in</strong> same was as case<br />
Objective: Try to identify cases and<br />
controls <strong>in</strong> a relatively constant environment,<br />
subjected to the same exposure and<br />
stresses, to decrease the environmental<br />
“noise” of these field BRD datasets<br />
Van Eenennaam Alturas 2/2012
Year 2: TX Feedlot<br />
Gonzalez, Texas<br />
Sample collection (1000 case and 1000 controls)<br />
scheduled to be completed by 3/2013 and analysis of<br />
genotype data completed by 12/31/2014<br />
Van Eenennaam Alturas 2/2012<br />
Cole McQueen, Masters student<br />
Dr. Noah Cohen<br />
Dr. Scott D<strong>in</strong>dot<br />
Texas A&M University
• Jim Womack, PD<br />
• Alan Dabney<br />
• Scott D<strong>in</strong>dot<br />
• Noah Cohen<br />
• Laurel Gershw<strong>in</strong><br />
• Terry Lehenbauer<br />
• Cassandra Tucker<br />
• Alison Van Eenennaam<br />
• Mark Enns<br />
Van Eenennaam Alturas 2/2012<br />
BRD Coord<strong>in</strong>ated<br />
Agricultural Project<br />
• Chris Seabury<br />
• Lawrence Falconer<br />
• Lauren Skow<br />
• Gary Snowder<br />
• Jerry Taylor<br />
Fund<strong>in</strong>g for this project is provided<br />
by the National Institute of Food and<br />
Agriculture<br />
• Mike MacNeil<br />
• Curt Van Tassell<br />
• Holly Neibergs<br />
• Shannon Neibergs<br />
• Milt Thomas<br />
• Robert Hagevoort<br />
• Tim Ross<br />
OTHER COLLABORATORS<br />
• Daniel Pomp (NC)<br />
• Shiela McGuirk (WI)<br />
• Adroaldo Zanella (Norway)
BRD Coord<strong>in</strong>ated<br />
Agricultural Project
www.brdcomplex.org<br />
The “Integrated Program for Reduc<strong>in</strong>g Bov<strong>in</strong>e Respiratory Disease Complex (BRDC)<br />
<strong>in</strong> Beef and Dairy Cattle” Coord<strong>in</strong>ated Agricultural Project is supported by Agriculture<br />
and Food Research Initiative Competitive Grant no. 2011-68004-30367 and the DNA<br />
value determ<strong>in</strong>ation project was supported by National Research Initiative<br />
competitive grant no. 2009-55205-05057 (“Integrat<strong>in</strong>g DNA <strong>in</strong>formation <strong>in</strong>to beef<br />
cattle production systems”) from the USDA National Institute of Food and Agriculture.
www.brdcomplex.org