Statistical inference for exploratory data analysis ... - Hadley Wickham
Statistical inference for exploratory data analysis ... - Hadley Wickham
Statistical inference for exploratory data analysis ... - Hadley Wickham

Create successful ePaper yourself
Turn your PDF publications into a flip-book with our unique Google optimized e-Paper software.
4364 A. Buja et al.<br />
multiple quantitative testing<br />
collection of test statistics:<br />
tests: any rejections?<br />
<strong>for</strong> which<br />
<strong>for</strong> real <strong>data</strong>set y<br />
visual discovery<br />
null hypothesis null hypothesis<br />
plot of y: visible features<br />
10<br />
8<br />
6<br />
4<br />
2<br />
10 20 30 40 50<br />
human viewer: any<br />
discoveries? What kind?<br />
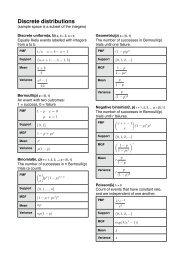
Figure 1. Depiction of the parallelism between multiple quantitative testing and visual discovery.<br />
Potential features of <strong>data</strong> that can be visible in the plot are thought of as a stylized collection of<br />
test statistics. The actually observed features in a plot (the ‘discoveries’) correspond to the test<br />
statistics that result in rejection.<br />
plotting and sampling started to make headway into <strong>data</strong> analytic practice, there<br />
are more examples, and also several voices urging analysts to gauge their sense <strong>for</strong><br />
randomness by looking at plots of random <strong>data</strong>. Daniel (1976) has 40 pages of null<br />
plots in his book on statistics applied to industrial experiments. Diaconis (1983)<br />
describes ‘magical thinking’ as the natural human tendency to over-interpret<br />
random visual stimuli. Davison & Hinkley (1997) in their book on bootstrap<br />
methods (§4.2.4) recommend overlaying lines corresponding to quantiles from<br />
random samples, of the same size as the <strong>data</strong>, to normal probability plots.<br />
The practice was implemented in an early visualization system, Dataviewer, and<br />
described in Buja et al. (1988; in the ‘In<strong>for</strong>mal <strong>Statistical</strong> Inference’ section),<br />
some of which was revisited in the XGobi system (Swayne et al. 1992; Buja<br />
et al. 1996, 1999). Recently, it is Bayesians who have systematized the idea of<br />
MD as visualizing <strong>data</strong>sets simulated from statistical models (Gelman 2004 and<br />
references therein). In spatial statistics, Brillinger (2008) can be cited <strong>for</strong> talks<br />
that keep alive the idea of ‘synthetic plots’, plots of <strong>data</strong> simulated from a complex<br />
model. In a related tenor are the ideas of Davies (2008), which are discussed<br />
further in §5. Also relevant to this paper is the discussion, comparison or even<br />
recommendation of good practice of visual methods <strong>for</strong> <strong>data</strong> <strong>analysis</strong>, <strong>for</strong> which<br />
there exists a rich literature (e.g. Tufte 1983; Cleveland 1993; Buja et al. 1996;<br />
Card et al. 1999; Wilkinson 1999; Chen et al. 2007).<br />
In §2, we first outline the parallelism between established tests of quantitative<br />
features and proposed <strong>inference</strong> <strong>for</strong> qualitative discovery. In §3, we briefly mention<br />
approaches to reference distributions from which ‘null <strong>data</strong>sets’ can be sampled<br />
(with further details deferred to the electronic supplementary material). We then<br />
discuss protocols that specify how simulated null <strong>data</strong>sets are to be used to<br />
attain inferential validity (§§4 and 5). In the remaining sections, we illustrate<br />
our preferred protocol with several practical examples.<br />
Phil. Trans. R. Soc. A (2009)<br />
Downloaded from<br />
rsta.royalsocietypublishing.org on January 7, 2010