Statistical inference for exploratory data analysis ... - Hadley Wickham
Statistical inference for exploratory data analysis ... - Hadley Wickham
Statistical inference for exploratory data analysis ... - Hadley Wickham

Create successful ePaper yourself
Turn your PDF publications into a flip-book with our unique Google optimized e-Paper software.
4374 A. Buja et al.<br />
(a) (b)<br />
HSBC returns<br />
0.02<br />
0.01<br />
0<br />
−0.01<br />
−0.02<br />
0.02<br />
0.01<br />
0<br />
−0.01<br />
−0.02<br />
0.02<br />
0.01<br />
0<br />
−0.01<br />
−0.02<br />
0.02<br />
0.01<br />
0<br />
−0.01<br />
−0.02<br />
0.02<br />
0.01<br />
0<br />
−0.01<br />
−0.02<br />
0.02<br />
0.01<br />
0<br />
−0.01<br />
−0.02<br />
0.02<br />
0.01<br />
0<br />
−0.01<br />
−0.02<br />
0.02<br />
0.01<br />
0<br />
−0.01<br />
−0.02<br />
1 2 3 4 5 6 7 8<br />
Jan−2005 Jul−2005<br />
time<br />
Jan−2006<br />
0.10<br />
0.05<br />
0<br />
−0.05<br />
−0.10<br />
0.10<br />
0.05<br />
0<br />
−0.05<br />
−0.10<br />
0.10<br />
0.05<br />
0<br />
−0.05<br />
−0.10<br />
0.10<br />
0.05<br />
0<br />
−0.05<br />
−0.10<br />
0.10<br />
0.05<br />
0<br />
−0.05<br />
−0.10<br />
0.10<br />
0.05<br />
0<br />
−0.05<br />
−0.10<br />
0.10<br />
0.05<br />
0<br />
−0.05<br />
−0.10<br />
0.10<br />
0.05<br />
0<br />
−0.05<br />
−0.10<br />
1998 2000 2002 2004 2006<br />
time<br />
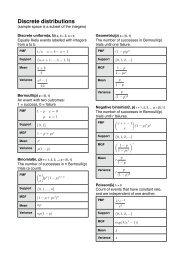
Figure 5. Permutation lineup: (a) HSBC daily returns 2005, time series of 259 trading days and<br />
(b) HSBC daily returns 1998–2005, time series of 2087 trading days. The plot of the real <strong>data</strong> is<br />
embedded among seven permutation null plots. Which plot is different from the others and why?<br />
25 cases of AML and 47 cases of ALL (38 cases of B-cell ALL and 9 cases of<br />
T-cell ALL), giving 72 cases. After pre-processing, there are 3571 human gene<br />
expression variables.<br />
To explore class structure, one may seek a few interesting low-dimensional<br />
projections that reveal class separations using a projection pursuit method, such<br />
as LDA (linear discriminant <strong>analysis</strong>) and PDA (penalized discriminant <strong>analysis</strong>)<br />
indices (Lee 2003; Lee et al. 2005).<br />
Phil. Trans. R. Soc. A (2009)<br />
Downloaded from<br />
rsta.royalsocietypublishing.org on January 7, 2010<br />
1<br />
2 3 4 5 6 7 8