Statistical inference for exploratory data analysis ... - Hadley Wickham
Statistical inference for exploratory data analysis ... - Hadley Wickham
Statistical inference for exploratory data analysis ... - Hadley Wickham

Create successful ePaper yourself
Turn your PDF publications into a flip-book with our unique Google optimized e-Paper software.
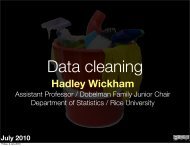
4372 A. Buja et al.<br />
Housing<br />
20 000<br />
15 000<br />
10 000<br />
20 000<br />
15 000<br />
10 000<br />
20 000<br />
15 000<br />
10 000<br />
20 000<br />
15 000<br />
10 000<br />
20 000<br />
15 000<br />
10 000<br />
1<br />
5<br />
9<br />
13<br />
17<br />
200 400 600 800<br />
2<br />
6<br />
10<br />
14<br />
18<br />
200 400 600 800<br />
Climate-Terrain<br />
3<br />
7<br />
11<br />
15<br />
19<br />
200 400 600 800<br />
4<br />
8<br />
12<br />
16<br />
20<br />
200 400 600 800<br />
Figure 3. Permutation lineup: Places Rated <strong>data</strong>, Housing versus Climate-Terrain. The plot of<br />
the real <strong>data</strong> is embedded among permutation null plots. Which plot shows the real <strong>data</strong>?<br />
What features make it distinctive? Does knowledge of the meaning of the variables influence<br />
the choice?<br />
Phil. Trans. R. Soc. A (2009)<br />
Downloaded from<br />
rsta.royalsocietypublishing.org on January 7, 2010