PSYCHOTHERAPY ENGAGERS VERSUS NON-ENGAGERS
PSYCHOTHERAPY ENGAGERS VERSUS NON-ENGAGERS
PSYCHOTHERAPY ENGAGERS VERSUS NON-ENGAGERS

You also want an ePaper? Increase the reach of your titles
YUMPU automatically turns print PDFs into web optimized ePapers that Google loves.
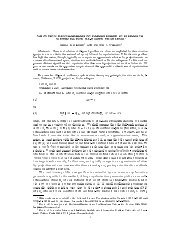
Table 3<br />
Tryon (2003) Mean Number and Standard Deviations of Helping Skills<br />
Helping Skill<br />
1 st third<br />
M (SD)<br />
2 nd third<br />
M (SD)<br />
Part of Intake Session Mean<br />
58<br />
3 rd third<br />
M (SD)<br />
Whole session<br />
M (SD)<br />
proportion<br />
for session<br />
Approval-Reass.<br />
Non-engager – – – – .07 b<br />
Engager – – – – .02 b<br />
Closed Question<br />
Non-engager 11.0 (9.4) 25.8 (18.4) 16.3 (12.7) 53.0 (13.5) a .25<br />
Engager 39.9 (12.1) 30.1 (12.9) 19.6 (11.2) 89.6 (12.1) a .29<br />
Open Question<br />
Non-engager – – – – .06 b<br />
Engager – – – – .04 b<br />
Restatement<br />
Non-engager – – – – .06 b<br />
Engager – – – – .06 b<br />
Reflection not in the version of the HCVRCS used in Tryon (2003)<br />
Challenge this category was eliminated from the analyses because expected value was < 5<br />
Interpretation<br />
Non-engager – – – – .01 b<br />
Engager – – – – .01 b<br />
Self-disclosure<br />
Non-engager – – – – –<br />
Engager – – – – .01<br />
Immediacy not used in Tryon (2003)<br />
Information<br />
Non-engager 23.5 (14.4) 10.0 (6.1) 22.5 (10.5) 56.0 (10.3) a .27<br />
Engager 25.1 (14.4) 43.1 (33.0) 59.7 (40.1) 128.0 (29.2) a .40<br />
Direct Guidance<br />
Non-engager – – – – .04 b<br />
Engager – – – – .03<br />
Other c<br />
Non-engager – – – – .01 b<br />
Engager – – – – .01 b<br />
Minimal encour.<br />
Non-engager – – – – .21<br />
Engager – – – – .14 b<br />
Note. – = data not reported in Tryon (2003). Numbers of verbal responses did not differ between engagers<br />
and non-engagers, F(1, 10) = 1.20, ns. Response modes differed between engagers and non-engagers,<br />
χ 2 (9, N = 11) = 125.78, p < .001. Engager intake sessions, compared to non-engager intake sessions, had<br />
more Information and fewer Minimal Encouragers than expected by chance. Information changed across<br />
thirds for non-engagers vs. engagers, F(2, 18) = 3.81, p < .05. Closed questions changed across thirds for<br />
non-engagers vs. engagers, F(2, 18) = 5.60, p < .02. Minimal encouragers approached significance for<br />
thirds X engagement status, F(2, 18) = 3.21, p = .06.<br />
a Calculated based on information in Tryon (2003): added raw numbers from thirds to get total, averaged<br />
S.D.s to get total S.D. b Estimated from Figure 1 in Tryon (2003) because exact numbers were not reported.<br />
c Percentages may be obscured by the category of silence being eliminated from analysis (expected value of<br />
this category was less than 5).