Hidden Valley Watershed Restoration Project
Hidden Valley Watershed Restoration Project
Hidden Valley Watershed Restoration Project

Create successful ePaper yourself
Turn your PDF publications into a flip-book with our unique Google optimized e-Paper software.
Fisheries Biological Assessment/Evaluation<br />
<strong>Hidden</strong> <strong>Valley</strong> <strong>Watershed</strong> <strong>Restoration</strong> <strong>Project</strong><br />
Hayfork Ranger District, Shasta-Trinity National Forest<br />
USDA Forest Service Region 5<br />
Klamath Province<br />
Prepared by: John Lang<br />
Date: June 13, 2005<br />
The U.S. Department of Agriculture (USDA) prohibits discrimination in all its programs and activities on<br />
the basis of race, color, national origin, gender, religion, age, disability, political beliefs, sexual orientation,<br />
or marital or family status. (Not all prohibited bases apply to all programs.) Persons with disabilities who<br />
require alternative means for communication of program information (Braille, large print, audiotape, etc.)<br />
should contact USDA's TARGET Center at (202) 720-2600 (voice and TDD).To file a complaint of<br />
discrimination, write USDA, Director, Office of Civil Rights, Room 326-W, Whitten Building, 14th and<br />
Independence Avenue, SW, Washington, DC 20250-9410 or call (202) 720-5964 (voice and TDD).<br />
USDA is an equal opportunity provider and employer.
Fisheries Biological Assessment/Evaluation – <strong>Hidden</strong> <strong>Valley</strong> <strong>Watershed</strong> <strong>Restoration</strong> <strong>Project</strong><br />
ESA Biological Assessment for Section 7 Consultation<br />
{Note: acronyms used on this page are clarified elsewhere in the text}<br />
PROJECT NAME: <strong>Hidden</strong> <strong>Valley</strong> <strong>Watershed</strong> <strong>Restoration</strong><br />
ADMINISTRATIVE UNIT: Shasta-Trinity National Forest<br />
South Fork Management Unit<br />
Hayfork and Yolla-Bolla Ranger Districts<br />
FOURTH FIELD WATERSHED: South Fork Trinity River<br />
FIFTH FIELD WATERSHED: <strong>Hidden</strong> <strong>Valley</strong><br />
SEVENTH FIELD WATERSHEDS: Cave Creek-Swift Creek<br />
Little Bear Wallow Creek-<strong>Hidden</strong> <strong>Valley</strong><br />
Miller Springs<br />
McClellen-South Fork Trinity River<br />
Hitchcock Creek-Oak Flat<br />
Wintoon Flat-Deep Gulch<br />
WATERSHED ANALYSIS: <strong>Hidden</strong> <strong>Valley</strong>, Plummer Creek & Rattlesnake Creek, 2001.<br />
NEPA DOCUMENTATION: <strong>Hidden</strong> <strong>Valley</strong> <strong>Watershed</strong> <strong>Restoration</strong> EA, 2005<br />
ESA SPECIES CONSIDERED: Southern Oregon/Northern California Coast Coho Salmon ESU<br />
ESA CRITICAL HABITAT<br />
CONSIDERED: Southern Oregon/Northern California Coast Coho Salmon ESU<br />
ESA DETERMINATIONS: May Affect, but is Not Likely to Adversely Affect Southern<br />
Oregon/Northern California Coast Coho Salmon<br />
MSFCMA DETERMINATIONS: Will Not Adversely Affect Essential Fish Habitat<br />
Shasta-Trinity National Forest – South Fork Management Unit – June 13, 2005 - 2
Fisheries Biological Assessment/Evaluation – <strong>Hidden</strong> <strong>Valley</strong> <strong>Watershed</strong> <strong>Restoration</strong> <strong>Project</strong><br />
Executive Summary<br />
The <strong>Hidden</strong> <strong>Valley</strong> <strong>Watershed</strong> <strong>Restoration</strong> <strong>Project</strong> proposes the following road treatments and closures:<br />
1) 41.1 miles of system road decommissioning/recontouring, permanent removal of an estimated 92<br />
culverts, and 120,400 cubic yards of fill from stream crossings; 2) 5.5 miles of road hydro-closure<br />
(hydrologically disconnecting the road but it will be available for future use) and permanent removal of<br />
and/or installation of critical dips at approximately 20 stream crossings (up to 8,200 cubic yards of fill<br />
removed); 3) 60.5 miles of road upgrade including enlarging approximately 114 culverts to pass a 100<br />
year flow event; 4) 0.3 miles of road realignment; 5) imposing annual closure on 3.2 miles of road. All<br />
road treatments would intersect non-fish bearing streams. Four culverts would be removed from perennial<br />
non-fish bearing channels, the remaining 222 removed or upgraded culverts intersect intermittent non-fish<br />
bearing channels. All work activities will occur during periods of minimal surface flow. The <strong>Project</strong> may<br />
affect, but is not likely to adversely affect Southern Oregon/Northern California Coast coho salmon, their<br />
critical habitat or Essential Fish Habitat. The <strong>Project</strong> would not cause a trend towards Federal listing of<br />
Forest Sensitive fish.<br />
The <strong>Hidden</strong> <strong>Valley</strong> <strong>Watershed</strong> <strong>Restoration</strong> <strong>Project</strong> would be implemented over ten years within the<br />
bounds of limiting operating periods for northern spotted owl and wet weather. Road miles treated per<br />
year would depend on the number and size of crossings encountered, and funding. Based on miles/year<br />
accomplished in past Forest Service projects on the South Fork Management Unit, 3 to 5 miles of road<br />
decommissioning can be accomplished per year. Hydro-closure, culvert upgrades/dip construction and<br />
realignment would occur concurrently.<br />
<strong>Project</strong> activities would directly affect non-fish bearing streams and indirectly affect critical habitat/EFH.<br />
The <strong>Project</strong> will have insignificant negative (-) effects to turbidity and substrate in critical habitat/EFH due<br />
to summer thunderstorm activity. Slightly elevated turbidity levels are expected to result near the mouth of<br />
source creeks for a period of 1 to 2 hours and become diluted to immeasurable levels within a few<br />
hundred feet downstream. The <strong>Project</strong> will have insignificant negative (-) effects to turbidity and substrate<br />
in critical habitat/EFH due to post-implementation channel adjustment. The amount of sediment input<br />
caused by <strong>Project</strong> activities will not increase significantly above background levels in the SFTR. The<br />
<strong>Project</strong> will have no negative (0) effects to turbidity and substrate in critical habitat/EFH due to erosion<br />
from decommission road prisms. Due to the relatively high background erosion, the additive effects of all<br />
project elements (road upgrade, realignment and rehabilitation) in critical habitat/EFH are not expected to<br />
result in turbidity levels significantly elevated above background levels.<br />
Analysis of the effects of the <strong>Project</strong> Elements on the habitat indicators has found that negative effects<br />
are of sufficient probability (discountable) and magnitude (insignificant) to affect SONCC coho salmon<br />
and its critical habitat. Therefore, the effects determination for the <strong>Hidden</strong> <strong>Valley</strong> <strong>Watershed</strong> <strong>Restoration</strong><br />
<strong>Project</strong> is “May affect, not likely to adversely affect” SONCC ESU coho salmon or their critical habitat.<br />
Analysis of the effects of the <strong>Project</strong> Elements on the habitat indicators has found that negative effects<br />
that are of sufficient probability (discountable) and magnitude (insignificant) to affect Essential Fish<br />
Habitat. This <strong>Project</strong> will not adversely affect Essential Fish Habitat. In addition, The <strong>Project</strong> would not<br />
lead to a trend towards Federal listing or loss of viability of Forest Sensitive species.<br />
Shasta-Trinity National Forest – South Fork Management Unit – June 13, 2005 - 3
I. Introduction<br />
Fisheries Biological Assessment/Evaluation – <strong>Hidden</strong> <strong>Valley</strong> <strong>Watershed</strong> <strong>Restoration</strong> <strong>Project</strong><br />
The Shasta-Trinity National Forest (STNF) would apply the USDA Forest Service Roads Analysis<br />
Process (RAP) (USDA Forest Service 1999) and <strong>Watershed</strong> Analysis (WA) recommendations (pages 6-1<br />
to 6-2, in Foster-Wheeler 2001) to reduce road-related erosion and sediment delivery to streams in the<br />
<strong>Hidden</strong> <strong>Valley</strong> <strong>Watershed</strong> and South Fork Trinity River (SFTR). The purpose of this Biological<br />
Assessment/Evaluation (BA/BE) is to review the <strong>Hidden</strong> <strong>Valley</strong> <strong>Watershed</strong> <strong>Restoration</strong> project (<strong>Project</strong>) in<br />
sufficient detail to determine if the actions may affect any endangered, threatened, proposed or candidate<br />
fish species, which may be in the <strong>Project</strong> area or affected by activities occurring within the <strong>Project</strong> area.<br />
The BA/BE is prepared in accordance with legal requirements set forth under Section 7 of the ESA [19<br />
U.S.C. 1536 (c)], and follows the standards established in the Forest Service Manual direction (FSM<br />
2672.42).<br />
The <strong>Hidden</strong> <strong>Valley</strong> assessment area is located on the Hayfork Ranger District of the STNF in T1N R6E,<br />
T1S R7E, T1N R7E, T1S R8E, T3N R7E, T2N R7E, T2N R6E, T3N R6E, Humboldt Meridian. The area is<br />
located west of Forest Glen, between the South Fork Mountain ridge and the SFTR, and south of<br />
Hyampom and is an estimated fourteen air miles west of Hayfork, California.<br />
Supporting documents to this BA/BE are attached and include the following:<br />
Appendix A: National Fire Plan ESA Compliance Statement<br />
Appendix B: Road treatment by road, approximate distance to CH and EFH, miles affected,<br />
culverts excavated, and estimate of the total volume (yards 3 ).<br />
Appendix C: Best Management Practices (BMPs)<br />
Appendix D: Checklists for 5 th Field <strong>Watershed</strong>s within the action area<br />
This document addresses the following species and habitats:<br />
Threatened<br />
Southern Oregon/Northern California Coast (SONCC) ESU coho salmon (Oncorhynchus kisutch)<br />
Designated Critical Habitat<br />
SONCC ESU coho salmon<br />
Essential Fish Habitat<br />
Coho salmon<br />
Chinook salmon (Oncorhynchus tshawytscha)<br />
STNF Forest Service Sensitive Species as of April 26, 2004.<br />
Upper Klamath/Trinity Chinook (UKTR) ESU-spring run (O. tshawytscha)<br />
Upper Trinity River Chinook (UTR) ESU-fall run (O. tshawytscha)<br />
Klamath Mountain Province Steelhead (KMP) ESU (O. mykiss)<br />
McCloud River redband trout (O. mykiss stonei)<br />
Rough Sculpin (Cottus asperrimus Rutter)<br />
Hardhead (Mylopharodon conocephalus)<br />
Shasta-Trinity National Forest – South Fork Management Unit – June 13, 2005 - 4
Threatened<br />
Fisheries Biological Assessment/Evaluation – <strong>Hidden</strong> <strong>Valley</strong> <strong>Watershed</strong> <strong>Restoration</strong> <strong>Project</strong><br />
The National Marine Fisheries Service (NMFS) publicly announced its status finding and intent to propose<br />
SONCC ESU coho salmon as threatened under ESA on July 19, 1995. Its finding on SONCC ESU coho<br />
salmon was published in the Federal Register on July 25, 1995 (60 FR 38011). NMFS made a final<br />
decision to list the SONCC ESU coho salmon as threatened under ESA on April 25 1997. Their finding<br />
was published in the Federal Register on May 6, 1997 (62 FR 24588).<br />
Critical Habitat<br />
In the May 5, 1999 Federal Register (64 FR 24049-24062), NMFS announced designation of Critical<br />
Habitat (CH) for the SONCC ESU coho Salmon. The notice defined critical habitat as follows:<br />
“Critical habitat is designated to include all river reaches accessible to listed coho salmon between Cape<br />
Blanco, Oregon, and Punta Gorda, California. Critical habitat consists of the water, substrate, and adjacent<br />
riparian zone of estuarine and riverine reaches (including off-channel habitats) in hydrologic units and<br />
counties identified in Table 6 of this part [includes the SFTR in Trinity County]. Accessible reaches are<br />
those within the historical range of the ESU that can still be occupied by any life stage of coho salmon.<br />
Inaccessible reaches are those above specific dams identified in Table 6 of this part or above<br />
longstanding, naturally impassable barriers (i.e. natural waterfalls in existence for at least several hundred<br />
years).” No dams or barriers were identified on the SFTR. (NMFS 1999, 64 FR 24061).<br />
The “adjacent riparian zone” was defined in the preamble to the Critical Habitat Designation as follows:<br />
“…Specifically, the adjacent riparian area is defined as the area adjacent to a stream that provides the<br />
following functions: shade, sediment, nutrient or chemical regulation, streambank stability, and input of<br />
large woody debris or organic matter.” (NMFS 1999, 64 FR 24055).<br />
The reach of SONCC ESU coho salmon critical habitat includes the reach of the SFTR adjacent to, and<br />
downstream of, the <strong>Project</strong> area.<br />
Essential Fish Habitat<br />
The Magnuson-Stevens Fishery Conservation Management Act (MSFCMA), as amended by the<br />
Sustainable Fisheries Act of 1996 (Public Law 104-297), requires all Federal agencies to consult with<br />
NMFS on all actions or proposed actions (permitted, funded, or undertaken by the agency) that may<br />
adversely affect Essential Fish Habitat. Essential Fish Habitat (EFH) is defined as those waters and<br />
substrate necessary to commercially important fish, including various Pacific salmon species, for<br />
spawning, breeding, feeding, and growth to maturity. In addition to their listing under the ESA, coho<br />
salmon (O. kisutch) are also managed by NMFS under the MSFCMA, which prompts an EFH consultation<br />
in addition to an ESA consultation. Similarly, EFH consultation is required for Chinook salmon habitat,<br />
even if they are not listed under ESA. EFH consultation is being consolidated with ESA consultation<br />
based upon the NMFS finding that the ESA Section 7 consultation process used by the U.S. Department<br />
of Agriculture – Forest Service (FS) can be used to satisfy the EFH consultation. In this regard, this<br />
BA/BE is also the EFH assessment of the action.<br />
Forest Sensitive Species<br />
The Sensitive Species Program is developed to meet obligations under the ESA, the National Forest<br />
Management Act (NFMA) and our national policy direction as stated in the FS Manual section 2670, and<br />
the U.S. Department of Agriculture Regulation 9500-4. The Sensitive Species Program is our proactive<br />
approach to conserving species to prevent a trend toward listing under the ESA and assists in providing<br />
for a diversity of plant and animal communities [16 U.S.C. 1604(g) (3) (B)] as part of our multiple use<br />
mandate and to maintain "viable populations of existing native and desired non-native species in the<br />
planning area " as required by NFMA (36 CFR 219.19). An analysis of the potential effects of a proposed<br />
project on sensitive species is documented in this BA/BE. The following FS Sensitive fish species do not<br />
Shasta-Trinity National Forest – South Fork Management Unit – June 13, 2005 - 5
Fisheries Biological Assessment/Evaluation – <strong>Hidden</strong> <strong>Valley</strong> <strong>Watershed</strong> <strong>Restoration</strong> <strong>Project</strong><br />
occur in the action area and will not be affected by activities occurring within the action area and<br />
therefore, will not be addressed:<br />
McCloud River redband trout<br />
Rough sculpin<br />
Hardhead<br />
ESA Consultation<br />
The Alternative Consultation Agreement (ACA) was prepared pursuant to the Joint Counterpart<br />
Endangered Species Act (ESA) Section 7 Consultation Regulations issued on December 8, 2003<br />
(Federal Register, pages 68254-68265), to support implementation of the ESA. The counterpart<br />
regulations complement the general consultation regulations at 50 CFR 402 by providing an alternative<br />
process for completing section 7 consultations for Federal agency actions that authorize, fund, or carry<br />
out projects that support the National Fire Plan (NFP). The purpose of the counterpart regulations is to<br />
enhance the efficiency and effectiveness of the consultation process under section 7 of the ESA for NFP<br />
projects by providing an optional alternative to the procedures found in §§ 402.13 and 402.14(b) when the<br />
Forest Service determines a project is “not likely to adversely affect” (NLAA) any listed species or<br />
designated critical habitat. Implementation of the counterpart regulations and this ACA is expected to<br />
maintain the same level of protection for threatened and endangered species and designated critical<br />
habitat as under 50 CFR Part 402, Subpart B. It is expected that projects with NLAA determinations by<br />
the Forest Service would have been considered to be NLAA determinations by the NOAA Fisheries.<br />
Purpose and Need for Action<br />
The main purpose of this project is to improve the watershed condition of the <strong>Hidden</strong> <strong>Valley</strong> and SFTR<br />
watersheds by reducing overland flow diversion, road surface erosion, and mass failure potential through<br />
removal and maintenance of roads within the project area. This project is needed to help meet land<br />
management goals and objectives by reducing the amount of sediment entering the SFTR. The SFTR is<br />
water quality impaired due to excess sediment associated with poor road drainage and failure, and is<br />
critical habitat for the threatened coho salmon.<br />
The purpose and need has been developed through recommendations identified in the <strong>Hidden</strong> <strong>Valley</strong>,<br />
Plummer, and Rattlesnake Creek <strong>Watershed</strong> Analysis (September 2001), <strong>Hidden</strong> <strong>Valley</strong> <strong>Watershed</strong><br />
<strong>Restoration</strong> RAP (February 2005), and through guidance and land allocation decisions provided by the<br />
Land and Resource Management Plan for the STNF (USDA Forest Service, 1995).<br />
Proposed activities would occur within a Key <strong>Watershed</strong>, and lands allocated for Late-successional<br />
Reserve, Adaptive Management Area and Matrix.<br />
Key <strong>Watershed</strong>s:<br />
The Forest Plan objective for Key <strong>Watershed</strong> lands is to provide high quality fish habitat. Key watersheds<br />
are also the highest priority for watershed restoration (USDA Forest Service, 1995. Page 4-161).<br />
Adaptive Management Areas (AMA):<br />
The Forest Plan objectives for AMA lands are to operate and maintain the minimum transportation system<br />
necessary to provide access for dispersed recreation opportunities, grazing allotments, future vegetation<br />
management activities, and fire suppression access, while minimizing potential adverse effects.<br />
Additional objectives are to reduce the potential for cumulative watershed effects, and provide for<br />
watershed restoration activities that will close or obliterate and stabilize roads based upon current and<br />
potential risks to attaining Aquatic Conservation Strategy (ACS) objectives. Reconstruction of roads and<br />
associated drainage features that pose a substantial risk to aquatic organisms also meets ACS objectives<br />
(USDA Forest Service, 1995. Page 4-55).<br />
Shasta-Trinity National Forest – South Fork Management Unit – June 13, 2005 - 6
Fisheries Biological Assessment/Evaluation – <strong>Hidden</strong> <strong>Valley</strong> <strong>Watershed</strong> <strong>Restoration</strong> <strong>Project</strong><br />
The project would eliminate vehicle access to a known “poaching” area (decommission to trail) in an effort<br />
to safe guard congregating spring-run Chinook salmon and summer steelhead.<br />
<strong>Restoration</strong> road work would reduce controllable erosion and mass failure associated with Forest roads<br />
by decommissioning and removing roads from the Forest roads network and reducing road maintenance<br />
obligations. ‘Stored roads’ (hydroclosure) will be available for future use; however, the roadbed will be<br />
kept in a state of reduced hydrologic connection. Upgrade present road drainage features or realign an<br />
existing road to make it less susceptible to erosion. Restrict vehicle travel during winter months allowing<br />
seasonal access only.<br />
On Late-Successional Reserve lands, the needs are:<br />
The Forest Plan objectives are to design and implement watershed restoration projects in a manner that<br />
is consistent with Late-Successional Reserve objectives (USDA Forest Service, 1995. Page 4-40). “Road<br />
construction in Late-Successional Reserves for silvicultural, salvage and other activities generally is not<br />
recommended unless potential benefits exceed the costs of habitat impairment. If new roads are<br />
necessary to implement a practice that is otherwise in accordance with these guidelines, they will be kept<br />
to a minimum, be routed through non-late-successional habitat where possible, and be designed to<br />
minimize adverse impacts” (USDA Forest Service, 1995. Page 4-39).<br />
The project will also realign a short length of access road to a private parcel that is surrounded by<br />
National Forest.<br />
Shasta-Trinity National Forest – South Fork Management Unit – June 13, 2005 - 7
Fisheries Biological Assessment/Evaluation – <strong>Hidden</strong> <strong>Valley</strong> <strong>Watershed</strong> <strong>Restoration</strong> <strong>Project</strong><br />
II. Description of Proposed Action and ESA Action A Area<br />
Through the Roads Analysis Process, the Forest has identified approximately 120 miles of road treatment<br />
opportunities in the <strong>Hidden</strong> <strong>Valley</strong> 5 th Field <strong>Watershed</strong>. Roads are diverting stream flow, eroding soil, and<br />
delivering sediment to stream systems. Treatments include decommissioning, hydroclosure, upgrade,<br />
realignment, and annual closure (Table 1).<br />
Table 1. <strong>Project</strong> treatments.<br />
Road Treatment Type Miles<br />
Decommission to trail 3.1<br />
Decommission 38.0<br />
Hydroclosure 5.5<br />
Upgrade 60.5<br />
Realignment 0.3<br />
Annual Closure 3.2<br />
Total Road Treatment Length 119.9<br />
The USDA Forest Service, STNF, South Fork Management Unit, proposes to implement watershed<br />
restoration activities as described in Alternative 3 of the NEPA document. The following “Actions”<br />
summarize Alternative 3:<br />
Actions<br />
Decommission<br />
Approximately 92 culverts are identified for permanent removal on 41.1 miles of proposed road<br />
decommissioning (Table 2).<br />
Shasta-Trinity National Forest – South Fork Management Unit – June 13, 2005 - 8
Fisheries Biological Assessment/Evaluation – <strong>Hidden</strong> <strong>Valley</strong> <strong>Watershed</strong> <strong>Restoration</strong> <strong>Project</strong><br />
Table 2. Alternative 3 road decommission<br />
summary, road identification and length.<br />
Road ID Road Length<br />
(miles)<br />
1S01 2.4<br />
1S01A 1.9<br />
1S01B 0.9<br />
1N05C 1.4<br />
1N11 0.3<br />
1N11A 0.3<br />
1N11B 1.5<br />
1N11C 0.7<br />
1N11D 0.7<br />
1N11F 0.3<br />
1N24 2.7<br />
1N24A 0.9<br />
1N24B 1.5<br />
1N24C 2.2<br />
1N24F 0.4<br />
1S07 0.3<br />
1S10 0.5<br />
1S11 3.0<br />
1S14F 0.3<br />
1S16 1.0<br />
1S23A 1.2<br />
1S23B 0.8<br />
1S26C 0.3<br />
1S36 0.6<br />
1S36A 0.3<br />
2N10M 0.6<br />
2N26A 0.3<br />
2N27 3.3<br />
Road ID Road Length<br />
(miles)<br />
2N36A 0.6<br />
3N19A 0.4<br />
3N19B 0.8<br />
3N19C 0.9<br />
3N19D 0.7<br />
3N26 0.6<br />
U1N05E 2.1<br />
U1N11EA 0.2<br />
U1N11EB 0.1<br />
U1N24E 0.2<br />
U1N24G 0.2<br />
U1N24H 0.3<br />
U1N24J 0.1<br />
U1S02A 0.1<br />
U1S04A 0.4<br />
U1S06A 0.2<br />
U1S30 0.6<br />
U2N36B 0.2<br />
U3N16B 0.2<br />
U3N19C 0.1<br />
U3N19CA 0.2<br />
U3N19CB 0.2<br />
U3N19CC 0.1<br />
U3N19F 0.1<br />
U3N19G 0.1<br />
U4N12C 0.7<br />
UV1S14F 0.4<br />
UV1S14FA 0.1<br />
Total<br />
Length =<br />
41.1<br />
Decommissioning a road involves one or more of the following restorative actions:<br />
Remove all culverts and cross-drains;<br />
Pull back road fill into the road cut. Out-slope and compact the excavated material to restore a<br />
more natural drainage pattern;<br />
Rip, outslope and/or install rolling dips on the road prism to restore a more natural route of<br />
drainage and accommodate dispersal/settling of sediment;<br />
Subsoil (or till) to road prism, seed and mulch. This activity will not occur in areas prone to exotic<br />
weeds;<br />
Retain a 36-inch foot path where the road is decommissioned to trail. The trail will follow the<br />
contour of the drainage to a convenient crossing point. No foot bridge construction is proposed.<br />
The terminal end of the road (new trailhead) may be widened to accommodate turn-around needs<br />
for vehicles pulling horse trailers;<br />
Create an earthen-berm at the start of the road or decommissioned road segment.<br />
Shasta-Trinity National Forest – South Fork Management Unit – June 13, 2005 - 9
Hydroclosure<br />
Fisheries Biological Assessment/Evaluation – <strong>Hidden</strong> <strong>Valley</strong> <strong>Watershed</strong> <strong>Restoration</strong> <strong>Project</strong><br />
Approximately 20 culverts are identified for permanent removal or upgraded to accommodate 100 year<br />
peak flows and associated debris loads on 5.5 miles of proposed road hydroclosure. The road segment<br />
will be closed to vehicles on a long-term basis, and is stored for future use with minimal maintenance<br />
needs.<br />
Table 3. Alternative 3 road and hydroclosure summary by road identification.<br />
Road ID Road Length<br />
(miles)<br />
1S11 3.1<br />
1S13 2.4<br />
Total Length = 5.5<br />
Prior to hydroclosure, the road will be prepared to avoid future maintenance needs; the road will be left in<br />
an ”erosion-resistant” condition and may have one or more of the following actions taken:<br />
Armoring of stream-road crossings;<br />
Construction of critical dips; road fill pulled back into the road cut. Out-slope the excavated material<br />
to restore a more natural drainage pattern and reduce the potential of future crossing failure.<br />
Existing culverts may or may not be removed;<br />
Apply appropriate erosion control methods, including installing water bars where applicable;<br />
Create an earthen-berm or install a gate to effectively close the road from vehicle use. The road will<br />
be available for future use, however, with minor maintenance and will not be removed from the FS<br />
transportation system.<br />
If a culvert fails (plugs with debris, runoff exceeds the culvert capacity, etc.) critical dips are designed to<br />
funnel the water flowing over the road prism into the channel directly downstream of the road, and<br />
prevent the water from diverting down the road onto an unchanneled hillslope or into another drainage.<br />
Road fill at the critical dips may erode when a culvert fails, but the magnitude of the erosion should be<br />
much less than if the runoff diverted down the road to another location, where it can cause gullies or road<br />
failure.<br />
Upgrade<br />
Approximately 114 culverts will be upgraded on 60.5 miles of system road to accommodate Q100 flows<br />
and associated debris loads (Table 4).<br />
Shasta-Trinity National Forest – South Fork Management Unit – June 13, 2005 - 10
Fisheries Biological Assessment/Evaluation – <strong>Hidden</strong> <strong>Valley</strong> <strong>Watershed</strong> <strong>Restoration</strong> <strong>Project</strong><br />
Table 4. Alternative 3 road upgrade summary by road identification.<br />
Road ID Road Length (miles)<br />
1N11 4.5<br />
1N20 0.3<br />
1N24 7.1<br />
1N24D 0.5<br />
1S01 3.4<br />
1S02 0.7<br />
1S03 0.1<br />
1S04 3.9<br />
1S05 2.5<br />
1S06 1.7<br />
1S12 1.4<br />
1S15 0.6<br />
1S20 0.1<br />
2N25 3.5<br />
3N10 10.3<br />
3N19 3.7<br />
3N30 3.1<br />
4N12 11.2<br />
4N12D 0.7<br />
6N01M 0.2<br />
U1N24I 0.6<br />
U6N01M 0.1<br />
Totals = 60.5<br />
A road upgrade may have one or more of the following actions:<br />
Grading and spot rocking the surface;<br />
Establishing cross-drains, installing waterbars and drainage dips;<br />
Installing stand pipes, placing splash aprons below culvert outlets, upsizing culverts, and adding<br />
drainage relief culverts;<br />
Road Realignment: Road spur 2N24E provides road access to private property. Presently an<br />
unclassified (UC) road, the access road is steep and rutted and delivers controllable sediment to the<br />
SFTR. The treatment would realign the road to better conform to topography and reduce erosion. The old<br />
UC road would then be decommissioned.<br />
Annual Closure: Restricts vehicle travel between October 31, and May 1. Restriction accomplished by<br />
installing a lockable gate.<br />
U-Roads: Unclassified roads are identified by systematic road inventories as part of the Forest Plan or<br />
specific projects. Depending on the type of road, they are either added to the FS transportation system or<br />
removed.<br />
<strong>Project</strong> Design Standards<br />
Permanent Culvert Removal<br />
Isolation of in-water work area shall be conducted in the following manner:<br />
Temporarily divert flow around the work area. Divert flow with structures such as cofferdams<br />
constructed with sandbags or straw bales.<br />
Shasta-Trinity National Forest – South Fork Management Unit – June 13, 2005 - 11
Fisheries Biological Assessment/Evaluation – <strong>Hidden</strong> <strong>Valley</strong> <strong>Watershed</strong> <strong>Restoration</strong> <strong>Project</strong><br />
The temporary bypass pipes must be sized large enough to accommodate the predicted peak flow<br />
rate during construction.<br />
Pump water from the de-watered work area into a vegetated area sufficient to filter sediment prior<br />
to it entering the stream channel.<br />
Reconstruct the stream channel within the area formerly occupied by the culvert in a manner that<br />
reflects natural bankfull and floodplain dimensions.<br />
Excavate channel, bank, and floodplain contours and haul material off-site, or incorporate into the<br />
road prism as outsloped material.<br />
Culvert Upgrade<br />
All of the steps stated for culvert removal will apply to culvert upgrades with the following changes:<br />
Existing culverts will be replaced with the new culvert appropriately sized for its location in the<br />
drainage. In most cases this will result in the installation of a larger diameter culvert.<br />
Fill material will reincorporated and compacted into the crossing. However, due to soil expansion or<br />
use of a larger diameter culvert, excess fill material will be incorporated on to the existing road.<br />
<strong>Project</strong> roads were summarized by approximate distance to CH/EFH ( 0.75 miles), treatment type, road length affected, the number of culverts affected, estimated fill volume<br />
removed or disturbed, and an estimate erosion post excavation due to channel readjustment (Table 5).<br />
For culvert upgrades, fill estimates are an estimated measure of disturbance.<br />
Table 5. Summary of Proposed Action and an estimate of short-term erosion (yards 3 ).<br />
Est Fill Short-term erosion<br />
Proximity to CH/EFH Treatment Road Length (miles) Stream-xings (yd3) (max) (yds3) 1<br />
0.10 mi Decommission 1.8 4 1,000 36<br />
0.25-0.75 mi Decommission 21.7 64 95,849 1,247<br />
>0.75 mi Decommission 17.7 24 23,580 431<br />
Subtotal 41.2 92 120,429 1,714<br />
Est Fill Short-term erosion<br />
Proximity to CH/EFH Treatment Road Length (miles) Stream-xings (yd3) (max) (yds3) 1<br />
0.75 mi Hydro-close 2.4 8 4,000 63<br />
Subtotal 5.5 20 8,200 128<br />
Est Fill Short-term erosion<br />
Proximity to CH/EFH Treatment Road Length (miles) Stream-xings (yd3) (max) (yds3)<br />
0.10 mi Upgrade 0.1 0 0 0<br />
0.25-0.75 mi Upgrade 21.0 43 6,650 6<br />
>0.75 mi Upgrade 39.3 71 10,650 8<br />
Subtotal 60.4 114 17,300 14<br />
Est Fill Short-term erosion<br />
Proximity to CH/EFH Treatment Road Length (miles) Stream-xings (yd3) (max) (yds3)<br />
0.75 mi Realign 0.0 0.0 0 0<br />
Subtotal 0.3 0.0 0 0<br />
1 Estimates of erosion derived from the methodology in Madej et al (2001).<br />
Shasta-Trinity National Forest – South Fork Management Unit – June 13, 2005 - 12
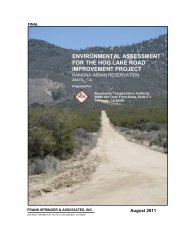
Fisheries Biological Assessment/Evaluation – <strong>Hidden</strong> <strong>Valley</strong> <strong>Watershed</strong> <strong>Restoration</strong> <strong>Project</strong><br />
<strong>Project</strong> Implementation<br />
In general, northern spotted owl (NSO) and wet weather Limited Operating Periods (LOP) will determine<br />
the operating window for on the ground disturbance. The U.S. Fish and Wildlife Service has excluded<br />
roads 1S01A, 1S01B, and 1S11 from a July 10th LOP, therefore these roads will be subject to the May 15<br />
to October 15 Forest Service LOP. All other roads will be under a NSP and wet weather LOP (July 11 to<br />
October 15). <strong>Project</strong> activities may extend past October 15 if weather forecasts do not anticipate<br />
significant precipitation, or if leaving a project site unfinished will result in a greater risk of sediment<br />
delivery to streams. A significant rain forecast is 1-inch expected in a 24 hour period.<br />
The number of road miles that can be treated in a given year is largely dependant on the size and number<br />
of crossing in a given mile of road. <strong>Project</strong> implementation is expected to begin July 11, 2005, and<br />
continue for approximately 10 years within the constraints of the LOPs.<br />
Erosion Control and Best Management Practices (BMP)<br />
An erosion control plan is required by the contractor and approved by the Forest Service. Appendix C<br />
provides a list of applicable BMPs, an example of areas covered and the authorities for ensuring that<br />
BMPs are implemented.<br />
ESA Action Area<br />
For the purpose of ESA consultation the action area includes the <strong>Hidden</strong> <strong>Valley</strong> subwatershed (HUC<br />
1801021202) from Forest Glen down stream to Pelletreau Creek, and the Cave Creek 7 th field<br />
subwatershed (HUC 18010212020105) which is a small subwatershed in the Plummer Creek 5 th field<br />
watershed. (See <strong>Project</strong> Map, available on the Forest Service web page<br />
(http://www.fs.fed.us/r5/shastatrinity/documents/st-main/projects/ea/sfmu/hidden-valley-05/alt3-mapcontours.pdf).<br />
Shasta-Trinity National Forest – South Fork Management Unit – June 13, 2005 - 13
Fisheries Biological Assessment/Evaluation – <strong>Hidden</strong> <strong>Valley</strong> <strong>Watershed</strong> <strong>Restoration</strong> <strong>Project</strong><br />
III. Species Accounts<br />
Coho Salmon<br />
The following excerpts for SONCC coho salmon was taken from Chapter 2 in the CDFG publication<br />
“Recovery strategy for California coho salmon, Report to the California Fish and Game Commission”<br />
(CDFG 2004). Note: Figure 2 (coho distribution on the STNF) was inserted by the Forest Service.<br />
“Coho salmon are now found in less than 60% of the SONCC Coho ESU streams that were historical coho<br />
salmon streams. However, these declines appear to have occurred prior to the late 1980s and the data do<br />
not support a significant decline in distribution between the late 1980s and the present. Some streams in<br />
this ESU have lost one or more brood-year lineages. The major stream systems within the California<br />
portion of the SONCC Coho ESU still contain coho salmon populations, although many tributaries may<br />
have missing runs. Department analysis of the SONCC data when grouped (1986 to 1991 vs. 1995 to<br />
2000) indicates that the decline is not statistically significant, whereas the NOAA Fisheries analysis of the<br />
ungrouped data (1989 to 2000) indicates that the decline in the northern ESU is significant.<br />
Because of the decline in distribution prior to the 1980s, together with the possibility of a severe reduction<br />
in distribution as indicated by the field surveys and the downward trend of most abundance indicators, the<br />
Department believes that coho salmon populations in the California portion of this ESU will likely become<br />
endangered in the foreseeable future in the absence of the protection and management.<br />
Life History<br />
Adult coho salmon enter fresh water from September through January in order to spawn. In the short<br />
coastal streams of California, migration usually begins between mid-November and mid-January (Baker<br />
and Reynolds 1986). Coho salmon move upstream after heavy rains have opened the sand bars that form<br />
at the mouths of many California coastal streams, but may enter larger rivers earlier. On the Klamath<br />
River, coho salmon begin entering in early to mid-September and reach a peak in late September to early<br />
October. On the Eel River, adult coho salmon return four to six weeks later than on the Klamath River<br />
(Baker and Reynolds 1986). Arrival in the upper reaches of these streams generally peaks in November<br />
and December. Timing varies by stream and/or flow (Neave 1943; Brett and MacKinnon 1954; Ellis 1962)<br />
(Figure 1).<br />
Figure 1. Calendar indicating the seasonal presence of coho salmon in California coastal watersheds<br />
(Adapted from CDFG 2004).<br />
Generally, coho salmon spawn in smaller streams than do Chinook salmon. In California, spawning occurs<br />
mainly from November to January, although it can extend into February or March if drought conditions are<br />
present (Shapovalov and Taft 1954). In the Klamath and Eel rivers, spawning occurs in November and<br />
December (USFWS 1979). Shapovalov and Taft (1954) note that females usually choose spawning sites<br />
near the head of a riffle, just below a pool, where the water changes from a laminar to a turbulent flow and<br />
there is a medium to small gravel substrate.<br />
Shasta-Trinity National Forest – South Fork Management Unit – June 13, 2005 - 14
Fisheries Biological Assessment/Evaluation – <strong>Hidden</strong> <strong>Valley</strong> <strong>Watershed</strong> <strong>Restoration</strong> <strong>Project</strong><br />
In California, eggs incubate in the gravels from November through April. The incubation period is inversely<br />
related to water temperature. California coho salmon eggs hatch in about forty-eight days at 48°F, and<br />
thirty-eight days at 51.3°F (Shapovalov and Taft 1954). After hatching, the alevins (hatchlings) are<br />
translucent in color (Shapovalov and Taft 1954; Laufle et al.1986; Sandercock 1991). This is the coho<br />
salmon’s most vulnerable life stage, during which they are susceptible to siltation, freezing, gravel scouring<br />
and shifting, desiccation, and predation (Sandercock 1991; Knutson and Naef 1997; Pacific Fisheries<br />
Management Council [PFMC] 1999). Alevins remain in the interstices of the gravel for two to ten weeks<br />
until their yolk sacs have been absorbed, at which time their color changes to that more characteristic of fry<br />
(Shapovalov and Taft 1954, Laufle et al. 1986, Sandercock 1991). The fry are silver to golden with large,<br />
vertical, oval, dark parr marks along the lateral line that are narrower than the spaces between them.<br />
Fry emerge from the gravel between March and July, with peak emergence occurring from March to May,<br />
depending on when the eggs were fertilized and the water temperature during development (Shapovalov<br />
and Taft 1954). They seek out shallow water, usually moving to the stream margins, where they form<br />
schools. As the fish feed heavily and grow, the schools generally break up and individual fish set up<br />
territories. At this stage, the fish are termed parr (juveniles). As the parr continue to grow and expand their<br />
territories, they move progressively into deeper water until July and August, when they inhabit the deepest<br />
pools (CDFG 1994a). This is the period when water temperatures are highest, and growth slows<br />
(Shapovalov and Taft 1954). Food consumption and growth rate decrease during the winter months of<br />
highest flows and coldest temperatures (usually December to February). By March, parr again begin to<br />
feed heavily and grow rapidly.<br />
Rearing areas used by juvenile coho salmon are low-gradient coastal streams, lakes, sloughs, side<br />
channels, estuaries, low-gradient tributaries to large rivers, beaver ponds, and large slackwaters (PFMC<br />
1999). The most productive juvenile habitats are found in smaller streams with low-gradient alluvial<br />
channels containing abundant pools formed by large woody debris (LWD). Adequate winter rearing habitat<br />
is important to successful completion of coho salmon life history. After one year in fresh water, smolts<br />
begin migrating downstream to the ocean in late March or early April. In some years emigration can begin<br />
prior to March (CDFG unpublished data) and can persist into July (Shapovalov and Taft 1954; Sandercock<br />
1991). Weitkamp et al. (1995) indicate that peak downstream migration in California generally occurs from<br />
April to early June. Factors that affect the onset of emigration include the size of the fish, flow conditions,<br />
water temperature, dissolved oxygen (DO) levels, day length, and the availability of food.<br />
In Prairie Creek, Bell (2001) found that a small percentage of coho salmon remain more than one year<br />
before emigrating to the ocean. Low stream productivity, due to low nutrient levels or cold water<br />
temperatures, can contribute to slow growth, potentially causing coho salmon to postpone emigration<br />
(PFMC 1999). There may be other factors that contribute to a freshwater residency of longer than one<br />
year, such as late spawning, which can produce fish that are too small at the time of smolting to migrate to<br />
sea (Bell 2001).<br />
Habitat Requirements for Adults<br />
Migration<br />
Coho salmon usually migrate during late summer and fall and their specific timing may have evolved in<br />
response to particular flow conditions. For example, obstructions that may be passable in high waters may<br />
be insurmountable during low flows. Conversely, early-running stocks are thought to have developed<br />
because those fish could surmount obstacles during low or moderate flows but not during high flows. If flow<br />
conditions in a stream are unsuitable, the fish will often mill about in the vicinity of the stream mouth,<br />
sometimes waiting weeks, or even (in the case of early-run fish) months for conditions to change<br />
(Sandercock 1991). Although substantially greater depth may be needed to negotiate some barriers,<br />
minimum depth to allow passage of coho salmon is approximately 7.1 inches (Bjornn and Reiser 1991).<br />
Reiser and Bjornn (1979) indicate that adult migration normally occurs when water temperature is in the 45<br />
to 61°F range. Excessively high temperature may result in delays in migration (Monan et al. 1975).<br />
Additionally, excessively high temperature during migration may lead to disease outbreaks (Spence et al.<br />
Shasta-Trinity National Forest – South Fork Management Unit – June 13, 2005 - 15
Fisheries Biological Assessment/Evaluation – <strong>Hidden</strong> <strong>Valley</strong> <strong>Watershed</strong> <strong>Restoration</strong> <strong>Project</strong><br />
1996) and may reduce the egg viability (Leitritz and Lewis 1980). The high-energy expenditure during<br />
sustained upstream swimming requires adequate concentrations of DO (Davis et al. 1963).<br />
Supersaturation of dissolved gases (especially nitrogen), however, has been found to cause gas-bubble<br />
disease in migrating salmonids (Ebel and Raymond 1976).<br />
Reid (1998) found that high turbidity affects all life stages of coho salmon. In the case of adults, high<br />
concentrations of suspended sediment may delay or divert spawning runs (Mortensen et al. 1976). As an<br />
example of a response to a catastrophic event (the eruption of Mount St. Helens, Washington) coho<br />
salmon strayed from the highly impacted Toutle River to nearby streams for the two following years (Quinn<br />
and Fresh 1984). Salmonids have been found to wait rather than travel up a stream where the suspended<br />
sediment load reached 4,000mg/l (Bell 1986). Migrating coho salmon require deep and frequent pools for<br />
resting and to escape from shallow riffles where they are susceptible to predation. Deep pools are also<br />
necessary for fish to attain swimming speeds necessary to leap over obstacles. Pools need to be 25%<br />
deeper than the height of the jump for adult fish to attain the necessary velocity for leaping (Flosi et al.<br />
1998).<br />
Large Woody Debris (LWD) and other natural structures such as large boulders provide hydraulic<br />
complexity and pools. They also facilitate temperature stratification and the development of thermal refugia<br />
by isolating pockets of cold water (Bilby 1984; Nielsen et al. 1994). Riparian vegetation and undercut<br />
banks provide cover from terrestrial predators in shallow reaches.<br />
Spawning<br />
Coho salmon typically spawn in small streams where the flow is 2.9 to 3.4 cubic feet per second (cfs) and<br />
the stream depth ranges between 3.94 and 13.78 inches, depending on the velocity (Gribanov 1948;<br />
Briggs 1953; Thompson 1972; Bovee 1978; Li et al. 1979). On the spawning grounds, they seek out sites<br />
of groundwater seepage and favor areas where the stream velocity is 0.98 to 1.8 ft/s. They also prefer<br />
areas where water upwells through redds, eliminating wastes, and preventing sediments from filling the<br />
interstices of the spawning gravel. The female generally selects a redd site at the outlet of a pool or at the<br />
head of a riffle, where there is good circulation of oxygenated water through the gravel. A pair of spawning<br />
coho salmon requires about 126 square feet for redd and inter-redd space.<br />
About 85% of redds are located in areas where the substrate is comprised of gravel of 15cm diameter or<br />
smaller. There must be sufficient appropriately sized gravel and minimal fine sediments to ensure<br />
adequate interstitial space for egg survival. In situations where there is mud or fine sand in the nest site, it<br />
is removed during the digging process. LWD and other structures such as large boulders provide streambank<br />
support, which over time helps to reduce sediment input resulting from bank erosion.<br />
Eggs deposited within a zone of scour and fill can wash downstream. Large woody debris, riparian<br />
vegetation, and upslope stability enhance bank stability, which in turn promotes gravel stability and<br />
minimizes the risk to redds from the scouring effects of high flows. In addition to promoting bank stability,<br />
LWD also diversifies flows, reducing stream energy directed towards redds (Naiman et al. 1992).<br />
Habitat Requirements for Juveniles<br />
The coho salmon typically spends the first half of its life in the freshwater or estuarine environment. The<br />
following sections describe habitat requirements for the early life stages.<br />
Eggs and Alevin<br />
Incubation Low winter flows can result in the desiccation of redds or may expose eggs to freezing<br />
temperatures. High water flows can disturb redd gravel, resulting in eggs being dislodged and swept<br />
downstream. Winter storms often cause excessive siltation that can smother eggs and inhibit intragravel<br />
movement of alevins. Siltation from these storms can reduce water circulation in the gravel to the point<br />
where low oxygen levels become critical or lethal. According to Bjornn and Reiser (1991), the optimum<br />
temperature for coho salmon egg incubation is between 40 and 55°F. In one study, coho salmon embryos<br />
suffered 50% mortality at temperatures above 56.3°F (Beacham and Murray 1990). Because of the close<br />
Shasta-Trinity National Forest – South Fork Management Unit – June 13, 2005 - 16
Fisheries Biological Assessment/Evaluation – <strong>Hidden</strong> <strong>Valley</strong> <strong>Watershed</strong> <strong>Restoration</strong> <strong>Project</strong><br />
connection between temperature and developmental processes, changes in thermal regime, even when<br />
well within the physiologically tolerable range for the species, can have significant effects on development<br />
time (and hence emergence timing), as well as on the size of emerging fry. A high proportion of fine<br />
sediments in the gravel effectively reduce DO levels and also results in smaller emergent fry. Embryos and<br />
alevins need high levels of oxygen to survive (Shirazi and Seim 1981), and Phillips and Campbell (1961)<br />
suggest that DO levels must average greater than 8.0 mg/l for embryos and alevins to thrive. Excessive<br />
sediment deposition may also act as a barrier to fry emergence (Cooper 1959). McHenry et al. (1994)<br />
found that when sediment particles smaller than 0.85 mm1 made up more than 13% of the total sediment,<br />
it resulted in intragravel mortality for coho salmon embryos because of oxygen deficiency. Cederholm et al.<br />
(1981) found that in the Clearwater River in Washington, the survival of salmonid eggs to emergence from<br />
gravel was inversely correlated with the percent of fine sediment when the proportion of fines exceeded the<br />
natural level of 10%. Tagart (1984) found that if sediment composition included a high concentration (up to<br />
50%) of fine sediment (
Fisheries Biological Assessment/Evaluation – <strong>Hidden</strong> <strong>Valley</strong> <strong>Watershed</strong> <strong>Restoration</strong> <strong>Project</strong><br />
creation of microhabitats within reaches, thus providing more opportunities for inter- and intra-species<br />
stratification (Bjornn and Reiser 1991). Terrestrial insects and leaves falling into streams from riparian<br />
vegetation constitute much of the food base for stream macroinvertebrates, which in turn are a major food<br />
source for juvenile coho salmon.<br />
Emigration<br />
Stream flow is important in facilitating the downstream migration of coho salmon smolts. Dorn (1989) found<br />
that increases in stream flow triggered downstream movement of coho salmon. Spence (1995) also found<br />
short-term increases in stream flow to be an important stimulus for smolt emigration. Thus, the normal<br />
range of stream flow may be required to maintain normal temporal patterns of migration. In years with low<br />
flows, emigration is earlier. Artificial obstructions such as dams and diversions of water may impede<br />
emigration where they create unnatural flow patterns. Water temperature affects timing of emigration of<br />
smolts by influencing their rate of growth and physiological development, and their responsiveness to other<br />
environmental stimuli (Groot 1982). Alteration of thermal regimes through land-use practices and dam<br />
operations can influence the timing of emigration. The probability that coho salmon smolts will migrate<br />
downstream increases with rapid increases in temperature (Spence 1995). Holtby (1988) found that coho<br />
salmon smolts in British Columbia emigrated approximately eight days earlier in response to logginginduced<br />
increases in stream temperatures. In addition, the age-class distribution was shifted from<br />
populations evenly split between one- and two-year-old smolts to populations dominated by one-year-old<br />
fish. If most smolts emigrate at the same age, poor ocean conditions would have a greater effect on that<br />
particular year class than if the risk were spread over two years. Coho salmon have been observed<br />
throughout their range to emigrate at temperatures ranging from 36.6°F up to as high as 55.9°F<br />
(Sandercock 1991). Coho salmon have been observed emigrating through the Klamath River estuary in<br />
mid- to late-May when water temperature ranged from 53.6 to 68°F (CDFG unpublished data).<br />
Supersaturation of dissolved gases (especially nitrogen) has been found to cause gas-bubble disease in<br />
downstream-migrating salmonids (Ebel and Raymond 1976). Smolts are particularly vulnerable to<br />
predation (Larsson 1985). Physical structures in the form of undercut banks and LWD provide refugia<br />
during resting periods and cover from predators.<br />
Estimates of coho salmon run-size, spawner escapement and angler harvest have been conducted in the<br />
Trinity River since 1977. Estimates are generated using mark-recapture methods. Fish are trapped and<br />
tagged at a mainstem trapping weir near the town of Willow Creek (RM 30). Recoveries occur at Trinity<br />
River Hatchery (TRH), the upper-most point of migration. Mean run-size (grilse and adults combined)<br />
between 1977 and 1999 was 15,959 coho salmon. Problems facing coho salmon in the Trinity River HU<br />
include degradation of spawning and winter rearing habitat due to sedimentation and past land-use<br />
practices, sparse spawning gravel recruitment, high summer water temperatures due to diversion of<br />
natural flow of Lewiston Dam, lack of deep pools, water diversions, irregular timing of flows, fragmentation<br />
of populations, possible genetic swamping from presumably inferior hatchery strains, migration barriers,<br />
water quality problems and unscreened diversions.<br />
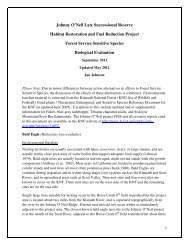
Hyampom Hydrologic SubArea (HSA)<br />
The Hyampom HSA includes the South Fork of the Trinity River and its tributaries from Eltapom Creek up<br />
stream to Hayfork Creek. Historical data show that the SFTR and its larger tributaries were once important<br />
spawning grounds for coho salmon. The frequency and size of coho salmon runs in the South Fork are not<br />
well documented, though they have been reported to migrate as far upstream as Hyampom (Figure 2).<br />
Problems facing coho salmon in the Hyampom HSA include sediment load, unstable stream banks,<br />
migration barriers, low flows, the lack of pools and cover resulting from large-scale water diversions and<br />
other land-use practices, lack of high quality rearing habitat, and a substantial change in channel<br />
morphology.<br />
Hayfork HSA<br />
The Hayfork <strong>Valley</strong> HSA includes Hayfork Creek upstream of Little Creek. Coho salmon are thought to<br />
have been extirpated in this HSA. Problems in the Hayfork <strong>Valley</strong> HSA include mass wasting, erosion<br />
Shasta-Trinity National Forest – South Fork Management Unit – June 13, 2005 - 18
Fisheries Biological Assessment/Evaluation – <strong>Hidden</strong> <strong>Valley</strong> <strong>Watershed</strong> <strong>Restoration</strong> <strong>Project</strong><br />
caused by fire, excessive stored sediment, migration barriers, low flows, lack of pools and cover due to<br />
large-scale water diversions, water pollution, and lack of high quality rearing habitat.”<br />
Figure 2. SONCC coho salmon CH/EFH distribution on the Shasta-Trinity National Forest, South<br />
Fork Management Unit.<br />
Shasta-Trinity National Forest – South Fork Management Unit – June 13, 2005 - 19
Chinook Salmon<br />
Fisheries Biological Assessment/Evaluation – <strong>Hidden</strong> <strong>Valley</strong> <strong>Watershed</strong> <strong>Restoration</strong> <strong>Project</strong><br />
Chinook salmon historically ranged as far south as the Ventura River, California, and their northern extent<br />
reaches the Russian Far East. Life history strategies for Chinook salmon in coastal North American<br />
streams are predominately "ocean-type" (NMFS 1998). Ocean-type Chinook salmon migrate from the<br />
freshwater environment to the ocean environment within there first year. Ocean-type Chinook salmon<br />
tend to use estuaries within the first several weeks after emergence and prior to immigrating to the ocean.<br />
Residence in the Pacific Ocean is variable and complex with most fish returning to natal streams to<br />
spawn as adults between their third and fifth year (NMFS 1998). Chinook salmon die soon after<br />
spawning.<br />
Chinook salmon in the Klamath River Basin upstream of the Trinity River confluence comprises the UKTR<br />
ESU. The USDA-FS designated river-type “spring-run” Chinook salmon a “Sensitive” species. Adult<br />
spring Chinook salmon have a unique life history that involves migrating to the upper reaches of the natal<br />
stream during spring and summer. Much of the summer is spent holding in pools where they mature<br />
sexually. The spawning period usually begins during the latter part of September and continues through<br />
October. This life history pattern differs from the fall-run, which enter freshwater with almost mature<br />
gametes and spawn soon after during the fall period, usually lower in the watershed than spring-run<br />
Chinook salmon (Hillemeier, 1993). Hyampom located at the confluence of the SFTR and Hayfork Creek<br />
is loosely considered the break between the distribution of spring and fall Chinook salmon on the SFTR.<br />
However, during years of drought or years having above average precipitation and higher fall flows, there<br />
may be considerable overlap in the distribution and use of spawning areas. The approximate distribution<br />
of spring and fall-run Chinook salmon on the STNF South Fork Management Unit is depicted in Figure 3.<br />
Chinook salmon spawn in clean gravels in streams and in the mainstem of some rivers. Depending on<br />
temperature, eggs incubate in redds for 1.5 to 4 months before hatching as alevins. Following yolk-sac<br />
absorption, alevins emerge from the gravel as fry and begin feeding. They require cold water, deep pools,<br />
and cover. Fall-Chinook salmon fry grow quickly and will emigrate from freshwater between 60 and 120<br />
days after emergence (NMFS 1998). In contrast, Spring Chinook salmon will rear in river for<br />
approximately 1 year before immigrating to the ocean in early spring. A major limiting factor for juvenile<br />
Chinook salmon is water temperature which strongly affects growth and survival (Moyle 2002). For a<br />
complete life history description and status review see Meyers et al. (1998). For additional information<br />
regarding the freshwater habitat requirements for Chinook salmon see Bjornn and Reiser (1991).<br />
Studies conducted before the 1964 flood found that spring-run Chinook salmon spawning began near the<br />
SFTR around mid September and progressed downstream (La Faunce 1967). The peak of spawning<br />
activity occurred by mid October. The lower extent of spawning activity on the SFTR was at Hyampom,<br />
but also extended from approximately 2 to 7 miles up Hayfork Creek (PWA 1994). Recently spring-run<br />
Chinook salmon have been observed in the proximity of the Middle and Lower Hayfork Creek 5 th field<br />
watersheds (CDFG 2004a). Historically, spring-run Chinook salmon utilized the lower reaches of Salt<br />
Creek, Big Creek, Tule Creek, and East Fork Hayfork Creek (PWA, 1994). In August, CDFG and<br />
participating agencies and individuals conduct annual spring Chinook salmon and summer steelhead<br />
counts on the SFTR. Reaches locations (A through N) are depicted in Figure 4 and Figure 5. Reach K<br />
and L occur adjacent to the <strong>Project</strong> area. From 1988 to 2004, adult survey reaches E, F, G and H, have<br />
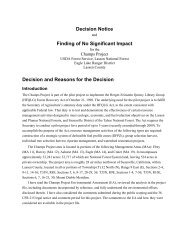
had the highest concentrations of spring Chinook observed (Figure 6).<br />
Shasta-Trinity National Forest – South Fork Management Unit – June 13, 2005 - 20
Fisheries Biological Assessment/Evaluation – <strong>Hidden</strong> <strong>Valley</strong> <strong>Watershed</strong> <strong>Restoration</strong> <strong>Project</strong><br />
Figure 3. Chinook salmon distribution on the Shasta-Trinity National Forest, South Fork Management Unit.<br />
Shasta-Trinity National Forest – South Fork Management Unit – June 13, 2005 - 21
Fisheries Biological Assessment/Evaluation – <strong>Hidden</strong> <strong>Valley</strong> <strong>Watershed</strong> <strong>Restoration</strong> <strong>Project</strong><br />
Figure 4. South Fork Trinity River Upper and Middle reaches, A through I (adapted from Dean (1995)).<br />
Reach A and B (lower right hand corner) begin at the confluence of the East Fork and SFTR. Reach I ends<br />
just upstream of the community of Hyampom.<br />
Shasta-Trinity National Forest – South Fork Management Unit – June 13, 2005 - 22
Fisheries Biological Assessment/Evaluation – <strong>Hidden</strong> <strong>Valley</strong> <strong>Watershed</strong> <strong>Restoration</strong> <strong>Project</strong><br />
Figure 5. South Fork Trinity River middle and lower reaches, I through N (adapted from Dean (1995)).<br />
Reach I (lower right hand corner) ends just upstream of the confluence with Hayfork Creek. Reach N ends at<br />
the confluence with mainstem Trinity River.<br />
Shasta-Trinity National Forest – South Fork Management Unit – June 13, 2005 - 23
Average Count (1988-2004)<br />
100<br />
90<br />
80<br />
70<br />
60<br />
50<br />
40<br />
30<br />
20<br />
10<br />
0<br />
A (117.8)<br />
Fisheries Biological Assessment/Evaluation – <strong>Hidden</strong> <strong>Valley</strong> <strong>Watershed</strong> <strong>Restoration</strong> <strong>Project</strong><br />
B (117.8)<br />
C (111.8)<br />
D (102.7)<br />
Spring Chinook (includes Jack's)<br />
E (89.5)<br />
F (79.5)<br />
G (68.4)<br />
H (58.2)<br />
I (49.6)<br />
J (40.2)<br />
Stream Reach (start) and River Kiometer<br />
Figure 6. Spring Chinook salmon oversummer holding distribution (1988 to 2004) in the South Fork Trinity<br />
River.<br />
Population Trend<br />
Spring-run Chinook in the Klamath-Trinity system are on the verge of disappearing (Moyle 2002). They<br />
are lumped in with fall-run and late-fall-run fish in the UKTR ESU by NOAA because of genetic similarities<br />
(Meyers et al. 1998). In the Klamath drainage the principle run is in the north and south forks of the<br />
Salmon River and in Wooley Creek, tributary to the Salmon River (Moyle 2002). The north and south fork<br />
of the Trinity River, and possibly New River, also support a few fish (CDFG 1990, in Moyle 2002).<br />
Salmon River spring-run Chinook salmon counts have been conducted annually since 1980. In the 24<br />
years 1980 and 2003, Salmon River spring-run Chinook salmon have averaged 739 fish annually, ranging<br />
from 1,300 fish in 1993, to 6 fish in 1983 (Brenda Olsen, Personal Communication 2005).<br />
Historically, salmonid spawning runs in the SFTR were dramatically larger than they are today; spring<br />
Chinook represented the largest salmonid runs in the SFTR basin. In 1963 and 1964, prior to the<br />
December 1964 flood, spring Chinook escapement was greater than 10,000 fish (Healey 1963, LaFaunce<br />
1967; in EPA 1998). This is consistent with anecdotal observations of large numbers of fish in the river<br />
(Berol 1995). The December 1955 flood probably also affected the fish population temporarily; an aerial<br />
redd count in 1958 noted only 101 spring Chinook redds (La Faunce 1967, citing USFWS 1960 in EPA<br />
1998). However, large sediment deliveries to the stream were not observed between 1944 and 1960.<br />
Furthermore, indications are that the spawning run had recovered prior to the 1964 flood.<br />
In the early 1960s, the intensity of road building and timber harvest increased significantly. Since the<br />
1964 flood, the spring Chinook population has not recovered to anywhere near those former levels. It is<br />
possible that the runs in 1963 and 1964 were anomalously large, and the goal of 6,000 spring Chinook<br />
estimated for the Trinity River <strong>Restoration</strong> Program may be more reasonable to indicate recovery of the<br />
run. It is therefore appropriate to assume approximately 4,000 spring Chinook would represent recovery<br />
in the South Fork basin (J. Glase, USFWS, pers. comm., 1998; as cited in EPA 1998).<br />
Shasta-Trinity National Forest – South Fork Management Unit – June 13, 2005 - 24<br />
K (31.7)<br />
L (22.3)<br />
M (13.2)<br />
N (2.3)
Fisheries Biological Assessment/Evaluation – <strong>Hidden</strong> <strong>Valley</strong> <strong>Watershed</strong> <strong>Restoration</strong> <strong>Project</strong><br />
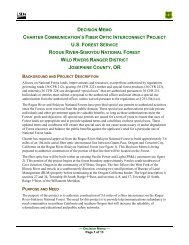
In the 16 years between 1989 and 2004, SFTR counts of adult spring-run Chinook salmon averaged 290<br />
fish annually, ranging from 1,097 fish in 1996, to 7 fish in 1989 (CDFG 2004a). During this same time<br />
period (1989-2004), Salmon River spring-run Chinook have averaged 681 fish annually, ranging from<br />
1,300 fish in 1993, to 148 fish in 1990 (Figure 7). The low number of spring-run Chinook salmon in the<br />
SFTR are largely a response to the 1964 flood, which triggered landslides that filled in holding pools and<br />
covered spawning beds (Moyle 2002).<br />
COUNT<br />
1400<br />
1200<br />
1000<br />
800<br />
600<br />
400<br />
200<br />
0<br />
1989<br />
1990<br />
1991<br />
SPRING CHINOOK SALMON IN THE SOUTH FORK TRINITY RIVER<br />
AND THE SALMON RIVER (trib to the Klamath River)<br />
1992<br />
1993<br />
1994<br />
1995<br />
1996<br />
YEAR<br />
1997<br />
1998<br />
1999<br />
Salmon River South Fork Trinity River<br />
Figure 7. Adult spring-run Chinook salmon counts for the Salmon River (Klamath River) and the South Fork<br />
Trinity River, 1989-2004. (Source: Brenda Olsen - Salmon River, CDFG 2004a).<br />
Fall Chinook escapement in the SFTR basin has not been estimated as consistently as spring Chinook.<br />
La Faunce (1967) estimated 3,337 fall Chinook in 1964, prior to the flood. No estimates were made again<br />
until the 1980s, at which time the escapement was estimated to be as low as 345 in 1990 and as high as<br />
2,640 in 1985 (Jong & Mills 1994). Because the spring Chinook run was more significantly affected than<br />
the fall run, indicators for both runs are included to provide a more rounded picture of desired conditions.<br />
For example, spring Chinook return to the basin in the spring and hold in the streams over the summer,<br />
while fall Chinook run in the fall; over-summer factors may have caused the greater decreases in the<br />
spring Chinook population. For fall Chinook, which haven’t diminished in numbers in the SFTR basin as<br />
dramatically as spring Chinook, 3,000 returning spawners is a reasonable number to indicate population<br />
recovery (J. Glase, USFWS, pers. comm., 1998; as cited in EPA 1998). Steelhead populations have been<br />
inconsistently estimated and are not considered an appropriate indicator.<br />
Higher spring Chinook escapement in the 1990s (Figure 7) may reflect the early stages of population<br />
recovery, coincident with apparent movement of sediment downstream (Matthews 1998), or it may reflect<br />
better conditions in those particular years. The current size of the spawning population, while growing, still<br />
remains at less than 10% of the run in 1963 and 1964, and less than 20% of the Trinity River <strong>Restoration</strong><br />
Program goal (4,000 fish). The diminished fish populations in the basin, which began both with the period<br />
of increased management and the record flood in the basin, are the strongest indication of impaired<br />
habitat conditions, and recovered populations will be the strongest indication of recovered habitat<br />
conditions. In the future, if salmonids naturally reproduce at numbers that are close to those observed<br />
prior to 1964, it would be reasonable to conclude that habitat conditions are adequately supporting<br />
beneficial uses. If sediment has limited habitat by aggrading the channel, then continued downstream<br />
movement of sediment would probably be required to restore the habitat conditions. However, it is also<br />
Shasta-Trinity National Forest – South Fork Management Unit – June 13, 2005 - 25<br />
2000<br />
2001<br />
2002<br />
2003<br />
2004
Fisheries Biological Assessment/Evaluation – <strong>Hidden</strong> <strong>Valley</strong> <strong>Watershed</strong> <strong>Restoration</strong> <strong>Project</strong><br />
clear that: 1) habitat recovery, in the form of normal watershed processes moving both the natural<br />
sediment load and the elevated sediment load (i.e., due to land management activities) through the<br />
stream system, is a slow process, and may not be observed for another 50 years or more; and 2) other<br />
factors, such as habitat conditions or fishing pressures outside of the SFTR basin (e.g., downstream or<br />
ocean conditions) may retard progress on recovery of the fishery even if the habitat conditions have<br />
recovered. Thus, while a recovered Chinook spawning population would indicate recovery of the<br />
beneficial use support and attainment of water quality standards more clearly than any other indicator, it<br />
is not required that the spawning population recover in order to demonstrate attainment of water quality<br />
standards, if all other targets are met (EPA 1998).<br />
Rainbow Trout and Steelhead<br />
Life History, Ecology, and Status of Klamath River Steelhead (except for specific reference to the SFTR<br />
“Local population”), was incorporated from Israel J. A. (2003).<br />
Coastal steelhead (O. mykiss irideus) in Klamath basin, have evolved multiple life history and<br />
reproductive strategies for persisting in a system where critical habitat parameters are highly variable.<br />
Klamath River steelhead are recognized to constitute two distinct reproductive ecotypes that migrate from<br />
the ocean into tributaries during different time periods (Busby et al., 1996). However, different life stages<br />
of steelhead are found in the Klamath mainstem every month of the year, including a run of immature fish<br />
(commonly referred to as the “halfpounder”) which overwinter in freshwater before returning to the ocean<br />
the following spring (USFWS, 1998). Klamath River steelhead are an anadromous form of coastal<br />
rainbow trout (O. mykiss irideus).<br />
Steelhead exhibit the largest geographic range and most complex suite of traits of any salmonid species.<br />
Steelhead share many of the characteristics of rainbow trout that contribute to their ability to adapt to<br />
systems that are highly unpredictable and undergo frequent disturbance. Particularly important<br />
characteristics of Klamath River steelhead include anadromy (emigrating to the ocean and returning to<br />
spawn in freshwater) or nonadromous freshwater residency, iteroparity (multiple spawning migrations),<br />
and natal homing. <strong>Watershed</strong> disturbances caused by agriculture, timber harvest practices, past mining<br />
and water diversions have negatively affected the fishery resources within the basin (KRBFTF, 1991).<br />
During the past century, managing salmonid species for commercial and recreational purposes have<br />
focused on artificially producing large numbers of fish in hatcheries. Natural environmental fluctuations<br />
(climatic cycles and marine conditions) have likely played less of a role in the decline of this species than<br />
these human-induced impacts. However, the Klamath River and its tributaries support the largest<br />
population of coastal steelhead remaining in California (McEwan and Jackson, 1996). Klamath River<br />
steelhead are part of the KMP ESU, which the NMFS determined was not warranted for listing under the<br />
ESA (NMFS, 2001).<br />
Life History<br />
Nonanadromous Phenotype (Coastal Rainbow trout)<br />
Coastal rainbow trout (resident) are the common wild rainbow trout in most of California, either as natural<br />
populations or through introductions in to other areas. Although the genetic identities of distinct local<br />
populations have been lost in many instances as a result of planting hatchery fish, wild strains adapted to<br />
local environmental conditions may persist (Gard and Seegrist 1965, in Moyle 2002). Some resident fish<br />
present above dams may represent landlocked versions of the original steelhead populations.<br />
O. mykiss irideus in the Klamath-Trinity River basins display one of the most diverse sets of life history<br />
patterns found in the Oncorhynchus genus. This species encompasses two distinct phenotypes.<br />
Typically, the resident form (called a rainbow or redband trout) spends their entire life in fresh water<br />
isolated above natural barriers (e.g., waterfalls, landslides, subsurface stream flows). This natural form of<br />
O. mykiss irideus is apparently uncommon in the Klamath River.<br />
Shasta-Trinity National Forest – South Fork Management Unit – June 13, 2005 - 26
Fisheries Biological Assessment/Evaluation – <strong>Hidden</strong> <strong>Valley</strong> <strong>Watershed</strong> <strong>Restoration</strong> <strong>Project</strong><br />
Residualization of steelhead progeny in the Klamath River occurs, but is poorly understood. Possible<br />
hypotheses on this phenomena include accelerated growth rate of fish in hatcheries or excessively high<br />
water temperatures downstream delaying outmigrant behavior in these fish (Healey, 1991; Viola and<br />
Schuck, 1995). Steelhead have also residualized above recent manmade barriers in the basin like<br />
Lewiston, Iron Gate, and Dwinnell Dams, although the genetic integrity of these fish is questionable given<br />
the stocking on nonnative rainbow trout into the waterbodies. These potadromous fish remain migratory<br />
and utilize tributaries to these reservoirs.<br />
The relationship of steelhead to nonanadromous Upper Klamath redband trout (O. mykiss newberri,<br />
Benhke 1992) remains unknown, although redband trout inhabit the upper Klamath basin in Oregon now<br />
isolated by dams along the mainstem. Prior to the construction of Copco Dam in 1917, steelhead<br />
migrated up to the falls at the outlet of Klamath Lake. Benhke (1992) suggested that O. mykiss irideus did<br />
not reside above this location and designated the migratory Upper Klamath trout as a separate<br />
subspecies, O. m. newberrii. Moyle (2002) suggests steelhead invaded the upper Klamath basin during<br />
the Pleistocene and nonandromous coastal rainbow trout are present above Klamath Lake. Snyder<br />
(1930) and Fortune et al. 1996 in Hardy and Addley (2001) both suggested steelhead utilized tributaries<br />
above Upper Klamath Lake. It is likely that redband trout moved downstream of the outlet falls.<br />
Anadromous Phenotype (Steelhead)<br />
The second phenotype of coastal steelhead is the more common anadromous form. In the Klamath River<br />
basin, these fish display a variety of life history patterns constituting different freshwater and saltwater<br />
rearing strategies (ODFW, 1995). The differences between these different life history patterns are not well<br />
understood, and researchers group anadromous steelhead “races” depending on the timing of adult<br />
migration into the Klamath River. The classification of different adult migratory run-timings is not agreed<br />
upon (Table 6).<br />
Table 6. Classification of different run-timings and reproductive ecotypes of steelhead found in the<br />
Klamath River basin. [As cited in Isreal (2003)]<br />
Steelhead race KRSIC (1993) Hopelain (1998) USFWS (1979) Busby et al (1996) Moyle (2002)<br />
Spring/Summer May- July March-June April-June April- June<br />
Fall August- July-October August-<br />
October<br />
November<br />
Winter November- November- November-<br />
November-<br />
February March<br />
February<br />
April<br />
Stream-maturing April- October<br />
Ocean-maturing<br />
September-March<br />
NMFS does not classify Klamath River basin steelhead “races” based on run-timing of adults, but instead<br />
recognizes two distinct reproductive ecotypes of coastal steelhead in the Klamath based upon their<br />
reproductive biology and freshwater spawning strategy (Busby et al. 1996). Burgner et al. (1992)<br />
identified the stream-maturing type as entering the river sexually immature and still requiring several<br />
months before ripening to spawning condition. In the Klamath River, Busby et al. (1996) called these<br />
summer steelhead and found they migrated upstream between April and October with a peak in spawning<br />
behavior during January. The second type, ocean-maturing, enter the Klamath River between September<br />
and March with a peak in spawning in March. These fish enter the river sexually mature and spawn<br />
shortly after reaching spawning grounds (Busby et al., 1996). The overlap in migration and spawning<br />
periods make differentiating these ecotypes difficult (Roelofs, 1983). A genetic study determined that<br />
different runs of steelhead within a particular subbasin of the Klamath-Trinity system shared more genetic<br />
similarities than populations of similar run-timings in adjacent basins (Reisenbichler et al., 1992).<br />
Before establishing feeding locations, newly hatched steelhead move to shallow, protected margins of the<br />
stream (Royal, 1972, in McEwan and Jackson, 1996). Once aggressive behavior is exhibited, territories<br />
become established and are defended (Shapovalov and Taft, 1954) in or below riffles, where food<br />
production is greatest. Moffett and Smith (1950) found steelhead fry (individuals not yet surviving a<br />
Shasta-Trinity National Forest – South Fork Management Unit – June 13, 2005 - 27
Fisheries Biological Assessment/Evaluation – <strong>Hidden</strong> <strong>Valley</strong> <strong>Watershed</strong> <strong>Restoration</strong> <strong>Project</strong><br />
winter) favored tributary streams with a peak in downstream movement during the early summer on the<br />
Trinity River. Possible physical influences leading to a decline in this behavior included decreasing river<br />
flows and increasing water temperatures. As higher flows and lower water temperatures returned to the<br />
mainstem during the late fall and winter, Moffett and Smith (1950) observed an increase in downstream<br />
movement. Steelhead parr (individuals surviving at least one winter) showed the greatest freshwater<br />
movement towards the end of their first year and spent their second year inhabiting the mainstem. The<br />
large majority of steelhead (86%) in the Klamath River basin apparently spend two years in fresh water<br />
before undergoing smoltification (the physiological process of preparing to survive in ocean conditions)<br />
and migrating to sea (Hopelain, 1998). Kesner and Barnhardt (1972) determined that steelhead rearing in<br />
fresh water for longer periods made their seaward migration more quickly. Klamath River basin steelhead<br />
remain in the ocean for one to three years before returning to spawn and their ocean migration patterns<br />
are unknown. It is believed that steelhead use their excellent homing sense to return to the same area<br />
they lived in as fry to spawn (Moyle, 2002).<br />
The presence of “half-pounder” steelhead in the Klamath River basin is a distinguishing life history trait of<br />
steelhead found in the KMP ESU. Half-pounder steelhead are subadults that have spent 2-4 months in<br />
the Klamath estuary or nearshore before returning to the river to overwinter. They overwinter in the lower<br />
and mid-Klamath regions before returning to the ocean the following spring. The presence of half-pound<br />
fish is uncommon above Seiad <strong>Valley</strong> (Kesner and Barnhardt, 1972). The occurrence of half-pounders<br />
was greater in spawning fish of mid-Klamath region tributaries (86-100%) when compared to the Trinity<br />
River (32-80%). There is a negative linear relationship between rates of half-pounder migration and firsttime<br />
spawning size. The lowest occurrence of half-pounders was from Lower Klamath River winter-run<br />
steelhead (17%), which also demonstrated the greatest first-year growth rate (Hopelain, 1998). The<br />
proportion of “half-pounders” that become stream- or ocean-maturing ecotypes is not known.<br />
Iteroparity (the ability to spawn more than once) is an important character of steelhead that makes them<br />
different from most all other Oncorhynchus species. Hopelain (1998) reported that repeat spawning<br />
varied between different run-timings. The frequencies of steelhead having undergone multiple<br />
reproductive events varied in range from 17.6 to 47.9% for fall run, 40.0 to 63.6% for spring run, and<br />
31.1% for winter run fish. Females make up the majority of repeat spawners (Busby et al., 1996), and lay<br />
between 200 and 12,000 eggs (Moyle, 2002). Nonandromous coastal rainbow trout typically contain<br />
fewer than 1,000 eggs, while steelhead contain about 2,000 eggs per kilogram of body weight (Moyle,<br />
2002).<br />
Habitat Utilization<br />
Steelhead require different habitats for each stage of life in the Klamath River. The abundance of<br />
steelhead in a particular location is influenced by the quantity and quality of suitable habitat, food<br />
availability, and interactions with other species. During the first couple years of freshwater residence,<br />
steelhead juveniles require cool, clear, fast-flowing water (Moyle, 2002). Although steelhead have a<br />
greater physiological tolerance than other salmonids, certain requirements must be met for a watershed<br />
to support these highly-adaptable fish, including cool water throughout their life history (Table 7). Many<br />
physiological cues during their lifecycle depend on temperatures remaining within these critical ranges.<br />
Shasta-Trinity National Forest – South Fork Management Unit – June 13, 2005 - 28
Fisheries Biological Assessment/Evaluation – <strong>Hidden</strong> <strong>Valley</strong> <strong>Watershed</strong> <strong>Restoration</strong> <strong>Project</strong><br />
Table 7. Utilized (McEwan and Jackson, 1996) and optimal (Moyle, 2002) water temperatures (°C)<br />
for various steelhead life history stages. NR= Not Reported.<br />
Life History Stage McEwan and Jackson (1996) Moyle (2002)<br />
Spawning 3.8 to 11.0 O C (38.8 to 51.8 O F) NR<br />
Incubation and emergence 8.8 to 11.0 O C (47.8 to 51.8 O F) 10 to 15 O C (50.0 to 59.0 O F)<br />
Fry and Juvenile rearing 7.2 to 11.0 O C (44.9 to 51.8 O F) 15 to 18 O C (59.0 to 64.4 O F)<br />
Smoltification 7.2 to 15.0 O C (44.9 to 59.0 O F) NR<br />
Adult migration 7.7 to 11.0 O C (45.8 to 51.8 O F) NR<br />
Summer steelhead holding 10.0 to 15.0 O C (50.0 to 59.0 O F) 10 to 15 O C (50.0 to 59.0 O F)<br />
Length of time for eggs to hatch is a function of water temperature and dissolved oxygen. Hatchery<br />
steelhead take 30 days to hatch at 10.5°F (Leitritz and Lewis, 1980 in McEwan and Jackson, 1996), and<br />
emergence from the gravel occurs after two to six weeks (Moyle, 2002; McEwan and Jackson, 1996). Egg<br />
mortality begins at 13.3°C (McEwan and Jackson, 1996).<br />
Redd construction typically occurs in gravel substrates of 0.5 to 10.0 cm in diameter (Reiser and Bjornn,<br />
1979 in Spence et al., 1996). Water velocities over the redd is between 20 and 155 cm/sec, and depths<br />
are often 10 to 150 cm (Moyle, 2002). Low levels of sedimentation (>5% sand and silt) can reduce redd<br />
survival and emergence due to decreased permeability of the substrate and dissolved oxygen<br />
concentrations available for the incubating eggs (McEwan and Jackson, 1996). Once out of the gravels,<br />
steelhead fry can survive at a greater range of temperatures, but have difficulty obtaining oxygen from the<br />
water at temperatures above 21.1°C (McEwan and Jackson, 1996). When physiologically stressed,<br />
steelhead have a more difficult time acquiring food, defending territories, avoiding predators, and are<br />
more likely to succumb to infectious diseases and parasites (Spence et al., 1996).<br />
Hawkins and Quinn (1996) found that the critical swimming velocity for juvenile steelhead was 7.69 body<br />
lengths/sec compared to juvenile cutthroat trout that moved between 5.58 and 6.69 body lengths/sec.<br />
Adult steelhead swimming ability is hindered at water velocities above 3 to 3.9m/sec (Reiser and Bjornn,<br />
1979 in Spence et al., 1996). Preferred holding velocities are much slower, and range from 0.19m/sec for<br />
juveniles and 0.28m/sec for adults (Moyle and Baltz, 1985). Physical structure like boulder, large woody<br />
debris, and undercut banks create hydraulic heterogeneity that increase the habitat available for<br />
steelhead in the form of cover from predators, visual separation of juvenile territories, and refuge during<br />
high flows (Everest et al., 1985). Reiser and Peacock (1985 in Spence et al., 1996) reported the<br />
maximum leaping ability of steelhead to be 3.4m and they require water approximately 18cm deep for<br />
passage (Bjornn and Reiser 1991, in Spence et al., 1996).<br />
Summer steelhead do not utilize the majority of Klamath River tributaries like the more common fall and<br />
winter steelhead. In particular, summer steelhead utilize Red Cap, Bluff, Elk, Dillon, Clear, Wooley, and<br />
Canyon Creeks and the Salmon, North and South Fork Trinity and New River. These rivers drain portions<br />
of the Klamath and Trinity Mountains providing deep pools for refugia through the summer for subadults<br />
to mature sexually. Nielsen and Lisle (1994) found coldwater pockets in these thermally-stratified pools to<br />
be 3.5°C cooler than midday ambient stream tempertures of 36-29°C. In the New River, summer<br />
steelhead were found to occupy covered areas under bedrock ledges and boulders. Densities of these<br />
fish were highest where water velocities averaged 9.3cm/sec (Nakamoto, 1994).<br />
Growth rate and feeding habitats<br />
The growth rate of steelhead is quite rapid after emergence and by the end of the first year individuals<br />
can reach between 10 and 12 cm (Moyle, 2002). Increased water temperature, which is one factor<br />
influencing production of aquatic invertebrates (Allan, 1995), accelerates growth rates until early fall<br />
(Moffett and Smith, 1950). By the end of the second year, steelhead are often 16 to 17 cm in length and<br />
Shasta-Trinity National Forest – South Fork Management Unit – June 13, 2005 - 29
Fisheries Biological Assessment/Evaluation – <strong>Hidden</strong> <strong>Valley</strong> <strong>Watershed</strong> <strong>Restoration</strong> <strong>Project</strong><br />
sustain a short growth spurt during their third spring to prepare them for smoltification (Moyle, 2002).<br />
Smolts from Klamath River subbasins known to contain fall-runs of steelhead entered the ocean at 21-23<br />
cm (Hopelain, 1998). Feeding habits of steelhead varied through the different periods of their life,<br />
although mean growth rates in juveniles were similar between run-timings and tributaries (Hopelain,<br />
1998). In general, trout seem to specialize on an aquatic organism or terrestrial bug of choice, although<br />
they also seem to be somewhat opportunistic (Moyle, 2002). In April, Trinity River steelhead were found<br />
with ants in their stomachs (Boles, 1990). As they grow, their diets change to include larger prey, with fish<br />
being more important to nonandromous trout than parr preparing for smoltification. Kesner and Barnhardt<br />
(1972) observed Trichoptera larvae to be the primary food found in half-pounder steelhead stomachs.<br />
They also determined that half-pounders more frequently contained food in their stomachs compared to<br />
steelhead on a spawning migration.<br />
Community associations and species interactions<br />
Steelhead trout are found in two distinct assemblages depending on their phenotype (Moyle, 2002). O.<br />
mykiss irideus are found above and below barriers to anadromy. Above barriers in cold, fast-moving<br />
tributaries in the Lower Klamath River coastal rainbow trout are found alone or with coastal cutthroat trout<br />
(Moyle, 2002). The anadromous form of rainbow trout are found in an assemblage that includes other<br />
salmon, Klamath smallscale suckers, speckled dace, and marbled sculpin species in the Klamath River.<br />
This species association is a product of the physical landscape as well as interspecies interactions<br />
between fish. Potentially, environmental fluctuations keep the populations of each species from reaching<br />
a size where competition and territoriality is important (Moyle, 2002). Alternatively, in the reaches of<br />
streams where this diverse assemblage is observed, a high degree of habitat heterogeneity allows<br />
segregation of species into microhabitats and may eliminate interspecies interactions. In the presence of<br />
other juvenile salmonids (coho and Chinook), steelhead have been observed to distribute themselves in<br />
microhabitats different from the other species (Everest and Chapman, 1972). Steelhead are successful<br />
competitors and can display aggressive behavior to defend territories (Jenkins 1969, in Moyle, 2002).<br />
Juvenile rainbow trout have a positive interaction with suckers in the Sacramento River, and possibly form<br />
the same relationship in the Klamath River. In the Sacramento, juveniles were observed to follow large<br />
suckers around and feed on invertebrates disturbed by the suckers feeding (Baltz and Moyle, 1984).<br />
Studies of intraspecies interactions have reported steelhead segregating themselves spatially within the<br />
same stream into microhabitats (Moyle, 2002; Keeley and McPhail, 1998). However little is known about<br />
the relationship between different cohorts, including half-pounders, in the Klamath River. In one study on<br />
a coastal California stream (Harvey and Nakamoto, 1997), the intraspecific interactions among different<br />
cohorts were dependent on the habitat occupied by the fish. In deep water, Harvey and Nakamoto (1997)<br />
observed larger steelhead in the presence of small steelhead to grow faster than when these fish were<br />
observed together in shallow waters. Food availability has a larger impact on territory size than body size,<br />
and juvenile steelhead were observed to intrude into adjacent steelhead territories to capture food<br />
(Keeley and McPhail, 1998). Moffett and Smith (1950) observed schools of steelhead parr in the thalweg<br />
along the bottom during extended winter dry periods on the Trinity River. This may be favored habitat<br />
because this deeper, faster water contains more invertebrate drift (Britain and Eikeland 1988) and offers<br />
greater protection from predators.<br />
Status<br />
No long-term data is available to evaluate Klamath River steelhead population trends. The California Fish<br />
and Wildlife Plan (1965) estimated a basin wide annual run size of 283,000 adult steelhead (spawning<br />
escapement + harvest). Busby et al. (1994) reported winter steelhead runs in the basin to be 222,000<br />
during the 1960’s. Based on creel and gill net harvest data (Hopelain, 2001), the winter-run steelhead<br />
population was estimated at 10,000 to 30,000 adults annually in the early 1980’s. Population estimates of<br />
summer steelhead have also declined precipitously during the 1990’s. The apparent decrease in<br />
population size of steelhead in the Klamath River has multiple causes. Main factors impacting steelhead<br />
in the Klamath Basin include hatcheries, harvest, hydroelectric operations, and human impacts.<br />
Shasta-Trinity National Forest – South Fork Management Unit – June 13, 2005 - 30
Hatcheries<br />
Fisheries Biological Assessment/Evaluation – <strong>Hidden</strong> <strong>Valley</strong> <strong>Watershed</strong> <strong>Restoration</strong> <strong>Project</strong><br />
Two hatcheries are currently operated by the CDFG as mitigation for lost habitat beyond Iron Gate and<br />
Lewiston Dams. While hatchery production has primarily relied upon native broodstock, numerous<br />
transfers of fish from outside the basin are documented. Prior to 1973, transfers came from the<br />
Sacramento, Willamette, Mad and Eel Rivers (Busby et al., 1996). Since the length of freshwater<br />
occupancy of juvenile Klamath River steelhead is long, wild fish are at a potentially increased risk from<br />
hatcheries. About 1,000,000 smolts per year are produced by the two hatcheries (Busby et al., 1994 in<br />
Moyle 2002).<br />
Historic returns of steelhead to both Iron Gate and Trinity River hatcheries do not seem correlated. No<br />
studies have been carried out to evaluate the impact of hatcheries releases on wild steelhead and other<br />
salmonids in the Klamath River, but studies elsewhere have shown that releases of large numbers of fish<br />
result in negative competitive interactions between wild steelhead and hatchery fish for food, habitat, and<br />
mates (Nickelson et al., 1986). Also, carrying capacity of rivers is often exceeded during the outmigration<br />
of hatchery smolts decreasing food availability (Steward and Bjornn, 1990 in Spence et al 1996).<br />
Hatchery steelhead have been documented to displace a large percentage of wild steelhead (79%,<br />
McMichael et al., 1999).<br />
Other risks from hatcheries include disease transmission (Steward and Bjornn, 1990 in Spence et al.,<br />
1996), alterations of migration behavior in wild fish (Hillman and Mullen, 1989 in Spence et al., 1996), and<br />
genetic changes in the wild population (Waples, 1991). The behavioral and genetic interactions of<br />
residualized hatchery steelhead wild steelhead on the Klamath River has not been evaluated but is<br />
recognized as an issue requiring attention (CDFG, 2001).<br />
Currently, sport fishery regulation prohibits take of wild winter steelhead and does not allow fishing of<br />
summer steelhead. Poaching may pose a problem for these fish because of their concentration over a<br />
long period in particular locations (Eric Gerstung, pers. Comm. in McEwan and Jackson, 1996).<br />
Hydroelectric Operation<br />
Iron Gate Dam (and all the other dams in the basin) breaks the upstream-downstream connectivity of the<br />
Klamath River. A primary impact to steelhead is the elimination of free passage beyond these barriers<br />
upstream to historic spawning grounds and downstream to the ocean. Another direct impact Iron Gate<br />
Dam has on Klamath River steelhead is the alteration of natural flow regimes. A river’s flow regime<br />
controls the physical and hydrological processes of a river, and therefore is responsible for habitat and<br />
food availability, temperature regimes, and the concentration of dissolved gases (Spence et al., 1996).<br />
The loss of habitat from decreased flows intensifies inter- and intraspecies competition for suitable rearing<br />
and feeding of juvenile steelhead (Spence et al., 1996). Iron Gate Dam is responsible for changes in flow<br />
impacting the temperature regime on the mainstem Klamath River. Steelhead continuously exposed to<br />
temperatures above 24°C are unable to survive (Moyle, 2002). While water from Iron Gate Dam is not<br />
released at this temperature, the quantity of water released impacts the variability of downstream water<br />
temperatures (Moyle, 2002).<br />
Human Impacts<br />
Klamath River steelhead spend considerable part of their life in the tributaries where cool, high-quality<br />
water is typically common. Recent reports have documented the degradation of this habitat and potential<br />
impacts to juvenile salmonid production (Ricker, 1997; Jong, 1997; Borok and Jong, 1997). Particular<br />
impacts caused by increased sedimentation of spawning grounds include reduction of egg survival and<br />
sac fry emergence rates. Potential impacts from upslope erosion created by logging and road<br />
construction may negatively impact steelhead spawning (Burns, 1972). In many smaller Klamath River<br />
tributaries, where impacts from these activities are greatest, steelhead rely on unimpacted habitat for<br />
supporting the production and survival of juveniles. In some subbasins, road construction and placement<br />
of culverts has created barriers to migration.<br />
Shasta-Trinity National Forest – South Fork Management Unit – June 13, 2005 - 31
Fisheries Biological Assessment/Evaluation – <strong>Hidden</strong> <strong>Valley</strong> <strong>Watershed</strong> <strong>Restoration</strong> <strong>Project</strong><br />
Agricultural and ranching land use practices can negatively impact adjacent waterbodies containing<br />
steelhead and other anadromous fish. The trampling and removal of riparian vegetation by grazing<br />
livestock destabilizes and denudes streambanks increasing sediment and temperature in the streams<br />
(Platts et al, 1991 in Spence et al., 1996). On the Klamath River, these activities have led to a reduction in<br />
canopy over the stream channel and siltation of pools necessary for juvenile rearing (Moyle, 2002).<br />
Agriculture practices can directly impact steelhead because of the massive alterations of the riparian and<br />
aquatic systems resulting from effort to increase the quantity of land converted for food production<br />
(Spence et al., 1996). This includes stream channelization, large woody debris removal, and armoring of<br />
banks (Spence et al., 1996). All of these activities homogenize the aquatic habitat to temperature and<br />
water conditions that are not favored by steelhead or other native biota, but do enhance the invasion of<br />
noindigineous fish (Harvey et al., 2002). Humans have introduced 13 exotic species in the Klamath River,<br />
although none have been observed to negatively impact steelhead. However, in other Northern California<br />
river systems, invasive species have played a role in the decline of steelhead through predation and<br />
competition (Brown and Moyle, 1991).<br />
SFTR Trends<br />
Winter-run steelhead are not at risk of extinction but their numbers are down from Historic levels. Local<br />
anglers on the SFTR have reported a substantial decline in the abundance of winter steelhead post 1964<br />
flood. This observation is consistent with findings of Rodgers (1972, 1973, as cited in PWA 1994). There<br />
are no current adult return estimates for winter-run steelhead.<br />
In the 13 years between 1989 and 2004, SFTR counts of adult summer steelhead averaged 41 fish<br />
annually, ranging from 95 fish in 1997, to 8 fish in 1991 (CDFG 2004a, Figure 8).<br />
COUNT<br />
100<br />
90<br />
80<br />
70<br />
60<br />
50<br />
40<br />
30<br />
20<br />
10<br />
0<br />
1989<br />
1990<br />
1991<br />
1992<br />
1993<br />
SOUTH FORK TRINITY RIVER<br />
1994<br />
1995<br />
1996<br />
YEAR<br />
Figure 8. Adult summer steelhead counts in the South Fork Trinity River, 1989-2004.<br />
NOAA Fisheries has reviewed the biology and ecology of West Coast Salmon and Steelhead populations<br />
and trends. NOAA Fisheries also considered available information on resident rainbow trout. Preliminary<br />
Shasta-Trinity National Forest – South Fork Management Unit – June 13, 2005 - 32<br />
1997<br />
1998<br />
1999<br />
2000<br />
2001<br />
2002<br />
2003<br />
2004
Fisheries Biological Assessment/Evaluation – <strong>Hidden</strong> <strong>Valley</strong> <strong>Watershed</strong> <strong>Restoration</strong> <strong>Project</strong><br />
conclusions are that KMP steelhead are not likely to become endangered in the foreseeable future, and<br />
that Federal ESA listing is not warranted within the KMP ESU (NOAA Fisheries 2003).<br />
Steelhead Summary<br />
Listed as a candidate for Threatened Status by NMFS in 1998, steelhead in the Klamath-Trinity basin<br />
have had their range reduced by the construction of major dams on the Klamath, Trinity, and Shasta<br />
Rivers, with further declines caused by downstream changes to channels and water temperatures from<br />
decreased flows. Poor watershed management (connected with such practices as grazing, logging, and<br />
road building) has contributed to declines as well, especially as a result of siltation of holding pools and<br />
spawning riffles and increases in water temperatures due to loss of shading. Interactions with hatchery<br />
steelhead have contributed to further declines of wild populations, as may have fisheries, including catch<br />
of steelhead in gill nets on the high seas. Fall-Winter-run steelhead are still widely distributed and fairly<br />
common in the basin, although much less abundant than formerly.<br />
Summer steelhead populations remain the most imperiled runs in the Klamath River and are holding onto<br />
a small number of key populations. In addition to all the usual causes of decline, they are exceptionally<br />
vulnerable to poaching when oversummering in pools. As a consequence, during the 1990s there were<br />
perhaps 1,000-1,500 adults divided among eight populations—less than 10 percent of their former<br />
abundance (Moyle et al. 1995, in Moyle 2002).<br />
Key elements of the Steelhead <strong>Restoration</strong> and Management Plan for California (McEwan and Jackson,<br />
1996) for the Klamath River included greater flow releases through Iron Gate and Lewiston Dams and<br />
emphasized increasing naturally produced stocks. The plan recognized the importance of protecting<br />
functioning subbasins where natural processes take precedence to human impacts causing severely<br />
degraded habitat conditions. <strong>Watershed</strong>s identified by McEwan and Jackson (1996) requiring stream<br />
restoration to benefit steelhead included the SFTR, Scott River, and Shasta Rivers.<br />
Shasta-Trinity National Forest – South Fork Management Unit – June 13, 2005 - 33
Fisheries Biological Assessment/Evaluation – <strong>Hidden</strong> <strong>Valley</strong> <strong>Watershed</strong> <strong>Restoration</strong> <strong>Project</strong><br />
IV. Environmental Baseline<br />
Upper South Fork Trinity River Subbasin Overview<br />
The SFTR basin is undammed and approximately 970 square miles in size, and is the largest tributary of<br />
the Trinity River. The terrain is predominately mountainous and forested, with only about 15 percent of<br />
the basin available for farmland, most of which occurs in the Hayfork <strong>Valley</strong>, the largest tributary of the<br />
SFTR. Elevations in the basin range from more than 7,800 feet above sea level in the headwater areas,<br />
to less than 400 feet at the confluence with the Trinity River (TCRCD 2003).<br />
Precipitation in the SFTR <strong>Watershed</strong>, as is typical of California, is highly seasonal, with 90 percent falling<br />
between October and April. Rainfall runoff dominates the hydrologic budget, although depending on<br />
location in the watershed and the water-year type, snowmelt runoff can be significant. There are few longterm<br />
annual precipitation records in the watershed, and instead records from Weaverville were used.<br />
Weaverville has a mean annual precipitation of 36.29 inches, for 1906-2001, excluding 1981-1983 during<br />
which the records are incomplete (TCRCD 2003). For Weaverville, the wettest year contained in this<br />
record is 1974, when precipitation totals reached 63.58 inches, only slightly wetter than 1998, the next<br />
highest, when 63.27 inches were recorded. The driest year at Weaverville was 1977, when only 12.57<br />
inches of precipitation were recorded.<br />
The <strong>Hidden</strong> <strong>Valley</strong>, Plummer Creek and Rattlesnake Creek <strong>Watershed</strong> Analysis Area (WAA) lies in a<br />
region of deeply dissected mountains composed principally of the unstable rock formations of the South<br />
Fork Mountain Schist, the Galice Formation, and the Rattlesnake Creek terrane. As a result, the erosion<br />
rates in the watershed and sediment loads in the SFTR are extremely high compared to most rivers. The<br />
mean annual sediment discharge reported in a 1972 study was 1,650 tons/mile 2 for the SFTR for the<br />
period 1940 to 1965 (SCS 1972, in PWA 1994). In comparison, at two locations in the Klamath Mountain<br />
Province, the North Fork of the Trinity River at Helena had an annual suspended sediment yield of 210<br />
tons/mi 2 and the Trinity River at Lewiston had an annual suspended sediment yield of 160 tons/mile 2<br />
(Hawley and Jones 1969, in PWA 1994).<br />
The SFTR has been the subject of several studies following the 1964 flood, which was the largest on<br />
record. Following the flood, fish populations declined severely and currently remain below pre-flood<br />
levels. The continued high rates of erosion and sedimentation are considered a major contributor to the<br />
depressed anadromous fish runs in the river basin (PWA 1994). The SFTR has one of the highest<br />
sediment loads in northern California. The high sediment loads have been attributed to unstable geology,<br />
management activities, and storm activity (Raines 1998).<br />
In 1994, the SFTR was added to the Clean Water Act §303(d) list for sediment impairment triggering the<br />
development of a TMDL that was completed in 1998. In support of the TMDL, a detailed sediment source<br />
analysis was completed for the SFTR basin (Raines 1998), which included <strong>Hidden</strong> <strong>Valley</strong>, Plummer<br />
Creek, and Rattlesnake Creek watersheds. Raines (1998) used aerial photographs dating from 1944 to<br />
1990 to map landslides and mass wasting features, used road survey data with a GIS-based model<br />
(SEDMOD) to estimate road erosion rates, estimated erosion rates applied to the harvest history of<br />
upland areas to estimate hillslope erosion rates, and existing river data to estimate stream bank erosion<br />
rates.<br />
The sediment source analysis (Raines 1998) divided the entire SFTR watershed into three main<br />
subdivisions, and also into the smaller planning watersheds delineated by the Forest Service. The WAA<br />
falls into the Upper SFTR subdivision, which includes the planning watersheds above Hyampom to the<br />
headwaters and excludes the Hayfork Creek subdivision. The results from this subdivision can<br />
reasonably be applied to <strong>Hidden</strong> <strong>Valley</strong>, Plummer Creek, and Rattlesnake Creek watersheds since the<br />
geology, land management, and ecosystem processes are relatively similar throughout the whole<br />
subdivision (Foster-Wheeler 2001).<br />
Shasta-Trinity National Forest – South Fork Management Unit – June 13, 2005 - 34
Fisheries Biological Assessment/Evaluation – <strong>Hidden</strong> <strong>Valley</strong> <strong>Watershed</strong> <strong>Restoration</strong> <strong>Project</strong><br />
The study divided the sediment sources into management-related and non-management-related sources,<br />
and three time periods based on aerial photograph availability and major changes in watershed activity.<br />
The first period was from 1944 to 1960, when timber harvest began in the basin; 1961 to 1975, when<br />
timber harvest was increased with pre-forest practices regulation and the largest storm event on record<br />
occurred; and 1976 to 1990, when timber harvest increased under newer regulations, and wildfires<br />
[Plummer and Rattlesnake watersheds] and three major floods occurred (Foster-Wheeler 2001).<br />
Figure 9 shows the sources of sediment in the Upper SFTR subbasin from 1944 to 1990 and their relative<br />
contributions. Non-management sediment sources accounted for two thirds of the sediment supply in the<br />
Upper SFTR subbasin, and non-management related mass wasting contributed half of the total sediment<br />
to the SFTR (Foster-Wheeler 2001). Non-management related bank erosion accounted for 14 percent of<br />
the total sediment supply and road related erosion contributed 17 percent of the sediment supply. It<br />
should be noted that the separation of sediment loads into management- and non-management-related is<br />
somewhat arbitrary and difficult to estimate. For example, timber harvesting could increase peak flows,<br />
which in turn could increase the rate of inner gorge mass wasting (USFS 2000), which would not be<br />
considered management-related by Raines (1998). The results of the Raines (1998) report are based on<br />
a combination of methods to assess sediment delivery including aerial photo interpretation (for largescale<br />
mass wasting), complex numerical modeling (SEDMOD model for road erosion and delivery), and<br />
numeric estimates (for streambank erosion and surface erosion). Results from this study should be<br />
interpreted by keeping in mind the complexity of geomorphic responses and the differing methods used<br />
(Foster-Wheeler 2001).<br />
Figure 9. Sources of Sediment in the Upper South Fork subbasin of the Trinity River, 1944 to 1990.<br />
Source: Foster-Wheeler (2001) as adapted from EPA (1998).<br />
Mass wasting is the principal source of sediment in the SFTR basin accounting for 61 percent of the<br />
sediment supply to the SFTR, including road-related mass wasting (Figure 9). The underlying geology of<br />
the landscape determines the type and prevalence of landslides in the WAA (Foster-Wheeler 2001). The<br />
SFTR flows through a steep inner gorge composed of the Galice Formation, which is structurally weak<br />
and prone to shallow landslides. Although the Galice Formation underlies a relatively small portion of the<br />
Shasta-Trinity National Forest – South Fork Management Unit – June 13, 2005 - 35
Fisheries Biological Assessment/Evaluation – <strong>Hidden</strong> <strong>Valley</strong> <strong>Watershed</strong> <strong>Restoration</strong> <strong>Project</strong><br />
WAA, it is a major source of sediment to the SFTR since the river flows through the formation most of the<br />
length of the WAA (Foster-Wheeler 2001).<br />
The east-side of South Fork Mountain in the <strong>Hidden</strong> <strong>Valley</strong> watershed is underlain by the South Fork<br />
Mountain Schist, which is prone to deep-seated rotational-translational and block-glide landslides. Nearly<br />
the entire eastern slope of the mountain is covered by nested dormant rotational-translational slides<br />
(Foster-Wheeler 2001). Due to this inherent instability, the entire area was given an “Extreme” rating in<br />
the Instability and Erosion Hazard map by the California Department of Water Resources during sediment<br />
investigation in 1992 (Foster-Wheeler 2001).<br />
The Rattlesnake Creek Terrane, which dominates Rattlesnake Creek and parts of Plummer Creek<br />
watersheds, has abundant inactive and ancient landslides composing 13 percent of the landscape, but is<br />
more stable than the Galice Formation or South Fork Mountain Schist. The Galice and South Fork<br />
Mountain Schist in the <strong>Hidden</strong> <strong>Valley</strong> watershed are the most prone to landsliding, with double the<br />
landslide density of Plummer Creek and Rattlesnake Creek watersheds (Foster-Wheeler 2001).<br />
The type and location of the landslide influences whether it will deliver sediment to the river (Foster-<br />
Wheeler 2001). Raines (1998) divided landslides into landslide type by combined geologic unit, slope<br />
position and size class. Five size classes were delineated on aerial photos, and measured in the field.<br />
Results from the study are summarized in Table 8. Table 9 shows the percentage of each landslide type<br />
contributing sediment by geologic type for the SFTR basin, which includes watersheds to the north and<br />
south of the WAA. Most of sediment was from shallow debris slides in the Galice Formation, which the<br />
SFTR flows through in the majority of the WAA (Foster-Wheeler 2001).<br />
Table 8. Landslide Size Classes and Delivered Volumes for the SFTR Basin.<br />
Source: Foster-Wheeler (2001) as adapted from Raines (1998).<br />
Landslide Mean Volume<br />
Size Class (yd 3 Standard Median<br />
) Deviation Volume (yd 3 No. of<br />
) Measurements<br />
1 1,706 1,201 1,378 34<br />
2 6,607 5,476 5,385 44<br />
3 15,581 13,424 10,932 40<br />
4 77,370 62,716 50,925 16<br />
5 261,324 428,702 100,000 9<br />
Table 9. Landslide Types by Combined Geologic Unit for SFTR Basin.<br />
Source: Foster-Wheeler (2001) as adapted from Raines (1998).<br />
Combined<br />
Geologic Unit<br />
Igneous %<br />
volcanics (DG)<br />
Franciscan &<br />
affiliated (FR)<br />
Galice Formation<br />
(JG)<br />
Rattlesnake Ck.<br />
Terrane (RC)<br />
S.F. Mountain<br />
Schist (SC)<br />
Complex slides, slumps, Shallow rapid/ Debris Rock fall/<br />
large deep-seated (%) debris slides (%) torrent (%) talus (%)<br />
54.2 40.8 5.0 0.0<br />
7.8 82.0 10.1 0.1<br />
22.7 74.4 2.9 0.1<br />
31.4 65.6 0.0 3.0<br />
5.6 85.2 8.6 0.6<br />
Shasta-Trinity National Forest – South Fork Management Unit – June 13, 2005 - 36
<strong>Project</strong> Area<br />
Fisheries Biological Assessment/Evaluation – <strong>Hidden</strong> <strong>Valley</strong> <strong>Watershed</strong> <strong>Restoration</strong> <strong>Project</strong><br />
The drainage system of the <strong>Hidden</strong> <strong>Valley</strong> 5 th field watershed (HUC 1801021202, 46,264 acres) is<br />
composed of facial streams originating from the eastern slope of South Fork Mountain on the STNF.<br />
These facial drainages flow directly into the SFTR between Hyampom (River kilometer 50.0) and Forest<br />
Glenn (Rkm 89.5). And, with the exception of the first 150-feet in the largest facial drainages, all streams<br />
within the <strong>Project</strong> area are non-fish bearing.<br />
Cummulative <strong>Watershed</strong> Effects (CWE) analysis by Forest Service hydrologist Jim Fitzgerald (Fitzgerald<br />
2005) provided the baseline conditions for <strong>Project</strong> area 7 th field watersheds (Cave Creek-Swift Creek,<br />
Little Bear Wallow Creek-<strong>Hidden</strong> <strong>Valley</strong>, Miller Springs, McClellen-South Fork, Trinity River, Hitchcock<br />
Creek-Oak Flat, Wintoon Flat-Deep Gulch). <strong>Watershed</strong> Analysis describing the <strong>Project</strong> area is<br />
incorporated within a broader WAA which includes descriptions of the <strong>Hidden</strong> <strong>Valley</strong>, Plummer Creek and<br />
Rattlesnake Creek 5 th field watersheds. <strong>Project</strong> area characterization is taken from Chapter 3 “Current<br />
Conditions” of the WA. Unless otherwise noted, applicable tables, figures, and text were incorporated<br />
directly from the WA. A small portion of <strong>Project</strong> activities occur in the Plummer 5 th field watershed<br />
(ridgeline roads 1N05C, 1S14F, U1N05E, UV1S14FA) and information for this watershed was retained.<br />
Temperature: Functioning At Risk<br />
The USFS maintains water temperature sites adjacent to the <strong>Project</strong> area. Data include maximum daily<br />
average, maximum weekly average, maximum temperature, and 7-day running maximum average<br />
temperature during the warmest periods, generally June through August. Water temperatures have been<br />
measured in the main channel of SFTR above Forest Glen, at Hyampom upstream of the confluence of<br />
Hayfork Creek; and in Glenn Creek (surrogate for <strong>Hidden</strong> <strong>Valley</strong> facial drainage water temperatures).<br />
Daily high water temperatures exceeding 69 °F were common in the mainstem SFTR from approximately<br />
mid-May through September/October each year temperatures were recorded (Table 10). The general<br />
north-south orientation of the SFTR, and long periods of direct solar radiation and is largely responsible<br />
for increased temperatures of the mainstem SFTR (Farber et al. 1998). Daily high water temperatures<br />
approach, and in some years (2001) exceed 80 °F during the same May through September/October<br />
period in the mainstem SFTR at Hyampom (Table 11).<br />
Table 10. SFTR Water Temperatures at Forest Glen. Source: FS unpublished data.<br />
Year # of days<br />
measured<br />
Beginning<br />
of Record<br />
End of<br />
Record<br />
Max<br />
Daily Avg<br />
(°F)<br />
Max<br />
Weekly<br />
Avg (°F)<br />
Max<br />
Temp<br />
(°F)<br />
Max Weekly<br />
Maximum<br />
(°F)<br />
Max Weekly<br />
Diurnal<br />
Fluctuation (°F)<br />
1994 100 07/15/94 10/23/94 73.8 72.8 79.8 78.4 11.0<br />
1997 137 05/21/97 10/05/97 72.2 71.1 77.5 76.3 9.3<br />
1999 147 06/17/99 11/11/99 68.9 66.8 72.4 71.1 8.4<br />
2002 125 06/11/02 10/14/02 72.0 71.3 76.1 75.4 9.9<br />
2003 108 06/13/03 09/29/03 72.9 71.3 75.9 74.3 7.1<br />
2004 153 05/07/04 10/06/97 72.5 71.9 76.2 75.5 8.4<br />
Avg 72.1 70.9 76.3 75.2 9.0<br />
Median 72.4 71.3 76.2 75.5 8.8<br />
Stdev<br />
1.7 2.1 2.4 2.4 1.4<br />
Shasta-Trinity National Forest – South Fork Management Unit – June 13, 2005 - 37
Fisheries Biological Assessment/Evaluation – <strong>Hidden</strong> <strong>Valley</strong> <strong>Watershed</strong> <strong>Restoration</strong> <strong>Project</strong><br />
Table 11. SFTR Water Temperatures at Hyampom (upstream of Hayfork Creek).<br />
Source: FS unpublished data.<br />
Year # of days<br />
measured<br />
Beginning<br />
of Record<br />
End of<br />
Record<br />
Max<br />
Daily<br />
Avg (°F)<br />
Max<br />
Weekly<br />
Avg (°F)<br />
Max<br />
Temp<br />
(°F)<br />
Max Weekly<br />
Maximum<br />
(°F)<br />
Max Weekly<br />
Diurnal<br />
Fluctuation<br />
(°F)<br />
1999 145 06/19/99 11/11/99 72.6 70.4 76.8 75.0 8.9<br />
2000 152 06/21/00 11/20/00 75.0 74.6 79.7 79.0 8.5<br />
2001 159 05/23/01 10/29/01 76.5 75.3 82.6 80.9 11.4<br />
2002 69 06/07/02 08/15/02 75.6 74.8 78.7 77.6 9.0<br />
2003 109 06/18/03 10/05/03 76.9 75.7 79.2 78.2 8.8<br />
2004 106 06/28/04 10/12/04 76.8 76.2 79.2 78.6 5.8<br />
Avg 75.6 74.5 79.4 78.2 8.7<br />
Median 76.1 75.1 79.2 78.4 8.8<br />
Stdev<br />
1.7 2.1 1.9 1.9 1.8<br />
In addition, the USFS collected water temperature data in the mainstem SFTR below Butter Creek and<br />
Cave Creek in 1992 (Foster-Wheeler 2001). During the months of July and August 1992 the maximum<br />
water temperatures ranged from 65 to 78°F (18 to 26°C), with minimums of 57 to 70°F (14 to 21°C).<br />
These mainstem temperatures show stressful conditions exist for salmonids during the summer months.<br />
Rattlesnake Creek water temperatures, upstream of Flume Creek, were recorded in 1990 (USFS 1991,<br />
cited in Foster-Wheeler 2001). During the months of July and August 1990 the maximum water<br />
temperatures in Rattlesnake Creek ranged from 60 to 71°F (16 to 22°C), with minimums of 57 to 65°F (14<br />
to 18°C). The mixing of tributary water into larger streams can affect water temperatures in the receiving<br />
water. Farber et al. (1998) determined that Rattlesnake Creek was able to cool the SFTR water<br />
temperature by 0.4°C and Cave Creek by 0.1°C, but these small temperature influences quickly diminish<br />
downstream. However, the mouths of these cooler tributaries provide very important cool water refugia for<br />
salmonids during periods of high water temperatures (Foster-Wheeler 2001).<br />
Farber et al. (1998) analyzed SFTR water temperatures for the U.S. Environmental Protection Agency<br />
and the North Coast Regional Water Quality Control Board for their consideration during the development<br />
of the SFTR TMDL. Like many large watersheds the SFTR flows begin as small headwater streams at<br />
high elevations and ends at the confluence with the Trinity River as a wide lower elevation river. The<br />
SFTR like many rivers increases in width due to river flow and due to historic geomorphology processes.<br />
As river width increases the ability of topography and riparian canopy closure to shade the surface of the<br />
water diminishes to the point where it is no longer a factor. The general flow of the SFTR is from the<br />
south to the north. This is significant because this maximizes the amount of direct solar radiation that<br />
strikes the exposed water surface. As a large river system flows from high elevation where air<br />
temperatures are cooler to lower elevation where air temperatures are warmer the water temperature is<br />
constantly reaching equilibrium with the air temperature (Farber et al. 1998). Many researchers have<br />
found increase water temperatures as a function of lower elevations and subsequent high air<br />
temperatures (Sullivan et al 1990, in Farber et al. (1998). The result is a steady increase in water<br />
temperature as the SFTR flows from its headwaters in the Yolla Bolly Wilderness to the confluence with<br />
the Trinity River (Figure 10). Table 12 is a location key for Figure 10).<br />
Shasta-Trinity National Forest – South Fork Management Unit – June 13, 2005 - 38
Fisheries Biological Assessment/Evaluation – <strong>Hidden</strong> <strong>Valley</strong> <strong>Watershed</strong> <strong>Restoration</strong> <strong>Project</strong><br />
Figure 10. Mainstem Maximum Weekly Average Temperatures from Headwaters to the confluence with the<br />
Trinity River. Source: Farber et al. (1998).<br />
Table 12. Location key for Figure 10. Source: Farber et al. (1998).<br />
River<br />
Kilometer<br />
Recorder Site Name<br />
2 Above Confluence with Trinity River<br />
19 Below Grouse Creek<br />
41 At Slide Creek (below Hyampom)<br />
55 Below Butter Creek<br />
67 At Plummer Creek<br />
81 Below Hwy 36 (Forest Glen)<br />
95 Above Smoky Creek<br />
104 At 30 Road Bridge<br />
117 Above Powell Creek (in Yolla Bolly Wilderness)<br />
Farber et al. (1998) felt the temporal and spatial understanding of stream temperatures in the SFTR<br />
watershed support the following conclusions:<br />
Historical pre-1964 flood data indicates that the SFTR mainstem maximum water temperatures<br />
exceeded 22°C (72.0°F).<br />
Historic pre-1964 flood water temperatures recorded throughout Northern California shows that<br />
water temperatures in the range of 20-30°C (68.4-86.6°F) were prevalent.<br />
Historical pre-1964 flood water temperatures demonstrate that the SFTR mainstem has never<br />
supported maximum water temperatures below 20°C (68.4°F) in previous 50 years.<br />
A range of natural variability is defined by the water temperatures found in the Yolla Bolla<br />
Wilderness of 16.6°C (62.2°F) and the North Fork Trinity River of 22.2°C (72.4°F).<br />
Average daily air and water temperatures are highly correlated (R2 = 0.93).<br />
Shasta-Trinity National Forest – South Fork Management Unit – June 13, 2005 - 39
Fisheries Biological Assessment/Evaluation – <strong>Hidden</strong> <strong>Valley</strong> <strong>Watershed</strong> <strong>Restoration</strong> <strong>Project</strong><br />
Few tributaries to the SFTR have water temperatures outside the natural range of variability found<br />
within the SFTR watershed.<br />
Many mainstem water temperatures exceed 20°C (68.4°F) yet fall within the historic and natural<br />
range of variability found within SFTR watershed.<br />
It appears that the SFTR water temperatures are primarily controlled by topographic (elevation)<br />
and geomorphic characteristics (channel width).<br />
Water temperatures in the SFTR appear to be not influenced by tributary streams as no heating or<br />
cooling occurs immediately downstream of tributaries. [see comment under Refugia]<br />
Glen Creek (near Forest Glen), used a surrogate water temperatures in the <strong>Hidden</strong> <strong>Valley</strong> facial streams<br />
is Properly Functioning. Daily high water temperatures are significantly less then 69 °F (Table 13).<br />
Table 13. Water Temperatures for Glen Creek (2001-2004). Source: FS unpublished data.<br />
Year # of days<br />
measured<br />
Beginning<br />
of Record<br />
End of<br />
Record<br />
Max Daily<br />
Avg (°F)<br />
Max<br />
Weekly<br />
Avg (°F)<br />
Max<br />
Temp<br />
(°F)<br />
Max<br />
Weekly<br />
Maximum<br />
(°F)<br />
Max Weekly<br />
Diurnal<br />
Fluctuation<br />
(°F)<br />
2001 200 04/12/01 10/29/01 60.3 59.4 61.9 61.0 6.0<br />
2002 146 05/22/02 10/15/02 61.2 60.3 62.8 62.0 5.3<br />
2003 121 05/31/03 09/29/03 62.4 61.7 63.9 63.0 5.1<br />
2004 152 05/07/04 10/06/04 60.3 59.8 61.6 61.1 4.6<br />
Avg 61.1 60.3 62.6 61.8 5.2<br />
Median 60.8 60.1 62.3 61.6 5.2<br />
Stdev<br />
1.0 1.0 1.0 0.9 0.6<br />
Turbidity: At Risk<br />
Mike Dean (CDFG Fishery Biologist) in a August 1993 memo to Richard Irizarry (Forest Fishery<br />
Biologist), indicated that the SFTR turbidity resulting from Hitchcock Creek was very heavy and had<br />
created a delta at its confluence with the SFTR about 10 feet deep and extending 60 feet into the SFTR.<br />
Adult surveys were cancelled below Hitchcock Creek on the SFTR because the presence of fish could not<br />
be effectively documented owing to poor visibility. Donald Haskins (Forest Geologist) provided the<br />
following characterization of Hitchcock Creek:<br />
“Those creeks have historically given us [Forest Service] major problems, with Hitchcock Creek being the<br />
worst historically. Landslide activity historically began in earnest in 1964 on privately owned logged-over<br />
lands high in the watershed. These landslides contributed to debris torrents down Hitchcock Creek which<br />
scoured the inner gorges of three tributaries of Hitchcock Creek the whole way down to the SFTR. This<br />
activity resulted in extensive destabilization of the inner gorge, especially within the South Fork Mountain<br />
Fault Zone, at the lower portion of the drainage. Wholesale landslide reactivation last occurred in the<br />
Hitchcock Creek in 1983, during the last period of extensive precipitation. Alders have come back well over<br />
the last 15 years.”<br />
Depth-integrated turbidity and suspended sediment sampling was conducted in the action area for water<br />
years 2001, 2002, and 2003 (TCRCD 2003). All three years were classified “normal water years” (Jim<br />
Fitzgerald, Personal Comm., 2005). Measurements collected at Forest Glen range from 48 to 162 NTUs<br />
(TCRCD 2003). SFTR measurements collected downstream of Hyampom, range from 3 to 605 NTUs<br />
(TCRCD 2003).<br />
Within the action area, there is substantial background sediment discharge from naturally occuring mass<br />
wasting features that were exacerbated by upslope timber harvest on private lands (Fitzgerald 2005).<br />
Most notable are slides on Hitchcock and Sulphur Glade creeks that annually turn the mainstem SFTR<br />
turbid from April through June. These slides mainly produce silt to clay size sediment (Photo 1). Periodic<br />
Shasta-Trinity National Forest – South Fork Management Unit – June 13, 2005 - 40
Fisheries Biological Assessment/Evaluation – <strong>Hidden</strong> <strong>Valley</strong> <strong>Watershed</strong> <strong>Restoration</strong> <strong>Project</strong><br />
suspended sediment samples are taken from these features to measure sediment input. The most recent<br />
(June 2003) measured suspended sediment concentration of the SFTR above the Sulphur Glade slide<br />
was 0.51 mg/l and 91.7 mg/l below the slide. An estimated flow in the SFTR was 200 cfs, and 0.6 cfs for<br />
Sulphur Glade. This material remains in suspension for several miles below the slide, sometimes all the<br />
way to the mainstem Trinity River. During discharge, the slide itself has a measured suspended sediment<br />
concentration of 36,885 mg/l. For an average season this slide can yield up to 6000 tons of fine sediment<br />
(Fitzgerald 2005). Suspended sediment concentration of 91.75 (mg/l) approximately correspondes to 55<br />
NTU (Figure11).<br />
Photo 1. South Fork Mountain Schist. Sediment delivered to the SFTR (~Rkm 61) from Sulphur Glade Creek<br />
slide (Source: Fitzgerald 2005).<br />
Shasta-Trinity National Forest – South Fork Management Unit – June 13, 2005 - 41
Fisheries Biological Assessment/Evaluation – <strong>Hidden</strong> <strong>Valley</strong> <strong>Watershed</strong> <strong>Restoration</strong> <strong>Project</strong><br />
Figure 11. Suspended Sediment Concentration vs. Turbidity for water years 2001-2003.<br />
Source TCRCD (2003).<br />
Chemical Contamination: Properly Functioning<br />
There is little opportunity for chemical contamination to occur in the <strong>Project</strong> area due largely to the<br />
uninhabited remoteness and relatively steep forested landscape. There is no evidence for such having<br />
occurred historically.<br />
Physical Barriers: Properly Functioning<br />
The only barriers limiting anadromous fish access into <strong>Hidden</strong> <strong>Valley</strong> tributaries are natural barriers<br />
located at or near (within 150-feet) the confluence of the SFTR. Foster-Wheeler (2001) in error depicts<br />
the <strong>Hidden</strong> <strong>Valley</strong> watershed as being fish bearing to a greater extent then it actually is. This was due to<br />
inaccuracies in the Forest Service GIS corporate fish layer utilized by Foster-Wheeler at the time the<br />
watershed analysis was compiled.<br />
Sulphur Glade Creek was surveyed by the USFS (1979) to assess fisheries resources. The surveyors<br />
found it to be a small perennial stream with side slopes in excess of 100 percent. Stream gradients<br />
ranged from 15 to 25 percent, with a short reach of three percent near its mouth. Fish habitat was<br />
described as poor. Rainbow trout were observed only in the lower 150 feet of the stream.<br />
Glen Creek was surveyed by the USFS (1973) to assess fisheries resources. The surveyors found<br />
salmon and steelhead spawning to be limited to the lower 150 yards. Above that a series of rock falls and<br />
Shasta-Trinity National Forest – South Fork Management Unit – June 13, 2005 - 42
Fisheries Biological Assessment/Evaluation – <strong>Hidden</strong> <strong>Valley</strong> <strong>Watershed</strong> <strong>Restoration</strong> <strong>Project</strong><br />
logjams limited upstream movement. Few spawning areas were seen, and those present were in poor to<br />
fair condition. Channel stability was rated as poor, with exposed cutbanks and large slides common.<br />
Johnson Creek was surveyed by the USFS (1975) to assess fisheries resources. A complete barrier, a<br />
slick-rock, cascade-waterfall starts at the mouth and continues upstream for 100-feet.<br />
Substrate: Not Properly Functioning<br />
Large areas of the SFTR aggraded significantly following the 1964 flood, particularly in the area of the<br />
Hyampom <strong>Valley</strong> (PWA 1994, Matthews 1998; in EPA 1998). This has caused loss of instream habitat,<br />
loss of habitat complexity, degradation of the stream’s ability to effectively move sediment downstream,<br />
and excess fine sediment in pools.<br />
Mass wasting and chronic inputs of fine sediment from roads and other sources has resulted in excess<br />
fine sediment in spawning gravels, and filling of pools with fine sediment in some locations. This can limit<br />
the development of eggs into fry and can secondarily limit the production of macroinvertebrates that<br />
function as a food source for the fish (Borok and Jong 1997). SFTR mainstem substrate conditions<br />
adjacent to <strong>Hidden</strong> <strong>Valley</strong> and Plummer Creek 5 th field watersheds are presented in Table 14.<br />
Table 14. Channel Substrate Characteristics for <strong>Hidden</strong> <strong>Valley</strong>, Plummer Creek, and Rattlesnake<br />
Creek <strong>Watershed</strong>s <strong>Watershed</strong> (Source USDA Forest Service, 2001).<br />
<strong>Watershed</strong><br />
<strong>Hidden</strong> <strong>Valley</strong> 2 Plummer 3 Rattlesnake 4<br />
Substrate<br />
Composition &<br />
Embeddedness 1 Pools Riffles Pools Riffles Pools Riffles<br />
% Bedrock 9 2 9 6 9 9<br />
% Boulder 14 25 32 39 23 39<br />
% Cobble 13 35 19 31 23 27<br />
% Gravel 25 28 28 18 27 20<br />
% Sand 33 9 9 4.5 16 5<br />
% Fines 6 1 3 1.5 2 -<br />
% Embeddedness 42 23 38 38 27 5<br />
1. Measurements of substrate composition and embeddedness percentages are ocular qualitative estimates.<br />
2. USFS (1989a)<br />
3. USFS (1993)<br />
4 USFS (1989b)<br />
USFS. 1989a. Habitat Typing Report - South Fork Trinity River. Prepared for the USDI Bureau of Reclamation. Interagency Agreement No. 9-<br />
AA-20-08530.<br />
USFS. 1993. Plummer Creek Habitat Typing Report. Prepared for the USDI Bureau of Reclamation. Interagency Agreement No. 9-AA-20-<br />
08530.<br />
USFS. 1989b. Habitat Typing Report - Rattlesnake Creek. Prepared for the USDI Bureau of Reclamation. Interagency Agreement No. 9-AA-<br />
20-08530.<br />
A reach of the SFTR from Eltapom Creek (5 miles downstream from Hayfork Creek) upstream to the East<br />
Fork Trinity River was habitat typed in 1989 (USFS 1989a). This reach encompasses the <strong>Hidden</strong> <strong>Valley</strong><br />
portion of the SFTR. Flatwater habitat types (runs, glides, step runs, pocket waters, and edgewater) were<br />
the dominant habitat types, with 58 percent of the survey length. Riffles (low gradient riffles, high gradient<br />
riffles, and cascades) were the second most common, with 25 percent of survey length. Pools (backwater,<br />
scour, corner, and mid-channel pools) were the least common types, with 16.5 percent of the survey<br />
length. Log and rootwad scour pools accounted for only 8 of the 1,142 habitat units surveyed. Riffle<br />
embeddedness averaged 32 percent and pooltail embeddedness averaged 42 percent. Gravel comprised<br />
28 percent of the substrate in all habitat types, with cobble (27 percent) and sand/fines (24 percent) in<br />
decreasing order. The Rosgen (1985) channel types varied between B2, C2, and C3 (USDA Forest<br />
Service, 2001).<br />
Shasta-Trinity National Forest – South Fork Management Unit – June 13, 2005 - 43
Fisheries Biological Assessment/Evaluation – <strong>Hidden</strong> <strong>Valley</strong> <strong>Watershed</strong> <strong>Restoration</strong> <strong>Project</strong><br />
LWD: Not Properly Functioning<br />
Most of the wood in the SFTR system was flushed out by the 1964 flood, and following the flood, land<br />
management policy directed that wood be aggressively removed from stream channels (Llanos and Cook<br />
2001). The riparian areas have revegetated since the 1964 flood, but the dominant species appears to be<br />
alders, which break down quickly in the channel (Llanos and Cook 2001).<br />
There is no empirical census of downed LWD in <strong>Project</strong> area tributaries. The riparian area along Forest<br />
Service Roads in the <strong>Hidden</strong> <strong>Valley</strong> watershed are considered Late Successional Reserves (LSR) well<br />
stocked and in a mature to old-growth condition (Dennis Garrison, personal communication, 2005). This<br />
will provide for a continual source of large wood to riparian areas and stream channels within the <strong>Project</strong><br />
Area.<br />
Pool Frequency: Functioning at Risk<br />
Prior to the 1964 flood, the Upper SFTR mainstem was characterized by scattered large, deep pools,<br />
interspersed with shallow pools, riffles and rapids. Gravel and fine sediments deposited during and after<br />
that flood infilled large pools, aggraded and broadened riffles, and destroyed riparian vegetation, leaving<br />
a wide flood plain, shallow pools and riffles with occasional deeper pools (Haskins and Irizarry 1988, in<br />
EPA 1998).<br />
River surveys upstream of the WAA found only five pools deeper than six feet from Forest Glen to the<br />
East Fork South Fork in 1970, but a re-survey in 1989 found 28 pools greater than six feet deep (USDA<br />
Forest Service, 2001). CDFG spring Chinook surveys 1994-1995 (Dean 1996a, in EPA 1998), indicated<br />
that many of the adult spring Chinook were holding in 16 pools, with only one of these located<br />
downstream of Hyampom and none upstream of Forest Glen (EPA 1998). Since 1996, spring Chinook<br />
have been found holding in pools upstream of Forest Glen (CDFG 2004a, and Figure 6 of this document),<br />
which may indicate a trend towards improving pool frequency.<br />
Pool Quality: Functioning at Risk<br />
Dean (1995) reported 21 holding pools in the mainstem SFTR and suggested that holding pools do not<br />
appear to be a limiting factor for spring Chinook. Low water levels and high temperatures appeared to<br />
limit production in the mainstem SFTR (Dean 1996a, in EPA 1998). Some pools that were judged to be<br />
“good habitat” were underutilized (1-2 fish [adults]), generally when those pools were located in areas of<br />
heavy human use. Conversely, “poor quality” pools in isolated areas often contained more fish. Based on<br />
the discussion under Pool Frequency (above), there are indications that pool quality is improving.<br />
Off-Channel Habitat: Properly Functioning<br />
Adjacent to the <strong>Project</strong> area, Rattlesnake Creek, Little Bear Wallow Creek, Plummer Creek, and Butter<br />
Creek offer significant amounts off-channel habitat from the mainstem SFTR. Smaller tributaries adjacent<br />
to the <strong>Project</strong> area (Cold Creek, Johnson Creek, Cold Creek, Sulphur Glade Creek, and Glen Creek)<br />
provide very limited off-channel habitat (up to 150-feet) due to steep gradients. Beyond the 150-feet,<br />
these streams are non-fish bearing. Hitchcock Creek and numerous unnamed tributaries provide zero offchannel<br />
habitats because creek mouths are significantly elevated above the SFTR or are have very steep<br />
gradients. These creeks are non-fish bearing.<br />
Refugia: Functioning at Risk<br />
As temperatures increase by mid to late spring in the SFTR, juveniles seek refuge in accessible<br />
tributaries (see list of fish bearing streams above). Coolwater habitat can also be sustained in deep pools,<br />
cold springs, hyporheic flow, or the junction of cooler tributary streams and in different segments of the<br />
mainstem SFTR. Thermal stratification can occur in pools 3 to 9 feet deep having large gravel bars at the<br />
upstream end, and shallow (1.5 feet) pools with subsurface seepage. Differences ranged from 7.0 - 8.0°F<br />
between the bottom and surface of the stream in the Eel River in northern California (Matthews et al.<br />
Shasta-Trinity National Forest – South Fork Management Unit – June 13, 2005 - 44
Fisheries Biological Assessment/Evaluation – <strong>Hidden</strong> <strong>Valley</strong> <strong>Watershed</strong> <strong>Restoration</strong> <strong>Project</strong><br />
1994, Nielsen et al. 1994). Temperature differentials between cool pools and ambient stream have been<br />
documented at 6.3°F.<br />
Hillemeier (1993) observed the spring-run Chinook salmon utilize large deep pools in the SFTR. These<br />
large pools were sought to escape predators, to rest and congregate with other adults and for their<br />
thermal stratification. The same observations have been made repeatedly during August adult counts on<br />
mainstem SFTR and Hayfork Creek (John Lang, personal observation).<br />
Farber et al. (1998) stated water temperatures in the SFTR appear to be not influenced by tributary<br />
streams as no heating or cooling occurs immediately downstream of tributaries. However, during summer<br />
adult dives on the SFTR in August, there were noticeable changes (unmeasured) in water temperatures<br />
at the mouths of tributaries and near seeps providing a measure of thermal refugia (John Lang, personal<br />
observation).<br />
Width to Depth Ratio: Functioning at Risk<br />
There is no empirical data available. Functioning at risk was based on professional opinion (John Lang).<br />
The excess sediment storage in river bars, landslide toes, terraces, and riverbanks has provided a ready<br />
supply of sediment to the river. In addition to extra sediment stored in the river system (mostly in<br />
tributaries to the SFTR), streams have aggraded and widened in response to the sediment load causing<br />
bank undercutting and bank erosion in areas not confined by bedrock walls (Llanos and Cook 2001).<br />
Streambank Condition: <strong>Hidden</strong> <strong>Valley</strong> Not Properly Functioning<br />
Raines (1998) estimated streambank erosion by stream order in tons per year (Table 15). These<br />
estimates are based on observed erosion rates for the particular geology, but since the only two factors<br />
used to estimate the erosion rate were stream order and geology, they were not site-specific and are very<br />
rough estimates. Raines (1998) also did not distinguish between management and non-management<br />
related streambank erosion because it was difficult to separate. <strong>Hidden</strong> <strong>Valley</strong> watershed, with the SFTR<br />
running through the steep inner gorge composed of the Galice Formation, has the highest rate of<br />
streambank erosion.<br />
Table 15. Stream Bank Erosion (tons per year) by Stream Order in the <strong>Watershed</strong> Analysis Area.<br />
Adapted from Raines (1998).<br />
<strong>Watershed</strong><br />
<strong>Hidden</strong><br />
<strong>Valley</strong><br />
Plummer<br />
Creek<br />
Rattlesnake<br />
Creek<br />
Stream Order<br />
Total<br />
1 2 3 4 5 6 7 (tons/ yr)<br />
1,900 6,500 10,100 1,700 0 0 40,200 60,400<br />
1,200 3,200 2,500 3,500 400 0 1,500 12,200<br />
1,300 4,200 2,900 4,200 500 4500 0 17,500<br />
Floodplain Connectivity: Properly Functioning<br />
SFTR has areas that are frequently hydrologically linked to main channel; overbank flows occur and<br />
maintain wetland functions and riparian vegetation.<br />
Peak/Base Flow: At Risk<br />
Hydrologic characteristics of the WAA have likely changed since the arrival of Euro-Americans, but the<br />
extent is difficult to quantify without accurate flow records. The four main management factors<br />
contributing to hydrologic changes are the building of roads, timber harvest, fire suppression, and flow<br />
diversions. Roads influence hydrologic flows through a watershed. Road cuts on hillslopes intercept<br />
Shasta-Trinity National Forest – South Fork Management Unit – June 13, 2005 - 45
Fisheries Biological Assessment/Evaluation – <strong>Hidden</strong> <strong>Valley</strong> <strong>Watershed</strong> <strong>Restoration</strong> <strong>Project</strong><br />
surface runoff and subsurface flow and route it more quickly to streams. Roads, skid trails, and landings<br />
also compact soils, reducing infiltration for potentially long periods of time. This can result in increases in<br />
peak flows for floods with frequent return intervals and decreases in summer low flows by routing water<br />
out of the watershed more efficiently and decreasing the amount that infiltrates. Increases in peak flows<br />
from roads are related to the connection of road ditches to streams (i.e., they drain hillslopes directly to<br />
streams) or long inside ditches that drain through culverts to eroded gullies that connect to streams<br />
(Foster-Wheeler, 2001).<br />
The result of all of these factors on hydrologic characteristics is difficult to quantify. Potential changes<br />
include lower water yields and summer low flows, which, combined with wider than historic stream widths,<br />
could be detrimental to fish habitat. Lower summer flow levels could also stress riparian vegetation,<br />
especially since the late summer receives little precipitation. Peak flows may also be higher for higher<br />
frequency events, which could cause increased streambank erosion, but would also tend to flush instream<br />
sediments and large woody debris downstream (Foster-Wheeler, 2001).<br />
Drainage Network Increase: At Risk<br />
Roads, skid trails and landings in the SFTR basin that are improperly located, designed, constructed or<br />
maintained may cause: 1) increased surface erosion and chronic fine sediment production and delivery to<br />
streams, and 2) episodic and occasionally catastrophic delivery of fine and coarse sediment to streams<br />
from crossing failures, gully development and landslides generated from improper placement. This has<br />
direct and immediate adverse impacts immediately downstream from the failures, but it can also affect<br />
areas much farther downstream and much farther into the future. This appears to be especially<br />
problematic in the highly erodible and unstable geologic terranes in the western third of the watershed<br />
(EPA 1998).<br />
Road Density/Location: Not Properly Functioning<br />
<strong>Hidden</strong> <strong>Valley</strong> road densities are 3.8 mi/mi 2 , and 2.2 mi/mi 2 in Riparian Reserves (Table 16). <strong>Hidden</strong><br />
<strong>Valley</strong> watershed, since it is composed almost entirely of South Fork Mountain Schist and the Galice<br />
Formation (Figure 12), has the highest length of roads in erosive lithologies, and has a correspondingly<br />
high erosion rate (655 yards/mile of road) and the most landslides (91 yards/mile of road) (Foster-<br />
Wheeler, 2001). The length of road in the <strong>Hidden</strong> <strong>Valley</strong> <strong>Watershed</strong> constructed on slopes >35% (38.8<br />
miles), and/or on South Fork Mountain Schist or Galice Formation is 128.7 miles (Foster-Wheeler, 2001).<br />
The length of road in the Plummer <strong>Watershed</strong> constructed on slopes >35% (21.8.8 miles), and/or on<br />
South Fork Mountain Schist or Galice Formation is 21.5 miles (Foster-Wheeler, 2001).<br />
Table 16. <strong>Hidden</strong> <strong>Valley</strong> Road Densities (Source: Foster-Wheeler, 2001).<br />
Road Type<br />
<strong>Hidden</strong> <strong>Valley</strong> Plummer<br />
Road Road density Road Road density<br />
Density in RR Density in RR<br />
Unknown 0.8 0.9 0.3<br />
4WD Road 0.5<br />
Highway 6.8 1.1 0.9 0.2<br />
Light Duty, Outside FS 31.6 6.7 5.9 1.5<br />
Unimproved 5.4 0.7 12.1 0.7<br />
Trail 4.2 1.1 9.9 3.5<br />
FS Dirt 73.7 11.4 79.1 13.4<br />
FS paved 28.5 1.7 0.3 0.3<br />
GS gravel 12.1 1.7 16.8 5<br />
Private roads 35.2 4.1<br />
Total Length 198.2 24.5 130.1 24.9<br />
Road Density (mi/sq. mi) 3.8 2.2 2.6 2.1<br />
Shasta-Trinity National Forest – South Fork Management Unit – June 13, 2005 - 46
Fisheries Biological Assessment/Evaluation – <strong>Hidden</strong> <strong>Valley</strong> <strong>Watershed</strong> <strong>Restoration</strong> <strong>Project</strong><br />
Figure 12. South Fork Trinity River Geology. Source: TCRCD (2003).<br />
Shasta-Trinity National Forest – South Fork Management Unit – June 13, 2005 - 47
Fisheries Biological Assessment/Evaluation – <strong>Hidden</strong> <strong>Valley</strong> <strong>Watershed</strong> <strong>Restoration</strong> <strong>Project</strong><br />
Roads contribute a significant amount to the total sediment budget for the basin, contributing about 17<br />
percent of the total sediment for the whole 1944 to 1990 time period (EPA 1998). Roads contributed 4<br />
percent of the sediment yield through mass wasting, leaving 13 percent attributed to surface erosion,<br />
washouts, gullies, and slides too small to show up on the aerial photos (Foster-Wheeler, 2001).<br />
Disturbance History: Not Functioning Properly<br />
Land management activities that historically and currently contributed to the decline in the cold water<br />
fishery include: timber operations (4,606 acres federal; 6,336 acres private) with road building (227 miles)<br />
on erodible terrain likely being the greatest cause of concern; with bank erosion contributing to excess<br />
sediment and diversion of water leading to higher water temperatures and nutrient contributions.<br />
Residential land uses and grazing probably do not contribute significant amounts to the problem due to<br />
low densities. The have been no wildland fires recorded in the <strong>Hidden</strong> <strong>Valley</strong> watershed.<br />
Management activities such as road building and timber harvest contributed to mass wasting sediment<br />
delivery and were analyzed by Raines (1998) for the period of the study, 1944 to 1990. Figure 13 shows<br />
the amount (in tons) of sediment contributed by management and non-management activities for the<br />
three watersheds in the WAA. <strong>Hidden</strong> <strong>Valley</strong> watershed has the highest management and nonmanagement<br />
related mass wasting of the three watersheds, and has a ratio of non-management to<br />
management sediment delivery of 7.8 to 1. Mass wasting in Plummer Creek watershed is less than in<br />
<strong>Hidden</strong> <strong>Valley</strong>, and the non-management to management ratio is higher at 12.5 to 1. This is likely due to<br />
the low level of management activity in the lower portions of the watershed that overlay the landslideprone<br />
Galice Formation. In contrast, Rattlesnake Creek watershed has a non-management to<br />
management related mass wasting ratio of 0.59 to 1.<br />
Figure 13. Mass Wasting Sediment Delivery in <strong>Watershed</strong> Analysis Area. Adapted from Raines (1998).<br />
Based on the results of the existing condition Cumulative <strong>Watershed</strong> Effects analysis (Fitzgerald 2005),<br />
all six of the 7 th Field HUC watersheds within the used to stratify the <strong>Project</strong> area, have CWE Risk Rating<br />
of four, which means there is a substantial increase in fine and coarse sediment above background<br />
(Tables 16, 17 and 18). The background sediment yield is defined as the background sediment input to a<br />
stream channel from surface, fluvial, mass, and bank erosion caused by natural disturbance processes<br />
Shasta-Trinity National Forest – South Fork Management Unit – June 13, 2005 - 48
Fisheries Biological Assessment/Evaluation – <strong>Hidden</strong> <strong>Valley</strong> <strong>Watershed</strong> <strong>Restoration</strong> <strong>Project</strong><br />
(i.e., floods and fire) (Fitzgerald 2005). The Equvilent Roaded Area (ERA) model was ran at the 8 th Field<br />
HUC watershed to better characterize the existing watershed condition (see below). Excess sediment<br />
sourced from stream-road crossing failure and poor road drainage are the main factors causing adverse<br />
CWE. Sediment is presently having a major stress on fish and substantial increase in the bed-material<br />
load.<br />
Table 16. Summary of HV <strong>Watershed</strong> <strong>Restoration</strong> <strong>Project</strong> existing ERA CWE analysis results<br />
(Fitzgerald 2005).<br />
<strong>Watershed</strong> Name<br />
[7 th field drainages]<br />
Drainage<br />
Area<br />
(acres)<br />
TOC<br />
(%)<br />
Harvest &<br />
Fire ERA<br />
(acres)<br />
Road<br />
ERA<br />
(acres)<br />
Existing<br />
ERA<br />
(acres)<br />
Existing<br />
ERA (%)<br />
<strong>Watershed</strong><br />
Condition<br />
Class<br />
Cave Creek-Swift<br />
Creek<br />
9,546 12 351 155 506 5 II<br />
Little Bear Wallow<br />
Creek-<strong>Hidden</strong> <strong>Valley</strong><br />
9,919 12 143 119 262 3 I<br />
Miller Springs 6,994 12 163 72 235 3 I<br />
McClellen-South Fork<br />
Trinity River<br />
6,955 12 426 65 490 7 II<br />
Hitchcock Creek-Oak<br />
Flat<br />
11,793 12 1,203 136 1,338 11 III<br />
Wintoon Flat-Deep<br />
Gulch<br />
4,226 12 48 56 105 2 I<br />
Table 17. Summary of HV <strong>Watershed</strong> <strong>Restoration</strong> <strong>Project</strong> existing mass wasting CWE analysis<br />
results (Fitzgerald 2005).<br />
<strong>Watershed</strong> Name<br />
[7 th field drainages]<br />
Drainage<br />
Area<br />
(acres)<br />
Background<br />
mass<br />
wasting<br />
(yds3/acre/<br />
decade)<br />
Harvest &<br />
Fire mass<br />
wasting<br />
(yds3/acre/<br />
decade)<br />
Road mass<br />
wasting<br />
(yds3/acre<br />
/decade)<br />
Total<br />
Mass<br />
Wasting<br />
(yds3/acre<br />
<strong>Watershed</strong><br />
Condition<br />
Class<br />
Cave Creek-Swift Creek 9,546 8,798 3,720 5,131<br />
/year)<br />
17,648 III<br />
Little Bear Wallow<br />
Creek-<strong>Hidden</strong> <strong>Valley</strong><br />
9,919 11,613 3,124 3,613 18,350 II<br />
Miller Springs 6,994 8,438 2,323 2,005 12,766 II<br />
McClellen-South Fork<br />
Trinity River<br />
6,955 7,885 2,088 1,308 11,281 II<br />
Hitchcock Creek-Oak<br />
Flat<br />
11,793 12,996 5,342 2,707 21,045 II<br />
Wintoon Flat-Deep<br />
Gulch<br />
4,226 9,269 752 5,316 15,337 II<br />
49,433 58,999 17,349 20,080 96,427<br />
Shasta-Trinity National Forest – South Fork Management Unit – June 13, 2005 - 49
Fisheries Biological Assessment/Evaluation – <strong>Hidden</strong> <strong>Valley</strong> <strong>Watershed</strong> <strong>Restoration</strong> <strong>Project</strong><br />
Table 18. Summary of HV <strong>Watershed</strong> <strong>Restoration</strong> <strong>Project</strong> existing surface erosion CWE analysis<br />
results (Fitzgerald 2005).<br />
<strong>Watershed</strong> Name<br />
[7 th field drainages]<br />
Drainage<br />
Area<br />
(acres)<br />
Background<br />
surface<br />
erosion<br />
(yds3/acre/<br />
year)<br />
Harvest &<br />
Fire surface<br />
erosion<br />
(yds3/acre/<br />
year)<br />
Road<br />
surface<br />
erosion<br />
(yds3/<br />
acre/year)<br />
Total<br />
Surface<br />
Erosion<br />
(yds3/acre<br />
/year)<br />
<strong>Watershed</strong><br />
Condition<br />
Class<br />
Cave Creek-Swift Creek 9,546 433 0 608 1042 III<br />
Little Bear Wallow<br />
Creek-<strong>Hidden</strong> <strong>Valley</strong><br />
9,919 466 0 430 897 III<br />
Miller Springs 6,994 287 0 172 460 II<br />
McClellen-South Fork<br />
Trinity River<br />
6,955 290 0 234 524 III<br />
Hitchcock Creek-Oak<br />
Flat<br />
11,793 454 0 490 944 III<br />
Wintoon Flat-Deep<br />
Gulch<br />
4,226 118 0 152 270 III<br />
49,433 2048 0 2086 4137<br />
Riparian Reserves: Functioning at Risk<br />
Over 65 percent of the riparian areas are composed of conifer tree size 3 (13-24 feet, small to medium<br />
timber as of 1992, [it would be expected that tree size has increased since 1992]) or larger with<br />
approximately 61 percent of those stands with moderate-dense (>40 percent) crown closure and 39<br />
percent with sparse-open (0-39 percent) crown closure (page 3-26 in Foster-Wheeler, 2001).<br />
Shasta-Trinity National Forest – South Fork Management Unit – June 13, 2005 - 50
Fisheries Biological Assessment/Evaluation – <strong>Hidden</strong> <strong>Valley</strong> <strong>Watershed</strong> <strong>Restoration</strong> <strong>Project</strong><br />
V. Effects of the Proposed Action<br />
The STNF Tributaries Matrix of Factors and Indicators (Appendix D of this document), was used to assist<br />
in the analysis of effect for the proposed action. The STNF Tributaries Matrix of Factors and Indicators is<br />
functionally equivalent to the “Table of Population and Habitat Indicators for Use in the Northwest Forest<br />
Plan Area” provided in the Analytical Process, except for the “population characteristics” and “population<br />
and habitat” pathways. An ESA recovery plan for SONCC coho salmon has not been proposed or<br />
completed. Therefore, insufficient information exists to address the “population characteristics” and<br />
“population and habitat” pathways at this time.<br />
The analytical process contains efficiency measures to limit duplicative analysis. <strong>Project</strong> elements that<br />
have similar effects (or no causal mechanism) to an indicator may be grouped for analysis. Indicators that<br />
address similar habitat characteristics (such as substrate and turbidity) may be grouped for analysis since<br />
they are similarly affected by project elements.<br />
Direct effects to coho salmon are not expected to occur. There are no aspects of the <strong>Project</strong> that will<br />
occur where fish are present.<br />
Indirect effects to SONCC coho salmon, its critical habitat, and EFH will be analyzed by evaluating the<br />
expected effect of the <strong>Project</strong> elements on habitat indicators as described above.<br />
For evaluating effects, the <strong>Project</strong> is divided into <strong>Project</strong> Elements as described below.<br />
Road Upgrade<br />
System Road upgrade of 60.5 miles of existing system roads (including rocking,<br />
grading, culvert upgrade or drainage repair).<br />
Road Realignment<br />
Non system road of 0.3 miles accessing private property would be rerouted to better<br />
conform to topography (including rocking, grading, culvert upgrade or drainage repair).<br />
Road Rehabilitation<br />
Decommissioning or obliteration of 41.1 miles of existing system and nonsystem road<br />
including culvert removal, outsloping, ripping, waterbarring, slope stabilization and<br />
revegetation. Hydroclosure of 5.5 miles of existing system road (including culvert<br />
upgrade or installation of critical dips, and/or water bars).<br />
Each of the <strong>Project</strong> elements is analyzed for its effect on habitat indicators that are used to characterize<br />
the health of aquatic habitat. Changes to an indicator are evaluated using factor analysis to determine if<br />
there is an effect to individuals of the species or critical habitat/EFH.<br />
Water Temperature<br />
Road Upgrade<br />
Proximity – Approximately 0.1 miles (Road 3N10) is proposed for road upgrade (grading) within 0.1 mile<br />
of CH. Approximately 21.0 miles (43 culvert upgrades) proposed for road upgrade will occur between<br />
0.25 – 0.75 miles of CH/EFH. The remaining 39.3 miles (71 culvert upgrades) proposed for road upgrade<br />
will occur a distance greater than 0.75 miles from CH/EFH.<br />
Probability – Road rocking, grading, constructing rocked water dips, and drainage repair will not result in<br />
the loss of any canopy cover of any stream; therefore, there is no causal mechanism to change water<br />
temperature.<br />
Shasta-Trinity National Forest – South Fork Management Unit – June 13, 2005 - 51
Fisheries Biological Assessment/Evaluation – <strong>Hidden</strong> <strong>Valley</strong> <strong>Watershed</strong> <strong>Restoration</strong> <strong>Project</strong><br />
It is probable that some hazard trees (small understory trees) be fell during culvert upgrades that may<br />
result in reductions in stream shade. There is low probability that tree removal for culvert upgrade will<br />
result in water temperature changes. This is due to the project occurring over a protracted time line (ten<br />
years) and dispersed locations (different streams) within any given year.<br />
Magnitude – Changes to stream shade resulting from removing individual hazard trees will be so small<br />
that no water temperature change will result.<br />
Element Summary - This project element would have a neutral (0) effect on water temperature.<br />
Road Realignment<br />
Proximity – Approximately 0.3 miles (Road 1N24E) is proposed for road realignment and is greater than<br />
0.75 miles upslope of CH/EFH.<br />
Probability – Road realignment will not result in the loss of any canopy cover of any stream; therefore,<br />
there is no causal mechanism to change water temperature.<br />
Element Summary - This project element would have a neutral (0) effect on water temperature.<br />
Road Rehabilitation<br />
Proximity – Approximately 1.8 miles (Roads 1S26C, U1S30, and 1S01A) are proposed for road<br />
decommission including the removal of 4 culverts (Road U1S30) within 0.1 miles of critical habitat/EFH.<br />
Approximately 21.7 miles are proposed for road decommission including the removal of 64 culverts 0.25<br />
to 0.75 miles of critical habitat/EFH.<br />
Approximately 17.7 miles are proposed for road decommission including the removal of 24 culverts<br />
greater than 0.75 miles of critical habitat/EFH.<br />
Probability – It is probable that some hazard trees (small understory trees) would be felled during culvert<br />
removal that may result in reductions in stream shade. There is low probability that tree removal for<br />
culvert removal will result in water temperature changes. This is due to the project occurring over a<br />
protracted time line (ten years) and dispersed locations (different streams) within any given year.<br />
Magnitude – Changes to stream shade resulting from removing individual hazard trees will be so small<br />
that no water temperature change will result.<br />
Element Summary - This project element would have a neutral (0) effect on water temperature.<br />
Water Temperature Indicator Summary<br />
The project would have insignificant negative (-) effects on water temperature due to canopy loss<br />
resulting from road upgrade, realignment and rehabilitation.<br />
The project would brush vegetation to access roads identified for restoration treatment and within 50-feet<br />
immediately up and downstream of identified culverts. Trees felled in the RR would remain as down<br />
wood. Areas adjacent to culverts were previously disturbed when originally installed. An unknown number<br />
of small diameter (
Suspended Sediment<br />
Road Upgrade<br />
Fisheries Biological Assessment/Evaluation – <strong>Hidden</strong> <strong>Valley</strong> <strong>Watershed</strong> <strong>Restoration</strong> <strong>Project</strong><br />
Proximity – Approximately 0.1 miles (Road 3N10) is proposed for road upgrade (grading) within 0.1 mile<br />
of CH.<br />
Approximately 21.0 miles (43 culvert upgrades) proposed for road upgrade will occur between 0.25 – 0.75<br />
miles of CH/EFH.<br />
The remaining 39.3 miles (71 culvert upgrades) proposed for road upgrade will occur a distance greater<br />
than 0.75 miles from CH/EFH.<br />
Probability – The probability for road upgrade activities (which includes ditch cleaning, culvert inlet<br />
cleanout, constructing rocked water dips, grading, and replacing culverts in non-fish streams) to<br />
negatively (-) affect coho salmon is low because of timing of sediment movement and because of the<br />
limited amount of sediment that could reach critical habitat. The likelihood that this project element would<br />
positively (+) affect (reduce) turbidity or improve substrate in critical habitat under average winter stream<br />
flow conditions is also low because relatively few road miles would be upgraded compared to total road<br />
miles in the watershed. However, the likelihood that this project element would positively (+) affect<br />
(reduce) turbidity or improve substrate in critical habitat is high long-term because over one-half of the<br />
crossings in the <strong>Project</strong> area are predicted to fail in a >25 year storm event.<br />
Magnitude – Road Upgrade would have a short-term negative (-) effect, as well as a long-term positive<br />
(+) effect on the indicator. The slight negative effects of road Upgrade on turbidity and substrate in critical<br />
habitat would be difficult to detect and would not measurably affect critical habitat. <strong>Project</strong> design criteria<br />
would be used to minimize the amount of soil that moves off-site. In addition, any soil that is flushed<br />
downstream at the beginning of the rainy season would be immediately diluted by the much greater<br />
volume of water in critical habitat and would become indistinguishable from the elevated levels of<br />
sediment entering channels from all sources at that time.<br />
The slight positive (+) effect for this element will occur for reducing road-related stream sediment in the<br />
long term. Positive effects will occur as a result of better cross drains moving water off the road surface,<br />
rock surfacing to reduce erosion from the running surface and larger culverts to reduce the risk of<br />
catastrophic failure.<br />
Element Summary – Road Upgrade will have insignificant short-term negative (-) effects to turbidity and<br />
substrate due to soil disturbance and long-term positive (+) effects resulting from better road drainage<br />
and lower risk of culvert failure.<br />
Road Realignment<br />
Proximity – Approximately 0.3 miles (Road 1N24E) is proposed for road realignment and is greater than<br />
0.75 miles upslope of CH/EFH.<br />
Probability – The probability for road realignment activities to negatively (-) affect coho salmon is low<br />
because of timing of sediment movement and because of the limited amount of sediment that could reach<br />
critical habitat. The likelihood that this project element would positively (+) affect (reduce) turbidity or<br />
improve substrate in critical habitat under average winter stream flow conditions is also low because of<br />
relatively few road miles repaired compared to total road miles in the watershed.<br />
Element Summary – This project element would have a neutral (0) effect on suspended sediment.<br />
Road Rehabilitation<br />
Approximately 1.8 miles (Roads 1S26C, U1S30, and 1S01A) are proposed for road decommission<br />
including the removal of 4 culverts (Road U1S30) within 0.1 miles of SONCC coho salmon critical habitat.<br />
Shasta-Trinity National Forest – South Fork Management Unit – June 13, 2005 - 53
Fisheries Biological Assessment/Evaluation – <strong>Hidden</strong> <strong>Valley</strong> <strong>Watershed</strong> <strong>Restoration</strong> <strong>Project</strong><br />
Approximately 21.7 miles are proposed for road decommission including the removal of 64 culverts 0.25<br />
to 0.75 miles of SONCC coho salmon critical habitat.<br />
Approximately 17.7 miles are proposed for road decommission including the removal of 24 culverts<br />
greater than 0.75 miles of SONCC coho salmon critical habitat.<br />
Probability –There is low probability that that road rehabilitation will have short-term (-) negative effects<br />
on turbidity and substrate in critical habitat/EFH and a long-term positive (+) effect in the SFTR. Localized<br />
erosion may result during implementation due to summer thunderstorms. Erosion control measures (daily<br />
mulching of bare soil near streams) would minimize sediment from entering channels from<br />
decommissioned road prisms in the event of thunderstorms. In addition, an excavator would remove all<br />
inchannel fill down to the original stream gradient and will reshape streambanks to approximate natural<br />
banks up- and downstream of the work area. This step will result in a net decrease of fines and restore<br />
the original channel grade. The channel will be dewatered at the time so that disturbed materials would<br />
not be transported downstream. There maybe a short-term localized increase in turbidity during the initial<br />
phase of rewatering at each site. Straw bale cofferdams (installed downstream of culvert work) would trap<br />
sediments inchannel while the channel is rewatered. Trapped sediments would then be excavated from<br />
the channel prior to leaving a site. Erosion control measures would be inplace over weekends. Due to the<br />
proximity of some road decommissioning within 0.1 miles of the SFTR, there is potential for small<br />
amounts of sediment to enter critical habitat/EFH. Turbidity associated with rewatering the stream<br />
associated with roads U1S30 and 1S01A, may reach the SFTR but would become mixed and diluted to<br />
an immeasurable level within a few hundred feet of origin. The area disturbed (~3-5 miles of road<br />
decommissioning per year) in relation to background sediment levels of the <strong>Hidden</strong> <strong>Valley</strong> 5 th field<br />
watershed would result in very low probability of suspended sediment and turbidity in the SFTR elevating<br />
above background levels.<br />
The likelihood that this project element would negatively (-) affect (increase) turbidity or adversely affect<br />
substrate in critical habitat/EFH due to post-implementation channel adjustments (i.e., short-term erosion<br />
and sediment delivery which may last 2 to 3 years) is low. The number and size of the culverts and<br />
associated erosion would be dispursed over 10 years. In any given year, the anticipated level of erosion<br />
in relation to background sediment levels of the <strong>Hidden</strong> <strong>Valley</strong> 5 th field watershed would result in very low<br />
probability of suspended sediment and turbidity in the SFTR elevating above background levels. And<br />
significant channel adjustments would be caused by significant storm events. It is anticipated such events<br />
would cause a corresponding increase in background suspended sediments in critical habitat/EFH. T<br />
The likelihood that this project element would positively (+) affect (reduce) turbidity or improve substrate<br />
in critical habitat/EFH is high long-term. Over one-half of the crossings in the <strong>Project</strong> would likely fail in a<br />
>25 year storm event (Fitzgerald 2005).<br />
A road restoration program at Redwood National Park was initiated in 1978 to reduce road related<br />
sediment. Madei (2001) summarized findings from field evaluation of post-treatment erosion on<br />
decommissioned roads in Redwood National Park post 1997 event. Conclusions were: treated roads<br />
contributed about one-fourth the sediment produced from untreated roads; eliminating the risk of stream<br />
diversions and culvert failures, road treatments significantly reduce the long-term sediment risk from<br />
abandoned roads. Madej (2001) stated that if restoration is effective, treated sites should have a lower<br />
frequency or volume of failure during large rain events than untreated sites. Over the long-term, improved<br />
watershed conditions should result in improved instream and fisheries habitat conditions.<br />
In addition, post-implementation monitoring for road decommissioning and culvert removal or upgrade on<br />
the STNF concluded that, if properly designed and implemented, road-stream crossing excavation is<br />
having discountable short-term effects on beneficial uses and water quality, and that restoration activities<br />
are improving watershed condition by reducing the magnitude, duration, timing, and frequency of hillslope<br />
runoff diversion, the risk of road-stream crossing failure (USDA Forest Service 2005). The most<br />
substantial measured short-term impact is increased suspended sediment and turbidity during crossing<br />
excavation in perennial streams. During excavation the increased suspended sediment concentration was<br />
not measurable ¼ mile downstream of the crossing and did not violate California State water quality<br />
Shasta-Trinity National Forest – South Fork Management Unit – June 13, 2005 - 54
Fisheries Biological Assessment/Evaluation – <strong>Hidden</strong> <strong>Valley</strong> <strong>Watershed</strong> <strong>Restoration</strong> <strong>Project</strong><br />
objectives for suspended sediment or turbidity. No drainage scale sediment increases were measured<br />
during excavation or after the first runoff generating storm event (USDA Forest Service, 2005).<br />
Pacific Southwest Regional BMP monitoring results (1992-2002) found the Forest Service is effectively<br />
implementing road-stream crossing excavation projects 85 percent of the time (USDA Forest Service<br />
2004).<br />
Magnitude – Primary effects from summer thunderstorms and post-implementation adjustments (due to<br />
winter storms) include elevated turbidity in watercourses near treated roads, local channel erosion due to<br />
culvert removal and erosion from exposed decommissioned road prisms.<br />
An estimate of post-implementation erosion applied the methods described in Madej (2001), i.e., where<br />
post-treatment erosion was most strongly correlated to a surrogate for stream power (drainage area X<br />
channel gradient) and the amount of road fill excavated from the stream crossing. If the entire <strong>Project</strong> was<br />
to be conducted in one season and followed by a 7 to 10 year flow event, and estimated 1,714 yd 3 of<br />
sediment could be generated as a result of Road rehabilitation activities and subsequent channel<br />
adjustment (Table 5). Road treatments will however, occur over a 10 year period. An estimate of<br />
background erosion for the <strong>Hidden</strong> <strong>Valley</strong> watershed (management and non-management related)<br />
delivered to the SFTR is approximately 2,468 tons/sq. mile/yr (Figure 11). Background erosion converted<br />
to cubic-yards of sediment for the 53 sq.mile <strong>Hidden</strong> <strong>Valley</strong> 5 th field watershed is approximately 93,416<br />
cubic yards per year (Jim Fitzgerald, personal communication, 2005). Over the ten year project time line,<br />
the potential “maximum” erosion generated by road rehabilitation annually is approximately 1,865 yd 3 or<br />
0.2 percent over existing background erosion levels.<br />
Turbidity and Substrate Indicator Summary<br />
The <strong>Project</strong> will result in net reductions of sediment through removal of approximately 145,900 yds3 of<br />
existing fill material and will eliminate or reduce the risk of crossing failure. Overall, sediment delivery<br />
potential (which relates to both turbidity and substrate conditions) is improved (protected) in the long term<br />
by reducing risk of fill failure. It is assumed the short-term effects of sediment from road decommissioning<br />
would be immeasurable compared to present background levels.<br />
Road rehabilitation would have short-term negative (-) effects, as well as a long-term positive (+) effect on<br />
the habitat indicator. The negative effects of road rehabilitation related turbidity and substrate would be<br />
evident in the SFTR for a short distance (few hundred feet) downstream till it became diluted to<br />
immeasurable levels. An unknown amount (although 0.2 percent over existing background is an<br />
estimated maximum) of sediment will be mobilized into CH/EFH. If spawning fish were present, it is highly<br />
unlikely this additional sediment would adversely affect emergence of fry from redds. Because of<br />
implementing project design criteria and BMP’s, effects in the SFTR could not be meaningfully measured.<br />
The long-term positive (+) effect of this element for reducing road-related turbidity and decreasing fine<br />
sediment (approximately 120,429 yd3 will be removed from crossings) in the substrate in the long-term<br />
would be reducing the density of roads in the <strong>Hidden</strong> <strong>Valley</strong> subwatershed by approximately 0.8 mi/mi2.<br />
<strong>Hidden</strong> <strong>Valley</strong> facial tributaries would have positive effects that could not be meaningfully measured.<br />
Element Summary - Road rehabilitation would not have effects great enough to negatively (-) affect coho<br />
salmon and its critical habitat or EFH. This is because turbidity and changes in substrate as a result of<br />
road upgrade, road realignment and rehabilitation activities would not be significantly elevated above<br />
existing background levels. Road rehabilitation will have long-term positive (+) effects to turbidity and<br />
substrate in the SFTR due to decreasing compacted surfaces, increasing infiltration, decreasing the<br />
drainage network that are prone to erosion.<br />
Chemical Contamination/Nutrients<br />
Road Upgrade<br />
Road Realignment<br />
Shasta-Trinity National Forest – South Fork Management Unit – June 13, 2005 - 55
Road Rehabilitation<br />
Fisheries Biological Assessment/Evaluation – <strong>Hidden</strong> <strong>Valley</strong> <strong>Watershed</strong> <strong>Restoration</strong> <strong>Project</strong><br />
All <strong>Project</strong> elements have a common analysis for Chemical Contamination/Nutrients because the<br />
mechanism with potential to cause effects is the same. All equipment fueling sites will be located at<br />
existing landings well away from any watercourses and have appropriate spill containment (Appendix C).<br />
Chemical contamination in the form of a spill of petroleum products due to a motorized vehicle accident<br />
(log truck, tractor, and yarder) is, of course, not expected as part of the <strong>Project</strong>. Reinitiation of<br />
consultation will be initiated, as appropriate, if such an accident occurs.<br />
No project elements have a causal mechanism to affect the nutrient loading in any way.<br />
Chemical Contamination/Nutrients Indicator and Element Summary<br />
The <strong>Project</strong> will have neutral (0) effects on Chemical Contamination/Nutrients.<br />
Physical Barriers<br />
Road Upgrade<br />
Road Realignment<br />
Road Rehabilitation<br />
The <strong>Project</strong> neither corrects nor creates any fish passage barriers. There is no causal mechanism<br />
associated with the proposed <strong>Project</strong> to affect the indicator.<br />
Physical Barriers Indicator and Element Summary<br />
The <strong>Project</strong> will have neutral (0) effects on Physical Barriers.<br />
Large Woody Debris (LWD)<br />
Road Upgrade<br />
Road Realignment<br />
Road Rehabilitation<br />
The <strong>Project</strong> would not change existing LWD loads or LWD recruitment to streams. There is no causal<br />
mechanism associated with the proposed <strong>Project</strong> to affect the indicator.<br />
Large Woody Debris Indicator and Element Summary<br />
The <strong>Project</strong> will have neutral (0) effects on Large Woody Debris.<br />
Pool Frequency/Quality<br />
Road Upgrade<br />
Road Realignment<br />
Road Rehabilitation<br />
The <strong>Project</strong> would not significantly increase sedimentation to CH/EFH due to complete removal of fill<br />
materials and the net reduction in sediment from roads. Long-term, the <strong>Project</strong> will reduce the risk of<br />
road/fill failure and the potential for debris torrents/scouring of the channel and associated sediment from<br />
entering the SFTR, thus, benefiting downstream CH/EFH habitat.<br />
Pool Frequency/Quality Indicator and Element Summary<br />
The <strong>Project</strong> will have slight positive (+) effects on Pool Frequency/Quality long-term.<br />
Shasta-Trinity National Forest – South Fork Management Unit – June 13, 2005 - 56
Width-to-Depth Ratios<br />
Road Upgrade<br />
Road Realignment<br />
Road Rehabilitation<br />
Fisheries Biological Assessment/Evaluation – <strong>Hidden</strong> <strong>Valley</strong> <strong>Watershed</strong> <strong>Restoration</strong> <strong>Project</strong><br />
Channel widths can be modified by changes in riparian vegetation, changes in streamflow regimes, and<br />
changes in sediment supply. The <strong>Project</strong> has the potential to improve width-to-depth ratios ratio at the 7 th<br />
field scale as fill is removed; channel bottoms will be restored to native substrates and, channel banks will<br />
be recontoured to approximate natural banks up and downstream. Over the long-term, width-to-depth<br />
ratios ratio at the 5 th field scale may lead to a slight improvement as sources of chronic sediment are<br />
reduced.<br />
Width-to-Depth ratio Indicator and Element Summary<br />
The <strong>Project</strong> will have slight positive (+) effects on width-to depth ratios.<br />
Streambank Condition<br />
Road Upgrade<br />
Road Realignment<br />
Road Rehabilitation<br />
Streambanks impacted by the large amount of fill from the old culverts will be restored. Streambanks will<br />
be mulched with weed-free straw or native brush to provide short-term erosion control until vegetation reestablishes.<br />
Floodplains would improve at the 7 th field, but measurable improvements are not likely to<br />
occur at the 5 th field scale.<br />
Streambank Condition Indicator and Element Summary<br />
The <strong>Project</strong> will have neutral (0) effects on Streambank Condition.<br />
Floodplain Connectivity<br />
Road Upgrade<br />
Road Realignment<br />
Road Rehabilitation<br />
Floodplains are not well developed within the <strong>Project</strong> area streams. Those floodplains that exist would<br />
benefit slightly from stream crossing modifications proposed improved ability for crossings to pass<br />
bedload.<br />
Floodplain Connectivity Indicator and Element Summary<br />
The <strong>Project</strong> will have slight positive (+) effects on Floodplain Connectivity.<br />
Change in Peak/Base Flows<br />
Road Upgrade<br />
Road Realignment<br />
Road Rehabilitation<br />
Shasta-Trinity National Forest – South Fork Management Unit – June 13, 2005 - 57
Fisheries Biological Assessment/Evaluation – <strong>Hidden</strong> <strong>Valley</strong> <strong>Watershed</strong> <strong>Restoration</strong> <strong>Project</strong><br />
<strong>Watershed</strong>s with altered peak flow regimes are at greater risk of culvert failure. The stream crossing<br />
modifications proposed would result in a substantial reduction of failure risk and improve the ability for<br />
crossings to pass bedload, thus decreasing the risk of crossing failure. This is particularly beneficial in<br />
those watersheds that are at risk or not properly functioning because bedload transport may be elevated<br />
due to altered flow regimes. Thus, the <strong>Project</strong> would protect CH/EFH downstream from the impacts of<br />
future fill failures.<br />
Change in Peak/Base Flow Indicator and Element Summary<br />
The <strong>Project</strong> will have neutral (0) effects on Change in Peak/Base Flow.<br />
Road Density and Location<br />
Road Upgrade<br />
Road Realignment<br />
Road Rehabilitation<br />
The <strong>Project</strong> will reduce road density and remove roads from RRs and will reduced the adverse effects of<br />
existing road stream crossings that are risk of failure. The <strong>Project</strong> will reduce the risk of crossing failure,<br />
which is one of the adverse impacts of roads, and will protect downstream CH/EFH from impacts<br />
associated with culvert failures. Due to road decommissioning, road density would be reduced at the 7 th<br />
field, but would be immeasurable at the 5 th field scale.<br />
Road Density and Location Indicator and Element Summary<br />
The <strong>Project</strong> will have slight positive (+) effects at the 7 th field watershed, but neutral (0) effects on Road<br />
Density and Location at the 5 th field watershed scale.<br />
Riparian Reserves<br />
Road Upgrade<br />
Road Realignment<br />
Road Rehabilitation<br />
Vegetation removal will include the areas adjacent to each culvert that would need to be cleared have<br />
been previously disturbed when the original culvert was installed. Thus, large trees that provide primary<br />
shade to streams are not anticipated to be growing within the work area. It is anticipated that a low<br />
number of trees would be growing in the culvert work area and thus removal of an occasional tree would<br />
not measurably affect LWD in streams. This implementation step will not measurably change the function<br />
of RRs. RRs will continue to provide stream shade, filtering and LWD to streams. Benefits of the <strong>Project</strong><br />
include enhanced routing of bedload and LWD through the modified crossings. Thus, the <strong>Project</strong> will<br />
improve or restore LWD transport from upstream RRs to downstream habitat. In general, road stream<br />
crossings represent a permanent loss of RR function commensurate with the roaded area within RRs.<br />
The <strong>Project</strong> would change the width and length of road that passes through RRs, thus RR condition<br />
would receive slight improvement at the 7 th field, but would be immeasurable at the 5 th field scale.<br />
Riparian Reserves Indicator and Element Summary<br />
The <strong>Project</strong> will have neutral (0) effects on Riparian Reserves.<br />
Shasta-Trinity National Forest – South Fork Management Unit – June 13, 2005 - 58
Fisheries Biological Assessment/Evaluation – <strong>Hidden</strong> <strong>Valley</strong> <strong>Watershed</strong> <strong>Restoration</strong> <strong>Project</strong><br />
VI. Element Summary<br />
Road Upgrade<br />
Road Upgrade will have neutral (0) effect on Water Temperature, Chemical Contamination/Nutrients,<br />
Physical Barriers, Large Woody Debris, Off-Channel Habitat, Refugia, Width/Depth Ratio, Streambank<br />
Condition and Floodplain Connectivity.<br />
Road Upgrade will have insignificant short-term negative (-) effects to turbidity and substrate due to soil<br />
disturbance and long-term positive (+) effects resulting from better road drainage and lower risk of culvert<br />
failure.<br />
The <strong>Project</strong> will have short- and long-term positive effects (+) from road Upgrade and road rehabilitation.<br />
Over the long term, the <strong>Project</strong> will result in neutral (0) effects to peak/base flow and drainage network on<br />
critical habitat/EFH.<br />
Road Realignment<br />
Road Upgrade will have neutral (0) effect on Water Temperature, Chemical Contamination/Nutrients,<br />
Physical Barriers, Large Woody Debris, Off-Channel Habitat, Refugia, Width/Depth Ratio, Streambank<br />
Condition and Floodplain Connectivity, Peak/base flow and Drainage Network.<br />
Road Rehabilitation<br />
Road Rehabilitation will have neutral (0) effect on Water Temperature, Chemical Contamination/Nutrients,<br />
Physical Barriers, Large Woody Debris, Off-Channel Habitat, Refugia, Width/Depth Ratio, Streambank<br />
Condition and Floodplain Connectivity.<br />
Road rehabilitation will have insignificant short-term negative (-) effects to turbidity and substrate in critical<br />
habitat/EFH due to ground disturbance and post implementation channel adjustment and insignificant<br />
long-term positive effects as a result of decreasing compacted surfaces, increasing infiltration, decreasing<br />
the drainage network that are prone to erosion. Road Rehabilitation will not result in effects great enough<br />
to negatively (-) affect coho salmon and their habitat in the SFTR. Road rehabilitation will have long-term<br />
positive (+) effects to turbidity and substrate in the SFTR due to decreasing compacted surfaces,<br />
increasing infiltration, decreasing the drainage network and re-vegetating bare surface that are prone to<br />
erosion.<br />
Over the long term, the <strong>Project</strong> will result in neutral (0) effects to peak/base flow and drainage network in<br />
the SFTR.<br />
Shasta-Trinity National Forest – South Fork Management Unit – June 13, 2005 - 59
Fisheries Biological Assessment/Evaluation – <strong>Hidden</strong> <strong>Valley</strong> <strong>Watershed</strong> <strong>Restoration</strong> <strong>Project</strong><br />
VII. Indicator Summary<br />
“Population Characteristics” and “Species and Habitat” Pathway indicators are not addressed in this<br />
document, since insufficient information exists to allow for their evaluation. A species recovery plan has<br />
not been drafted for SONCC coho salmon.<br />
Water Temperature Indicator Summary - The <strong>Project</strong> will have insignificant negative (-) effects on water<br />
temperature due to canopy loss resulting from road upgrades or road rehabilitation.<br />
Turbidity and Substrate Indicator Summary - The <strong>Project</strong> will have insignificant negative (-) effects to<br />
turbidity and substrate in critical habitat/EFH due to summer thunderstorm activity. Slightly elevated<br />
turbidity levels are expected to result near the source creek for a period of 1 to 2 hours and become<br />
diluted to immeasurable levels within a few hundred feet downstream. The <strong>Project</strong> will have insignificant<br />
negative (-) effects to turbidity and substrate in critical habitat/EFH due to post-implementation channel<br />
adjustment. The amount of sediment input caused by <strong>Project</strong> activities will not increase significantly<br />
above background levels in the SFTR. The <strong>Project</strong> will have no negative (0) effects to turbidity and<br />
substrate in critical habitat/EFH due to erosion from decommission road prisms. Due to the relatively high<br />
background erosion, the additive effects of all project elements in critical habitat/EFH are not expected to<br />
result in turbidity levels significantly elevated above background levels.<br />
Long-term positive (+) effects will occur in critical habitat/EFH due to decreasing compacted surfaces,<br />
increasing infiltration, decreasing the drainage network that are prone to erosion.<br />
Chemical Contamination/Nutrients Indicator and Element Summary - The <strong>Project</strong> will have neutral<br />
(0) effects on Chemical Contamination/Nutrients.<br />
Physical Barriers Indicator and Element Summary - The <strong>Project</strong> will have neutral (0) effects on<br />
Physical Barriers.<br />
Large Woody Debris Indicator Summary - Road upgrade, road rehabilitation will have insignificant<br />
negative effects to future LWD recruitment due to felling hazard trees. Road realignment will have neutral<br />
(0) effects on LWD.<br />
Pool Frequency Indicator Summary - The <strong>Project</strong> will have neutral (0) effects on pool characteristics in<br />
critical habitat/EFH. The <strong>Project</strong> is expected to have long-term positive (+) effects to pool frequency in<br />
critical habitat/EFH through a reduction in sediment supply.<br />
Off-Channel Habitat Indicator and Element Summary - Due severely limited off-channel habitat in the<br />
action area, the <strong>Project</strong> will have neutral (0) effects on this indicator.<br />
Refugia Indicator and Element Summary - The <strong>Project</strong> will have neutral (0) effects on this indicator.<br />
Width/Depth Ratio Indicator and Element Summary - Due the nature of the stream channels in the<br />
action area the <strong>Project</strong> will have neutral (0) effects on this indicator in critical habitat/EFH.<br />
Streambank Indicator Summary - The <strong>Project</strong> will have neutral (0) effects on streambank condition in<br />
critical habitat/EFH.<br />
Floodplain Connectivity Indicator Summary - The project will have neutral (0) effects on floodplain<br />
connectivity in critical habitat/EFH.<br />
Change in Peak/Base Flow and Increase in Drainage Network Indicator Summary - The <strong>Project</strong><br />
would result in slight short- and long-term positive effects (+) from road upgrade and road rehabilitation.<br />
Shasta-Trinity National Forest – South Fork Management Unit – June 13, 2005 - 60
Fisheries Biological Assessment/Evaluation – <strong>Hidden</strong> <strong>Valley</strong> <strong>Watershed</strong> <strong>Restoration</strong> <strong>Project</strong><br />
Road Density & Location Indicator Summary - The <strong>Project</strong> will have positive (+) long-term effects on<br />
Road Density and Location, and effects will be of sufficient magnitude to change the road density<br />
baseline category in Appendix D.<br />
Disturbance History Indicator Summary - CWE modeling shows that at the watershed scale the project<br />
maintains (neutral effects) or insignificantly improves (+) disturbance history in the action area.<br />
Riparian Reserves Indicator Summary - The <strong>Project</strong> will have neutral (0) effects due to Riparian<br />
Reserve in critical habitat/EFH.<br />
Shasta-Trinity National Forest – South Fork Management Unit – June 13, 2005 - 61
Fisheries Biological Assessment/Evaluation – <strong>Hidden</strong> <strong>Valley</strong> <strong>Watershed</strong> <strong>Restoration</strong> <strong>Project</strong><br />
VIII. ESA Effect Determination<br />
<strong>Project</strong> Effects Determination Key for Species and Designated Critical Habitat<br />
1) Do any of the indicator summaries have a positive (+) or negative (-) conclusion?<br />
Yes – Go to 2<br />
No – No Effect<br />
2) Are the indicator summary results only positive?<br />
Yes – NLAA<br />
No – Go to 3<br />
3) If any of the indicator summary results are negative, are the effects insignificant or discountable?<br />
Yes – NLAA<br />
No – LAA, fill out Adverse Effects Form<br />
Direct effects to coho salmon are not expected to occur. There are no aspects of the <strong>Project</strong> that will<br />
occur where fish are present.<br />
Analysis of the effects of the <strong>Project</strong> Elements on the habitat indicators has found that negative effects<br />
that are of sufficient probability (discountable) and magnitude (insignificant) to affect SONCC coho<br />
salmon and its critical habitat and EFH. This <strong>Project</strong> May Affect, but is not likely to adversely affect<br />
SONCC coho salmon and its critical habitat.<br />
Aggregated Federal Effects<br />
There are no aggregated Federal effects<br />
Shasta-Trinity National Forest – South Fork Management Unit – June 13, 2005 - 62
Fisheries Biological Assessment/Evaluation – <strong>Hidden</strong> <strong>Valley</strong> <strong>Watershed</strong> <strong>Restoration</strong> <strong>Project</strong><br />
IX. ESA Cumulative Effects<br />
The ESA defines cumulative effects in 50 CFR. § 402.02 as “those effects of future State or private<br />
activities, not involving Federal activities that are reasonably certain to occur within the <strong>Project</strong> area of the<br />
Federal action subject to consultation.” Available information on past and present Federal, State and<br />
Private actions are reflected in the existing condition discussions under each indicator in the previous<br />
section of this BA/BE. Future Federal actions will be analyzed through separate section 7 consultations<br />
and are not considered in this section. There are no known future State actions planned in the subject<br />
watersheds. The <strong>Project</strong> area includes some private industrial timber lands. In addition, there are<br />
scattered private/residential blocks of land. The predominant past land use on private lands was timber<br />
harvest, and it is likely that timber harvest will continue to be the predominant land use into the future.<br />
Mining, timber harvest, grazing, and roads have all contributed cumulatively to habitat degradation in<br />
addition to natural events including wildland fires and unstable geology. Sediment is the most common<br />
indicator determined to be at risk or not properly functioning in the subject watersheds. The <strong>Project</strong>s will<br />
result in a net reduction of fill/sediment in channel profiles and a discountable amount of sediment will be<br />
input as a result of the <strong>Project</strong>. The <strong>Project</strong> would not add measurably or incrementally to cumulative<br />
effects. Each removed or upgraded stream crossing reduces the risk of additional future sediment<br />
impacts at the 7 th and 5 th field watershed scales.<br />
Shasta-Trinity National Forest – South Fork Management Unit – June 13, 2005 - 63
Fisheries Biological Assessment/Evaluation – <strong>Hidden</strong> <strong>Valley</strong> <strong>Watershed</strong> <strong>Restoration</strong> <strong>Project</strong><br />
X. Essential Fish Habitat Determination<br />
A description of the proposed action appears in Part III of this Biological Assessment.<br />
The Magnuson-Stevens Fishery Conservation and Management Act (MSA), in concordance with the<br />
Sustainable Fisheries Act of 1996 (Public Law 104-267) designated Essential Fish Habitat (EFH) for coho<br />
and Chinook salmon (Federal Register, Vol. 67, No. 12). The MSA defined EFH as “...those waters and<br />
substrate necessary to fish for spawning, breeding, feeding, or growth to maturity (Federal Register, Vol.<br />
67, No. 12).” EFH for coho salmon and Chinook salmon in the Action Area is identical to coho critical<br />
habitat displayed in Figure 2.<br />
Analysis of the effects of the <strong>Project</strong> Elements on the habitat indicators has found that negative effects<br />
that are of sufficient probability (discountable) and magnitude (insignificant) to affect essential fish habitat.<br />
This <strong>Project</strong> will not adversely affect Essential Fish Habitat.<br />
NEPA Cumulative Impact<br />
“Cumulative impact” is the impact on the environment which results from the incremental impact of the<br />
action when added to other past, present and reasonably foreseeable future actions regardless of what<br />
agency (Federal or non-federal) or person undertakes such actions. Cumulative impacts can result from<br />
individual minor but collectively significant action taking place over a period of time.<br />
Fitzgerald (2005) summarized pre and post project <strong>Watershed</strong> Condition Class by 8 th Field HUC<br />
watershed. In the short-term, the <strong>Project</strong> will result in a net reduction of fill/sediment in channel profiles<br />
and a discountable amount of sediment will be input into fish-bearing streams as a result of the <strong>Project</strong>.<br />
Within 10 years of <strong>Project</strong> implementation, there will be a net reduction in controllable sediment. The 8 th<br />
Field HUC watersheds within Forest Service ownership will improve substantially. There will be less<br />
improvement in watersheds with dominantly private ownership.<br />
Foreseeable actions within the project area planned by the Forest Service, include precommericial<br />
thinning, other watershed restoration, fuels treatements and power/gas-line maintenance. No commercial<br />
timber harvest is being planned on public lands. These actions are expected to further reduce the risk of<br />
cumulative watershed effects. Several timber harvest plans have been filed for private lands within the<br />
<strong>Hidden</strong> <strong>Valley</strong> <strong>Watershed</strong>. These harvests will likely increase the risk of adverse Cumulative <strong>Watershed</strong><br />
Impacts (Fitzgerald 2005). Due to the predominately non-fish bearing status of the <strong>Hidden</strong> <strong>Valley</strong><br />
watershed (only first 150-feet of the major tributaries are fish-bearing), impacts of harvest on private lands<br />
will not lead to significant adverse effects to anadromous and resident fish in the SFTR.<br />
Forest Sensitive Species<br />
It is my determination that the implementation of the <strong>Project</strong> may insignificant affects to individuals but is<br />
not likely to trend towards Federal listing or loss of viability of Forest Sensitive species.<br />
Shasta-Trinity National Forest – South Fork Management Unit – June 13, 2005 - 64
XI. Literature Cited<br />
Fisheries Biological Assessment/Evaluation – <strong>Hidden</strong> <strong>Valley</strong> <strong>Watershed</strong> <strong>Restoration</strong> <strong>Project</strong><br />
Allan, J.D. 1995. Stream ecology: structure and function of running waters. Chapman Hill, New York, NY.<br />
Argent, D. G. and P. A. Fleebe. 1999. Fine sediment effects on brook trout eggs in laboratory streams.<br />
Fisheries Research. 39:253-262.<br />
Baltz, D.M. and P.B. Moyle. 1984. “Segregation by species and size classes of rainbow trout, Salmo<br />
gairdneri, and Sacramento sucker, Catostomus occidentalis, in three California streams.”<br />
Environmental Biology of Fish 10: 101-110.<br />
Behnke, R.J. 1992. Native trout of western North America. American Fisheries Society Monograph No. 6.<br />
Bethesda MD.<br />
Berkman, H. E. and C. R. Rabeni. 1987. Effects of siltation on stream fish communities. Environmental<br />
Biology of Fishes. 18:4:285-294.<br />
Bjornm, T. C. and 6 co-authors. 1977. Transport of granitic sediment in streams and its effects on insets<br />
and fish. University of Idaho, Idaho Cooperative Fisheries Research Unit, Research Technical<br />
Completion Report, <strong>Project</strong> B-036-IDA Bulletin 17.<br />
Bjornn T.C., D.W. Reiser. 1991. Habitat requirements of salmonids in streams. Pages 83-138 in W. R.<br />
Meehan, editor. Influences of forest and rangeland management on salmonid fishes and their<br />
habitats. Special Publication 19. American Fisheries Society, Bethesda, MD.<br />
Boles, G.L. 1990. “Food habits of juvenile wild and hatchery steelhead trout, Oncorhynchus mykiss, in the<br />
Trinity River, California.” Inland Fisheries Administrative Report No 90-10.<br />
Borok, S.L. and H.W. Jong. 1997. “Evaluation of salmon and steelhead spawning habitat quality in the<br />
South Fork Trinity River basin, 1997.” Inland Fisheries Administrative Report No. 97-8.<br />
Britain, J.E. and T.J. Eikeland. 1988. Invertebrate drift- a review. Hydrobiologia. 166:77-93.<br />
Brown, L.R. and P.B. Moyle. 1991. “Changes in habitat and microhabitat partitioning within an<br />
assemblage of stream fishes in response to predation by Sacramento squawfish (Ptychocheilus<br />
grandis).” Canadian Journal of Fisheries and Aquatic Science. 43:849-856.<br />
Burgner, R.L., J.T. Light, L. Margolis, T. Okazaki, A. Tautz and S. Ito. 1992. “Distribution and origins of<br />
steelhead trout (Oncorhynchus mykiss) in offshore waters of the North Pacific Ocean.” International<br />
North Pacific Fisheries Commission Bulletin No. 51.<br />
Burns, J.W. 1972. “Some effects of logging and associated road construction on Northern California<br />
Streams.” Transactions of the American Fisheries Society. 101:1-17.<br />
Busby, P.J., T.C. Wainwright, R.S. Waples. 1994. Status review of Klamath Mountain Province steelhead.<br />
U.S. Dep. Commer., NOAA Tech. Memo. NMFS-NWFSC-19. 261 pages.<br />
Busby, P.J., T.C. Wainwright, G.J. Bryant, L.J. Lierheimer, R.S. Waples, F.W. Waknitz, and I.V.<br />
Lagomarsino. 1996. Status review of west coast steelhead from Washington, Idaho, Oregon, and<br />
California. National Marine Fisheries Technical Memorandum NMFSNWFSC-27. Seattle WA. 261<br />
pages.<br />
Shasta-Trinity National Forest – South Fork Management Unit – June 13, 2005 - 65
Fisheries Biological Assessment/Evaluation – <strong>Hidden</strong> <strong>Valley</strong> <strong>Watershed</strong> <strong>Restoration</strong> <strong>Project</strong><br />
CDFG (California Department of Fish and Game). 2001. “Final report on anadromous salmonid fish<br />
hatcheries in California.” California Department of Fish and Game and National Marine Fisheries<br />
Service Southwest Region Joint Hatchery Review Committee. Review draft, June 27, 2001.<br />
CDFG (California Department of Fish and Game). 2004. Recovery Strategy for California Coho Salmon.<br />
Report to the Fish and Game Commission. February 4, 2004.<br />
CDFG (California Department of Fish and Game). 2004a. South Fork Trinity River spring<br />
Chinook/Summer Steelhead Snorkel Survey Totals. (Unpublished memo to file by Patrick Garrison,<br />
Biologist, Department of Fish and Game - Northern California, North Coast Region). September 2,<br />
2004<br />
CDFG (California Department of Fish and Game). 2001. “Final report on anadromous salmonid fish<br />
hatcheries in California.” California Department of Fish and Game and National Marine Fisheries<br />
Service Southwest Region Joint Hatchery Review Committee. Review draft, June 27, 2001.<br />
Chapman, D. W. 1988. Critical review of variables use to define effects of fines in redds of large<br />
salmonids. Transactions of the American Fisheries Society 117: 1-21.<br />
Dean, M. 1995. Survey report. Snorkel and redd surveys of spring chinook salmon in the South Fork<br />
Trinity River (1995 season). Prepared for Huber , Harpham, and Associates. 17 pp.<br />
EPA (Environmental Protection Agency). 1998. South Fork Trinity River and Hayfork Creek Sediment<br />
Total Daily Maximum Loads. Region 9.<br />
Everest, F.H., J.R. Sedell, G.H. Reeves, and J. Wolfe. 1985. Fisheries enhancement in the Fish Creek<br />
basin—an evaluation of in-channel and off-channel projects, 1984. 1984 Annual Report, Bonneville<br />
Power Administration, Division of Fish and Wildlife, <strong>Project</strong> 84-11, Portland Oregon.<br />
Everest, F. H. and D. W. Chapman. 1972. Habitat selection and spatial interaction by juvenile Chinook<br />
salmon and steelhead trout in two Idaho streams. Journal of the Fisheries Research Board of Canada<br />
29:91-100.<br />
Federal Register, 62(87):24588-24609. May 6, 1997. Endangered and threatened species; threatened<br />
status for Southern Oregon/Northern California Coast Evolutionarily Significant Unit (ESU) of coho<br />
salmon. National Marine Fisheries Service.<br />
Fitzgerald 2005. <strong>Hidden</strong> <strong>Valley</strong> <strong>Watershed</strong> <strong>Restoration</strong> <strong>Project</strong> Hydrologist Report Cumulative <strong>Watershed</strong><br />
Effects Analysis. May 26, 2005. Draft<br />
Foster-Wheeler. 2001. <strong>Hidden</strong> <strong>Valley</strong>, Plummer Creek, and Rattlesnake Creek <strong>Watershed</strong> Analysis.<br />
Prepared for the USDA Forest Service, Shasta-Trinity National Forest. Redding, CA. 96001.<br />
Hardy, T.B. and R.C. Addley. 2001. “Evaluation of interim instream flow needs in the Klamath River.<br />
Phase II. Final Report.” Institute for Natural Systems Engineering.” Utah Water Research Laboratory.<br />
Utah State University. Logan UT.<br />
Harvey, B.C., J.L. White, and R.J. Nakamoto. 2002. Habitat relationships and larval drift of native and<br />
nonindigenous fishes in neighboring tributaries of a coastal California river. Transactions of the<br />
American Fisheries Society. 131: 159-170.<br />
Harvey, B.C. and R.J. Nakamoto. 1997. Habitat-dependent interactions between two size classes of<br />
juvenile steelhead in a small stream. Canadian Journal of Fisheries and Aquatic Sciences. 54:27-31.<br />
Shasta-Trinity National Forest – South Fork Management Unit – June 13, 2005 - 66
Fisheries Biological Assessment/Evaluation – <strong>Hidden</strong> <strong>Valley</strong> <strong>Watershed</strong> <strong>Restoration</strong> <strong>Project</strong><br />
Hawkins, D.K. and T.P. Quinn. 1996. Critical swimming velocity and associated morphology of juvenile<br />
coastal cutthroat trout (Oncorhynchus clarki clarki), steelhead trout (Oncorhynchus mykiss), and their<br />
hybrids. Canadian Journal of Fisheries and Aquatic Science 53:1487-1496.<br />
Hayfork Ranger District (HRD), 1992. Unpublished data. Grapevine Creek Habitat Assessment. Hayfork<br />
Ranger District, Shasta-Trinity National Forest, Hayfork, CA.<br />
Healey, M.C. 1991. Life history of chinook salmon (Oncorhynchus tshawytscha). Pages 311-394 in C.<br />
Groot and L. Margolis, eds. Pacific salmon life histories. University of British Columbia Press.<br />
Vancouver, B.C., Canada.<br />
Hillemeier, D. C. 1993. Summer habitat utilization by adult spring Chinook salmon (Oncorhynchus<br />
tshawytscha), South Fork Trinity River, California. M.S. Thesis, Humboldt State Univ., Arcata, CA. 93<br />
pp.<br />
Hillman, T. W., J. S. Griffith, and W. S. Platts. 1987. Summer and winter habitat selection by juvenile<br />
chinook salmon in a highly sedimented Idaho stream. Transactions of the American Fisheries Society<br />
116: 185-195.<br />
Hopelain, J.S. 2001. Lower Klamath River angler creel census with emphasis on upstream migrating fall<br />
Chinook salmon, coho salmon, and steelhead trout during July through October, 1983 through 1987.<br />
Inland Fisheries Administrative Report 01-1.<br />
Hopelain, J.S. 1998. Age, growth, and life history of Klamath River Basin steelhead (Oncorhynchus<br />
mykiss irideus) as determined from scale analysis. Inland Fisheries Administrative Report 98-3.<br />
Jong, H.W. 1997. Evaluation of Chinook spawning habitat quality in the Shasta and South Fork Trinity<br />
River, 1994. Inland Fisheries Administrative Report 97-5.<br />
Kaczynski, V. 1994. Wildfire impacts on stream habitats. in: Prescribed Burning Issues and Notes,<br />
Oregon Department of Forestry, Vol. 4: No. 1.<br />
Keeley, E.R. and J.D. McPhail. 1998. Food abundance, intruder pressure, and body size as determinants<br />
of territory size in juvenile steelhead trout (Onchorhynchus mykiss). Behavior 135:65-82.<br />
Kesner, W.D. and R.A. Barnhardt. 1972. Characteristics of the fall-run steelhead trout (Salmo gairdneri<br />
gairdneri) of the Klamath River system with emphasis on the half-pounder. California Fish and Game<br />
58: 204-220.<br />
Lisle, T. E. 1989. Sediment transport and resulting deposition in spawning gravels, north coastal<br />
California. Water Resources Research. 25:6: 1303-1319.<br />
Lisle, T. E. and S. Hilton. 1991. Fine sediment in pools: an index of how sediment is affecting a stream<br />
channel. R-5 Habitat Relationship Technical Bulletin No. 6. USDA- Forest Service, Redwood<br />
Sciences Laboratory, Arcata, CA.<br />
Llantos A., C. Cook. 2001. Assessment of sediment storage and stream bank erosion in the South Fork<br />
Trinity River Basin, Northwestern California. Eureka, Ca: USDA Forest Service. Six Rivers National<br />
Forest.<br />
KRBFTF (Klamath River Basin Fisheries Task Force). 1991. Long Range plan for the Klamath River<br />
Basin Conservation Area Fisheries <strong>Restoration</strong> Program.<br />
KRSIC (Klamath River Stock Identification Committee). 1993. “Salmon and steelhead populations of the<br />
Klamath-Trinity basin.” Report to the Klamath River Task Force.<br />
Shasta-Trinity National Forest – South Fork Management Unit – June 13, 2005 - 67
Fisheries Biological Assessment/Evaluation – <strong>Hidden</strong> <strong>Valley</strong> <strong>Watershed</strong> <strong>Restoration</strong> <strong>Project</strong><br />
La Faunce, D.A. 1967. A king salmon spawning survey of the South Fork Trinity River, 1964. California<br />
Dept. of Fish and Game. Marine Res. Admin Report. 67-10 13pp.<br />
Madej, M. A. 2001. Erosion and sediment delivery following removal of forest roads. Earth Surface<br />
Processes and Landforms. Vol. 26 175-190.<br />
Matthews K.R., N.H. Berg, D.L. Azuma. 1994. Cool water formation and trout habitat use in a deep pool<br />
in the Sierra Nevada, California. Transactions of the American Fisheries Society 123: 549-564.<br />
McEwan, D. and T.A. Jackson. 1996. Steelhead <strong>Restoration</strong> and Management Plan for California.<br />
Department of Fish and Game.<br />
McMahon, T. E. and D. S. de Calesta. 1990 Effects of Fire on Fish and Wildlife. In: Natural and<br />
Prescribed Fire in Pacific Northwest Forests. Chapter 18. Edited by J. D. Watstad et al. Oregon State<br />
University Press.<br />
McMichael, G.A., T.N. Pearson, and S.A. Leider. 1999. Behavioral interactions among hatchery-reared<br />
steelhead and wild Oncorhynchus mykiss in natural streams. North American Journal of Fisheries<br />
Management 19: 948-956.<br />
Meyers, J.M. R.G. Kope, G.J. Bryant, D.Teel, L.J. Lierheimer, T.C. Wainwright, W. S. Grant, F. W.<br />
Waknitz, K. Neely, S.T. Lindley, and R.S. Waples. 1998. Status Review of Chinook salmon of<br />
Washington, Idaho, Oregon and California. USDC NOAA Technical Memorandum NMFS-NWFSC-<br />
35.<br />
Moffett, J.W. and S.H. Smith. 1950. “Biological Investigations of the fishery resources of Trinity River,<br />
California.” Special Scientific Report- Fisheries No. 12, U.S. Fish and Wildlife Service.<br />
Moyle, P. 2002. Inland Fishes of California, 2nd Ed. University of California Press. Berkeley, CA.<br />
Moyle, P.B. and D.M. Baltz. 1985. Microhabitat use by an assemblage of California stream fishes:<br />
Developing criteria for instream flow determinants. Transactions of the American Fisheries Society.<br />
114:695-704.<br />
Nakamoto, R. 1994. Characteristics of pools used by adult summer steelhead oversummering In the New<br />
River, California. Transactions of the American Fisheries Society. 123: 757-765.<br />
Newcombe, C. P. and J. O. T. Jensen. 1996. Channel suspended sediment and Fisheries: A synthesis for<br />
quantitative assessment of risk and impact. North American Journal of Fisheries Management.<br />
16:693-727.<br />
Newcombe, C. P. and D. D. MacDonald. 1991. Effects of suspended sediments on aquatic ecosystems.<br />
North American Journal of Fisheries Management. 11:72-82<br />
Nielson J.L., T.E. Lisle, V. Ozaki. 1994. Thermally stratified pools and their use by steelhead in northern<br />
California streams. Transactions of the American Fisheries Society 123: 613-625.<br />
NMFS (National Marine Fisheries Service). 1998. Endangered and Threatened Species: West Coast<br />
Chinook Salmon; Listing Status Change; Proposed Rule. Fed. Reg. Vol. 63 (45) 11481-11484. March<br />
9, 1998.<br />
NMFS (National Marine Fisheries Service). 1999. Designated Critical habitat; Central California Coast<br />
and Southern Oregon/ Northern California Coasts Coho Salmon; Final Rule. Fed. Reg. Vol. 64 (86)<br />
24049-24062. May 5, 1999<br />
Shasta-Trinity National Forest – South Fork Management Unit – June 13, 2005 - 68
Fisheries Biological Assessment/Evaluation – <strong>Hidden</strong> <strong>Valley</strong> <strong>Watershed</strong> <strong>Restoration</strong> <strong>Project</strong><br />
NMFS (National Marine Fisheries Service). 2001. Notice of Determination; endangered and threatened<br />
species: final listing determination for Klamath Mountains Province steelhead. Federal Registrar<br />
[Docket No. 010118020-1082-02, 04 April 2001] 66(65): 17845-17856.<br />
Nickelson, T.E., M.F. Solazzi, and S.L. Johnson. 1986. Use of hatchery coho salmon (Oncorhynchus<br />
kisutch) presmolts to rebuild wild populations in Oregon coastal streams. Canadian Journal of<br />
Fisheries and Aquatic Sciences. 43:2443-2449.<br />
Nielsen, J.L. and T.E. Lisle. 1994. “Thermally stratified pools and their use by steelhead in<br />
Northern California streams.” Transactions of the American Fisheries Society 123:613-626.<br />
NOAA Fisheries 2003. Preliminary conclusions regarding the updated status of listed ESUs of West<br />
Coast salmon and steelhead.<br />
ODFW (Oregon Department of Fish and Wildlife). 1995. “Biennial report on the status of wild fish in<br />
Oregon.” Oregon Department of Fish and Wildlife. Portland OR.<br />
PWA (Pacific <strong>Watershed</strong> Associates). 1994. Action Plan for <strong>Restoration</strong> of the South Fork Trinity River<br />
<strong>Watershed</strong> and its Fisheries. Prepared for the U.S. Bureau of Reclamation and the Trinity River Task<br />
Force.<br />
Raines, M.A. 1998. South Fork Trinity River Sediment Analysis. Prepared for Tetra-Tech, Inc. Appendix to<br />
EPA – South Fork Trinity River and Hayfork Creek Sediment Total Maximum Daily Loads. U.S.<br />
Environmental Protection Agency, Region 9. 66p.<br />
Reid, L M. 1998. Review of the: Sustained yield plan/habitat conservation plan for the properties of the<br />
Pacific Lumber Company, Scotia Pacific Holding Company, and Salmon Creek Corporation. Report<br />
prepared for Congressman George Miller, U.S. House of Representatives.<br />
Reiser D.W. and T.C. Bjornn. 1979. Influence of forest and rangeland management on anadromous fish<br />
habitat in Western North America. USDA Forest Service anadromous fish habitat program. GTP<br />
PNW-96. 56 pp.<br />
Relyea, C. D., G. Y. Minshall, R. J. Danehy. 2000. Stream insects as bioindicators of fine sediment.<br />
<strong>Watershed</strong> Management 2000 Conference. Water Environment Federation.<br />
Rosgen, D.L. 1985. A Stream Classification System. In Riparian Ecosystems and their Management. First<br />
North American Riparian Conference. RM-120:91-95. USDA Forest Service: Rocky Mountain Forest<br />
and Range Experiment Station.<br />
Sandercock, R.K. 1991. Life history of coho salmon (Oncorhynchus kisutch). Pages 395-445 in C. Groot<br />
and L. Margolis, editors. Pacific salmon life histories. University of British Columbia Press,<br />
Vancouver.<br />
Shapovalov, L. and A.C. Taft. 1954. “The life history of the steelhead rainbow trout (Salmo gairdneri) and<br />
silver salmon (Oncorhynchus kisutch) with special reference to Waddell Creek, California and<br />
recommendations regarding their management.” California Fish and Game, Fish Bulletin No. 98.<br />
Sigler, J. W., T. C. Bjornn, R. H. Everest. 1984. Effects of chronic turbidity on density and growth of<br />
steelhead and coho salmon. Transactions of the American Fisheries Society 115: 142-150.<br />
Spence, B.C., G.A. Lomnicky, R.M. Hughes, and R.P. Novitski. 1996. An ecosystem approach to<br />
salmonid conservation. TR-4501-96-6057. ManTech Environmental Research Services Corp.,<br />
Corvallis, OR.<br />
Shasta-Trinity National Forest – South Fork Management Unit – June 13, 2005 - 69
Fisheries Biological Assessment/Evaluation – <strong>Hidden</strong> <strong>Valley</strong> <strong>Watershed</strong> <strong>Restoration</strong> <strong>Project</strong><br />
(TCRCD) Trinity County Resource Conservation District. 2003. South Fork Trinity River Water Quality<br />
Monitoring <strong>Project</strong> - Agreement No. P0010340 Final Report. Prepared for California Department of<br />
Fish and Game by TCRCD, with assistance from Graham Matthews . Weaverville, CA. 77 pp.<br />
USDA Forest Service. 1995. Land and Resource Management Plan. Shasta-Trinity National Forest,<br />
Redding CA.<br />
USDA Forest Service, 2000. Water Quality Management for Forest System Lands in California: Best<br />
Management Practices. USDA Forest Service, Pacific Southwest Region, September 2000.<br />
USDA, DOI, DOC. 2004. Analytical Process for Development of Biological Assessments for Federal<br />
Actions Affecting Fish within the Range of the Northwest Forest Plan. November, 2004.<br />
USDA Forest Service, 2005. Road-Stream Crossing Excavation Effectiveness Monitoring Report (working<br />
draft). Trinity Zone, Shasta Trinity National Forest, Pacific Southwest Region (unpublished report).<br />
Viola, A.E. and M.L. Schuck. 1995. “A method to reduce the abundance of residual hatchery steelhead in<br />
rivers.” North American Journal of Fisheries Management. 15: 488-493.<br />
Waples, R.S. 1991. “Genetic interactions between hatchery and wild salmonids: lessons from the Pacific<br />
Northwest.” Canadian Journal of Fisheries and Aquatic Sciences 48(Supplement 1):124-133.<br />
Weitkamp, L.A., T.C. Wainwright, G.J Bryant, G.B. Milner, D.J. Teel, R.G. Kope, and R.S. Waples, 1995.<br />
Status Review of Coho Salmon from Washington, Oregon, and California. USDC NOAA Fisheries<br />
Technical Memorandum NMFS-NWFSC-24. Available at<br />
http://www.nwfsc.noaa.gov/publications/techmemos/tm24/tm24.htm<br />
Shasta-Trinity National Forest – South Fork Management Unit – June 13, 2005 - 70
Fisheries Biological Assessment/Evaluation – <strong>Hidden</strong> <strong>Valley</strong> <strong>Watershed</strong> <strong>Restoration</strong> <strong>Project</strong><br />
Appendix A: National Fire Plan <strong>Project</strong> ESA Compliance<br />
PROJECT COMPLIANCE WITH THE ENDANGERED SPECIES ACT<br />
CONSULTATION REQUIREMENTS, USING THE<br />
COUNTERPART CONSULTATION REGULATIONS<br />
USDA FOREST SERVICE<br />
PROJECT NAME: <strong>Hidden</strong> <strong>Valley</strong> <strong>Watershed</strong> <strong>Restoration</strong> <strong>Project</strong><br />
STATE: California<br />
FOREST SERVICE REGION: Region 5<br />
NATIONAL FOREST/GRASSLAND: Shasta-Trinity<br />
RANGER DISTRICT: Hayfork and Yolla Bolla<br />
DATE OF COMPLETED BE or BA/BE: June 9, 2005<br />
NAME OF JOURNEY-LEVEL BIOLOGIST WHO COMPLETED THE BE or BA:<br />
John S. Lang, Fishery Biologist<br />
Hayfork and Yolla Bolla Ranger Districts<br />
Shasta-Trinity National Forest<br />
As proposed the project is within the scope of, and will support, the National Fire Plan, because:<br />
The <strong>Project</strong> will replace aging road/stream crossings that are undersized and susceptible to failure;<br />
Create a maintainable an accessible road system for fire suppression. The <strong>Project</strong> is within the<br />
scope of road maintenance and culvert replacement/upgrade, leaving needed roads available and<br />
accessible by fire suppression personnel;<br />
The present road system is not maintained. Removing roads not needed for future use and<br />
improving the needed system roads will ensure rapid access to remote areas for fire suppression<br />
actions;<br />
Improve long-term watershed condition to facilitate vegetation treatment to reduce the risk of<br />
catastrophic fire. The watersheds are in a condition that limits near term vegetation options.<br />
Improving watershed condition will allow short-term impacts from vegetation treatments designed<br />
to reduce fuel loads.<br />
The effects analysis completed and documented in the above BE or BA was done under the<br />
Section 7 counterpart regulations of the Endangered Species Act (Federal Register,<br />
December 8, 2003), and is in compliance with those regulations and the March 4, 2004<br />
Alternative Consultation Agreement between the Forest Service, FWS and NMFS.<br />
SIGNATURE OF LINE OFFICER: __________________________<br />
NAME OF LINE OFFICER: Donna F. Harmon____________<br />
TITLE OF LINE OFFICER: District Ranger_______________<br />
DATE: ___________________________<br />
Shasta-Trinity National Forest – South Fork Management Unit – June 13, 2005 - 71
Appendix B – Road Slope Positions<br />
Fisheries Biological Assessment/Evaluation – <strong>Hidden</strong> <strong>Valley</strong> <strong>Watershed</strong> <strong>Restoration</strong> <strong>Project</strong><br />
Roads with slope positions located in the lower 3 rd of the watershed and 0.1 to 0.75 miles to CH/EFH.<br />
Slope position Proximity to CH/EFH Treatment Road ID Road Length (miles) Stream-xings Est Fill (yd3) Short-term erosion (max) (yds3)<br />
Lower 3rd<br />
0.1<br />
Decommission<br />
1S26C 0.3 0 0 0.0<br />
U1S30 0.6 4 1000 36.4<br />
Decommission Total 0.9 4 1000 36.4<br />
Decommission to trail<br />
1S01A 0.9 0 0 0.0<br />
Decommission to trail Total 0.9 0 0 0.0<br />
Upgrade<br />
3N10 0.1 0 0 0.0<br />
Upgrade Total 0.1 0 0 0.0<br />
0.1 Total 1.9 4 1000 36.4<br />
0.25-0.75 mi<br />
Decommission<br />
1N24C 2.2 5 7853 98.2<br />
1S01 1.2 5 17500 185.2<br />
1S01B 0.9 2 2373 48.7<br />
U1N11EB 0.1 0 0 0.0<br />
U1N24J 0.1 0 0 0.0<br />
Decommission Total 4.4 12 27726 332.1<br />
Decommission to trail<br />
1S01 1.2 3 10500 122.0<br />
1S01A 1.0 2 331 30.3<br />
Decommission to trail Total 2.2 5 10831 152.4<br />
Upgrade<br />
1S12 1.4 3 450 1.0<br />
U1N24I 0.6 2 500 1.0<br />
Upgrade Total 2.0 5 950 2.0<br />
Annual Closure<br />
1S26 3.2 0 0 0.0<br />
Annual Closure Total 3.2 0 0 0.0<br />
0.25-0.75 mi Total 11.8 22 39507 486.4<br />
Lower 3rd Total 13.7 26 40507 522.8<br />
Shasta-Trinity National Forest – South Fork Management Unit – June 13, 2005 - 72
Fisheries Biological Assessment/Evaluation – <strong>Hidden</strong> <strong>Valley</strong> <strong>Watershed</strong> <strong>Restoration</strong> <strong>Project</strong><br />
Roads with slope positions located in the middle 3 rd of the watershed and 0.25 to 0.75 miles to CH/EFH.<br />
Middle 3rd<br />
0.25-0.75 mi<br />
Decommission<br />
1N11 0.3 0 0 0.0<br />
1N11A 0.3 0 0 0.0<br />
1N11B 1.5 4 3513 59.0<br />
1N11C 0.7 5 3504 58.9<br />
1N11D 0.7 2 941 35.8<br />
1N11F 0.3 1 480 31.6<br />
1N24 2.7 7 24500 248.3<br />
1N24A 0.9 5 3504 58.9<br />
1N24B 1.5 0 0 0.0<br />
1N24F 0.4 0 0 0.0<br />
1S10 0.5 0 0 0.0<br />
1S16 1.0 6 3000 54.3<br />
U1N11EA 0.2 0 0 0.0<br />
U1N24E 0.2 0 0 0.0<br />
U1S06A 0.2 0 0 0.0<br />
U2N36B 0.2 0 0 0.0<br />
UV1S14F 0.4 1 250 29.5<br />
Decommission Total 11.9 31 39692 576.3<br />
Decommission Segment<br />
1S11 3.0 16 17600 186.0<br />
Decommission Segment Total 3.0 16 17600 186.0<br />
Hydro-close Segment<br />
1S11 3.1 12 4200 65.2<br />
Hydro-close Segment Total 3.1 12 4200 65.2<br />
Realign<br />
1N24E 0.3 0 0 0.0<br />
Realign Total 0.3 0 0 0.0<br />
Upgrade<br />
1N11 4.5 16 2400 1.0<br />
1S01 3.4 11 1650 1.0<br />
1S02 0.7 4 600 1.0<br />
1S06 1.7 7 1050 1.0<br />
2N25 3.5 0 0 0.0<br />
3N19 3.7 0 0 0.0<br />
3N30 1.5 0 0 0.0<br />
Upgrade Total 19.1 38 5700 4.0<br />
0.25-0.75 mi Total 37.4 97 67192 831.5<br />
Middle 3rd Total 37.4 97 67192 831.5<br />
Grand Total 37.4 97 67192 831.5<br />
Shasta-Trinity National Forest – South Fork Management Unit – June 13, 2005 - 73
Fisheries Biological Assessment/Evaluation – <strong>Hidden</strong> <strong>Valley</strong> <strong>Watershed</strong> <strong>Restoration</strong> <strong>Project</strong><br />
Roads with slope positions located in the upper 3rd of the watershed and >0.75 miles to CH/EFH or along ridgelines.<br />
Upper 3rd<br />
0.75-2.0 mi<br />
Decommission<br />
1N05C 1.4 5 2500 49.8<br />
1S07 0.3 0 0.0<br />
1S14F 0.3 1 500 31.8<br />
1S23A 1.2 0 0 0.0<br />
1S23B 0.8 0 0 0.0<br />
1S36 0.6 0 0 0.0<br />
1S36A 0.3 0 0 0.0<br />
2N10M 0.6 1 500 31.8<br />
2N26A 0.3 1 500 31.8<br />
2N27 3.3 6 15000 162.5<br />
2N36A 0.6 2 1000 36.3<br />
3N19A 0.4 0 0 0.0<br />
3N19B 0.8 4 2500 49.8<br />
3N19C 0.9 0 0 0.0<br />
3N19D 0.7 0 0 0.0<br />
3N26 0.6 4 1080 37.0<br />
U1N05E 2.1 0 0 0.0<br />
U1N24G 0.2 0 0 0.0<br />
U1N24H 0.3 0 0 0.0<br />
U1S02A 0.1 0 0 0.0<br />
U1S04A 0.4 0 0 0.0<br />
U3N16B 0.2 0 0 0.0<br />
U3N19C 0.1 0 0 0.0<br />
U3N19CA 0.2 0 0 0.0<br />
U3N19CB 0.2 0 0 0.0<br />
U3N19CC 0.1 0 0 0.0<br />
U3N19F 0.1 0 0 0.0<br />
U3N19G 0.1 0 0 0.0<br />
U4N12C 0.7 0 0 0.0<br />
UV1S14FA 0.1 0 0 0.0<br />
Decommission Total 17.7 24 23580 430.7<br />
Hydro-close<br />
1S13 2.4 8 4000 63.3<br />
Hydro-close Total 2.4 8 4000 63.3<br />
Upgrade<br />
1N20 0.3 2 300 1.0<br />
1N24 7.1 25 3750 1.0<br />
1N24D 0.5 1 150 1.0<br />
1S03 0.1 0 0 0.0<br />
1S04 3.9 14 2100 1.0<br />
1S05 2.5 0 0 0.0<br />
1S15 0.6 2 300 1.0<br />
1S20 0.1 0 0 0.0<br />
3N10 10.2 16 2400 1.0<br />
3N30 1.6 0 0 0.0<br />
4N12 11.2 9 1350 1.0<br />
4N12D 0.7 2 300 1.0<br />
6N01M 0.2 0 0 0.0<br />
U6N01M 0.1 0 0 0.0<br />
Upgrade Total 39.3 71 10650 8.0<br />
0.75-2.0 mi Total 59.5 103 38230 502.0<br />
Upper 3rd Total 59.5 103 38230 502.0<br />
Grand Total 59.5 103 38230 502.0<br />
Shasta-Trinity National Forest – South Fork Management Unit – June 13, 2005 - 74
Fisheries Biological Assessment/Evaluation – <strong>Hidden</strong> <strong>Valley</strong> <strong>Watershed</strong> <strong>Restoration</strong> <strong>Project</strong><br />
Appendix C. Best Management Practices<br />
Best Management Practices (BMPs) are measures certified by the State Water Quality Board and<br />
approved by the Environmental Protection Agency (EPA) as the most effective way of protecting water<br />
quality from impacts stemming from non-point sources of pollution.<br />
Forest Service BMPs have been monitored and modified over several decades to make them more<br />
effective. On-site evaluations by State regulatory agencies found the practices were effective in protecting<br />
beneficial uses.<br />
The following list of BMPs will be implemented. A description of the objective of each BMP is included.<br />
BMP 1.19 - Streamcourse and Aquatic Protection<br />
Objectives:<br />
1. Conduct management actions within these areas in a manner that maintains or improves riparian<br />
and aquatic values.<br />
2. Provide unobstructed passage of stormflows.<br />
3. Control sediment and other pollutants entering streamcourses.<br />
4. Restore the natural course of any stream as soon as practicable, where diversion of the stream<br />
has resulted from timber management activities.<br />
Area of disturbance will be confined to the stream crossing and associated road prism. New crossing<br />
structures will be designed to accommodate unobstructed passage of stormflows. Fill and sediment will<br />
be removed from streambed to expose native substrates. Duration of disturbance will be less than two<br />
weeks at each site.<br />
2.2 – Erosion Control Plan<br />
Objective: To limit and mitigate erosion and sedimentation through effective planning prior to initiation of<br />
construction activities and through effective contract administration during construction.<br />
An erosion control plan is part of the contract and is the responsibility of the contractor with the FS<br />
reviewing and approving.<br />
2.3 – Timing of construction Activities<br />
Objective: To minimize erosion by conducting operations during minimal runoff periods.<br />
The aquatic period of operation (APOO) will be from July 11 to October 15. No ground disturbing activities<br />
will occur from October 16 through July 10. No new work will begin after October 14. Work may proceed<br />
after October 15 with fisheries biologist and/or hydrologist approval. This will only occur if dry weather is<br />
forecasted. Typically this situation is approved when a project is not complete and more damage may<br />
occur by leaving it unfinished.<br />
2.4 – Stabilization of Road Slopes and Spoil Disposal Areas<br />
Objective: To minimize erosion from exposed cut slopes, fill slopes, and spoil disposal areas.<br />
Erosion control measures such as seeding and mulching will be implemented on all exposed soils.<br />
Shasta-Trinity National Forest – South Fork Management Unit – June 13, 2005 - 75
Fisheries Biological Assessment/Evaluation – <strong>Hidden</strong> <strong>Valley</strong> <strong>Watershed</strong> <strong>Restoration</strong> <strong>Project</strong><br />
2.6 – Dispersion of Subsurface Drainage from Cut and Fill Slopes<br />
Objective: To minimize the possibilities of cut or fill slope failure and the subsequent production of<br />
sediment.<br />
Stream banks will be reshaped to avoid over steepened slopes after culvert is removed.<br />
2.7 – Control of Road Drainage-roads and drainages will be outsloped<br />
Objective: To minimize the erosive effects of water concentrated drainage features; to disperse runoff<br />
from disturbances within the road clearing limits; to lessen the sediment yield from roaded areas; to<br />
minimize erosion of the road prism by runoff from road surfaces and from uphill areas.<br />
Road drainage will be corrected if needed at each crossing site.<br />
2.9 – Timely Erosion Control Measures on Incomplete Roads and Stream<br />
Crossing <strong>Project</strong>s<br />
Objective: To minimize erosion and sedimentation from disturbed ground on incomplete projects.<br />
Aquatic Period of Operation (APOO) of July 11 – October 15.<br />
Erosion control measures will be implemented on or before October 15 or in the event of substantial<br />
precipitation events during the summer. If there is approval by a fisheries or earth scientist to work<br />
beyond October 15, erosion control measures will be in place at the end of each workday.<br />
2.10 – Construction of Stable Embankments<br />
Objective: To construct embankments with materials and methods, which minimize the possibility of<br />
failure and subsequent water quality degradation.<br />
Layer placement and/or controlled compaction will be implemented.<br />
2.11 – Control of Sidecast Material<br />
Objective: To minimize sediment production originating from sidecast material during road construction<br />
or maintenance.<br />
All material will be placed in existing roadway as outslope materials. Material will not be sidecasted.<br />
2.8 – Servicing and Refueling of Equipment<br />
Objective: To prevent pollutants such as fuels, lubricants, bitumens and other harmful materials from<br />
being discharged in or near river, streams and impoundments, or into man-made channels.<br />
Servicing and refueling of equipment will occur outside of RRs and will not occur where spilled material<br />
can flow downslope into a waterway/drainage feature.<br />
2.13 – Control of Construction in Streamside Management Zones<br />
Objective: To protect water quality by controlling construction and maintenance actions within and<br />
adjacent to any streamside management zone<br />
If a stream is flowing during the work period, it will be dewatered. Where appropriate, erosion control<br />
measures such as silt fencing, hay bales, seeding and mulching will be implemented.<br />
Shasta-Trinity National Forest – South Fork Management Unit – June 13, 2005 - 76
Fisheries Biological Assessment/Evaluation – <strong>Hidden</strong> <strong>Valley</strong> <strong>Watershed</strong> <strong>Restoration</strong> <strong>Project</strong><br />
2.14 – Controlling In-channel Excavation<br />
Objective: To minimize stream channel disturbances and related sediment production.<br />
Activities will be limited to only that area of stream associated with the crossing. Duration of project will be<br />
less than two weeks per site.<br />
2.15 – Diversion of Flows Around Construction Sites<br />
Objective: To ensure that all stream diversions are carefully planned, to minimize downstream<br />
sedimentation, and to restore stream channels to their natural grade, condition, and alignment as soon as<br />
possible.<br />
Streams will be dewatered if necessary. All loose sediment will be removed prior to rewatering/fall rains.<br />
2.17 – Culvert Installation<br />
Objective: To minimize sedimentation and turbidity resulting from excavation for inchannel structures.<br />
Same as 2.13, 2.14, and 2.15.<br />
2.20 – Specify Riprap Composition<br />
Objective: To minimize sediment production associated with the installation and utilization of riprap<br />
material.<br />
If riprap is deemed necessary, it will be appropriately sized. For these sites, it will most likely be no<br />
smaller than 8” and no larger than 2 feet in diameter.<br />
2.8 – Maintenance of Roads<br />
Objective: To maintain roads in a manner which provides for water quality protection by minimizing<br />
rutting, failures, sidecasting, and blockage of drainage facilities all of which can cause erosion and<br />
sedimentation, and deteriorating watershed conditions.<br />
Each construction site will be maintained as needed to minimize any source of erosion or sedimentation.<br />
2.23 – Road Surface Treatment to Prevent Loss of Materials<br />
Objective: To minimize the erosion of road surface materials and consequently reduce the likelihood of<br />
sediment production from those areas.<br />
The approaches for each stream crossing will be compacted and surfaced as needed.<br />
2.24 – Traffic Control during Wet Periods<br />
Objective: To reduce road surface disturbances and rutting of roads, to minimize sediment washing from<br />
disturbed road surfaces.<br />
Wet Weather Operations Guidelines will be followed/implemented.<br />
Wet weather operations implementation and effectiveness monitoring<br />
Hauling activities may occur outside of the APOO, defined as July 11 to October 15, providing that the<br />
following guidelines are adhered to.<br />
Shasta-Trinity National Forest – South Fork Management Unit – June 13, 2005 - 77
Fisheries Biological Assessment/Evaluation – <strong>Hidden</strong> <strong>Valley</strong> <strong>Watershed</strong> <strong>Restoration</strong> <strong>Project</strong><br />
Daily monitoring of access routes consisting of BMP forms or daily diaries will document implementation<br />
and effectiveness of BMPs. <strong>Project</strong> activities will be curtailed and corrective action taken when any of the<br />
following are encountered or expected:<br />
Ponding<br />
Ponding present on road surface that is causing fill subsidence or otherwise threatening<br />
integrity of fill.<br />
Ruts/Rills<br />
More than 10% of road segment length has rills more than 2 inches deep and 20 feet in<br />
length that continue off road.<br />
Ruts formed that can channel water past erosion control structures.<br />
Numerous rills present at stream crossing (>1 rill per lineal 5 feet), apparently active or<br />
enlarging, evidence of some sediment delivery to stream.<br />
Shasta-Trinity National Forest – South Fork Management Unit – June 13, 2005 - 78
Fisheries Biological Assessment/Evaluation – <strong>Hidden</strong> <strong>Valley</strong> <strong>Watershed</strong> <strong>Restoration</strong> <strong>Project</strong><br />
Appendix D: Shasta Trinity National Forest Tributaries Matrix of<br />
Factors and Indicators<br />
(This matrix shows criteria used to determine baseline conditions in 8 th and 5 th field watersheds).<br />
Diagnostic or<br />
Pathway<br />
SPECIES<br />
Population<br />
Characteristics<br />
HABITAT<br />
Water Quality:<br />
Indicators Properly<br />
Functioning<br />
Population Size and<br />
Distribution<br />
Growth and<br />
Survival<br />
Life History<br />
Diversity and<br />
Isolation<br />
Persistence and<br />
Genetic Integrity<br />
Temperature (1)<br />
1 st – 3 rd Order<br />
Streams<br />
[instantaneous]<br />
4 th -5 th Order<br />
Streams<br />
[7 Day Maximum]<br />
Insufficient<br />
Information<br />
Insufficient<br />
Information<br />
Insufficient<br />
Information<br />
Insufficient<br />
Information<br />
At Risk Not Properly<br />
Functioning<br />
Insufficient Information Insufficient<br />
Information<br />
Insufficient Information Insufficient<br />
Information<br />
Insufficient Information Insufficient<br />
Information<br />
Insufficient Information Insufficient<br />
Information<br />
67 F degrees or less > 67 to 70.0 degrees F > 70.0 degrees F<br />
70.0 degrees F or<br />
less<br />
> 70.0 to 73.0 degrees F > 73.0 degrees F<br />
Turbidity (2) Turbidity Low Turbidity Moderate Turbidity High<br />
Chemical/Nutrient<br />
Contamination (3)<br />
Habitat Access: Physical Barriers<br />
(3)<br />
Habitat<br />
Elements:<br />
Low levels of<br />
contamination from<br />
agriculture,<br />
industrial, and other<br />
sources; no excess<br />
nutrients.<br />
Any man-made<br />
barriers present in<br />
watershed allow<br />
upstream and<br />
downstream passage<br />
at all flows.<br />
Substrate (4) Less than 15% fines<br />
(
Diagnostic or<br />
Pathway<br />
Fisheries Biological Assessment/Evaluation – <strong>Hidden</strong> <strong>Valley</strong> <strong>Watershed</strong> <strong>Restoration</strong> <strong>Project</strong><br />
Indicators Properly<br />
At Risk Not Properly<br />
Functioning<br />
Functioning<br />
Large Woody More than 40 pieces 40 pieces or less of large Less than 20 pieces<br />
Debris (5)<br />
of large wood (>16 wood (>16 inches in of large wood (>16<br />
inches in diameter diameter and > 50 feet in inches in diameter<br />
and > 50 feet in length) per mile OR and > 50 feet in<br />
length) per mile current riparian vegetation length) per mile<br />
AND current condition below site AND current<br />
riparian vegetation potential for recruitment riparian vegetation<br />
condition near site of large woody debris. condition well below<br />
potential for<br />
site potential for<br />
recruitment of large<br />
recruitment of large<br />
woody debris.<br />
woody debris.<br />
Pool Frequency (4) At least 1 pool every At least 1 pool every 3 to Less than 1 pool<br />
3 to 7 bankfull 7 bankfull channel widths. every 7 bankfull<br />
channel widths. These pools should channel widths<br />
These pools should occupy at least 50% of the and/or less than half<br />
occupy at least 50% low-flow channel width. of the pools have a<br />
of the low-flow At least half of the pools maximum depth of<br />
channel width and all have a maximum depth of at least 36 inches.<br />
have a maximum<br />
depth of at least 36<br />
inches.<br />
at least 36 inches.<br />
Off-channel Habitat Backwaters with Some backwaters and Few or no<br />
(3)<br />
cover, and low high energy side channels. backwaters or off-<br />
energy off-channel<br />
areas (ponds,<br />
oxbows, etc.).<br />
channel ponds.<br />
Refugia (important Habitat refugia exist Habitat refugia exist but Adequate habitat<br />
remnant habitat for and are adequately are not adequately refugia do not exist.<br />
sensitive aquatic buffered (eg. by buffered (eg. by intact<br />
species) (3) intact riparian riparian reserves);<br />
reserves); existing existing refugia are<br />
refugia are sufficient insufficient in size,<br />
in size, number and number and connectivity<br />
connectivity to to maintain viable<br />
maintain viable populations or sub-<br />
populations or subpopulations.populations.<br />
Shasta-Trinity National Forest – South Fork Management Unit – June 13, 2005 - 80
Fisheries Biological Assessment/Evaluation – <strong>Hidden</strong> <strong>Valley</strong> <strong>Watershed</strong> <strong>Restoration</strong> <strong>Project</strong><br />
Shasta Trinity National Forest Tributaries Matrix of Factors and Indicators:<br />
Factors Indicators Properly Functioning At Risk Not Properly<br />
Functioning<br />
Channel Width/Depth W/D ratio < 12 on all More than 10% of the More than 25% of the<br />
Condition Ratio (6) reaches that could surveyed reaches are reaches are outside of<br />
and<br />
otherwise best be outside of the ranges given the ranges given for<br />
Dynamics:<br />
described as 'A', 'G', and for Width/Depth ratios for Width/Depth ratios for<br />
'E' channel types. W/D the channel types specified the channel types<br />
ratio > 12 on all reaches in "Properly Functioning" specified in "Properly<br />
that could otherwise block. Braiding has Functioning" block.<br />
best be described as 'B', occurred in some alluvial Braiding has occurred<br />
'F', and 'C' channel reaches because of in many alluvial reaches<br />
types. No braided excessive aggradation due as a result of excessive<br />
streams formed due to to high sediment loads. aggradation due to high<br />
excessive sediment<br />
loads<br />
sediment loads<br />
Streambank > 90% stable; ie., on 80 - 90% stable < 80% stable<br />
Condition (3) average, < 10% of<br />
banks are actively<br />
eroding.<br />
Floodplain Off-channel areas are Reduced linkage of Severe reduction in<br />
Connectivity (3) frequently<br />
wetland, floodplains, and hydrologic connectivity<br />
hydrologically linked to riparian areas to main between off-channel,<br />
main channel; overbank channel; overbank flows wetland, floodplain, and<br />
flows occur and are reduced relative to riparian areas; wetland<br />
maintain wetland historic frequency, as area drastically reduced<br />
functions, riparian evidenced by moderate and riparian<br />
vegetation, and degradation of wetland vegetation/succession<br />
succession.<br />
function, riparian<br />
vegetation/succession.<br />
altered significantly.<br />
Flow / Change in Use ERA model to Use ERA model to Use ERA model to<br />
Hydrology: Peak/Base estimate risk of change estimate risk of change in estimate risk of change<br />
Flows (7) in flow. <strong>Watershed</strong> flow. Some evidence of in flow. Pronounced<br />
hydrograph indicates altered peak flow, changes in peak flow,<br />
peak flow, base flow, baseflow and/or flow baseflow and/or flow<br />
and flow timing timing relative to an timing relative to an<br />
characteristics<br />
undisturbed watershed of undisturbed watershed<br />
comparable to an similar size, geology, and of similar size, geology,<br />
undisturbed watershed geography. Condition and geography.<br />
of similar size, geology, Class II <strong>Watershed</strong> Condition Class III<br />
and geography.<br />
Condition Class I<br />
watershed.<br />
watershed.<br />
Increase in Zero or minimum Moderate (5%) increases Significant (20-25%)<br />
Drainage increases in drainage in drainage network increases in drainage<br />
Network (3) network density due to density due to roads. network density due to<br />
roads.<br />
roads.<br />
<strong>Watershed</strong><br />
Conditions:<br />
Road Density<br />
and Location (3)<br />
Less than 2 miles per<br />
square mile, no valley<br />
bottom roads.<br />
Two to three miles per<br />
square mile, some valley<br />
bottom roads.<br />
Shasta-Trinity National Forest – South Fork Management Unit – June 13, 2005 - 81<br />
Over 3 miles per square<br />
mile, many valley<br />
bottom roads.
Fisheries Biological Assessment/Evaluation – <strong>Hidden</strong> <strong>Valley</strong> <strong>Watershed</strong> <strong>Restoration</strong> <strong>Project</strong><br />
Factors Indicators Properly Functioning At Risk Not Properly<br />
Functioning<br />
Disturbance CWE model indicator CWE model indicator CWE model indicator<br />
History (8) values are not above values are above threshold values are above<br />
.80. Clarify and verify of .80 and 1.0. Clarify and threshold of 1.0. Clarify<br />
conditions and risk verify conditions and risk and verify conditions<br />
through field reviews through field reviews and risk through field<br />
and/or other available and/or other available info, reviews and/or other<br />
info, as available. as available.<br />
available info, as<br />
available.<br />
Riparian The riparian reserve Moderate loss of<br />
Riparian reserve system<br />
Reserves system provides connectivity or function is fragmented, poorly<br />
(hydrologic) (3) adequate shade, large (shade, LWD recruitment, connected, or provides<br />
woody debris<br />
etc) of riparian reserve inadequate protection of<br />
recruitment, and habitat system, or incomplete habitat and refugia for<br />
protection and<br />
protection of habitat and sensitive aquatic species<br />
connectivity in all refugia for sensitive (approx. less than 70%<br />
subwatersheds, and aquatic species (approx. intact), and/or for<br />
buffers or includes 70-80% intact), and/or for grazing impacts;<br />
known refugia for grazing impacts; percent percent similarity of<br />
sensitive aquatic species similarity of riparian riparian vegetation to<br />
(> 80% intact), and/or vegetation to the potential the potential natural<br />
for grazing impacts; natural<br />
community/composition<br />
percent similarity of community/composition is 25% or less.<br />
riparian vegetation to<br />
the potential natural<br />
community/composition<br />
> 50%.<br />
25-50% or better.<br />
Footnotes to Trinity River tributaries matrix of factors and indicators<br />
(1) Stream Order according to Strahler (1957). Proper Functioning criterion for 4 th /5 th Order streams<br />
derived from temperature monitoring near the mouth of streams considered to be pristine or nearly<br />
pristine (North Fork Trinity and New Rivers - 5 th order, East Fork North Fork Trinity and New Rivers near<br />
East Fork- 4 th order (Data on file at the Weaverville Ranger District). 7 day maximum temperatures as<br />
high as 71.8 degrees F have been recorded on these streams, however, the average is just less than 70<br />
degrees F. At Risk criterion for 4 th /5 th order streams derived from monitoring in streams that support<br />
populations of anadromous fish, although temperatures in this range (70 to 73.0 degrees F) are<br />
considered sub-optimal. Not Properly Functioning is sustained temperatures above 73.0 degrees F that<br />
cause cessation of growth and approach lethal temperatures for salmon and steelhead.<br />
Properly Functioning criterion for 1 st – 3 rd order streams is derived from Proper Functioning criterion for 3 rd<br />
order streams derived from temperature monitoring near the mouth of streams considered to be pristine<br />
or nearly pristine (Devils Canyon Creek, East Fork New River, Slide Creek, Virgin Creek). At Risk and Not<br />
Properly Functioning are assigned on a temperature continuum with values given for 4 th /5 th order streams,<br />
with the maximum instantaneous temperature of At Risk of 1 st – 3 rd order streams coinciding with the<br />
minimum 7 day maximum of 4 th /5 th order At Risk streams. Similarly for the Not Properly Functioning<br />
category.<br />
(2) Properly Functioning: Water clarity returns quickly (within several days) following peak flows.<br />
At Risk: Water clarity slow to return following peak flows.<br />
Not Properly Functioning: Water clarity poor for long periods of time following peak flows. Some<br />
suspended sediments occur even at low flows or baseflow.<br />
Shasta-Trinity National Forest – South Fork Management Unit – June 13, 2005 - 82
Fisheries Biological Assessment/Evaluation – <strong>Hidden</strong> <strong>Valley</strong> <strong>Watershed</strong> <strong>Restoration</strong> <strong>Project</strong><br />
(3) Criteria unchanged from the National Marine Fisheries Service (NMFS) matrix (NMFS 1996).<br />
(4) Properly Functioning criterion from Klamath Land and Resource Management Plan EIS p 3-68<br />
(USDA 1995a). At Risk and Not Properly Functioning criteria defined through professional judgment.<br />
(5) Properly Functioning LWD criteria derived from stream surveys of 25 stream reaches on the Trinity<br />
River Management Unit. The reaches from which the properly functioning criteria were derived have not<br />
been “cleaned” or had extensive mining activity that removed LWD and support anadromous fish (or<br />
historically did). The Properly Functioning criterion is clearly defined, whereas the At Risk and Not<br />
Properly functioning criteria are ambiguously defined based on professional judgment of the Shasta-<br />
Trinity Level 1 team.<br />
(6) Width to depth (W/D) ratio for various channel types is based on delineative criteria of Rosgen (1994).<br />
Properly Functioning means that W/D ratio falls within expected channel type as determined by the other<br />
four delineative factors (entrenchment, sinuosity, slope, and substrate). Aggradation on alluvial flats<br />
causing braiding is well known phenomenon that often accompanies changes in W/D ratio as watershed<br />
condition deteriorates.<br />
(7) Criteria changed from NMFS matrix. Shasta Trinity National Forest uses Equivalent Roaded<br />
Area/Threshold of Concern (ERA/TOC) Model (Haskins 1986) to determine the existing risk ratio as well<br />
as the effect risk ratio. Therefore, the ECA values are not used in Region 5 analysis; instead the<br />
ERA/TOC model is used. ERA/TOC provides a simplified accounting system for tracking disturbances<br />
that affect watershed processes, in particular, estimates in changes in peak runoff flows influenced by<br />
disturbance activities. This model is not intended to be a process-based sediment model, however it does<br />
provide an indicator of watershed conditions. This model compares the current level of disturbance within<br />
a given watershed (expressed as %ERA) with the theoretical maximum disturbance level acceptable<br />
(expressed as %TOC). ERA/TOC (or “risk ratio”) estimates the level of hydrological disturbance or<br />
relative risk of increased peak flows and consequent potential for channel alteration and general adverse<br />
watershed impacts. TOC is calculated based on channel sensitivity, beneficial uses, soil erodibility,<br />
hydrologic response, and slope stability. The TOC does not represent the exact point at which cumulative<br />
watershed effects will occur. Rather, it serves as a “yellow flag” indicator of increasing susceptibility for<br />
significant adverse cumulative effects occurring within a watershed.<br />
Susceptibility of CWE generally increases from low to high as the level of land disturbing activities<br />
increase towards or past the TOC (FS Handbook, 2509.22-23.63a).<br />
CWE Analysis Threshold of Concern and <strong>Watershed</strong> Condition Class: The LRMP established TOC<br />
for 5 th field watersheds and defines <strong>Watershed</strong> Condition Class (WCC) (USDA Forest Service, 1995b).<br />
The WCC are defined as follows:<br />
<strong>Watershed</strong> Condition Class I: ERA less than 40 percent TOC;<br />
<strong>Watershed</strong> Condition Class II: ERA between 40 and 80 percent TOC; and<br />
<strong>Watershed</strong> Condition Class III: ERA greater than 80 percent TOC.<br />
The following summarizes the FSM 2521.1 - <strong>Watershed</strong> Condition Classes. The ERA evaluates<br />
watershed condition and assigns one of the following three classes:<br />
1. Class I Condition. <strong>Watershed</strong>s exhibit high geomorphic, hydrologic, and biotic integrity relative to<br />
their natural potential condition. The drainage network is generally stable. Physical, chemical, and<br />
biologic conditions suggest that soil, aquatic, and riparian systems are predominantly functional in<br />
terms of supporting beneficial uses.<br />
2. Class II Condition. <strong>Watershed</strong>s exhibit moderate geomorphic, hydrologic, and biotic integrity<br />
relative to their natural potential condition. Portions of the watershed may exhibit an unstable<br />
Shasta-Trinity National Forest – South Fork Management Unit – June 13, 2005 - 83
Fisheries Biological Assessment/Evaluation – <strong>Hidden</strong> <strong>Valley</strong> <strong>Watershed</strong> <strong>Restoration</strong> <strong>Project</strong><br />
drainage network. Physical, chemical, and biologic conditions suggest that soil, aquatic, and<br />
riparian systems are at risk in being able to support beneficial uses.<br />
3. Class III Condition. <strong>Watershed</strong>s exhibit low geomorphic, hydrologic, and biotic integrity relative to<br />
their natural potential condition. A majority of the drainage network may be unstable. Physical,<br />
chemical, and biologic conditions suggest that soil, riparian, and aquatic systems do not support<br />
beneficial uses.<br />
(8) The components of the STNF CWE model (Haskins, 1986) are used to determine conditions and risk<br />
to this Indicator. The STNF CWE model components replace use of ECA that was originally identified in<br />
the Checklist. ECA is not used in Region 5.<br />
References<br />
Haskins, D.M. 1986. A Management Model for Evaluating Cumulative <strong>Watershed</strong> Effects; Proceedings<br />
from the California <strong>Watershed</strong> Management Conference, West Sacramento, CA, November 19-20,<br />
1986, pp125-130.<br />
National Marine Fisheries Service. 1996. Conference Opinion. Implementation of Land and Resource<br />
Management Plans 31p.<br />
Rosgen, D.L. 1994.A Classification of Natural Rivers, Catena, vol 22:169-199 Eisevier Science, B.V.<br />
Amsterdam.<br />
Strahler, A.N. 1957. Quantitative analysis of watershed geomorphology. American Geophysical Union<br />
Transactions. 38: 913-920.<br />
USDA, Forest Service. 1995a. Klamath National Forest Land and Resource Management Plan<br />
Environmental Impact Statement. Klamath National Forest, Yreka CA.<br />
USDA, Forest Service. 1995b. Shasta-Trinity National Forests Land and Resource Management Plan.<br />
Shasta-Trinity National Forests, Redding CA.<br />
Shasta-Trinity National Forest – South Fork Management Unit – June 13, 2005 - 84
Fisheries Biological Assessment/Evaluation – <strong>Hidden</strong> <strong>Valley</strong> <strong>Watershed</strong> <strong>Restoration</strong> <strong>Project</strong><br />
Checklist for Documenting Environmental Baseline and Effects of Proposed<br />
Action(s) on Relevant Indicators<br />
PROJECT AND SITE # Plummer Creek<br />
Pathways: ENVIRONMENTAL BASELINE EFFECTS OF THE ACTION(S)<br />
INDICATORS<br />
Properly<br />
Funct<br />
Water Quality<br />
Temperature PLUM<br />
Sediment PLUM<br />
Chemical Contam<br />
Habitat Access<br />
PLUM<br />
Physical Barrier<br />
Habitat Elements<br />
PLUM<br />
Substrate PLUM<br />
LWD PLUM<br />
Pool Frequency PLUM<br />
Pool Quality PLUM<br />
Off-channel Habitat PLUM<br />
Refugia<br />
Channel Cond & Dyn<br />
PLUM<br />
W/D Ratio PLUM<br />
Streambank Cond. PLUM<br />
Floodplain Cond.<br />
Flow /Hydrology<br />
PLUM<br />
Peak/Base Flow PLUM<br />
Drainage Net Incrs PLUM<br />
<strong>Watershed</strong> Cond. Road<br />
Dens/Lo PLUM<br />
Disturbance History PLUM<br />
Riparian Reserves PLUM<br />
At Risk Not Properly<br />
Funct<br />
Restore Maintain Degradg<br />
Shasta-Trinity National Forest – South Fork Management Unit – June 13, 2005 - 85<br />
X<br />
X<br />
X<br />
X<br />
X<br />
X<br />
X<br />
X<br />
X<br />
X<br />
X<br />
X<br />
X<br />
X<br />
X<br />
X<br />
X<br />
X
Fisheries Biological Assessment/Evaluation – <strong>Hidden</strong> <strong>Valley</strong> <strong>Watershed</strong> <strong>Restoration</strong> <strong>Project</strong><br />
PROJECT AND SITE # <strong>Hidden</strong> <strong>Valley</strong> <strong>Watershed</strong><br />
Pathways:<br />
INDICATORS<br />
ENVIRONMENTAL BASELINE<br />
Properly<br />
Funct<br />
At Risk Not<br />
Properly<br />
Funct<br />
EFFECTS OF THE ACTION(S)<br />
Restore Maintain Degrade<br />
Water Quality<br />
Temperature J. Lang X<br />
Sediment J. Lang<br />
Longterm <br />
Shortterm<br />
Chemical Contam<br />
Habitat Access<br />
J. Lang X<br />
Physical Barrier J. Lang X<br />
Habitat Elements Non-fish bearing/No<br />
Substrate<br />
Information<br />
Non-fish bearing/No<br />
X<br />
LWD<br />
Information<br />
Non-fish bearing/No<br />
X<br />
Pool Frequency<br />
Information<br />
Non-fish bearing/No<br />
X<br />
Pool Quality<br />
Information<br />
Non-fish bearing/No<br />
X<br />
Off-channel Habitat<br />
Information<br />
Non-fish bearing/No<br />
X<br />
Refugia<br />
Information X<br />
Channel Cond & Dyn<br />
W/D Ratio<br />
LongtermShorttermLongShort-<br />
Streambank Cond.<br />
termtermLongShort- Floodplain Cond.<br />
Flow /Hydrology<br />
termterm Peak/Base Flow X<br />
LongShort- Drainage Net Incrs<br />
termterm <strong>Watershed</strong> Cond. Road<br />
LongShort- Dens/Lo J. Lang<br />
termtermLongShort- Disturbance History J. Lang<br />
termterm Riparian Reserves J. Lang X<br />
Shasta-Trinity National Forest – South Fork Management Unit – June 13, 2005 - 86
Fisheries Biological Assessment/Evaluation – <strong>Hidden</strong> <strong>Valley</strong> <strong>Watershed</strong> <strong>Restoration</strong> <strong>Project</strong><br />
PROJECT AND SITE # South Fork Trinity River <strong>Watershed</strong><br />
Pathways:<br />
INDICATORS<br />
ENVIRONMENTAL BASELINE<br />
Properly<br />
Funct At Risk<br />
EFFECTS OF THE ACTION(S)<br />
Not<br />
Properly<br />
Funct Restore Maintain Degrade<br />
Water Quality<br />
Temperature So. Fork X<br />
Sediment So. Fork<br />
Longterm <br />
Shortterm<br />
Chemical Contam<br />
Habitat Access<br />
So. Fork X<br />
Physical Barrier So. Fork X<br />
Habitat Elements<br />
Substrate So. Fork<br />
Longterm <br />
Shortterm<br />
LWD So. Fork X<br />
Pool Frequency So. Fork X<br />
Pool Quality So. Fork<br />
Longterm <br />
Shortterm<br />
Off-channel Habitat So. Fork X<br />
Refugia So. Fork X<br />
Channel Cond & Dyn<br />
W/D Ratio So. Fork X<br />
Streambank Cond. So. Fork X<br />
Floodplain Cond. So. Fork X<br />
Flow /Hydrology<br />
Peak/Base Flow So. Fork X<br />
Drainage Net Incrs So. Fork X<br />
<strong>Watershed</strong> Cond. Road<br />
Dens/Lo So. Fork X<br />
Disturbance History So. Fork X<br />
Riparian Reserves So. Fork X<br />
Shasta-Trinity National Forest – South Fork Management Unit – June 13, 2005 - 87
Fisheries Biological Assessment/Evaluation – <strong>Hidden</strong> <strong>Valley</strong> <strong>Watershed</strong> <strong>Restoration</strong> <strong>Project</strong><br />
Shasta-Trinity National Forest – South Fork Management Unit – June 13, 2005 - 88