MAJoR AppLIANCE RETAILERs MAJoR AppLIANCE RETAILERs
MAJoR AppLIANCE RETAILERs MAJoR AppLIANCE RETAILERs
MAJoR AppLIANCE RETAILERs MAJoR AppLIANCE RETAILERs

Create successful ePaper yourself
Turn your PDF publications into a flip-book with our unique Google optimized e-Paper software.
June 20, 2011<br />
Q4 Retail Special Report<br />
Top 100<br />
<strong>MAJoR</strong><br />
<strong>AppLIANCE</strong><br />
<strong>RETAILERs</strong><br />
SPONSORED BY<br />
This Week<br />
In Consumer<br />
Electronics
TOP 100 majOr aPPliance reTailers<br />
# # # # #<br />
1 $7.51B 2 $5.37B 3 $3.54B 4 $1.76B 5 $722M<br />
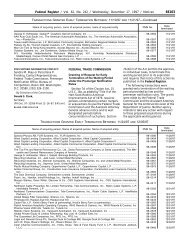
Top 100 Majap Retailers Manage 5.5% Increase In 2010 Sales<br />
By Alan Wolf <br />
NEW YORK — It was no easy feat. <br />
But in a market than many dealers described as the<br />
worst ever in memory, the 100 largest major appliance<br />
merchants managed to post a cumulative 5.5 percent<br />
increase in white-goods sales last year, to $24.3 billion,<br />
readily besting the prior year’s 3.7 percent decline.<br />
The tally comes courtesy of TWICE’s annual Top 100<br />
Appliance Retailers Report, which was prepared with<br />
market research partner The Stevenson Company and<br />
covers more than 90 percent of U.S. majap sell-through.<br />
Topping the charts again with $7.5 billion in whitegoods<br />
sales is perennial favorite Sears, although its<br />
decade-long market-share slide continued in 2010. Second-place<br />
Lowe’s narrowed the gap to just more than<br />
$2 billion by more than doubling Sears’ sales pace, and<br />
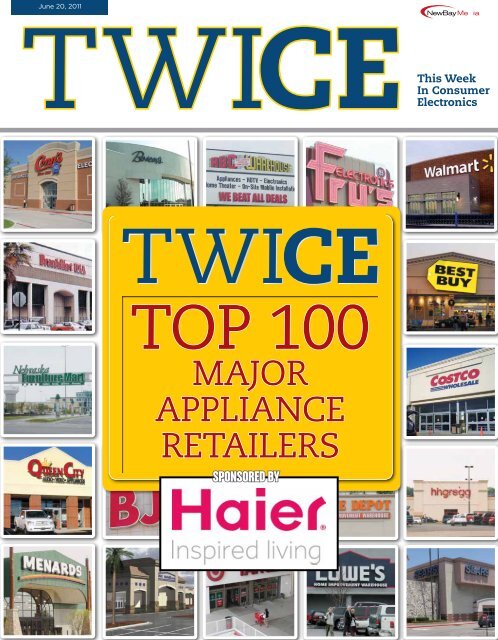
Majap sales by retail channel<br />
1.4%<br />
Warehouse<br />
Clubs<br />
2010 Sales: $24.29 billion<br />
1.9% 8.3%<br />
10.2% Electronics/<br />
Electronics/<br />
Electronics/ Appliance Stores/<br />
Appliance Stores/<br />
Regional 2.6%<br />
Appliance Stores/ One Market ApplianceOnly<br />
MultiRegion<br />
Stores<br />
37.4%<br />
Home Improvement<br />
Centers<br />
35.0%<br />
Mass Merchants<br />
0.4%<br />
0.3% 0.1%<br />
Consumer Direct<br />
Miscellaneous<br />
Department Store<br />
2009 Sales: $23.02 billion<br />
10.0%<br />
Electronics/<br />
Appliance Stores/<br />
2.0%<br />
Electronics/<br />
Appliance Stores/<br />
One Market<br />
8.7%<br />
Electronics/<br />
Appliance Stores/<br />
Regional<br />
2.7%<br />
ApplianceOnly<br />
MultiRegion Stores<br />
1.5%<br />
Warehouse<br />
Clubs<br />
36.6%<br />
Home Improvement<br />
Centers<br />
35.2%<br />
Mass Merchants<br />
0.4%<br />
0.4% 0.1%<br />
Consumer Direct<br />
Miscellaneous<br />
Department Store<br />
2.4%<br />
Home<br />
Furnishings<br />
Stores<br />
2.5%<br />
Home<br />
Furnishings<br />
Stores<br />
Source: TWICE market research © TWICE 2011<br />
together with No. 3 The Home Depot and No. 15 Menards<br />
widened the home-improvement channel’s industry-topping<br />
lead to a 37.4 percent share of Top 100 sales.<br />
Following the Big Three are:<br />
• Best Buy, which edged up 2.7 percent to $1.8 billion,<br />
but is looking to pick up the pace by expanding its<br />
test of Pacific Sales in-store appliance departments from<br />
eight to 30 boxes next year, and by employing the departments’<br />
labor and operating model in 350 locations;<br />
• Walmart, which sold $722 million worth of ACs and<br />
microwave ovens last year;<br />
• hhgregg, which added 46 stores and 26 percent<br />
more majap dollar volume; and<br />
• P.C. Richard & Son, the family-held New York metro<br />
chain that has streamed into Connecticut with seven locations<br />
to fill the vacuum left by Bernie’s, and opened a<br />
second major distribution center to support its New Jersey<br />
and Philadelphia stores.<br />
Taken together, the Top 10 majap merchants, which<br />
also includes BrandsMart USA, Costco and Target,<br />
accounted for 85 percent of Top 100 revenue last year.<br />
Joining the Top 100 rankings in 28th place is Amazon.com,<br />
which grew its nascent appliance business<br />
20 percent to $62 million in such brands as Electrolux,<br />
Frigidaire, GE, LG, Miele and Whirlpool. While much of<br />
that business is done by third-party sellers — including<br />
Top 100 dealers Abt and Vann’s — Amazon is also direct-selling<br />
washers, refrigerators, ranges and dishwashers<br />
from Haier, Fagor and, most troubling for other dealers,<br />
Whirlpool’s Amana brand.<br />
Aside from adding new stores and SKUs, dealers also<br />
boosted sales through aggressive holiday promotions<br />
that reached a fever pitch on Black Friday, and by leveraging<br />
last year’s $300 million appliance rebate program,<br />
which was funded by the federal government and administered<br />
by states.<br />
For others, like John D. Marcella Appliances (No.<br />
84) in Schenectady, N.Y., the independent dealer overcame<br />
“the most difficult year in my 60 years in the appliance<br />
and TV business” by consolidating its two locations<br />
down to a single, newly constructed state-of-the-art store<br />
and limiting the number of SKUs it carries, stocks and<br />
displays. The less-is-more strategy, combined with tighter<br />
expense controls, increased training, additional store<br />
hours and heightened promotional activity, led to an 18<br />
percent increase in sales last year, Marcella said.<br />
Methodology<br />
NEW YORK — The TWICE Top 100 Major Appliance<br />
Retailers Report ranks the leading domestic whitegoods<br />
dealers by sales of major appliances for the<br />
2010 calendar year.<br />
Sales figures are based on information that was supplied<br />
by retailers responding to a survey by TWICE and<br />
its research partner The Stevenson Company. Absent<br />
their input, estimates were developed from Stevenson’s<br />
internal market tracking surveys (TraQline) and industry<br />
sizing based on wholesale shipment figures from<br />
the Association of Home Appliance Manufacturers<br />
(AHAM), average retail price points by products, housing<br />
market data and other sources.<br />
All estimates were further refined and submissions<br />
vetted using public filings with the Securities and Exchange<br />
Commission (SEC), TWICE industry analyses,<br />
financial analysts’ reports, published data and other<br />
sources. Sales figures for 2010 were then compared<br />
to 2009 sales tallies and adjusted if necessary to more<br />
closely track industrywide revenue growth.<br />
Major appliance dealers must meet the following criteria<br />
to be considered for inclusion:<br />
• sell new products directly to consumers;<br />
• have brick-and-mortar retail stores or a significant<br />
online presence;<br />
• sell major appliances as one of their principal lines<br />
of business;<br />
• do not sell solely to the builder channel or to multifamily<br />
dwellings; and<br />
• sell at least one of the following major appliance<br />
categories as defined by AHAM: washers, dryers, refrigerators,<br />
freezers, dishwashers, ranges, cooktops,<br />
wall ovens, microwave ovens, room air conditioners<br />
and dehumidifiers.<br />
Sales are considered to be the revenue received for<br />
merchandise only, and which is sold solely through the<br />
retail channel.<br />
Stevenson, based in Louisville, Ky., has served the majap<br />
industry for the past 16 years, more recently adding<br />
CE to its service portfolio. Its TraQline syndicated quarterly<br />
survey of 150,000 shoppers measures retail purchases<br />
of consumer durables, and provides estimates<br />
of unit and dollar market share and other key data points.<br />
# # #<br />
6 $654M 7 $549M 8 $214M 9 $200M 10 $188M<br />
22 June 20, 2011 www.twice.com
TOP 100 majOr aPPliance reTailers<br />
TOTAL MA SALES % NUMBER<br />
RANK RANK STORE IN $ MILLIONS (b) CHANGE (c) OF STORES<br />
2010 2009 TyPE (a) RETAILER HEADQUARTERS 2010 2009 2010/2009 2010 2009<br />
1 1 MM Sears Hoffman Estates, Ill. $7,508 $7,192 4.4% 1,771 1,746<br />
2 2 HIC Lowe’s Mooresville, N.C. $5,365 $4,904 9.4% 1,710 1,694<br />
3 3 HIC The Home Depot Atlanta $3,538 $3,356 5.4% 1,976 1,967<br />
4 4 EA/N Best Buy Richfield, Minn. $1,758 $1,712 2.7% 1,099 1,060<br />
5 5 MM Walmart Bentonville, Ark. $722 $666 8.3% 3,616 3,503<br />
6 6 EA/N hhgregg Indianapolis $654 $519 26.0% 173 127<br />
7 7 EA/R P.C. Richard & Son Farmingdale, N.Y. $549 $518 6.0% 65 57<br />
8 8 EA/R BrandsMart USA Hollywood, Fla. $214 $213 0.5% 9 9<br />
9 10 WC Costco Wholesale Issaquah, Wash. $200 $206 -3.0% 421 409<br />
10 13 MM Target Minneapolis $188 $174 8.0% 1,752 1,740<br />
11 9 EA/R Conn’s Beaumont, Texas $185 $208 -11.1% 76 76<br />
12 11 EA/R Pacific Sales Kitchen & Bath Centers Torrance, Calif. $180 $179 0.5% 35 37<br />
13 12 EA/R ABC Warehouse Pontiac, Mich. $167 $178 -6.2% 45 44<br />
14 14 EA/M Abt Electronics and Appliances Glenview, Ill. $164 $162 1.1% 1 1<br />
15 16 HIC Menards Eau Claire, Wash. $139 $130 6.9% 286 252<br />
16 15 HF Nebraska Furniture Mart Omaha, Neb. $137 $132 4.0% 3 3<br />
17 17 HF American TV & Appliances Madison, Wis. $129 $123 5.0% 15 15<br />
18 18 WC Sam’s Club Bentonville, Ark. $116 $115 1.0% 609 605<br />
19 19 HF R.C. Willey Home Furnishings Salt Lake City $109 $108 0.9% 13 13<br />
20 22 HF The Great Indoors Hoffman Estates, Ill. $81 $73 10.5% 12 12<br />
21 20 MM Kmart Hoffman Estates, Ill. $80 $82 -2.7% 1,279 1,304<br />
22 21 AO/L Appliance Direct Melbourne, Fla. $75 $78 -4.0% 8 16<br />
23 25 EA/R Grants Appliance Joliet, Ill. $73 $68 7.5% 11 10<br />
24 26 EA/R Howard’s Appliance La Habra, Calif. $69 $67 3.5% 10 10<br />
25 23 AO/L ApplianceSmart Minneapolis $69 $71 -2.8% 19 19<br />
26 28 EA/R Orvilles Home Appliances Lancaster, N.Y. $64 $58 10.0% 4 4<br />
27 24 EA/N Fry’s Electronics San Jose, Calif. $63 $68 -7.5% 34 34<br />
28 NR CD/I Amazon.com Seattle $62 $52 19.6% NA NA<br />
29 27 MS/PX Army-Air Force Exchange Dallas $56 $63 -11.1% 160 160<br />
30 33 AO/L Standards of Excellence North Rohnert Park, Calif. $55 $49 11.0% 7 11<br />
31 32 AO/L Bray & Scarff Laurel, Md. $54 $50 7.6% 12 12<br />
32 29 EA/R Karl’s Sales & Service Fairfield, N.J. $53 $53 0.0% 6 7<br />
33 31 EA/R Spencer’s TV & Appliance Tempe, Ariz. $52 $52 0.5% 5 5<br />
34 30 EA/R Famous Tate Tampa, Fla. $48 $52 -7.7% 8 8<br />
NR = Not ranked last year. AO/L = Appliance-only store EA/R = Electronics/Appliance stores/Regional<br />
NA = Not applicable. CD/I = Consumer direct/Internet shopping HF = Home-furnishings stores<br />
(a) Most store type codes were developed jointly by TWICE and the Consumer Electronics Association. DS = Department stores HIC = Home-improvement centers<br />
(b) All sales information, except for that supplied by publicly held companies that break out line-of-business sales D/G = Drug/Grocery stores MM = Mass merchants<br />
for major appliances, is based on TWICE estimates. EA/M = Electronics/Appliance stores/One-market MS/PX = Miscellaneous/Military exchanges<br />
(c) Total sales were rounded to millions, but percent change reflects unrounded totals. EA/N = Electronics/Appliance stores/Multiregional WC = Warehouse clubs<br />
Source: TWICE market research<br />
© TWICE 2011<br />
24 June 20, 2011 www.twice.com
TOP 100 majOr aPPliance reTailers<br />
TOTAL MA SALES % NUMBER<br />
RANK RANK STORE IN $ MILLIONS (b) CHANGE (c) OF STORES<br />
2010 2009 TyPE (a) RETAILER HEADQUARTERS 2010 2009 2010/2009 2010 2009<br />
35 34 AO/L Warners’ Stellian Appliance St. Paul, Minn. $46 $43 6.4% 7 7<br />
36 35 AO/L Appliance Factory Outlet Denver $42 $38 10.5% 10 10<br />
37 38 EA/R Jetson TV & Appliance Centers Ft. Pierce, Fla. $40 $39 2.6% 5 5<br />
38 41 HF Badcock Home Furn. Ctrs & More Mulberry, Fla. $38 $37 2.0% 300 300<br />
39 42 AO/L Airport Home Appliance Hayward, Calif. $38 $37 2.0% 3 2<br />
40 40 EA/R Queen City Audio Video & Appliances Charlotte, N.C. $38 $38 0.0% 11 11<br />
41 37 EA/R Western Appliance TV & Stereo San Jose, Calif. $38 $41 -9.0% 4 6<br />
42 39 HIC Ferguson Newport News, Va. $38 $38 -2.3% 214 220<br />
43 43 CD/I AJ Madison Brooklyn, N.Y. $36 $32 12.0% 1 1<br />
44 44 EA/M County TV & Appliance Stamford, Conn. $34 $31 8.0% 1 1<br />
45 45 EA/R Karl’s TV & Appliance Gregory, S.D. $31 $28 10.0% 21 19<br />
46 48 EA/M Leiberts Royal Green Appliance Ctr. White Plains, N.Y. $27 $26 4.5% 3 1<br />
47 46 EA/R Cowboy Maloney Jackson, Miss. $27 $26 3.8% 12 12<br />
48 47 MS/PX Navy Exchange Virginia Beach, Va. $26 $26 0.0% 104 104<br />
49 49 EA/R Grand Appliance & TV Zion, Ill. $26 $25 2.3% 12 10<br />
50 54 EA/R Plass Appliance Addison, Ill. $25 $23 10.2% 8 8<br />
51 52 AO/L Atherton Appliance and Kitchens Redwood City, Calif. $25 $24 3.5% 1 1<br />
52 53 AO/L Apsco Appliance Centers Clearwater, Fla. $24 $23 5.0% 3 3<br />
53 50 DS Boscov’s Reading, Pa. $24 $24 -2.5% 39 39<br />
54 61 EA/M La Curacao Los Angeles $22 $20 12.0% 11 11<br />
55 59 AO/L yale Appliance & Lighting Boston $22 $21 6.5% 1 1<br />
56 57 EA/M Aitoro Appliance and Electronics Norwalk, Conn. $21 $21 4.0% 1 1<br />
57 55 EA/M Filco Discount Centers Folsom, Calif. $21 $21 -2.0% 1 1<br />
58 58 AO/L Albert Lee Appliance Co. Seattle $21 $21 -0.1% 5 4<br />
59 64 EA/R Gerhard’s Glenside, Pa. $20 $18 10.7% 5 5<br />
60 62 WC BJ’s Wholesale Club Natick, Mass. $20 $19 6.3% 189 187<br />
61 51 AO/L University Electric Santa Clara, Calif. $20 $24 -16.7% 1 1<br />
62 63 EA/R Manny’s TV & Appliances Wilbraham, Mass. $20 $18 7.3% 4 4<br />
63 66 EA/R Bill Smith Appliance & Electronics Fort Myers, Fla. $19 $18 7.0% 8 8<br />
64 56 HF Rosa’s Home Stores Cheektowago, N.Y. $18 $21 -14.4% 1 1<br />
65 67 EA/R Handy TV & Appliance Birmingham, Ala. $18 $17 3.5% 16 18<br />
66 73 AO/L Warehouse Discount Center Moorpark, Calif. $18 $17 7.5% 6 6<br />
67 65 EA/R Big Sandy Superstores Franklin Firnace, Ohio $18 $18 -2.0% 19 18<br />
68 72 HF Olum’s Vestal, N.Y. $17 $17 3.5% 4 4<br />
NR = Not ranked last year. AO/L = Appliance-only store EA/R = Electronics/Appliance stores/Regional<br />
NA = Not applicable. CD/I = Consumer direct/Internet shopping HF = Home-furnishings stores<br />
(a) Most store type codes were developed jointly by TWICE and the Consumer Electronics Association. DS = Department stores HIC = Home-improvement centers<br />
(b) All sales information, except for that supplied by publicly held companies that break out line-of-business sales D/G = Drug/Grocery stores MM = Mass merchants<br />
for major appliances, is based on TWICE estimates. EA/M = Electronics/Appliance stores/One-market MS/PX = Miscellaneous/Military exchanges<br />
(c) Total sales were rounded to millions, but percent change reflects unrounded totals. EA/N = Electronics/Appliance stores/Multiregional WC = Warehouse clubs<br />
Source: TWICE market research<br />
© TWICE 2011<br />
26 June 20, 2011 www.twice.com
TOP 100 majOr aPPliance reTailers<br />
TOTAL MA SALES % NUMBER<br />
RANK RANK STORE IN $ MILLIONS (b) CHANGE (c) OF STORES<br />
2010 2009 TyPE (a) RETAILER HEADQUARTERS 2010 2009 2010/2009 2010 2009<br />
69 69 EA/R Alabama Power Appliance Center Birmingham, Ala. $17 $17 0.0% 87 87<br />
70 60 EA/M Vann’s Missoula, Mont. $17 $20 -15.0% 8 7<br />
71 70 EA/R Van Vreede’s Appleton, Wis. $17 $17 0.0% 3 3<br />
72 71 EA/R Baillio’s Electronic & Appl. Connection Albuquerque, N.M. $17 $17 1.2% 2 2<br />
73 74 HF Charlotte Furniture and Appliance Rochester, N.Y. $16 $16 0.0% 1 1<br />
74 68 EA/M Judd & Black Appliance Everett, Wash. $16 $17 -5.9% 4 4<br />
75 84 AO/L Dick Van Dyke Appliance World Springfield, Ill. $16 $12 33.3% 4 3<br />
76 76 AO/L Appliance World - Wisconsin Greenfield, Wis. $15 $15 3.0% 3 1<br />
77 78 AO/L Reno’s Appliances Fairfield, N.J. $15 $14 6.0% 2 2<br />
78 77 HF Colder’s West Allis, Wis. $15 $14 4.0% 4 4<br />
79 100 AO/L Fred’s Appliance Madison, Ohio $14 $12 17.9% 3 3<br />
80 79 AO/L Recker and Boerger Cincinnati $14 $14 -3.0% 3 3<br />
81 82 EA/M Art Handler’s Appliance Pleasantville, N.J. $13 $13 3.0% 1 1<br />
82 87 EA/M Appliance Center of Toledo Maumee, Ohio $13 $12 12.6% 1 1<br />
83 81 EA/M Mr. Jay Appliance & TV Williston Park, N.Y. $13 $13 0.0% 1 1<br />
84 86 EA/M John D. Marcella Appliances Schenectady, N.Y. $13 $11 18.2% 1 2<br />
85 80 EA/M Jeff Lynch Appliance & TV Center Greenville, S.C. $12 $13 -5.0% 1 1<br />
86 85 EA/M Agren Appliance Auburn, Maine $12 $12 0.0% 5 5<br />
87 83 EA/M Plessers Appliances & Electronics Babylon, N.Y. $12 $12 -4.0% 1 1<br />
88 88 EA/M Oldfield’s Eugene, Ore. $11 $12 -2.0% 3 3<br />
89 91 EA/M Midway Appliance Victorville, Calif. $11 $10 10.0% 1 1<br />
90 89 AO/L Southeast Steel Orlando, Fla. $11 $11 -3.8% 1 1<br />
91 75 HF Lack’s Stores Victoria, Texas $11 $15 -28.4% 36 36<br />
92 90 AO/L Christie’s Appliance Tucson, Ariz. $10 $11 -5.0% 3 3<br />
93 93 HF King’s Great Buys Plus Evansville, Ind. $10 $9 9.0% 6 5<br />
94 98 EA/M B & B Appliance Euclid, Ohio $10 $9 7.5% 2 2<br />
95 94 AO/L Bob Wallace Appliance Huntsville, Ala. $9 $9 0.0% 2 1<br />
96 92 EA/M East Coast Appliance Chesapeake, Va. $9 $10 -9.7% 4 4<br />
97 99 AO/L Martin Appliance Gainesville, Fla. $9 $8 7.5% 2 4<br />
98 NR EA/M Rosner’s West Palm Beach, Fla. $8 $7 14.3% 1 1<br />
99 96 EA/M Urner’s Bakersfield, Calif. $8 $9 -11.1% 1 1<br />
100 97 AO/L Aztec Appliance San Diego $8 $9 -13.0% 1 1<br />
Total $24,293 $23,022 5.5%<br />
NR = Not ranked last year. AO/L = Appliance-only store EA/R = Electronics/Appliance stores/Regional<br />
NA = Not applicable. CD/I = Consumer direct/Internet shopping HF = Home-furnishings stores<br />
(a) Most store type codes were developed jointly by TWICE and the Consumer Electronics Association. DS = Department stores HIC = Home-improvement centers<br />
(b) All sales information, except for that supplied by publicly held companies that break out line-of-business sales D/G = Drug/Grocery stores MM = Mass merchants<br />
for major appliances, is based on TWICE estimates. EA/M = Electronics/Appliance stores/One-market MS/PX = Miscellaneous/Military exchanges<br />
(c) Total sales were rounded to millions, but percent change reflects unrounded totals. EA/N = Electronics/Appliance stores/Multiregional WC = Warehouse clubs<br />
Source: TWICE market research<br />
© TWICE 2011<br />
28 June 20, 2011 www.twice.com
TOP 100 majOr aPPliance reTailers<br />
By Channel<br />
ESTIMATED MA SAlES % OF TOTAl<br />
RAnk I n $ MIllIOnS R EgISTRy SAlES<br />
2010 RETAIlER 2010 REv. 2009 2010 2009<br />
Total Appliance-Only stores $628 $611 2.6% 2.7%<br />
22 Appliance Direct $75 $78 0.3% 0.3%<br />
25 ApplianceSmart $69 $71 0.3% 0.3%<br />
30 Standards of Excellence North $55 $49 0.2% 0.2%<br />
31 Bray & Scarff $54 $50 0.2% 0.2%<br />
35 Warners’ Stellian Appliance $46 $43 0.2% 0.2%<br />
36 Appliance Factory Outlet $42 $38 0.2% 0.2%<br />
39 Airport Home Appliance $38 $37 0.2% 0.2%<br />
51 Atherton Appliance and Kitchens $25 $24 0.1% 0.1%<br />
52 Apsco Appliance Centers $24 $23 0.1% 0.1%<br />
55 Yale Appliance & Lighting $22 $21 0.1% 0.1%<br />
58 Albert Lee Appliance Co. $21 $21 0.1% 0.1%<br />
61 University Electric $20 $24 0.1% 0.1%<br />
66 Warehouse Discount Center $18 $17 0.1% 0.1%<br />
75 Dick Van Dyke Appliance World $16 $12 0.1% 0.0%<br />
76 Appliance World - Wisconsin $15 $15 0.1% 0.1%<br />
77 Reno’s Appliances $15 $14 0.1% 0.1%<br />
79 Fred’s Appliance $14 $12 0.1% 0.0%<br />
80 Recker and Boerger $14 $14 0.1% 0.1%<br />
90 Southeast Steel $11 $11 0.0% 0.0%<br />
92 Christie’s Appliance $10 $11 0.0% 0.0%<br />
95 Bob Wallace Appliance $9 $9 0.0% 0.0%<br />
97 Martin Appliance $9 $8 0.0% 0.0%<br />
100 Aztec Appliance $8 $9 0.0% 0.0%<br />
Total Consumer Direct $98 $84 0.4% 0.4%<br />
28 Amazon $62 $52 0.3% 0.2%<br />
43 AJ Madison $36 $32 0.1% 0.1%<br />
Total Department Store $24 $24 0.1% 0.1%<br />
53 Boscov’s $24 $24<br />
Total Electronics/Appliance Stores/One Market $468 461 1.9% 2.0%<br />
14 Abt Electronics and Appliances $164 $162 0.7% 0.7%<br />
44 County TV & Appliance $34 $31 0.1% 0.1%<br />
46 Leiberts Royal Green Appliance Center $27 $26 0.1% 0.1%<br />
54 La Curacao $22 $20 0.1% 0.1%<br />
56 Aitoro Appliance and Electronics $21 $21 0.1% 0.1%<br />
57 Filco Discount Centers $21 $21 0.1% 0.1%<br />
70 Vann’s $17 $20 0.1% 0.1%<br />
74 Judd & Black Appliance $16 $17 0.1% 0.1%<br />
81 Art Handler’s Appliance $13 $13 0.1% 0.1%<br />
82 Appliance Center of Toledo $13 $12 0.1% 0.1%<br />
83 Mr. Jay Appliance & TV $13 $13 0.1% 0.1%<br />
84 John D. Marcella Appliances $13 $11 0.1% 0.0%<br />
85 Jeff Lynch Appliance & TV Center $12 $13 0.1% 0.1%<br />
86 Agren Appliance $12 $12 0.0% 0.1%<br />
87 Plessers Appliances & Electronics $12 $12 0.0% 0.1%<br />
88 Oldfield’s $11 $12 0.0% 0.1%<br />
89 Midway Appliance $11 $10 0.0% 0.0%<br />
94 B & B Appliance $10 $9 0.0% 0.0%<br />
96 East Coast Appliance $9 $10 0.0% 0.0%<br />
98 Rosner’s $8 $7 0.0% 0.0%<br />
99 Urner’s $8 $9 0.0% 0.0%<br />
Total Electronics/Appliance Stores/Multiregion $2,475 2,299 10.2% 10.0%<br />
4 Best Buy $1,758 $1,712 7.2% 7.4%<br />
6 hhgregg $654 $519 2.7% 2.3%<br />
27 Fry’s Electronics $63 $68 0.3% 0.3%<br />
Total Electronics/Appliance Stores/Regional $2,022 $2,005 8.3% 8.7%<br />
7 P.C. Richard & Son $549 $518 2.3% 2.2%<br />
8 BrandsMart USA $214 $213 0.9% 0.9%<br />
11 Conn’s $185 $208 0.8% 0.9%<br />
12 Pacific Sales Kitchen & Bath Centers $180 $179 0.7% 0.8%<br />
30 June 20, 2011 www.twice.com<br />
ESTIMATED MA SAlES % OF TOTAl<br />
RAnk I n $ MIllIOnS R EgISTRy SAlES<br />
2010 RETAIlER 2010 REv. 2009 2010 2009<br />
13 ABC Warehouse $167 $178 0.7% 0.8%<br />
23 Grants Appliance $73 $68 0.3% 0.3%<br />
24 Howard’s Appliance $69 $67 0.3% 0.3%<br />
26 Orvilles Home Appliances $64 $58 0.3% 0.3%<br />
32 Karl’s Sales & Service $53 $53 0.2% 0.2%<br />
33 Spencer’s TV & Appliance $52 $52 0.2% 0.2%<br />
34 Famous Tate $48 $52 0.2% 0.2%<br />
37 Jetson TV & Appliance Centers $40 $39 0.2% 0.2%<br />
40 Queen City Audio Video & Appliances $38 $38 0.2% 0.2%<br />
41 Western Appliance TV & Stereo $38 $41 0.2% 0.2%<br />
45 Karl’s TV & Appliance $31 $28 0.1% 0.1%<br />
47 Cowboy Maloney $27 $26 0.1% 0.1%<br />
49 Grand Appliance & TV $26 $25 0.1% 0.1%<br />
50 Plass Appliance $25 $23 0.1% 0.1%<br />
59 Gerhard’s $20 $18 0.1% 0.1%<br />
62 Manny’s TV & Appliances $20 $18 0.1% 0.1%<br />
63 Bill Smith Appliance & Electronics $19 $18 0.1% 0.1%<br />
65 Handy TV & Appliance $18 $17 0.1% 0.1%<br />
67 Big Sandy Superstores $18 $18 0.1% 0.1%<br />
69 Alabama Power Appliance Center $17 $17 0.1% 0.1%<br />
71 Van Vreede’s $17 $17 0.1% 0.1%<br />
72 Baillio’s Electronic & Appl. Connection $17 $17 0.1% 0.1%<br />
Total Home Furnishing $582 $567 2.4% 2.5%<br />
16 Nebraska Furniture Mart $137 $132 0.6% 0.6%<br />
17 American TV & Appliances $129 $123 0.5% 0.5%<br />
19 R.C. Willey Home Furnishings $109 $108 0.4% 0.5%<br />
20 The Great Indoors $81 $73 0.3% 0.3%<br />
38 Badcock Home Furnishing Ctrs. & More $38 $37 0.2% 0.2%<br />
64 Rosa’s Home Stores $18 $21 0.1% 0.1%<br />
68 Olum’s $17 $17 0.1% 0.1%<br />
73 Charlotte Furniture and Appliance $16 $16 0.1% 0.1%<br />
78 Colder’s $15 $14 0.1% 0.1%<br />
91 Lack’s Stores $11 $15 0.0% 0.1%<br />
93 King’s Great Buys Plus $10 $9 0.0% 0.0%<br />
Total Home-Improvement Centers $9,079 $8,428 37.4% 36.6%<br />
2 Lowe’s $5,365 $4,904 22.1% 21.3%<br />
3 The Home Depot $3,538 $3,356 14.6% 14.6%<br />
15 Menards $139 $130 0.6% 0.6%<br />
42 Ferguson $38 $38 0.2% 0.2%<br />
Total Mass Merchants $8,498 $8,115 35.0% 35.2%<br />
1 Sears $7,508 $7,192 30.9% 31.2%<br />
5 Wal-Mart $722 $666 3.0% 2.9%<br />
10 Target $188 $174 0.8% 0.8%<br />
21 Kmart $80 $82 0.3% 0.4%<br />
Total Miscellaneous $82 $89 0.3% 0.4%<br />
29 Army-Air Force Exchange $56 $63 0.2% 0.3%<br />
48 Navy Exchange $26 $26 0.1% 0.1%<br />
Total Warehouse Clubs $336 $340 1.4% 1.5%<br />
9 Costco Wholesale $200 $206 0.8% 0.9%<br />
18 Sam’s Club $116 $115 0.5% 0.5%<br />
60 BJ’s Wholesale Club $20 $19 0.1% 0.1%<br />
Totals $24,293 $23,022 100% 100%<br />
All sales information, except for that supplied by publicly held companies that break<br />
out line-of-business sales for major appliances, is based on TWICE market research<br />
estimates.<br />
© TWICE 2011