Print this article
Print this article
Print this article

Create successful ePaper yourself
Turn your PDF publications into a flip-book with our unique Google optimized e-Paper software.
C.L. Abayasekara, C.L. Siriwardana and M.G.M Razaak 135<br />
(ii) faecal coliform and (iii) faecal Streptococci,<br />
using standard methods (Bisen and Verma,<br />
1994; Toronzos and McFeters, 1997). Pour<br />
plates were prepared to enumerate the<br />
Heterotrophic Plate Count (HPC) using nutrient<br />
agar (American Society for Microbiology, 2002;<br />
Black, 1993; Pourcher et al., 1991). Water pH<br />
and the turbidity were measured using a<br />
calibrated pH meter and a spectrophotometer<br />
respectively. The temperature was measured at a<br />
depth of 5 cm.<br />
Concurrently, a sociological survey (Fink<br />
and Kosecoff, 1985) was carried out using a<br />
questionnaire to find out the attitudes of people<br />
living adjacent to the Maha Oya stream, on the<br />
quality of stream water. A stratified random<br />
sample of 30 houses, representing 18 from the<br />
populated area (line houses) and 12 from the<br />
agricultural area was selected.<br />
RESULTS<br />
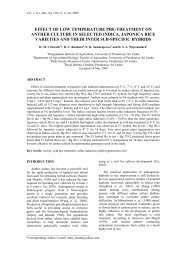
The total coliform counts (per 100 ml of<br />
water) in the four locations ranged from 3.0x10 3<br />
to 5.0x10 4 cfu in the wet season and 1.4x10 3 to<br />
2.6x10 4 cfu in the dry season. The faecal<br />
coliform counts ranged from 3.6x10 2 to 7.0x10 3<br />
cfu in the wet season and 8.8x10 2 to 6.9x10 3 cfu<br />
in the dry season. The counts of both total and<br />
faecal coliforms were significantly higher in the<br />
populated area than in other locations, during<br />
both seasons (Fig. 1). A significantly higher<br />
number of total colifoms was observed in the<br />
Total/fecal coliform counts<br />
(per 100ml of water)<br />
6.E+04<br />
5.E+04<br />
4.E+04<br />
3.E+04<br />
2.E+04<br />
1.E+04<br />
0.E+00<br />
b<br />
Forest<br />
b<br />
b b<br />
a<br />
a<br />
Populated area<br />
a a<br />
Agricultural area<br />
b<br />
b<br />
b b<br />
Sampling site<br />
b<br />
University premises<br />
wet season in the populated area when compared<br />
to the dry season. The HPC of the four locations<br />
ranged from 1.7x10 5 to 4.3x10 5 cfu in the wet<br />
season and 1.8x10 5 to 2.6 x10 5 cfu in the dry<br />
season. There was no significant difference in<br />
the HPC among the four locations or between<br />
the wet and dry season at any of the locations.<br />
The faecal Streptococci counts ranged from<br />
5.2x10 2 to 1.9x10 3 cfu in the wet season and<br />
1.9x10 2 to 1.7x10 3 cfu in the dry season. The<br />
source of faecal pollution was determined using<br />
the FC/FS (faecal coliform/faecal Streptococci)<br />
ratio. According to the results, the source of<br />
faecal pollution during the dry season in the<br />
forested and populated area was human, while in<br />
the other locations during both seasons, the<br />
source of faecal pollution was human and animal<br />
waste.<br />
Among the four locations, the lowest water<br />
temperature was in the forested area with an<br />
increase in temperature down stream. There was<br />
no significant difference in temperature between<br />
the wet and dry seasons at any location. The wet<br />
season had a higher turbidity in all four<br />
locations. The forested area had the lowest<br />
turbidity during both dry and wet seasons, while<br />
turbidity was highest in the agricultural area in<br />
the wet season and near the populated area in the<br />
dry season (Table 1). A significant difference in<br />
pH between the wet and the dry seasons was<br />
observed in the agricultural area. The pH of<br />
stream water in the populated area was lower<br />
when compared to the other locations during<br />
both seasons (Table 1)<br />
b<br />
b b<br />
Total coliform - Wet<br />
season<br />
Total coliform - Dry season<br />
Fecal coliform - Wet<br />
season<br />
Fecal coliform - Dry<br />
season<br />
Figure 1. Total coliform and faecal coliform counts in four locations of Maha Oya during the wet<br />
and dry season. (Bars representing the two counts in two seasons followed by the same letter are not<br />
significantly different at 5% level –DMRT.)