Unit I Review ? Chapters 1 -8 Key Terms/Definitions - schs
Unit I Review ? Chapters 1 -8 Key Terms/Definitions - schs
Unit I Review ? Chapters 1 -8 Key Terms/Definitions - schs

You also want an ePaper? Increase the reach of your titles
YUMPU automatically turns print PDFs into web optimized ePapers that Google loves.
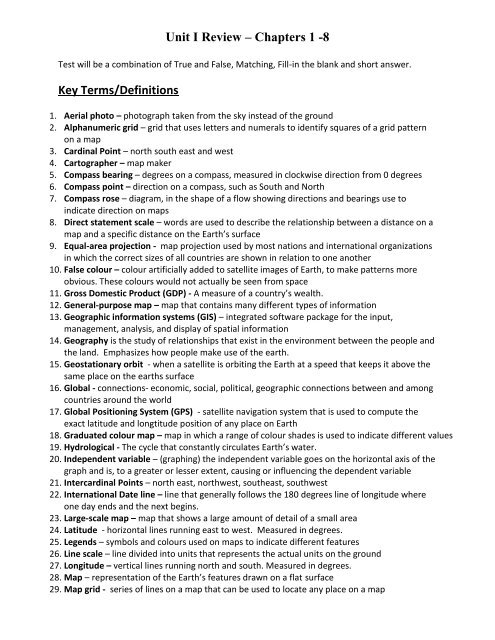
<strong>Unit</strong> I <strong>Review</strong> – <strong>Chapters</strong> 1 -8<br />
Test will be a combination of True and False, Matching, Fill-in the blank and short answer.<br />
<strong>Key</strong> <strong>Terms</strong>/<strong>Definitions</strong><br />
1. Aerial photo – photograph taken from the sky instead of the ground<br />
2. Alphanumeric grid – grid that uses letters and numerals to identify squares of a grid pattern<br />
on a map<br />
3. Cardinal Point – north south east and west<br />
4. Cartographer – map maker<br />
5. Compass bearing – degrees on a compass, measured in clockwise direction from 0 degrees<br />
6. Compass point – direction on a compass, such as South and North<br />
7. Compass rose – diagram, in the shape of a flow showing directions and bearings use to<br />
indicate direction on maps<br />
8. Direct statement scale – words are used to describe the relationship between a distance on a<br />
map and a specific distance on the Earth’s surface<br />
9. Equal-area projection - map projection used by most nations and international organizations<br />
in which the correct sizes of all countries are shown in relation to one another<br />
10. False colour – colour artificially added to satellite images of Earth, to make patterns more<br />
obvious. These colours would not actually be seen from space<br />
11. Gross Domestic Product (GDP) - A measure of a country’s wealth.<br />
12. General-purpose map – map that contains many different types of information<br />
13. Geographic information systems (GIS) – integrated software package for the input,<br />
management, analysis, and display of spatial information<br />
14. Geography is the study of relationships that exist in the environment between the people and<br />
the land. Emphasizes how people make use of the earth.<br />
15. Geostationary orbit - when a satellite is orbiting the Earth at a speed that keeps it above the<br />
same place on the earths surface<br />
16. Global - connections- economic, social, political, geographic connections between and among<br />
countries around the world<br />
17. Global Positioning System (GPS) - satellite navigation system that is used to compute the<br />
exact latitude and longtitude position of any place on Earth<br />
18. Graduated colour map – map in which a range of colour shades is used to indicate different values<br />
19. Hydrological - The cycle that constantly circulates Earth’s water.<br />
20. Independent variable – (graphing) the independent variable goes on the horizontal axis of the<br />
graph and is, to a greater or lesser extent, causing or influencing the dependent variable<br />
21. Intercardinal Points – north east, northwest, southeast, southwest<br />
22. International Date line – line that generally follows the 180 degrees line of longitude where<br />
one day ends and the next begins.<br />
23. Large-scale map – map that shows a large amount of detail of a small area<br />
24. Latitude - horizontal lines running east to west. Measured in degrees.<br />
25. Legends – symbols and colours used on maps to indicate different features<br />
26. Line scale – line divided into units that represents the actual units on the ground<br />
27. Longitude – vertical lines running north and south. Measured in degrees.<br />
28. Map – representation of the Earth’s features drawn on a flat surface<br />
29. Map grid - series of lines on a map that can be used to locate any place on a map
<strong>Unit</strong> I <strong>Review</strong> – <strong>Chapters</strong> 1 -8<br />
30. Map projection – when the round features of the globe are transferred to a flat surface.<br />
31. Mental map – map in our mind of places we know<br />
32. Mercator Projection – the most common map projection but it distortes true size of<br />
landmasses.<br />
33. Pie graph – common graph that uses sections of a circle to illustrate value<br />
34. Population density – figure calculated by dividing the population of a region by a region’s area<br />
35. Prime meridian – line of longitude on maps or globes that joins the North and South Poles and<br />
runs through Greenwich, England.<br />
36. Proportional area graph – type of graph that can be produced in many shapes, frequently circles<br />
37. Radar – in remote sensing, rador sensors send out microwaves to the Earth’s surface and use<br />
the microwaves reflected back to create image of human objects and natural features on the<br />
Earth’s surface<br />
38. Remote sensing - science of acquiring information about the earth’s surface without being in<br />
contact with it.<br />
39. Representative fraction scale – scale on a map given as a ratio of distance on the map to<br />
distance on the ground, such as 1:50 000<br />
40. Satellite – manufactured object that is launched by a rocket and circles the Earth<br />
41. Scale – measurement on a map that represents an actual distance on the Earth’s surface<br />
42. Small-scale map – map that shows a small amount of detail of a large area<br />
43. Stacked bar graph –very much like bar graph, with one important difference: while each bar<br />
in a simple bar graph represents one value, a stacked bar can be used to represent several<br />
closely related values<br />
44. Standard time –every place within a time zone has the same time, which is referred to as<br />
standard time<br />
45. Stereo pair - pair of aerial photographs that when looked at through a stereoscope, show 3dimensional<br />
image<br />
46. Thematic map - map containing information on only one particular topic<br />
47. Time zone – division of the Earth’s surface, usually extending across 15 degrees longtitude,<br />
that establishes a uniform time<br />
48. Topographic map – large-scale map showing both natural and human-made features<br />
49. Topography – natural and human features of the landscape<br />
50. Weather – combination of temperature, precipitation, cloud cover, and winds experienced daily<br />
51. Winkel Tripel projection – best map projection for providing a balance between size and shape<br />
52. X / y scattergraph - simple and useful graphs showing relationships between two sets of data<br />
<strong>Review</strong>/Sample Questions<br />
1. The main problem with the Mercator Projection in class is distorts size and shapes of<br />
large objects like landmasses<br />
2. Which map is used to show elevation? Topographic<br />
3. When the features of a globe are transferred onto a flat surface, it is called: map projection<br />
4. Thematic maps show information from one particular topic.
<strong>Unit</strong> I <strong>Review</strong> – <strong>Chapters</strong> 1 -8<br />
5. List three types of map projections<br />
a. Mercator Projection<br />
b. Equal area projections<br />
c. Winkle Triple Projection<br />
6. List 3 types of grids:<br />
a. Longitude and Latitude<br />
b. Algebraic (Alphanumeric) grids (letters and numbers)<br />
c. Military (map) grids<br />
7. Lines of Lattitude are horizontal lines running east to west. They are measured in<br />
degrees North and South of the Equator.<br />
8. Lines of Longitude _ are vertical lines running north to south. They are measured in<br />
degrees East and West of the Prime Meridian<br />
9. A Compass Rose is used to indicate north and shows intercardinal and cardinal points.<br />
10. In point form, list six components of most maps. Title, Date, Legend, Direction<br />
Rose/Compass, Scale, Grid (latitude and longitude), Colour.<br />
11. List the four intercardinal points? East , West , North , South<br />
12. List the four cardinal points? Northeast Northwest , Southeast , Southwest<br />
13. The following questions are based on time zones. Some apply to the map below.<br />
a. If an Eskimo vs. Blue Bomber game is broadcast life from Edmonton, what time is<br />
it on TV in St. John’s, NF?<br />
b. (b) How many degrees is one time zone? How much time does each time zone<br />
represent?<br />
c. c) Last summer, my American History class went to Nashville, TN, an<br />
approximately 3 day drive. Is Nashville in the same time zone?<br />
14. What is the compass bearing or direction of the following:<br />
a. South: (b) NNW: (c) SSW:<br />
15. Identify the name/type of each of the following scale definition:<br />
a. Scale in ration form (R.F Scale)<br />
b. Scale in diagram form (line scale, Graphic Scale)<br />
c. Scale using words to describe the relationship (Direct Statement Scale)<br />
16. A line divided into units that represent actual units on the ground is a<br />
a. representative fraction scale b. line scale<br />
b. c. direct statement scale d. none of the above<br />
17. 1:2 500 is an example of a<br />
a. representative fraction b. direct statement scale<br />
b. c. line scale d. none of the above.
<strong>Unit</strong> I <strong>Review</strong> – <strong>Chapters</strong> 1 -8<br />
18. Which is an example of a direct statement scale?<br />
a. 1:10 000 b. 1/10 000 c. 1 cm to 10 000 km d. both a & b<br />
19. Photographs taken from aircraft for the purpose of surveying is known as<br />
a. seismology b. satellite imagery<br />
b. c. geostationary imagery d. remote sensing<br />
20. Remote sensing can be used to<br />
a. study weather and climate.<br />
b. examine crop types and predict yields.<br />
c. classify land types.<br />
d. all of the above.<br />
e. none of the above.<br />
21. Remote sensing can be used to<br />
a. study weather and climate.<br />
b. examine crop types and predict yields.<br />
c. classify land types.<br />
d. all of the above.<br />
e. none of the above.<br />
22. This highly visual graph is frequently used in newspapers and ads to convey information<br />
because it is easy to understand:<br />
a. scatterplot b. stacked bar c. pie d. proportional area<br />
23. Average annual precipitation and temperature are best conveyed by<br />
a. Pie Graph b. Proportional Area Graph<br />
c. Scatterplot d. Climate Graph<br />
24. Using a Bar Graph for Precipitation and a Scatterplot (with lines connecting the dots)<br />
Graph for Temperature superimposed on the bar graph, graph the data. Months are<br />
the independent variable. Label temperature on the left side and precipitation on the<br />
right side of the graph. Be sure to provide a title, label, and a numbered system for your<br />
graph.<br />
25. Using a pie graph, graph the following data:<br />
Grade 7 15 students<br />
Grade 8 30 students<br />
Grade 9 50 students<br />
Grade 10 100 students<br />
Grade 11 5 students