Hypothesis Testing The z-test for Proportions
Hypothesis Testing The z-test for Proportions
Hypothesis Testing The z-test for Proportions

You also want an ePaper? Increase the reach of your titles
YUMPU automatically turns print PDFs into web optimized ePapers that Google loves.
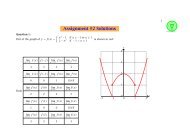
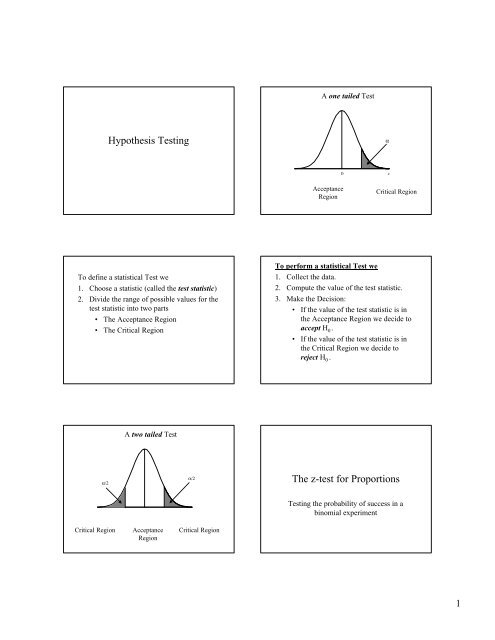
<strong>Hypothesis</strong> <strong>Testing</strong><br />
To define a statistical Test we<br />
1. Choose a statistic (called the <strong>test</strong> statistic)<br />
2. Divide the range of possible values <strong>for</strong> the<br />
<strong>test</strong> statistic into two parts<br />
• <strong>The</strong> Acceptance Region<br />
• <strong>The</strong> Critical Region<br />
α/2<br />
Critical Region<br />
A two tailed Test<br />
0<br />
Acceptance<br />
Region<br />
α/2<br />
z<br />
Critical Region<br />
A one tailed Test<br />
Acceptance<br />
Region<br />
α<br />
0 z<br />
Critical Region<br />
To per<strong>for</strong>m a statistical Test we<br />
1. Collect the data.<br />
2. Compute the value of the <strong>test</strong> statistic.<br />
3. Make the Decision:<br />
• If the value of the <strong>test</strong> statistic is in<br />
the Acceptance Region we decide to<br />
accept H 0 .<br />
• If the value of the <strong>test</strong> statistic is in<br />
the Critical Region we decide to<br />
reject H 0 .<br />
<strong>The</strong> z-<strong>test</strong> <strong>for</strong> <strong>Proportions</strong><br />
<strong>Testing</strong> the probability of success in a<br />
binomial experiment<br />
1
Reject H 0<br />
<strong>The</strong> Test Statistic<br />
pˆ<br />
− p<br />
z =<br />
σ<br />
α/2<br />
0<br />
=<br />
pˆ<br />
− p<br />
p<br />
( 1−<br />
p )<br />
pˆ 0 0<br />
n<br />
<strong>The</strong> Acceptance region:<br />
− zα<br />
/ 2 0 zα<br />
/ 2<br />
Accept H 0<br />
<strong>The</strong> one tailed z-<strong>test</strong><br />
: p p H ≤<br />
0<br />
H A<br />
0<br />
: p > p<br />
0<br />
0<br />
α/2<br />
z<br />
Reject H 0<br />
<strong>The</strong> Test Statistic<br />
pˆ<br />
− p<br />
z =<br />
σ<br />
0<br />
=<br />
pˆ<br />
− p<br />
p<br />
( 1−<br />
p )<br />
pˆ 0 0<br />
n<br />
<strong>The</strong> Acceptance and Critical region:<br />
z<br />
0 α z<br />
Accept H0 Reject H0 <strong>The</strong> one tailed z-<strong>test</strong><br />
: p p H ≥<br />
0<br />
H A<br />
0<br />
: p < p<br />
0<br />
0<br />
α<br />
2
α<br />
<strong>The</strong> Test Statistic<br />
pˆ<br />
− p<br />
z =<br />
σ<br />
Reject H0<br />
0<br />
=<br />
pˆ<br />
− p<br />
p<br />
( 1−<br />
p )<br />
pˆ 0 0<br />
n<br />
<strong>The</strong> Acceptance region:<br />
− zα<br />
0<br />
0 z<br />
Accept H0 Comments<br />
• <strong>The</strong> alternative <strong>Hypothesis</strong> (H A) is<br />
what the experiment is trying to<br />
prove - the Research <strong>Hypothesis</strong><br />
• <strong>The</strong> alternative <strong>Hypothesis</strong> (H A) will<br />
determine if you use a one-tailed <strong>test</strong><br />
or a two tailed <strong>test</strong><br />
• If you are trying to prove a difference<br />
H A<br />
: p ≠ p<br />
• This is the alternative <strong>Hypothesis</strong> (H A)<br />
- the Research <strong>Hypothesis</strong><br />
• Use a two tailed <strong>test</strong><br />
• If you are trying to prove the true value p<br />
exceeds the hypothesized value p 0<br />
H A<br />
: p > p<br />
• This is the alternative <strong>Hypothesis</strong> (H A)<br />
- the Research <strong>Hypothesis</strong><br />
• If you are trying to prove the true value p<br />
does not exceed the hypothesized value p 0<br />
H A<br />
: p <<br />
p<br />
• This is the alternative <strong>Hypothesis</strong> (H A)<br />
- the Research <strong>Hypothesis</strong><br />
0<br />
0<br />
0<br />
3
• If you are trying to prove a difference<br />
H A<br />
: p ≠ p<br />
• This is the alternative <strong>Hypothesis</strong> (H A)<br />
- the Research <strong>Hypothesis</strong><br />
Example<br />
• A new surgical procedure is developed <strong>for</strong><br />
correcting heart defects infants be<strong>for</strong>e the<br />
age of one month.<br />
• Previously the procedure was used on<br />
infants that were older than one month and<br />
the success rate was 91%<br />
• A study is conducted to determine if the<br />
success rate of the new procedure is greater<br />
than 91% (n = 200)<br />
0<br />
Comments<br />
• Different objectives will result in different<br />
choices of the alternative hypothesis<br />
• If you were interested in Proving that the<br />
new procedure is an improvement:<br />
• <strong>The</strong>n<br />
H A<br />
: p > p<br />
0<br />
• If you were interested in proving that the<br />
new procedure is not an improvement:<br />
• <strong>The</strong>n<br />
H A<br />
: p < p<br />
• If you were interested in proving only a<br />
difference between the new and the old:<br />
• <strong>The</strong>n<br />
H A<br />
: p ≠ p<br />
We want to <strong>test</strong><br />
– H0 : p ≤ 0.<br />
91(<br />
91%)<br />
Against<br />
p > 0.<br />
91(<br />
91<br />
– H A : %)<br />
p<br />
= the success rate of the new procedure<br />
0<br />
0<br />
4
Per<strong>for</strong>ming the Test<br />
1. Decide on α = P[Type I Error] = the<br />
significance level of the <strong>test</strong><br />
Choose (α = 0.05)<br />
2. Collect the data<br />
• <strong>The</strong> number of successful operations in the<br />
sample of 200 cases is x = 187<br />
x 187<br />
pˆ<br />
= = =<br />
n 200<br />
3. Compute the <strong>test</strong> statistic<br />
0.<br />
935 (93.5%)<br />
pˆ<br />
− p0<br />
z = =<br />
σ pˆ pˆ<br />
− p0<br />
p0(<br />
1−<br />
p0<br />
)<br />
n<br />
=<br />
0.<br />
935−<br />
0.<br />
91<br />
= 1.<br />
235<br />
0.<br />
91(<br />
1−<br />
0.<br />
91)<br />
200<br />
4. Make the Decision zα = z<br />
• Accept H0 if: z ≤1.<br />
645<br />
• Reject H 0 if:<br />
z > 1.<br />
645<br />
0 . 05<br />
=<br />
1.<br />
645<br />
Since the <strong>test</strong> statistic is in the Acceptance<br />
region we decide to Accept H 0<br />
Conclude that H0 : p ≤ 0.<br />
91(<br />
91%)<br />
is true<br />
<strong>The</strong>re is a no significant (α = 5%) increase<br />
in the success rate of the new procedure<br />
over the older procedure<br />
Comments<br />
• When the decision is made to accept H 0 is<br />
made it should not be conclude that we have<br />
proven H 0 .<br />
• This is because when setting up the <strong>test</strong> we<br />
have not controlled β = P[type II error] =<br />
P[accepting H 0 when H 0 is FALSE]<br />
• Whenever H 0 is accepted there is a<br />
possibility that a type II error has been<br />
made.<br />
In the last example<br />
<strong>The</strong> conclusion that there is a no significant<br />
(α = 5%) increase in the success rate of the<br />
new procedure over the older procedure<br />
should be interpreted:<br />
We have been unable to proof that the new<br />
procedure is better than the old procedure<br />
An analogy – a jury trial<br />
<strong>The</strong> two possible decisions are<br />
– Declare the accused innocent.<br />
– Declare the accused guilty.<br />
5
<strong>The</strong> null hypothesis (H 0 ) – the accused is<br />
innocent<br />
<strong>The</strong> alternative hypothesis (H A ) – the accused<br />
is guilty<br />
<strong>The</strong> two possible errors that can be made:<br />
– Declaring an innocent person guilty.<br />
(type I error)<br />
– Declaring a guilty person innocent.<br />
(type II error)<br />
Note: in this case one type of error may be<br />
considered more serious<br />
Requiring all 12 jurors to support a guilty verdict :<br />
– Ensures that the probability of a type I error<br />
(Declaring an innocent person guilty) is<br />
small.<br />
– However the probability of a type II error<br />
(Declaring an guilty person innocent) could<br />
be large.<br />
Hence: When decision of innocence is made:<br />
– It is not concluded that innocence has<br />
been proven<br />
but that<br />
– we have been unable to disprove<br />
innocence<br />
<strong>The</strong> z-<strong>test</strong> <strong>for</strong> the Mean of a<br />
Normal Population<br />
We want to <strong>test</strong>, μ, denote the mean<br />
of a normal population<br />
Situation<br />
• A success-failure experiment has been<br />
repeated n times<br />
• <strong>The</strong> probability of success p is unknown.<br />
We want to <strong>test</strong><br />
– H0 : p = p0 (some specified value of p)<br />
Against<br />
– HA : 0 p p ≠<br />
6
<strong>The</strong> Data<br />
• Let x1 , x2 , x3 , … , xn denote a sample from a<br />
normal population with mean μ and standard<br />
deviation σ.<br />
• Let<br />
n<br />
∑ xi<br />
i=<br />
1 x = = the sample mean<br />
n<br />
• we want to <strong>test</strong> if the mean, μ, is equal to some<br />
given value μ 0 .<br />
• Obviously if the sample mean is close to μ 0 the<br />
Null <strong>Hypothesis</strong> should be accepted otherwise the<br />
null <strong>Hypothesis</strong> should be rejected.<br />
<strong>The</strong> Test Statistic<br />
• To decide to accept or reject the Null <strong>Hypothesis</strong><br />
(H 0 ) we will use the <strong>test</strong> statistic<br />
x − μ0 x − μ0<br />
z = = =<br />
σ σ<br />
x<br />
x − μ0<br />
n ≈<br />
σ<br />
x − μ0<br />
n<br />
s<br />
n<br />
• If H0 is true we should expect the <strong>test</strong> statistic z to<br />
be close to zero.<br />
• If H 0 is true we should expect the <strong>test</strong> statistic z to<br />
have a standard normal distribution.<br />
• If H A is true we should expect the <strong>test</strong> statistic z to<br />
be different from zero.<br />
<strong>The</strong> sampling distribution of z when H 0 is true:<br />
<strong>The</strong> Standard Normal distribution<br />
Reject H 0<br />
0 z<br />
Accept H 0<br />
Reject H 0<br />
P<br />
P<br />
Reject H 0<br />
α/2<br />
<strong>The</strong> Acceptance region:<br />
[ Accept H 0 when true]<br />
= P[<br />
− zα<br />
/ 2 ≤ z ≤ zα<br />
/ 2]<br />
= 1−<br />
α<br />
[ Reject H when true]<br />
P[<br />
z < −z<br />
or z > z ] = α<br />
0<br />
α/2<br />
0 z<br />
− zα<br />
/ 2 zα<br />
/ 2<br />
Accept H 0<br />
• Acceptance Region<br />
– Accept H0 if: − z ≤ z ≤ z<br />
Reject H 0<br />
= α / 2<br />
α / 2<br />
α / 2<br />
α / 2<br />
• Critical Region<br />
– Reject H0 if: z < −z<br />
z > z<br />
• With this Choice<br />
α / 2 or<br />
α / 2<br />
[ I Error]<br />
[ Reject when true]<br />
H P<br />
P =<br />
Type 0<br />
[ < − > ] = α z z z z<br />
= α / 2<br />
α / 2 or<br />
P<br />
Summary<br />
To <strong>test</strong> mean of a Normal population<br />
H0 : μ = μ0 (some specified value of μ)<br />
Against<br />
HA : μ ≠ μ0<br />
1. Decide on α = P[Type I Error] = the<br />
significance level of the <strong>test</strong> (usual choices<br />
0.05 or 0.01)<br />
7
2. Collect the data<br />
3. Compute the <strong>test</strong> statistic<br />
z =<br />
4. Make the Decision<br />
• Accept H0 if: − z ≤ z ≤ z<br />
• Reject H 0 if:<br />
x − μ0 x − μ<br />
n ≈ n<br />
σ s<br />
α / 2<br />
α / 2<br />
z < −z<br />
z > z<br />
0<br />
α / 2 or<br />
<strong>The</strong> one tailed <strong>test</strong><br />
α / 2<br />
To <strong>test</strong><br />
H0 : μ ≤ μ0<br />
(some specified value of μ)<br />
against<br />
HA : μ > μ0<br />
1. Use the <strong>test</strong> statistic<br />
z =<br />
x − μ0 x − μ<br />
n ≈ n<br />
σ s<br />
2. Use as the Acceptance and Critical Region<br />
• Accept H0 if: z ≤ zα<br />
/ 2<br />
• Reject H0 if: z > z<br />
Accept H 0<br />
0<br />
α / 2<br />
zα<br />
0<br />
α<br />
Reject H 0<br />
z<br />
<strong>The</strong> one tailed <strong>test</strong> – other direction<br />
To <strong>test</strong><br />
H0 : (some specified value of μ)<br />
against<br />
HA : 0 μ<br />
μ ≥ μ0<br />
μ <<br />
Acceptance and Critical Region<br />
• Accept H 0 if:<br />
• Reject H 0 if:<br />
Test Statistic<br />
α<br />
Reject H 0<br />
z =<br />
z ≥ −z<br />
z < −z<br />
α / 2<br />
α / 2<br />
x − μ0 x − μ<br />
n ≈ n<br />
σ s<br />
Expect z to be negative if H 0 is false<br />
Example:<br />
<strong>The</strong> Acceptance and Critical region:<br />
− zα<br />
Accept H 0<br />
We are interested in measuring the concentration of<br />
lead in water and we want to know if it exceeds the<br />
threshold level μ 0 = 10.0<br />
We take n = 40 one-litre samples measuring the<br />
concentration of lead.<br />
Statistical results:<br />
x<br />
= 12 . 1 and s = 1.<br />
2<br />
0<br />
0<br />
z<br />
8
Test Statistic<br />
z =<br />
=<br />
x − μ0 x − μ<br />
n ≈ n<br />
σ s<br />
12.<br />
1 −10.<br />
0<br />
40 = 11.<br />
07<br />
1.<br />
2<br />
Since z is greater than z 0.05 = 1.645 we conclude that<br />
the average lead level is significantly higher than<br />
10.0<br />
0<br />
9