English - DFDS.com
English - DFDS.com
English - DFDS.com

Create successful ePaper yourself
Turn your PDF publications into a flip-book with our unique Google optimized e-Paper software.
Annual Report<br />
2002
CONTENTS<br />
3 <strong>DFDS</strong> Group 2002<br />
4 Vision, Values, Strategy and Goals<br />
5 Key Figures <strong>DFDS</strong> Group<br />
6 Management’s Report<br />
10 The World Outside <strong>DFDS</strong><br />
12 <strong>DFDS</strong> Group Routes<br />
14 <strong>DFDS</strong> Seaways’ Report<br />
18 To delight people…<br />
20 <strong>DFDS</strong> Tor Line’s Report<br />
24 To delight industry…<br />
26 Risk Factors and the Environment<br />
28 Shareholder Information<br />
30 Financial Review 2002<br />
32 Statements<br />
33 Accounting policies<br />
39 In<strong>com</strong>e statement<br />
40 Balance sheet, assets<br />
41 Balance sheet, equity and liabilities<br />
42 Statement of changes in equity<br />
44 Cash flow statement<br />
45 Notes<br />
59 Group Companies<br />
60 Group Fleet<br />
62 Commercial Duties<br />
64 Corporate Governance at <strong>DFDS</strong><br />
66 Definitions and Glossary<br />
67 Addresses<br />
<strong>DFDS</strong> is a growing international shipping<br />
<strong>com</strong>pany with a leading market position in<br />
Northern Europe in overnight passenger<br />
shipping and freight liner shipping,<br />
primarily ro-ro liner shipping.
<strong>DFDS</strong> Group 2002<br />
Highlights of 2002<br />
March<br />
• The passenger ship KING OF SCANDINAVIA was sold for delivery in April 2002<br />
April<br />
• <strong>DFDS</strong> Tor Line ordered a fifth ro-ro newbuilding with delivery scheduled for<br />
December 2004<br />
July<br />
• <strong>DFDS</strong> Tor Line purchased two Polish ro-pax newbuildings<br />
• The passenger ship ADMIRAL OF SCANDINAVIA was sold for delivery in<br />
December 2002<br />
October<br />
• <strong>DFDS</strong> Seaways opened a new route to Poland: Copenhagen/Trelleborg-Gdansk<br />
• The ro-pax ship DANA GLORIA went into service on the Esbjerg-Harwich route<br />
• The ro-ro freight ship TOR CIMBRIA was sold and delivered<br />
November<br />
• <strong>DFDS</strong> announced its decision to enter into the Danish tonnage tax regime and<br />
reversed DKK 326 million of deferred tax<br />
• <strong>DFDS</strong> entered into a new freight agreement with <strong>DFDS</strong> Transport Group. At the<br />
same time, the final settlement entered into with DSV relating to the sale of <strong>DFDS</strong><br />
Dan Transport entailed extraordinary costs of DKK 116 million<br />
• Older freight ships were written down by DKK 150 million<br />
• The passenger route Cuxhaven-Harwich was suspended until April 2003<br />
December<br />
• <strong>DFDS</strong> Tor Line acquired Latlines, a Latvian ro-pax shipping operator<br />
• An agreement was entered into concerning acquisition of KST Shipping,<br />
a Norwegian agency business, effective 1 January 2003<br />
• The ro-ro freight vessels TOR FLANDRIA and TOR SCANDIA were sold and delivered<br />
Net profit for 2002<br />
• The profit for the year after tax and extraordinary items but before minority interests<br />
was DKK 200 million<br />
• Adjusted operating profit (EBITA) 1 increased by 53% to DKK 283 million<br />
Profit forecast 2003<br />
• <strong>DFDS</strong> expects a profit before tax, extraordinary items and minority interests of<br />
approximately DKK 140-160 million for 2003<br />
1) Adjusted for write-downs and profit/loss on the sale of ships, buildings and terminals.<br />
<strong>DFDS</strong> HIGHLIGHTS 3
4<br />
<strong>DFDS</strong> STRATEGY<br />
Vision, Values, Strategy and Goals<br />
<strong>DFDS</strong>’ vision<br />
“<strong>DFDS</strong> aims to expand its position as<br />
a leading passenger and freight liner<br />
shipping <strong>com</strong>pany in Northern Europe”<br />
“The return on invested capital<br />
should be increased to a level that is<br />
satisfactory to <strong>DFDS</strong>’ shareholders”<br />
<strong>DFDS</strong>’ values<br />
Openness · Proactiveness · Co-operation ·<br />
Ambition · Responsibility<br />
On a daily basis, our values mean that we must be open to<br />
new ideas and <strong>com</strong>municate with each other and the world<br />
around us. We must be proactive, anticipating and acting<br />
according to our customers’ requirements.<br />
We must be innovative and identify opportunities in our<br />
main business areas. We must co-operate to take full advantage<br />
of our <strong>com</strong>mon strengths. We must be ambitious, strive for<br />
growth and re-assess old ways of doing things. And we must<br />
be responsible so we do not lose sight of what we stand for.<br />
<strong>DFDS</strong>’ strategy<br />
The key elements of <strong>DFDS</strong> strategy are:<br />
• Focus on two main business areas: overnight passenger<br />
shipping and freight liner shipping primarily ro-ro liner shipping<br />
• Geographic focus: Northern Europe<br />
• <strong>DFDS</strong>’ market position: must continually be strengthened<br />
through organic growth, including opening new routes,<br />
<strong>com</strong>pany acquisitions and alliances<br />
• Customer concepts: ro-pax concepts can be introduced<br />
on passenger routes where a cruise-ferry concept is not<br />
sustainable and on certain freight routes. <strong>DFDS</strong> intends to<br />
supplement ro-ro liner shipping with lo-lo liner shipping in<br />
markets where the strategy offers advantages for customers<br />
as well as economic benefits<br />
• The <strong>DFDS</strong> fleet: the average age and ownership share<br />
must be reduced over time in order to increase productivity<br />
and flexibility and reduce the level of costs:<br />
– Passenger fleet: average age approx. 15 years,<br />
ownership share approx. 75%<br />
– Freight fleet: average age approx. 10 years,<br />
ownership share approx. 50%<br />
<strong>DFDS</strong>’ business areas<br />
<strong>DFDS</strong> has two main business areas: passenger shipping and<br />
freight liner shipping.<br />
The activities within passenger shipping are organized<br />
in <strong>DFDS</strong> Seaways, and the freight activities are organized in<br />
<strong>DFDS</strong> Tor Line.<br />
<strong>DFDS</strong> Group Management <strong>com</strong>prises the central staff<br />
functions and technical organization as well as the Executive<br />
Board.<br />
Financial goals<br />
It is <strong>DFDS</strong>’ short-term goal to achieve an average return on the<br />
book value of invested capital that as a minimum corresponds<br />
to <strong>DFDS</strong>’ estimated cost of capital of 6.9% after tax.<br />
In the longer term, it is <strong>DFDS</strong>’ clear ambition to achieve<br />
a level of return that exceeds the cost of capital.
Key Figures <strong>DFDS</strong> Group<br />
<strong>DFDS</strong> KEY FIGURES<br />
DKK mio. 2002 2002 2001 2000 1999 1998<br />
in EUR 1)<br />
In<strong>com</strong>e statement<br />
(adjusted for business activity sold in 2000)<br />
Revenue 4,870 656 4,309 4,358 4,127 3,731<br />
Operating profit (EBITA) 119 16 325 53 359 426<br />
Profit before financing (EBIT) 114 15 324 -30 345 416<br />
In<strong>com</strong>e statement and balance sheet<br />
(not adjusted for business acitivity sold in 2000)<br />
In<strong>com</strong>e statement<br />
Revenue 4,870 656 4,309 15,094 14,985 9,639<br />
Profit/loss on disposal of ships, buildings, and terminals -14 -2 166 18 0 0<br />
Operating profit before depreciation (EBITDA) 768 103 781 1,032 1,215 1,021<br />
Operating profit (EBITA) 119 16 325 329 636 572<br />
Profit before financing, etc; (EBIT) 114 15 324 184 549 549<br />
Financing, net -133 -18 -32 -141 -214 -89<br />
Profit before tax and extraordinary items -19 -3 291 47 335 419<br />
Profit before extraordinary items and minority interest 316 43 253 -14 200 294<br />
Extraordinary items after tax -116 -16 0 861 -27 0<br />
Profit for the year before minority interests 200 27 252 847 173 294<br />
Profit for analytical purposes 2) -4 -1 237 -7 248 282<br />
Adjusted operating profit 3) 283 38 184 413 636 572<br />
Balance sheet<br />
Fixed assets 5,497 740 5,279 3,831 8,207 4,811<br />
Current assets 1,385 187 1,558 3,845 3,917 2,092<br />
Total assets 6,882 927 6,837 7,676 12,124 6,903<br />
Equity 2,604 351 2,540 4,149 3,397 2,371<br />
Minority interests 146 20 140 2 26 10<br />
Provisions 189 25 511 504 739 569<br />
Long-term liabilities other than provisions 2,727 367 2,347 2,209 4,369 2,040<br />
Short-term liabilities other than provisions 1,216 164 1,299 812 3,593 1,913<br />
Total equity and liabilities 6,882 927 6,837 7,676 12,124 6,903<br />
Net interest bearing debt 2,515 339 2,268 -44 4,513 1,951<br />
Number of employees 4,070 - 4,187 3,464 12,134 7,641<br />
Cash flow<br />
Cash flows from operating activities 4) 832 112 688 1,174 861 983<br />
Cash flows from investing activities -496 -67 -1,839 3,643 -3,007 -1,278<br />
Net cash flow from operating and investing activities 336 45 -1,151 4,817 -2,146 -295<br />
Dividend 53 7 68 1,763 64 60<br />
Financial ratios, %<br />
Operating profit margin 2.4 - 7.5 2.2 4.2 5.9<br />
Return on invested capital (ROIC) 0.0 - 5.7 10.8 6.3 -<br />
Return on equity -0.2 - 6.9 -0.2 8.5 11.8<br />
Equity ratio 40.0 - 39.2 54.1 28.2 34.5<br />
Apart from the changes in the accounting treatment of derivative financial instruments, where only <strong>com</strong>parative figures at 31 December 2001 have been<br />
restated in accordance with the Danish accounting standard and by reference to IAS 39 key figures and financial ratios have been changed in accordance<br />
with the new accounting policies.<br />
1) Rate of exchange for EUR on 31 December 2002: 742.43<br />
2) Profit for analytical purposes is calculated by adjusting the profit for the year after minority interests for the effect of extraordinary items and adjustment of previous years’ taxes<br />
(including the reversal of deferred tax as a result of the transition to the tonnage taxation) in accordance with the re<strong>com</strong>mandations of the Danish Association of Financial Analysts.<br />
3) Adjusted for impairment and profit/losses on disposal of ships, buildings, and terminals.<br />
4) Cash flow from operating activities after tax, before financing and extraordinary items.<br />
5
6<br />
<strong>DFDS</strong> MANAGEMENT’S REPORT<br />
Management’s Report<br />
Financial performance 2002<br />
The profit for the year after tax and extraordinary items but<br />
before minority interests was DKK 200 million. The profit<br />
includes three special non-recurring items:<br />
1. A DKK 150 million write-down on older freight ships<br />
that have been put up for sale, as the market value<br />
has been assessed to be lower than the book value<br />
2. A reversal of DKK 326 million of deferred taxes<br />
as a result of <strong>DFDS</strong>’ decision to enter into the Danish<br />
tonnage tax regime<br />
3. Extraordinary costs of DKK 116 million relating to<br />
the final settlement with DSV on the sale of <strong>DFDS</strong> Dan<br />
Transport.<br />
After adjustment for write-downs on freight ships, <strong>DFDS</strong><br />
recorded a profit before tax of DKK 131 million, which is in line<br />
with the profit expectation of the annual report 2001 of a profit<br />
before adjustment for the write-down on freight vessels, tax<br />
and extraordinary items of approximately DKK 130 million.<br />
After adjustment for the write-down on freight vessels<br />
and profit/loss on the sale of ships, buildings and terminals the<br />
operating profit (EBITA) increased by 53% to DKK 283 million<br />
on the basis of improved profits in both <strong>DFDS</strong> Seaways and<br />
<strong>DFDS</strong> Tor Line.<br />
The report for the third quarter of 2002 included a<br />
profit forecast for 2002 of about DKK 175 million after tax and<br />
extraordinary items but before minority interests. The profit<br />
improvement of DKK 25 million in <strong>com</strong>parison with this forecast<br />
is due primarily to the changed assumptions for the calculation<br />
of tax in the in<strong>com</strong>e statement.<br />
Revenue rose by 13% to DKK 4,870 million primarily<br />
as a result of <strong>com</strong>pany acquisitions and the full-year effect of<br />
the capacity expansions carried out in the second half of 2001.<br />
Financial performance 4th quarter 2002<br />
After adjustment for profit/loss on the sale of ships, buildings<br />
and terminals operating profit (EBITA) for the fourth quarter<br />
rose from DKK 0 million in 2001 to DKK 36 million in 2002.<br />
The Danish tonnage tax regime<br />
<strong>DFDS</strong> decided to enter into the Danish tonnage tax regime with<br />
effect as of 1 January 2002. In this connection, <strong>DFDS</strong> reversed<br />
DKK 326 million of deferred tax related to ships registered in<br />
Denmark.<br />
Sale of <strong>DFDS</strong> Dan Transport<br />
The final price payable by DSV (De sammensluttede<br />
Vognmænd A/S) concerning the sale of <strong>DFDS</strong> Dan Transport<br />
was referred to arbitration by DSV in February 2002. As a<br />
result of the settlement subsequently entered into, the price<br />
was adjusted downwards by DKK 220 million. After the<br />
deduction of provisions made in <strong>DFDS</strong>, the settlement led to<br />
extraordinary costs for <strong>DFDS</strong> amounting to DKK 116 million in<br />
2002. The settlement had a negative cash flow effect in 2002<br />
of DKK 74 million.<br />
New freight agreement with <strong>DFDS</strong><br />
Transport Group<br />
Simultaneously with the settlement with DSV, a new three-year<br />
freight agreement was entered into with <strong>DFDS</strong> Transport Group<br />
for the period 2004-2006. The agreement will secure a significant<br />
portion of <strong>DFDS</strong> Tor Line’s freight volumes.<br />
Financial goal<br />
In 2000 <strong>DFDS</strong>’ calculated cost of capital was 8.25% after tax.<br />
In light of <strong>DFDS</strong>’ entry into the Danish tonnage tax regime,<br />
lower interest rates and changes in <strong>DFDS</strong>’ risk profile, the cost<br />
of capital (WACC) has been calculated at 6.9% after tax based<br />
on the book value of invested capital.<br />
It is <strong>DFDS</strong>’ short-term financial goal to achieve an<br />
average return on the book value of the invested capital that<br />
as a minimum corresponds to the estimated cost of capital. In<br />
the longer term, it is <strong>DFDS</strong>’ clear ambition to achieve a level<br />
of return that exceeds the cost of capital.
<strong>DFDS</strong>’ market position was expanded through<br />
<strong>com</strong>pany acquisitions in Norway and Latvia<br />
By meeting expectations for 2003, <strong>DFDS</strong> will narrow the gap<br />
between the profit forecast and an acceptable earnings level.<br />
In the following years, <strong>DFDS</strong> expects to narrow the gap further.<br />
This expectation is based on <strong>DFDS</strong>’ strategic focus on:<br />
• Continued strengthening and expansion of <strong>DFDS</strong>’ market<br />
position through organic growth, <strong>com</strong>pany acquisitions and<br />
alliances<br />
• A reduction in average age and ownership of the fleet in<br />
order to increase productivity and flexibility and lower the<br />
level of costs<br />
• Continuing adaptation of customer and business concepts<br />
that are not financially sustainable<br />
Strategic development<br />
Implementation of the shipping strategy announced in January<br />
2001 continued throughout 2002.<br />
Fleet flexibility increased in 2002 due to the reduction in<br />
the ownership share in <strong>DFDS</strong> Tor Line from 71% to 60%. The<br />
sale of older tonnage and the purchase of two newbuildings<br />
reduced the average age of the <strong>DFDS</strong> Seaways fleet by one year<br />
and the average age of the <strong>DFDS</strong> Tor Line fleet by six months.<br />
<strong>DFDS</strong> Tor Line’s market position in Northern Europe was<br />
strengthened through the acquisition of <strong>com</strong>panies in Norway<br />
and Latvia and growth in service and freight capacity in the<br />
North Sea.<br />
Furthermore, the Esbjerg-Harwich passenger route was<br />
converted into a ro-pax route. The change should be seen in<br />
light of the discontinuation of tax-free sales; the deregulation of<br />
air traffic, which changed market conditions for passenger liner<br />
shipping in some regions; and continued steady growth in the<br />
freight market.<br />
EBITA* 2002 PER DIVISION<br />
<strong>DFDS</strong> Tor Line<br />
DKK 192 mill.<br />
<strong>DFDS</strong> Seaways<br />
DKK 127 mill.<br />
* Adjusted for profit/loss on the sale of ships,<br />
buildings and terminals and write-downs.<br />
<strong>DFDS</strong> MANAGEMENT’S REPORT 7<br />
Routes and tonnage<br />
In 2002 several significant changes were made to <strong>DFDS</strong>’ route<br />
network and fleet <strong>com</strong>position.<br />
On 2 October 2002, <strong>DFDS</strong> Seaways opened a new<br />
route to Poland, Copenhagen/Trelleborg-Gdansk, operated by<br />
DUKE OF SCANDINAVIA (formerly DANA ANGLIA). Following<br />
the sale of the ship, the Cuxhaven-Harwich route was temporarily<br />
suspended in mid-November 2002. The route will re-open on<br />
11 April 2003 when a chartered Norwegian passenger ship will<br />
enter service on the route.<br />
In early October 2002, <strong>DFDS</strong> Tor Line took over <strong>DFDS</strong><br />
Seaways’ passenger route between Esbjerg and Harwich, which<br />
was converted into a ro-pax route with the entry into service of<br />
the ro-pax vessel DANA GLORIA. Passenger capacity was thus<br />
reduced and freight capacity increased.<br />
As part of <strong>DFDS</strong>’ fleet renewal strategy, three older<br />
freight vessels and two older passenger ships were sold in<br />
2002, and yet another older freight vessel was sold in January<br />
2003. Two newly built Polish ro-pax vessels (DANA GLORIA,<br />
DANA SIRENA) were purchased and a fifth ro-ro newbuilding<br />
ordered from Flensburg Shipyard.<br />
Company acquisitions<br />
In December 2001, <strong>DFDS</strong> Tor Line A/S entered into an agreement<br />
with Lys-Line AS concerning the purchase of a 66%<br />
shareholding in Lys-Line Rederi AS, with effect from 1 January<br />
2002. The <strong>com</strong>pany name was subsequently changed to <strong>DFDS</strong><br />
Lys-Line Rederi AS.<br />
Effective 1 December 2002, <strong>DFDS</strong> Tor Line A/S acquired<br />
100% of the share capital of the Latvian <strong>com</strong>pany Latlines<br />
SIA, which operates a ro-pax route between Riga, Latvia, and<br />
Lübeck, Germany. A chartered ro-pax vessel currently services<br />
the route and the intention is to merge the Latlines route with<br />
<strong>DFDS</strong> Tor Line’s ro-pax route between Riga and Kiel.<br />
Effective 1 January 2003, <strong>DFDS</strong> Tor Line AS in Norway<br />
entered into an agreement with KST Holding AS on the acquisition<br />
of 100% of the share capital of KST Shipping AS, whose<br />
business areas are liner agency activities, shipping logistics<br />
and terminal operations. In conjunction with the acquisition,<br />
certain activities of <strong>DFDS</strong> Tor Line AS and KST Shipping AS<br />
will be integrated, and this is expected to improve overall<br />
operational efficiency.<br />
In 2002, <strong>DFDS</strong> Tor Line A/S increased its ownership<br />
share in AB LISCO Baltic Service from 76.66% to 86.55%.
8<br />
<strong>DFDS</strong> MANAGEMENT’S REPORT<br />
<strong>DFDS</strong> will move to new headquarters<br />
in 2003<br />
The construction of <strong>DFDS</strong>’ new headquarters in Kalkbrænderihavnen<br />
is going ahead as planned, and <strong>DFDS</strong> expects to move<br />
in at the end of August 2003.<br />
<strong>DFDS</strong> and human resources<br />
The average number of employees was 4,070 in 2002, 3%<br />
fewer than in 2001. The reduction in staff numbers was due<br />
primarily to the sale of ships.<br />
In 2002, <strong>DFDS</strong> implemented several major projects<br />
that made special demands on employees. The most ambitious<br />
project was the acquisition of two newly built ro-pax ships and<br />
the start of a new ro-pax route concept incorporating <strong>DFDS</strong>’<br />
overall <strong>com</strong>petencies in both freight and passenger operations.<br />
The rebuilding of the ships and the implementation of the new<br />
route <strong>com</strong>petence were carried out as planned, based on the<br />
ability of <strong>DFDS</strong> employees to work together as teams with a<br />
<strong>com</strong>mon understanding of the overall goal.<br />
<strong>DFDS</strong> is a service business, and a key service parameter<br />
is the ability of employees to identify individual customer<br />
needs and adapt <strong>DFDS</strong>’ products and services accordingly. In<br />
the course of the year, a number of activities and courses were<br />
held for managers and employees at the very end of the service<br />
chain whose jobs entail a high degree of customer contact.<br />
The organizational adjustments initiated in <strong>DFDS</strong><br />
Group Management in 2001 to support and anchor corporate<br />
unity continued in 2002 with the integration of <strong>DFDS</strong>’ IT<br />
functions and the integration of human resource functions for<br />
sea- and land-based personnel. At the end of 2002, the decision<br />
was made to implement a <strong>com</strong>mon finance system throughout<br />
the Group. The system is expected to be fully implemented<br />
during the first six months of 2003.<br />
The ongoing organizational adaptation makes large<br />
and occasionally extraordinary demands on staff and managers<br />
alike. Restructuring initiatives, and the ac<strong>com</strong>panying new work<br />
and business routines, have be<strong>com</strong>e part of everyday life at<br />
<strong>DFDS</strong> and necessitate a greater exchange of knowledge and<br />
information and more openness on a daily basis. <strong>DFDS</strong>’ five<br />
core values are an important tool for this process.<br />
<strong>DFDS</strong> expects a profit before tax<br />
of approximately DKK 140-160 million<br />
in 2003<br />
Safety<br />
The <strong>DFDS</strong> fleet <strong>com</strong>plies with all international conventions<br />
and national legislation concerning safety and the protection<br />
of the marine environment. All <strong>DFDS</strong> vessels are certified in<br />
accordance with the ISM code (International Safety Management),<br />
and safety management systems are continually being<br />
further developed.<br />
In <strong>com</strong>pliance with new international requirements<br />
concerning the installation of a Voyage Data Recorder (‘black<br />
box’) on passenger ships, <strong>DFDS</strong> installed the first system in<br />
its fleet in December 2002. All passenger vessels had Voyage<br />
Data Recorders installed by the end of January 2003.<br />
Before going into service as a <strong>com</strong>bined passenger<br />
and freight ship, the ro-pax vessel the DANA GLORIA was fitted<br />
with transverse doors on the main deck in <strong>com</strong>pliance with the<br />
stability requirements of the Stockholm Agreement. Several<br />
other safety measures were implemented, particularly on the<br />
passenger side.<br />
New safety requirements for full sprinkler protection of<br />
passenger ships were issued in 2002, and the upgrading of the<br />
passenger fleet started in January 2003 on board the CROWN<br />
OF SCANDINAVIA. Several other minor safety improvement<br />
projects were also implemented in the course of 2002.<br />
<strong>DFDS</strong>’ goal is to maintain excellent safety standards,<br />
including the <strong>com</strong>mitment of employees to a corporate safety<br />
culture. <strong>DFDS</strong>’ safety initiatives are constantly developed and<br />
verified by national authorities and classification societies.
Organizational changes<br />
Peder Gellert Pedersen was appointed Vice Director of <strong>DFDS</strong><br />
Tor Line in July 2002, and Jes Mikkel Svare was appointed<br />
Deputy Director of <strong>DFDS</strong> Seaways in September. Bertil Hohlmann<br />
was appointed Personnel Manager of <strong>DFDS</strong> in November, and<br />
Gert Møller was appointed IT Director of <strong>DFDS</strong> in August. Leif<br />
C. Mikkelsen resigned from his position as Communications<br />
and Human Resources Director in October 2002.<br />
With effect from 1 January 2003 it is planned to merge<br />
the legal entities <strong>DFDS</strong> Seaways A/S, <strong>DFDS</strong> Tor Line A/S and<br />
<strong>DFDS</strong> A/S with <strong>DFDS</strong> A/S as the continuing <strong>com</strong>pany. The purpose<br />
of the simplification of the legal structure is to reduce<br />
administration costs and improve the efficiency of <strong>DFDS</strong>’<br />
organization.<br />
Profit forecast 2003<br />
The profit forecast for 2003 is conditional on oil prices and<br />
exchange rates of particular importance to <strong>DFDS</strong> (SEK, USD,<br />
NOK, GBP, EUR) remaining at the same level as at the beginning<br />
of March 2003.<br />
<strong>DFDS</strong> expects to achieve a somewhat higher level of<br />
<strong>DFDS</strong> MANAGEMENT’S REPORT 9<br />
activity in 2003 than in 2002 corresponding to an increase<br />
of approximately 5% in revenue, primarily as a result of the<br />
expansion of capacity by <strong>DFDS</strong> Tor Line. <strong>DFDS</strong> Seaways<br />
expects to record only a slightly higher level of activity in 2003<br />
than in 2002.<br />
Investments in freight and ro-pax vessels are expected<br />
to amount to roughly DKK 700 million and will <strong>com</strong>prise delivery<br />
of the first ro-ro newbuilding, work in progress on the other<br />
ro-ro newbuildings, and the conversion of the ro-pax vessel the<br />
DANA SIRENA. The investment level is otherwise expected to<br />
be low, apart from any <strong>com</strong>pany acquisitions.<br />
On account of the unresolved situation concerning Iraq,<br />
the level of uncertainty concerning the profit expectation is<br />
higher than normal.<br />
<strong>DFDS</strong> expects a profit before tax, extraordinary items<br />
and minority interests of approximately DKK 140-160 million<br />
for 2003.<br />
REVENUE* PER DIVISION<br />
DKK mill.<br />
98 99 00 01 02<br />
<strong>DFDS</strong> Seaways<br />
<strong>DFDS</strong> Tor Line<br />
* Revenue is adjusted for<br />
discontinued operations.<br />
5,000<br />
4,000<br />
3,000<br />
2,000<br />
1,000<br />
0
10<br />
<strong>DFDS</strong> THE WORLD OUTSIDE <strong>DFDS</strong><br />
The World Outside <strong>DFDS</strong><br />
Road tax in Germany<br />
With effect from 1 September 2003, Germany will be introducing<br />
a road tax on lorries using the German motorways. The tax is<br />
designed as a fee of EUR 0.10-0.17 per driven kilometre and<br />
will be differentiated according to the size of the vehicle and<br />
Euro norms. In a few years, the plan is to further differentiate<br />
the fee through the addition of a congestion charge that also<br />
takes time of day and location into account.<br />
It is estimated that the road tax will lead to price<br />
increases for customers ranging from 5% to 16% depending<br />
on method of transport.<br />
The purpose of the tax is to reduce the growth anticipated<br />
in road transport, promote intermodal transport solutions<br />
– road and rail transport, for example – and encourage better<br />
transport planning in order to improve capacity utilization of the<br />
various transport systems.<br />
Road tax for lorries are expected to be introduced<br />
in Austria and the Netherlands in 2004, and the UK expects<br />
to introduce similar charges in 2006. A Swedish government<br />
<strong>com</strong>mission is due to submit a report on road pricing in 2004,<br />
and several other European countries are preparing similar<br />
reports.<br />
The road tax will make road transport relatively more<br />
expensive than sea and rail transport and, all else being equal,<br />
is expected to have a positive impact on <strong>DFDS</strong>’ level of activity.<br />
The full effect of the shift in traffic flows as a result of the<br />
German road tax will be registered in 2004.<br />
The EU enlargement towards the East<br />
The imminent enlargement of the EU towards the East is<br />
expected to help boost trade with the candidate countries.<br />
The admission of the Baltic nations and Poland in particular<br />
may have a long-term effect on <strong>DFDS</strong>’ level of activity. These<br />
countries act additionally as transit countries for traffic flows<br />
to and from Russia and Central European countries.<br />
Tonnage development<br />
The size of the ro-ro freight vessels ordered in recent years<br />
has been increasing. Most new vessels ordered have a capacity<br />
of 2,500-3,000 lane metres and a faster sailing speed, 22 to<br />
25 knots. Each with a capacity of about 4,000 lane metres,<br />
<strong>DFDS</strong>’ ro-ro newbuildings from Flensburg Shipyard are thus<br />
the largest short-sea ro-ro freight ships contracted for in recent<br />
years. A <strong>com</strong>bination of factors are driving this trend: growing<br />
freight volumes that require greater capacity coupled with relatively<br />
small rises in transport prices due to intense <strong>com</strong>petitive<br />
pressure generally. In order to improve earnings, the cost per<br />
transported unit must therefore be reduced, and this can be<br />
achieved by increasing vessel capacity and speed. At the same<br />
time, technological advances mean the cost of running the<br />
ships can gradually be reduced.<br />
A number of smaller ro-ro ships have been phased out<br />
lately, but there will still be a demand for ro-ro vessels of smaller<br />
capacity to service routes handling limited volumes or routes<br />
requiring a high sailing frequency.<br />
As regards passenger activities, in the last few years<br />
<strong>DFDS</strong> has ordered several ro-pax newbuildings that <strong>com</strong>bine
German road tax will add to the cost of<br />
road transport, to the advantage of sea transport<br />
passenger and freight transport to a greater degree than<br />
conventional cruise-ferry ships. The discontinuation of tax-free<br />
sales in the EU and the wide range of low-cost air travel options<br />
are part of the explanation for the emergence of this type of<br />
vessel. However, large cruise-ferry liners continue to be ordered<br />
for use in the Baltic and North Sea areas.<br />
EU’s Marco Polo programme and<br />
the harbour directive<br />
In 2002, the EU initiated its Marco Polo programme with an<br />
annual budget of EUR 30 million. The purpose is to transfer<br />
freight from road networks to more environmentally friendly<br />
forms of transport such as sea transport. The programme will<br />
support the start-up phases of <strong>com</strong>mercially viable projects<br />
intended to direct freight transport away from roads. In addition,<br />
the programme will support improvements to intermodal methods<br />
of transport and disseminate best practices throughout the<br />
transport sector. At the core of the programme is the vision<br />
to create ‘highways of the sea’ to help eliminate bottlenecks<br />
in the road networks of the EU.<br />
Likewise in 2002, the EU Commission issued a draft<br />
directive on market access to port services. The purpose of<br />
the directive is to remove the restrictions on port access for<br />
providers of port services and on the possibilities for shipping<br />
<strong>com</strong>panies to perform port services independently. Other aims<br />
include enhancing the quality of port services, increasing<br />
flexibility and efficiency and lowering costs. The directive thus<br />
underpins the EU’s wish to promote the shift of freight transport<br />
from road to sea.<br />
TRANSPORT OF<br />
GOODS IN EU PER<br />
TRANSPORT MODE<br />
Short-sea shipping 41%<br />
Rail 8%<br />
Inland<br />
waterways 4%<br />
Road 44%<br />
Source: EU Commision, White Paper,<br />
European Transport Policy for 2010,<br />
September 2001.<br />
Other 3%<br />
<strong>DFDS</strong> THE WORLD OUTSIDE <strong>DFDS</strong> 11<br />
Introduction of Danish tonnage<br />
tax regime<br />
The Danish Parliament passed legislation concerning a Danish<br />
tonnage tax regime in May 2002, which in <strong>DFDS</strong>’ opinion will<br />
improve <strong>com</strong>petitive conditions for Danish shipping operators<br />
and thus make a positive contribution to the future development<br />
of the shipping industry in Denmark.<br />
Market trends<br />
The Northern European market for international ro-ro-based<br />
passenger and freight shipping traffic can generally be divided<br />
into five market regions: the Baltic Sea, Kattegat/Skagerrak,<br />
the North Sea, the <strong>English</strong> Channel, and the Irish Sea.<br />
Certain changes were made to the structure of the<br />
passenger route network in the North Sea and the <strong>English</strong><br />
Channel, primarily as a result of altered market conditions<br />
following the discontinuation of tax-free sales. On the other<br />
hand, new ro-pax routes were opened in the Baltic Sea and<br />
the North Sea, partly by the entry of a passenger <strong>com</strong>pany<br />
from the Mediterranean region.<br />
In 2002, a limited consolidation of the Northern<br />
European market was carried out, particularly in freight activities.<br />
Ongoing market consolidation is expected to continue in the<br />
future.
12<br />
<strong>DFDS</strong> ROUTEMAP<br />
<strong>DFDS</strong> Group Routes<br />
Newcastle<br />
Immingham<br />
Harwich<br />
Ghent<br />
Rotterdam<br />
Kristiansand<br />
Cuxhaven<br />
Bremerhaven<br />
Amsterdam (IJmuiden)<br />
Brevik<br />
Esbjerg<br />
Hamburg
Oslo<br />
Moss<br />
Fredericia<br />
Kiel<br />
Lübeck<br />
Fredrikstad<br />
Gothenburg<br />
Copenhagen<br />
Helsingborg<br />
Mukran<br />
Trelleborg<br />
Karlshamn<br />
Gdansk<br />
Klaipeda<br />
<strong>DFDS</strong> ROUTEMAP 13<br />
Riga<br />
<strong>DFDS</strong> Tor Line<br />
<strong>DFDS</strong> Seaways
14<br />
<strong>DFDS</strong> SEAWAYS’ REPORT<br />
<strong>DFDS</strong> Seaways’ Report<br />
<strong>DFDS</strong> Seaways operates overnight<br />
passenger shipping in Northern Europe<br />
based on a city-to-city cruise concept.<br />
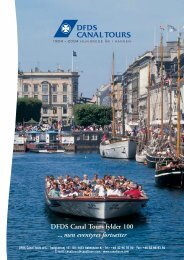
In addition, <strong>DFDS</strong> Seaways operates canal<br />
excursions in the port of Copenhagen<br />
(<strong>DFDS</strong> Canal Tours).
Financial performance 2002<br />
Revenue rose by 7% to DKK 2,267 million. This increase<br />
reflects the full-year effect of the expansion of capacity on the<br />
Copenhagen/Helsingborg-Oslo and Amsterdam-Newcastle routes<br />
implemented at the beginning of the third quarter of 2001 and<br />
the opening of a new route to Poland in early October 2002.<br />
On 1 October 2002, the Esbjerg-Harwich route was converted<br />
into a ro-pax route and transferred to <strong>DFDS</strong> Tor Line. The<br />
Cuxhaven-Harwich route was temporarily suspended from<br />
17 November 2002 until April 2003. Both these factors caused<br />
a decline in revenue <strong>com</strong>pared with 2001.<br />
Operating profit (EBITA) increased by 71% to DKK 128<br />
million, and the significant improvement in operating profit<br />
(EBITA) forecast for 2002 was thus achieved.<br />
The operating profit (EBITA) for 2002 includes a total<br />
loss from the sale of ships, buildings and terminals of DKK<br />
1 million. In 2001, the operating profit (EBITA) contained a<br />
write-down of a passenger ship to market value of DKK 25<br />
million. After adjustment for these items, the operating profit<br />
(EBITA) for 2001 was DKK 100 million and DKK 127 million<br />
for 2002, an increase of 27%.<br />
The favourable performance development is attributable<br />
partly to the capacity expansion implemented at the end of<br />
June 2001 and partly to profit improvements on the routes and<br />
activities that were affected by the outbreak of foot-and-mouth<br />
disease in 2001. Counteracting this effect, the Copenhagen/<br />
Trelleborg-Gdansk route recorded a negative operating profit<br />
for 2002, which was expected.<br />
The number of dockings was higher in 2002 than in 2001,<br />
leading to additional costs of approximately DKK 10 million.<br />
There was an increase in depreciation of DKK 10 million<br />
<strong>com</strong>pared with 2001 as a result of the new Danish Financial<br />
Statements Act and changed accounting estimates for ships.<br />
Furthermore, the addition of PEARL OF SCANDINAVIA in late<br />
June 2001 triggered a considerable increase in depreciation.<br />
Average invested capital increased by 2% to DKK 2,124<br />
million as a result of the full-year effect of the investment in<br />
PEARL OF SCANDINAVIA. Return on invested capital (ROIC)<br />
increased in 2002 to 5.0%.<br />
<strong>DFDS</strong> SEAWAYS’ REPORT 15<br />
Financial performance 4th quarter 2002<br />
After adjustment for profit/loss on the sale of ships, buildings<br />
and terminals and write-downs, the operating profit (EBITA) for<br />
the fourth quarter improved from DKK -22 million in 2001 to<br />
DKK -7 million in 2002.<br />
Passenger and market development<br />
The number of passengers increased by 4.9% to 1,893,600,<br />
and the number of cars transported rose by 10.4% to 253,200,<br />
while there was a 3.1% reduction in the number of departures.<br />
The normalization of market conditions in Great Britain<br />
had a positive impact on the market although demand from<br />
the European transport and holiday customer segments was<br />
slightly below the level expected for the second and third<br />
quarters. The Norwegian market fully met expectations in 2002,<br />
and enjoyed the favourable effect of increases in the exchange<br />
rate of the Norwegian krone. The Danish and in particular the<br />
Swedish markets were characterised by a slightly lower level of<br />
activity than expected for the holiday and conference customer<br />
segments, especially in the fourth quarter.<br />
Performance by activity<br />
Several significant changes were made to the route network<br />
during the year, and 2002 was also the first full year of operations<br />
after the capacity expansions implemented in 2001.<br />
A new route to Poland, Copenhagen/Trelleborg-<br />
Gdansk, was opened on 2 October 2002. The original plan<br />
was to open the route in April 2002 with <strong>DFDS</strong> Seaways’ oldest<br />
passenger ship, KING OF SCANDINAVIA. However, an opportunity<br />
arose in March 2002 to sell the vessel in accordance with<br />
<strong>DFDS</strong>’ fleet strategy. The opening of the route was therefore<br />
2001 2002<br />
DKK million Q1 Q2 Q3 Q4 Year total Q1 Q2 Q3 Q4 Year total<br />
Revenue 343 516 730 520 2,109 427 591 754 495 2,267<br />
Operating profit (EBITA) -123 53 192 -47 75 -131 81 199 -21 128<br />
Operating profit margin, % -35.9 10.3 26.3 -9.0 3.6 -30.7 13.7 26.4 -4.2 5.6<br />
Invested capital<br />
Return on invested capital<br />
1,838 2,079 2,208 2,301 2,088 2,259 2.147 2,071 1,991 2,124<br />
(ROIC) p.a., % -27.3 10.1 31.1 -3.5 3.8 -23.1 16.8 30.9 -2.9 5.0<br />
Passengers, ‘000 325 440 602 439 1,806 374 471 624 425 1,894
16<br />
<strong>DFDS</strong> SEAWAYS’ REPORT<br />
postponed to October 2002, when the DUKE OF SCANDINAVIA<br />
(formerly DANA ANGLIA), which had operated the Esbjerg-<br />
Harwich route until that date, went into service on the new route.<br />
This tonnage rotation allowed a ro-pax concept to be<br />
introduced on the Esbjerg-Harwich route, reducing passenger<br />
capacity on the route and increasing freight capacity. On<br />
3 October 2002 it opened as a ro-pax route served by DANA<br />
GLORIA, and <strong>DFDS</strong> Tor Line took over route operation.<br />
In March 2002 the German port of call for the Hamborg-<br />
Harwich route was changed to Cuxhaven in order to reduce<br />
sailing time and make the route more attractive for passengers<br />
travelling in their own car as well as strengthening the freight<br />
cooperation with <strong>DFDS</strong> Tor Line, which already uses Cuxhaven.<br />
The Copenhagen/Helsingborg-Oslo route was served by<br />
PEARL OF SCANDINAVIA and CROWN OF SCANDINAVIA.<br />
The route recorded a satisfactory increase in passenger numbers<br />
in 2002 despite a slightly lower level of activity on the Danish<br />
and Swedish markets than expected for the second half year.<br />
The Amsterdam-Newcastle route was served by<br />
QUEEN OF SCANDINAVIA and PRINCE OF SCANDINAVIA.<br />
2002 was the first year in which the route carried more than<br />
500,000 passengers, and it achieved a positive profit development.<br />
However, the average on-board consumption per<br />
passenger remained at a relatively low level.<br />
The Gothenburg-Kristiansand-Newcastle route was<br />
served by PRINCESS OF SCANDINAVIA. On 17 May 2002,<br />
fire broke out in the ship’s engine room and was extinguished<br />
by the ship’s own crew. The ship re-entered service on the<br />
route on 16 June 2002. Despite the fire, the route recorded a<br />
favour-able profit trend in 2002, which should also be viewed<br />
in light of the outbreak of foot-and-mouth disease in 2001.<br />
2002 was the first year in which the<br />
Amsterdam-Newcastle route carried<br />
more than 500,000 passengers<br />
The Cuxhaven-Harwich route was served by ADMIRAL OF<br />
SCANDINAVIA until November 2002, when it was suspended<br />
until 11 April 2003. The route achieved a satisfactory increase<br />
in the number of passengers due to the change of German port<br />
of call to Cuxhaven.<br />
The Copenhagen/Trelleborg-Gdansk route was served<br />
by DUKE OF SCANDINAVIA. The number of passengers in the<br />
fourth quarter of 2002 was slightly higher than expected, while<br />
the number of freight units handled was somewhat lower than<br />
the expectation.<br />
In March 2002, <strong>DFDS</strong> sold its passenger terminal in<br />
Esbjerg, with delivery at the end of 2002. The purpose of the<br />
sale was to rationalize <strong>DFDS</strong>’ activities in Esbjerg and to gain<br />
the benefits deriving from closer integration of passenger and<br />
freight activities.<br />
In 2002, <strong>DFDS</strong> Canal Tours recorded a satisfactory<br />
operating profit (EBITA) based on a 5% increase in passengers.<br />
The <strong>com</strong>pany took delivery of a new open boat in May 2002.<br />
Tonnage<br />
<strong>DFDS</strong> Seaways’ oldest passenger vessel, KING OF<br />
SCANDINAVIA, was sold in March 2002 at a small profit.<br />
ADMIRAL OF SCANDINAVIA was sold in July 2002<br />
and delivered in November 2002. The sale generated a loss<br />
of DKK 17 million and led to the suspension of the Cuxhaven-<br />
Harwich route until 11 April 2003, when a chartered Norwegian<br />
vessel, BERGEN, will start servicing the route. BERGEN, to be<br />
renamed DUCHESS OF SCANDINAVIA, has a total passenger<br />
capacity of 840 plus space for 120 passenger cars and a trailer<br />
deck of 650 lane metres.<br />
The sale of these ships reduced the average age of<br />
the fleet in 2002 from 21 to 20 years. The chartering of<br />
BERGEN will reduce the ownership share of 100% in 2002<br />
to 86% in 2003. <strong>DFDS</strong> Seaways’ strategic goals for average<br />
fleet age and fleet ownership share are respectively 15 years<br />
and 75%.
Marketing and distribution<br />
The prime focus of <strong>DFDS</strong> Seaways’ marketing is large destinations,<br />
the pleasure of sailing, and the wealth of recreational<br />
options on board ship. The annual marketing costs of approximately<br />
DKK 150 million cover short-term targeted marketing<br />
campaigns and the underpinning of a strong brand.<br />
About two-thirds of <strong>DFDS</strong> Seaways’ travel sales are<br />
handled by own sales subsidiaries while the remainder is sold<br />
by travel agencies. Online internet booking options are now<br />
available on all markets, and the number of internet bookings<br />
doubled in 2002. The internet booking system will be expanded<br />
in future to include travel agencies and full product programme<br />
so that in the years to <strong>com</strong>e a significant number of travel<br />
bookings will be transacted over the internet.<br />
Profit forecast 2003<br />
Given that the Esbjerg-Harwich route has been transferred to<br />
<strong>DFDS</strong> Tor Line and that the Cuxhaven-Harwich route will not<br />
open until April 2003, <strong>DFDS</strong> Seaways expects only a marginally<br />
higher level of activity in 2003 than in 2002. The route changes<br />
will be offset by the full-year effect of the newly opened route<br />
to Poland.<br />
The investment level in 2003 is expected to be low.<br />
<strong>DFDS</strong> Seaways expects to achieve a slightly higher<br />
operating profit (EBITA) in 2003 than in 2002.<br />
Copenhagen/<br />
Helsingborg-Oslo 43%<br />
PASSENGER<br />
DISTRIBUTION PER ROUTE<br />
Cuxhaven-Harwich 9%<br />
Copenhagen/<br />
Trelleborg-Gdansk 2%<br />
Amsterdam-<br />
Newcastle 27%<br />
Esbjerg-<br />
Harwich 7%<br />
Gothenburg-Kristiansand-<br />
Newcastle 12%<br />
<strong>DFDS</strong> SEAWAYS’ REPORT 17<br />
Vision<br />
It is <strong>DFDS</strong> Seaways’ vision to be a leading cruise ferry<br />
<strong>com</strong>pany on the market for overnight routes in Northern<br />
Europe.<br />
Mission<br />
To delight people with exciting maritime experiences and<br />
attractive destinations.<br />
Product concepts and target<br />
customer groups<br />
Transport<br />
Transport products that offer passengers the opportunity<br />
to take their own car on trips that are typically visits to<br />
family and friends, business trips and individual holiday<br />
packages.<br />
Holiday<br />
Holiday products are package trips organized by <strong>DFDS</strong><br />
Seaways targeted at families and couples travelling in<br />
their own car.<br />
Mini Cruise<br />
Mini Cruise products are trips where passengers travel<br />
on the same ship on the outbound and return journeys.<br />
The cruise typically includes two nights on board, and<br />
the focus is the maritime experiences, the host of facilities<br />
on board ship and land-based activities at an attractive<br />
destination. The target customer group is a broad mix of<br />
couples, groups of friends of all ages and, in the holiday<br />
season, families with children. The concept also offers the<br />
opportunity to hold sizeable parties on board.<br />
Conferences<br />
The conference product <strong>com</strong>prises meeting and conference<br />
activities on board, which may take place en route as well<br />
as while the ship is in port. The target customer groups<br />
are <strong>com</strong>panies, organizations and course organizers.
18<br />
<strong>DFDS</strong> THEME<br />
To delight people…<br />
with exciting maritime experiences and attractive<br />
destinations – that is <strong>DFDS</strong> Seaways’ mission.<br />
Every year, almost two million passengers travel with <strong>DFDS</strong><br />
Seaways – the equivalent of more than 5,000 people a day.<br />
Just over 2,000 of them choose the Copenhagen/Helsingborg-<br />
Oslo route, <strong>DFDS</strong> Seaways’ main route.<br />
Eight different product concepts are offered on the<br />
Danish market for travel to Norway catering for the wide variety of<br />
individual customer tastes and expectations of <strong>DFDS</strong> Seaways.<br />
<strong>DFDS</strong> Seaways’ Cruise concept meets a diversity of<br />
passenger needs, and the ships offer a host of recreational and<br />
leisure activities. There is something for everyone, whatever<br />
their preference. À la carte restaurants for discerning diners.<br />
Cafés for those who prefer a quick snack. Discoteques for party<br />
animals eager to dance the night away. Peaceful cabins for<br />
travellers who want an early night. The opportunity for<br />
businessmen to get to know their colleagues and customers<br />
better in an informal atmosphere. Poolside fun for families with<br />
kids. The choice is yours when you travel with <strong>DFDS</strong> Seaways!<br />
Once in Norway, some passengers continue on a<br />
skiing holiday organized by <strong>DFDS</strong> Seaways. Some visit family<br />
and friends in Norway, and being able to take their own car is<br />
a wel<strong>com</strong>e convenience. Other passengers travel to Norway to<br />
sample the Oslo capital for a few hours before returning home.<br />
Business customers can continue their meetings in Oslo, or<br />
select a land-based tour.<br />
Onboard activities are adapted throughout the year<br />
to match the changing seasons and the variety of customer<br />
groups who choose to travel with <strong>DFDS</strong> Seaways.
Mini Cruises, Groups, Conferences,<br />
City-to-City Breaks, Skiing holidays, Transport options<br />
with and without car, International tourists<br />
River rafting, bike cruise, mountain biking,<br />
curling, go-cart tracks, snowboarding,<br />
cross-country skiing, alpine skiing,<br />
sleigh rides, sledge rides, ice skating,<br />
Holmenkollen, angling, cottage holidays,<br />
hiking, walking, Tusindfryd, Bygdøy,<br />
Hadeland glassworks, Blåfarve works,<br />
Kongsberg silvermines, Frilandsmuseet,<br />
Vigelandsparken, Kontiki Museum,<br />
Viking ship museum<br />
<strong>DFDS</strong> THEME 19
20<br />
<strong>DFDS</strong> TOR LINE’S REPORT<br />
<strong>DFDS</strong> Tor Line’s Report<br />
<strong>DFDS</strong> Tor Line operates freight liner<br />
shipping, primarily ro-ro liner shipping,<br />
based on frequent sailings between<br />
North European transport and industrial<br />
centres. The activities <strong>com</strong>prise sea<br />
transport and terminal activities<br />
(gate-to-gate concept) and are an effective<br />
part of the customers’ transport chain.
Financial performance 2002<br />
Revenue increased by 18% to DKK 2,642 million. The increase<br />
in revenue reflects the acquisition of <strong>DFDS</strong> Lys-Line Rederi on<br />
1 January 2002 and the full-year effect of the addition of LISCO<br />
Baltic Service acquired on 27 June 2001. Revenue for the other<br />
activities also rose in 2002, although the NorBridge revenue<br />
was considerably lower than in 2001 due to the restructuring<br />
measures implemented in the second half of 2001.<br />
Operating profit (EBITA) was DKK 32 million including<br />
the write-down of older freight vessels amounting to DKK 150<br />
million. Excluding the write-down and profit/loss on the sale of<br />
ships, buildings and terminals the operating profit (EBITA) rose<br />
by 67% from DKK 115 million in 2001 to DKK 192 million in<br />
2002. The profit improvement for the year was thus somewhat<br />
higher than <strong>DFDS</strong> Tor Line’s profit forecast of a somewhat<br />
better operating profit (EBITA) in 2002.<br />
The profit improvement by <strong>DFDS</strong> Tor Line was<br />
obtained partly by the addition of <strong>DFDS</strong> Lys-Line Rederi at the<br />
start of 2002. Other contributory factors were the satisfactory<br />
reorganization of NorBridge and an improvement in the operating<br />
profit for EuroBridge, although this is still unsatisfactory. The<br />
operating profit (EBITA) was negatively affected in 2002 by the<br />
high level of costs of the Esbjerg terminal and the opening of<br />
new routes.<br />
Average invested capital increased by 20% to DKK<br />
3,624 million as a result of <strong>com</strong>pany acquisitions and investments<br />
in ships. Return on invested capital (ROIC) was reduced<br />
from 5.8% in 2001 to 1.1% in 2002, primarily due to the<br />
write-down.<br />
Financial performance 4th quarter 2002<br />
After adjustment for profit/loss on the sale of ships, terminals<br />
and buildings, the operating profit (EBITA) for the fourth quarter<br />
increased from DKK 31 million in 2001 to DKK 56 million in 2002.<br />
Market development<br />
<strong>DFDS</strong> Tor Line’s primary market focus is the Baltic and the<br />
North Sea. The level of activity in the Baltic region was higher<br />
than expected, but was affected by increasing <strong>com</strong>petition with<br />
new players gaining presence. Towards the end of the year, the<br />
market was negatively influenced by the tense political situation<br />
between Denmark and Russia. The activity level in the North<br />
Sea rose, and in the course of the year, <strong>DFDS</strong> Tor Line and<br />
other players increased capacity in the region. The high<br />
exchange rate for the British pound continues to generate<br />
a certain imbalance in traffic to and from Great Britain.<br />
Performance by activity<br />
<strong>DFDS</strong> TOR LINE’S REPORT 21<br />
<strong>DFDS</strong> Tor Line Number of weekly departures<br />
in both directions<br />
AngloBridge Gothenburg-Immingham/Harwich 20<br />
EuroBridge Gothenburg-Brevik/Ghent 12<br />
BritanniaBridge Esbjerg-Immingham/Harwich 21<br />
ElbeBridge Cuxhaven-Immingham/Harwich 10<br />
ShortBridge Rotterdam-Immingham 12<br />
BalticBridge I Fredericia-Copenhagen-Klaipeda 8<br />
BalticBridge II Riga-Kiel/Lübeck 8<br />
NorBridge Brevik-Kristiansand-Immingham 4<br />
<strong>DFDS</strong> Tor Line: <strong>DFDS</strong> Tor Line operates a route network in<br />
the North Sea and the Baltic Sea consisting of seven ‘bridges’<br />
that achieved considerable profit improvements overall in 2002.<br />
For AngloBridge, including Stena Tor Line, 2002 was a<br />
stable year with developments in volumes and rates in line with<br />
expectations. The level of activity on EuroBridge remained low<br />
2001 2002<br />
DKK million Q1 Q2 Q3 Q4 Year total Q1 Q2 Q3 Q4 Year total<br />
Revenue 531 545 579 582 2,237 638 686 622 696 2,642<br />
Operating profit (EBITA) * 23 27 38 73 161 39 62 39 42 182<br />
Operating profit margin, % 4.3 5.0 6.6 12.4 7.2 6.1 9.0 6.3 6.0 6.9<br />
Invested capital<br />
Return on invested capital<br />
2,739 2,965 3,160 3,207 3,023 3,450 3,664 3,651 3,807 3,624<br />
(ROIC) p.a., % 3.0 3.6 8.2 7.6 5.8 4.1 5.3 -10.5 5.3 1.1<br />
Lane metres, ‘000 1,718 1,683 1,794 1,906 7,101 1,760 1,899 1,783 1,947 7,389<br />
* After adjustment for DKK 150 million write-down on ships in the third quarter of 2002.
22<br />
<strong>DFDS</strong> TOR LINE’S REPORT<br />
in 2002, and although cost adjustments led to improved results<br />
for the route, the general earnings level is still unsatisfactory.<br />
Performance on BritanniaBridge was stable and satisfactory.<br />
On 3 October the ro-pax vessel the DANA GLORIA<br />
went into service on the Esbjerg-Harwich route, replacing a<br />
freight ship and <strong>DFDS</strong> Seaways’ passenger ship the DANA<br />
ANGLIA. The development in passenger and freight operations<br />
lived up to expectation in the fourth quarter of 2002.<br />
Capacity increases were implemented on ElbeBridge<br />
and ShortBridge in 2002, and ElbeBridge in particular recorded<br />
satisfactory growth in volumes.<br />
Capacity on BalticBridge was increased by the addition<br />
of a small freight ship, and performance development was<br />
satisfactory. A new route between Kiel and Riga was opened<br />
in May 2002, and this route will be integrated with Latlines’<br />
Lübeck-Riga route in the spring of 2003. The route will thus<br />
take advantage of the joint facilities in Riga, and the German<br />
port of call will be concentrated in either Kiel or Lübeck.<br />
NorBridge was restructured in 2001, and the performance<br />
level for 2002 was satisfactory.<br />
LISCO Baltic Service Number of weekly departures<br />
in both directions<br />
Klaipeda-Kiel 12<br />
Klaipeda-Karlshamn 12<br />
Klaipeda-Sassnitz 6<br />
LISCO Baltic Service: LISCO’s main business area <strong>com</strong>prises<br />
three Klaipeda-based rail and ro-pax routes plus the agency<br />
and terminal activities associated with the routes. The number<br />
of routes was reduced from four to three in 2002 when the<br />
Klaipeda-Åhus route was concentrated in Karlshamn, whose<br />
capacity was simultaneously expanded. LISCO additionally<br />
operates six multipurpose vessels on time charters of various<br />
lengths and two small ro-ro ships in the open market.<br />
<strong>DFDS</strong> Lys-Line Rederi: <strong>DFDS</strong> Lys-Line Rederi operates 18<br />
side-port and lo-lo vessels, all fixed on five-year time-charters<br />
to Lys-Line AS. The financial performance of <strong>DFDS</strong> Lys-Line<br />
Rederi was satisfactory and in line with expectations for 2002.<br />
The first of a series of five ro-ro<br />
newbuildings is due for delivery in<br />
September 2003<br />
Port terminals: <strong>DFDS</strong> Tor Line operates its own terminals in<br />
Esbjerg, Immingham, Rotterdam, Klaipeda and Brevik. In May<br />
2003, the <strong>com</strong>pany will open a new, owned 200,000 m 2 port<br />
terminal in Maasvlakte, Rotterdam, with an excellent location<br />
close to the harbour exit. The terminal will serve <strong>DFDS</strong> Tor Line’s<br />
own ships as well as those of other lines. The financial results<br />
for the Esbjerg terminal were highly unsatisfactory in 2002 due<br />
to poor efficiency which increased the level of costs. Further<br />
contributory factors were the delays in the implementation of<br />
a new terminal management system and the rebuilding of the<br />
terminal site. The activity levels and financial performance of<br />
the other terminals were satisfactory.<br />
Other activities: At the end of 2002 an agreement was entered<br />
into with <strong>DFDS</strong> Transport Group on the transfer of the German<br />
agency operations associated with <strong>DFDS</strong> Tor Line’s routes,<br />
with effect from 1 January 2003.<br />
Tonnage<br />
In July 2002, <strong>DFDS</strong> Tor Line purchased two newly built Polish<br />
ro-pax sister vessels each with a freight capacity of 2,500 lane<br />
metres, 77 cabins and a service speed of 22 knots. The first<br />
ship, DANA GLORIA, was delivered at the end of July and went<br />
into freight service on the Esbjerg-Harwich route on 10 August<br />
2002. On 3 October the passenger ship DANA ANGLIA was<br />
replaced by DANA GLORIA, which has since operated as a<br />
passenger and freight ship (ro-pax). The second ro-pax ship,<br />
DANA SIRENA, is being rebuilt to provide more passenger<br />
facilities and increase capacity to 600 passengers. DANA<br />
SIRENA is expected to replace DANA GLORIA on 17 June<br />
2003. The plan is then to transfer DANA GLORIA to LISCO<br />
for service in the Baltic Sea.
At the end of April 2002, <strong>DFDS</strong> Tor Line exercised its fifth option<br />
for a ro-ro newbuilding from Flensburg Shipyard. Delivery of<br />
the fifth new vessel is expected in December 2004 and the ship<br />
is planned to enter service on BritanniaBridge.<br />
TOR CIMBRIA was sold, with delivery at the end of<br />
October 2002, and TOR FLANDRIA and TOR SCANDIA were<br />
sold and delivered in December 2002. Furthermore, TOR<br />
HUMBRIA was sold and delivered at the end of January 2003.<br />
<strong>DFDS</strong> Tor Line has chartered back all four vessels in<br />
conjunction with the sales.<br />
At year-end 2002 the average age of the fleet was 12.5<br />
years, against <strong>DFDS</strong> Tor Line’s strategic goal of 10 years, and<br />
the ownership share was 60%, against a strategic goal of 50%.<br />
Profit forecast 2003<br />
<strong>DFDS</strong> Tor Line expects a somewhat higher level of activity in<br />
2003 than in 2002, corresponding to a 5-10% growth in turnover,<br />
due to the acquisition of the Esbjerg-Harwich route from <strong>DFDS</strong><br />
Seaways and the effect of the capacity expansions implemented<br />
in 2002 and those planned for 2003.<br />
Investments in ships are expected to amount to about<br />
DKK 700 million in 2003. This amount covers the rebuilding of<br />
DANA SIRENA, delivery of the first ro-ro newbuilding and work<br />
in progress on other newbuildings. Otherwise, a low level of<br />
investment in tangible fixed assets is expected.<br />
<strong>DFDS</strong> Tor Line expects to achieve a somewhat higher<br />
operating profit (EBITA) in 2003 than in 2002.<br />
North Sea North (AngloBridge,<br />
Stena Tor Line, EuroBridge,<br />
NorBridge) 44%<br />
LANE METRES PER AREA<br />
North Sea South<br />
(BritanniaBridge,<br />
ElbeBridge,<br />
ShortBridge) 34%<br />
Passenger routes,<br />
freight 9%<br />
Baltic Sea<br />
(LISCO, BalticBridge) 13%<br />
Vision<br />
It is <strong>DFDS</strong> Tor Line’s vision to be a leading supplier of<br />
ro-ro liner shipping and other shipping-related transport<br />
solutions in Northern Europe.<br />
Mission<br />
<strong>DFDS</strong> Tor Line’s primary aim is to transport goods from<br />
‘gate-to-gate’ by offering high-frequency, reliable, flexible,<br />
cost-effective and innovative transport solutions and<br />
concepts that optimise time and cost utilization in the<br />
customer’s transport chain.<br />
Product concepts and target<br />
customer groups<br />
<strong>DFDS</strong> TOR LINE’S REPORT 23<br />
Trailer system<br />
For transporting trailers for freight forwarding <strong>com</strong>panies<br />
Cassette system<br />
For transporting heavy industrial products such as steel,<br />
metal, paper, plastic granulate and wood<br />
Lifting unit system<br />
For transporting containers and flats as well as tank<br />
and bulk containers for industrial and freight forwarding<br />
<strong>com</strong>panies<br />
Vehicle system<br />
For transporting passenger vehicles, buses, lorries and<br />
chassis frames for car manufacturers
24<br />
<strong>DFDS</strong> THEME<br />
To delight industry…<br />
with shipping logistics to reduce lead times and costs<br />
– that is part of <strong>DFDS</strong> Tor Line’s mission.<br />
Shipping logistics solutions are targeted at industrial clients<br />
that have large volumes of heavy goods and a major element<br />
of sea transport.<br />
In cooperation with the customer, the entire transport<br />
chain is analyzed in order to develop the best solutions in each<br />
case. This may involve using specially designed load carriers<br />
to minimize the number of handling operations in the transport<br />
chain, and even increase capacity utilization.<br />
Thus, in many instances, shipping logistics solutions<br />
involve the development of transport systems as well as<br />
equipment for goods handling and security.<br />
DAY 5 AVESTA<br />
DAY 3<br />
DAY 8<br />
<strong>DFDS</strong> Tor Line has developed an intermodal transport solution<br />
for AvestaPolarit, one of the world-leading producers of stainless<br />
steel. The concept has reduced lead time for the transport<br />
of raw steel and processed steel products between Sweden<br />
and the UK from 37 to 8 days.<br />
The considerable reduction in number of handling<br />
operations reduced the capital tied up by AvestaPolarit in<br />
warehouses and the number of units damaged in transit.<br />
SHEFFIELD DAY 1<br />
LEAD TIME – AVESTAPOLARIT<br />
GREEN CARGO<br />
EWS RAIL <strong>DFDS</strong> NORDIC TERMINAL IMMINGHAM
Facts about the AvestaPolarit and <strong>DFDS</strong> Tor Line partnership<br />
• AvestaPolarit is one of the world’s leading stainless steel<br />
producers with production plants in Finland, Sweden, the UK<br />
and the USA.<br />
• In 1996, <strong>DFDS</strong> Tor Line was contracted to ship an annual<br />
300,000 tonnes of stainless steel via AngloBridge.<br />
• The system used at that time was based on conventional ship<br />
transport from the UK to Sweden with a lead time of 37 days.<br />
• Today, with the <strong>DFDS</strong> Tor Line system an integral part of<br />
AvestaPolarit’s production chain, total lead time is down to<br />
eight days.<br />
<strong>DFDS</strong> THEME 25<br />
• <strong>DFDS</strong> Tor Line, Green Cargo (the Swedish rail freight<br />
<strong>com</strong>pany), EWS (the UK rail freight <strong>com</strong>pany), <strong>DFDS</strong> Nordic<br />
Terminal and the Port of Gothenburg worked together with<br />
AvestaPolarit for several years to further refine the unique<br />
transport system.<br />
• <strong>DFDS</strong> Tor Line transported 750,000 tonnes of steel from<br />
AvestaPolarit in 2002. The transport system has a total<br />
capacity of one million tonnes a year.<br />
• AvestaPolarit and <strong>DFDS</strong> Tor Line signed a long-term<br />
transport contract with an option for extension.
26<br />
<strong>DFDS</strong> RISK FACTORS AND THE ENVIRONMENT<br />
Risk Factors and the Environment<br />
General and special operational<br />
risk factors<br />
<strong>DFDS</strong>’ activities deploy passenger and freight ships, terminals<br />
and other operating equipment, the use of which entails the<br />
usual operational risks associated with such equipment. <strong>DFDS</strong><br />
minimizes these risks by <strong>com</strong>plying with safety requirements<br />
and routines.<br />
Environmental and safety measures are based on <strong>DFDS</strong>’<br />
environmental and safety policy as well as public authority and<br />
customer requirements. These requirements can be expected to<br />
be even more rigorous in future, which may lead to extra costs<br />
for <strong>DFDS</strong>. <strong>DFDS</strong> is insured as far as possible against environmental<br />
risks. <strong>DFDS</strong> participates in preparatory legislative work<br />
through industry organizations.<br />
Political decisions may alter the legal framework for<br />
<strong>DFDS</strong>’ activities, with potentially negative effects on the business.<br />
At present, the main long-term risk is estimated to be the<br />
discontinuation of tax-free sales in Norway.<br />
A significant portion of the freight business handled on<br />
a few <strong>DFDS</strong> routes derives from a single customer or a few<br />
customers only. <strong>DFDS</strong> takes measures to protect against the<br />
risk related to this type of customer relationship by entering<br />
into long-term cooperation agreements.<br />
Depending on market conditions, the sale of older<br />
tonnage as part of the ongoing renewal of <strong>DFDS</strong>’ fleet may<br />
result in gains or losses that have not been included in the<br />
announced profit forecast.<br />
Financial risk factors<br />
The most important financial risk factors for <strong>DFDS</strong> are currency,<br />
oil, interest rate, cash flow and credit risks. All these factors<br />
are managed by <strong>DFDS</strong>’ central finance department in accordance<br />
with the financial policies approved by <strong>DFDS</strong>’ Supervisory<br />
Board. In addition, a finance manual has been prepared<br />
containing all the relevant policies, guidelines and risk limits<br />
as well as the distribution of finance responsibilities at <strong>DFDS</strong>.<br />
Currency risks<br />
Currency risks arise from disparity between revenue and<br />
expenses in particular currencies and in connection with net<br />
investments in foreign <strong>com</strong>panies. <strong>DFDS</strong> seeks actively to<br />
reduce currency exposure by matching the currencies of assets<br />
and liabilities, and by acquiring forward currency contracts,<br />
currency options and swaps.<br />
About 60% of <strong>DFDS</strong>’ turnover is invoiced in foreign<br />
currency, and the most important net revenue currencies are<br />
SEK, NOK, EUR and GBP. USD is the principal net expense<br />
currency. The risk associated with expected net payments in<br />
these currencies is hedged in accordance with the finance<br />
strategy for the <strong>com</strong>ing year. Major investments in foreign<br />
currencies are generally hedged when contracts are made.<br />
Translation risk relates to the translation of the profit<br />
and equity of subsidiaries into DKK. These risks are to some<br />
extent covered by borrowing in the local currencies of the<br />
subsidiaries, but are not generally hedged.<br />
Interest rate risks<br />
Interest rate risk derives from fluctuations in interest rate levels<br />
and the proportion of interest-bearing debt in relation to assets.<br />
<strong>DFDS</strong>’ policies prescribe that 40%-60% of the loan portfolio<br />
must be fixed-interest debt. The currencies of the loan portfolio<br />
are determined taking account of the currencies of assets,<br />
liabilities and cash flows.<br />
At the end of 2002, interest-bearing debt amounted<br />
to DKK 3,090 million, of which approximately DKK 1,195 million<br />
was in foreign currency.<br />
<strong>DFDS</strong>’ loan portfolio consists predominantly of syndicated<br />
bank loans for ship financing, primarily floating-rate<br />
loans. Loans are obtained at the going rate of interest, with the<br />
addition of a spread reflecting <strong>DFDS</strong>’ financial strength. Loans<br />
are converted to fixed-interest debt using interest rate swaps<br />
and options. At year-end 2002, about 43% of the loan portfolio<br />
had been converted to fixed-interest loans, with 32% in an<br />
interest rate collar with an interest cap of 6% and a floor of 5%.<br />
In 2002, a loan facility was obtained to finance <strong>DFDS</strong><br />
Tor Line’s ro-ro newbuildings. The loan has been hedged<br />
against interest rate exposure by 10-year interest rate swaps,<br />
such that the fixed-interest share of the loan portfolio will be<br />
about 57% at the end of 2003, other things being equal.<br />
At the current level of interest rate hedging, a one<br />
percentage point increase in interest rates would lead to an<br />
additional cost of about DKK 8.5 million in 2003.
More than half of the expected oil consumption<br />
has been hedged in 2003<br />
Cash funds<br />
<strong>DFDS</strong> aims to maintain minimum cash resources of DKK 300<br />
million, which is considered sufficient even in times of peak<br />
requirements. Usually, the central finance department manages<br />
funding provision and placement of excess cash. Cash funds<br />
are primarily placed at the short end of the money market and<br />
in bonds. Cash is deposited only in banks with a Moody’s<br />
rating of at least P-1.<br />
Oil<br />
Fluctuating oil prices are a risk factor in connection with the<br />
purchase of bunkers. <strong>DFDS</strong>’ policy is to constantly hedge the<br />
price of about 50% of the consumption expected in the <strong>com</strong>ing<br />
year using options or oil swaps and price adjustment agreements.<br />
The expected bunker consumption in 2003 is approx.<br />
375,000 tons, of which about 30 % has been hedged by oil<br />
swaps and 42% by price adjustment agreements. The relatively<br />
high volatility of the price of oil in recent years has posed<br />
a significant financial risk to <strong>DFDS</strong>. As a result of this trend,<br />
more than half of the expected oil consumption has been<br />
hedged in 2003.<br />
A 1% increase in the price of oil relative to the February<br />
2003 level would lead to additional annual costs in the region<br />
of DKK 1.5 million.<br />
Credit risks<br />
<strong>DFDS</strong>’ credit risks relate to primary financial assets as well<br />
as derivative financial instruments. In order to minimize these<br />
risks, <strong>DFDS</strong> co-operates only with financial partners that as<br />
a minimum have a short-term rating of P-1 from Moody’s.<br />
<strong>DFDS</strong>’ debtor-related risks are not considered exceptional,<br />
and no significant risk is associated with any particular<br />
customer or business partner.<br />
The environment<br />
<strong>DFDS</strong>’ environmental initiatives focus on the environmental<br />
impact of ships as well as health and safety on board.<br />
New statutory requirements were introduced in 2002<br />
concerning the emission of exhaust gases. In addition to<br />
<strong>com</strong>plying with these regulations, <strong>DFDS</strong> also reduced NOx<br />
emissions from its ships in 2002. For example, catalytic<br />
<strong>DFDS</strong> RISK FACTORS AND THE ENVIRONMENT 27<br />
converters for auxiliary engines were installed on the PEARL<br />
OF SCANDINAVIA and the CROWN OF SCANDINAVIA during<br />
routine docking periods. Coupled with the use of very low<br />
sulphur fuel oils, these initiatives contributed to a significant<br />
reduction of SOx and NOx in the three ports visited by these<br />
ships. However, these voluntary measures have so far led only<br />
to a limited reduction in port charges.<br />
The replacement of auxiliary engines with more<br />
environment-friendly engines continued on the PRINCE OF<br />
SCANDINAVIA and PRINCESS OF SCANDINAVIA. As well<br />
as reducing environmental impact, improved operating economy<br />
in respect of on-board generation of electricity was also<br />
achieved.<br />
The switch from toxic, tin-based anti-fouling paints to<br />
tin-free types is now <strong>com</strong>plete, as all the freight ships have also<br />
been painted. Environmental impact has been reduced, and it<br />
is satisfying to note that the new tin-free anti-foulants are fully<br />
on a par with those used previously, also in terms of cost.<br />
Shipboard health and safety is an important area of<br />
focus for <strong>DFDS</strong>. One priority in 2002 was ventilation improvement<br />
on car decks. Although <strong>DFDS</strong> <strong>com</strong>plies with all statutory<br />
requirements for number of air renewals, this has not always<br />
been sufficient to ensure a good working environment as<br />
‘pockets’ could develop where the air quality was unsatisfactory.<br />
After extensive trials circulation fans are being<br />
installed on the car decks where such pockets are believed<br />
likely to develop.<br />
Chemicals handling is another area of focus. Central<br />
tanks for ready-mixed chemicals have therefore been installed<br />
on several ships. These reduce the need for manual handling<br />
of chemicals, and thus also the risk of allergy and respiratory<br />
damage among the employees who prepare the chemicals<br />
for use.<br />
The use of chemical dosage systems is also being<br />
extended on board. As well as ensuring correct dosage of<br />
chemicals these systems reduce the number of heavy lifting<br />
operations. Correct dosage also saves on costs.
28<br />
<strong>DFDS</strong> SHAREHOLDER INFORMATION<br />
Shareholder Information<br />
Share capital<br />
The share capital of <strong>DFDS</strong> A/S was DKK 800 million at the end<br />
of 2002. The <strong>com</strong>pany has only one class of shares, and the<br />
share capital is divided into 8,000,000 shares of a nominal<br />
value of DKK 100.<br />
Price trend in 2002<br />
The <strong>DFDS</strong> share is listed on the Copenhagen Stock Exchange<br />
where the market value of the total volume of <strong>DFDS</strong> shares<br />
traded was DKK 251 million. The average trading volume per<br />
business day was just over DKK 1 million.<br />
At the end of 2002, the <strong>DFDS</strong> share was listed at a price<br />
of DKK 138 per share, representing an increase of 13% in 2002.<br />
<strong>DFDS</strong>’ Peer Group index rose by 3% over the same period, while<br />
the all-share index for the Copenhagen Stock Exchange fell by<br />
22%. The total shareholder return (price change plus dividend<br />
yield) of the <strong>DFDS</strong> share was 19% in 2002.<br />
The market value of the total share capital at the end<br />
of 2002 was DKK 1,107 million.<br />
MidCap + Index<br />
In April 2003, the Copenhagen Stock Exchange is due to<br />
introduce a new share index for medium-sized <strong>com</strong>panies: the<br />
MidCap + Index. The <strong>DFDS</strong> share currently meets the requirements<br />
for admission to the index.<br />
Shareholders<br />
At the end of 2002, <strong>DFDS</strong> had 20,634 registered shareholders<br />
who owned 86.9% of the share capital. Vesterhavet A/S<br />
(Sankt Annæ Plads 28, DK-1291 Copenhagen K) is the principal<br />
shareholder with a shareholding of 56.0% of the total share<br />
capital. In addition, ATP (Kongens Vænge 8, DK-3400 Hillerød)<br />
and <strong>DFDS</strong> A/S hold 5% or more of the total share capital.<br />
Shareholders % of share capital<br />
Vesterhavet A/S 56.0<br />
ATP (Danish Labour Market Supplementary Pension Fund) 8.2<br />
Other institutional and financial investors 2.0<br />
Other registered shareholders 14.8<br />
Own shares 5.9<br />
Non-registered shareholders 13.1<br />
Total 100,0<br />
Dividend<br />
The Supervisory Board of <strong>DFDS</strong> proposes payment of a<br />
dividend of DKK 7 per share of DKK 100 nominal value,<br />
corresponding to 7% of the share capital and 30% of the profit<br />
for the year after minority interests. The proposed dividend<br />
per share corresponds to a dividend yield of 5%.<br />
<strong>DFDS</strong>’ dividend policy provides for the distribution of<br />
an annual dividend of approximately 30% of the profit for the<br />
year. However, the amount of annual dividend is determined<br />
with due consideration for <strong>DFDS</strong>’ development plans, financial<br />
and cash position, and satisfactory equity ratio.<br />
Annual General Meeting<br />
<strong>DFDS</strong>’ Annual General Meeting will take place on Tuesday<br />
8 April 2003 at 16.00 at the Radisson SAS Falconer Center,<br />
Falkoner Allé 9, DK-2000 Frederiksberg.<br />
Investor relations<br />
Chr. Merrild, Chief Financial Officer<br />
Tel.: +45 33 42 32 01<br />
Fax: +45 33 42 32 09<br />
e-mail: christian.merrild@dfds.dk<br />
Søren Brøndholt Nielsen, IR Manager<br />
Tel.: +45 33 42 33 59<br />
Fax: +45 33 42 32 09<br />
e-mail: soren.b.nielsen@dfds.dk<br />
Financial calendar<br />
Annual General Meeting<br />
8 April 2003 at 16.00<br />
Radisson SAS Falconer Center<br />
Falkoner Allé 9<br />
DK-2000 Frederiksberg<br />
Dividend<br />
To be paid out mid April 2003<br />
Publication of Group reports<br />
Report for the first quarter of 2003, 20 May 2003<br />
Report for the first half of 2003, 28 August 2003<br />
Report for the third quarter of 2003, 27 November 2003
Share-related ratios and key figures<br />
2002 2001 2000 1999 1998<br />
Earnings per share, DKK n.a. 30 n.a. 40 47<br />
Dividend per share, DKK * 7 9 38 8 12<br />
Payout ratio, % n.a. 30 n.a. 20 25<br />
Dividend yield, % 5.1 7.4 34.7 6.7 4.6<br />
P/E ratio, times n.a. 4 n.a. 10 9<br />
Equity per share 326 318 519 425 399<br />
Price/book value, times<br />
Share price, DKK:<br />
0.43 0.38 0.57 0.72 1.13<br />
Price at year-end 138 122 108 120 260<br />
Price high 148 208 261 271 387<br />
Price low 121 93 27 118 214<br />
Market value, DKK million<br />
Number of shares at<br />
1,107 972 2,371 2,464 2,675<br />
year-end, million 8 8 8 8 5<br />
* Adjusted for extraordinary dividend in 2000<br />
PRICE TREND, 1998-2002<br />
Index<br />
Source: Copenhagen Stock Exchange, Reuters Note: <strong>DFDS</strong>' share price is adjusted for the payment<br />
of an extraordinary dividend of DKK 187,5 per share until 11 April 2001<br />
PRICE TREND AND<br />
TRADING, 2002<br />
<strong>DFDS</strong> Peer Group Index (Silja Line, Viking Line, Finnlines, P&O)<br />
Copenhagen Stock Exchange, Total Index<br />
High<br />
97 98 99 00 01 02<br />
150<br />
120<br />
180<br />
Share price, high/low DKK mill.<br />
60<br />
150<br />
120<br />
90<br />
60<br />
30<br />
0<br />
J F M A M J J A S O N D<br />
Low Turnover, market value, DKK mill.<br />
90<br />
60<br />
30<br />
0<br />
50<br />
40<br />
30<br />
20<br />
10<br />
0<br />
Reports to the Copenhagen Stock<br />
Exchange 2002<br />
Date Report<br />
4 Jan Financial Calendar 2002 for <strong>DFDS</strong> A/S<br />
12 Mar Annual Report<br />
15 Mar <strong>DFDS</strong> Tor Line A/S has acquired a 66% shareholding<br />
in the Norwegian Lys-Line Rederi AS, effective as of<br />
1 January 2002<br />
26 Mar Notice of Annual General Meeting<br />
11 Apr Main Transactions of the Annual General Meeting<br />
of <strong>DFDS</strong> A/S<br />
22 Apr <strong>DFDS</strong> orders fifth newbuilding from Flensburg Shipyard<br />
23 May <strong>DFDS</strong> Group Report for the First Quarter 2002<br />
11 Jul <strong>DFDS</strong> sells the passenger vessel the ADMIRAL OF<br />
SCANDINAVIA<br />
18 Jul <strong>DFDS</strong> acquires two ro-pax vessels<br />
22 Aug <strong>DFDS</strong> Group Half-Year Report 2002<br />
29 Nov <strong>DFDS</strong> Group Report for the Third Quarter 2002<br />
3 Dec Financial Calendar 2003 for <strong>DFDS</strong> A/S<br />
20 Dec <strong>DFDS</strong> A/S statement of shareholdings as at 20<br />
December 2002<br />
Analysts monitoring the <strong>DFDS</strong> share<br />
Steven Brooker, Alfred Berg<br />
Tel.: +45 33 96 10 00<br />
e-mail: steven.brooker@alfredberg.dk<br />
Henrik Lund, Danske Securities<br />
Tel.: +45 33 64 90 00<br />
e-mail: henrik.lund@danskesecurities.<strong>com</strong><br />
Christian Reinholdt, Carnegie<br />
Tel.: +45 32 88 02 00<br />
e-mail: creinholdt@carnegie.dk<br />
Tue Østergaard, Gudme Raaschou<br />
Tel.: +45 33 44 90 00<br />
e-mail: tue@gr.dk<br />
<strong>DFDS</strong> SHAREHOLDER INFORMATION 29
30<br />
<strong>DFDS</strong> FINANCIAL REVIEW 2002<br />
Financial Review 2002<br />
Accounting policies<br />
The accounting policies have been changed in conformity with<br />
the amendments to the Danish Financial Statements Act in the<br />
following areas:<br />
• Development costs are recognized – provided certain<br />
criteria have been met – as intangible assets at cost less<br />
accumulated amortization. Previously, development costs<br />
were recognized as incurred in the statement.<br />
• The fair value of derivative financial instruments designated<br />
as hedge of future assets and liabilities is recognized in<br />
equity until the hedged item is realized. Previously, derivative<br />
financial instruments designated as hedges of future assets<br />
and liabilities were not recognized in the balance sheet.<br />
• Proposed dividends are recognized as a separate item<br />
under equity until they have been adopted by the Annual<br />
General Meeting. After this date, dividends are recognized<br />
as a liability. Previously, proposed dividends that had not<br />
yet been adopted by the Annual General Meeting were<br />
recognized as short-term liabilities.<br />
The changes in accounting polices led to a DKK 5.9 million<br />
increase in profit before tax and a DKK 16.1 million reduction<br />
in equity at 31 December 2002. For further details, please see<br />
Accounting Policies.<br />
Changed accounting estimates<br />
The accounting estimates related to passenger ships have<br />
been changed in accordance with Danish accounting standard<br />
no. 10, implying that the carrying amount of ships at 1 January<br />
2002 is divided into <strong>com</strong>ponents with different useful lives. For<br />
that purpose, the useful lives of all <strong>com</strong>ponents have been<br />
reassessed. The changed accounting estimates result in an<br />
increase in depreciation of DKK 10.3 million in 2002.<br />
In the next two years, the changes in accounting<br />
estimates related to passenger ships are expected to result in<br />
ship depreciation at the same level as this year, based on an<br />
unchanged fleet. When using the estimates applied in prior<br />
years, ship depreciation would have been approximately DKK<br />
30 million lower. From 2005, the level of ship depreciation is<br />
expected to be somewhat lower, all else being equal.<br />
Freight and ro-pax vessels are not split into <strong>com</strong>ponents<br />
as the <strong>com</strong>ponents of these ships are assumed to wear out at<br />
the same rate.<br />
Operating profit (EBITA)<br />
DKK million 2002 2001<br />
<strong>DFDS</strong> Seaways 127 100<br />
<strong>DFDS</strong> Tor Line 192 115<br />
<strong>DFDS</strong> Group Management -36 -31<br />
Non-recurring items * -164 141<br />
<strong>DFDS</strong> Group 119 325<br />
* Write-downs and profit/loss on sale of ships, buildings and terminals<br />
Financial performance and<br />
revenue 2002<br />
Revenue increased by 13% to DKK 4,870 million due to the<br />
18% growth in revenue generated by <strong>DFDS</strong> Tor Line and the<br />
7% growth in revenue recorded by <strong>DFDS</strong> Seaways.<br />
The growth in revenue for <strong>DFDS</strong> Tor Line was primarily<br />
attributable to the acquisition of <strong>DFDS</strong> Lys-Line Rederi, effective<br />
1 January 2002, and the full-year effect of the acquisition of<br />
LISCO, purchased on 27 June 2001. The bulk of the increase<br />
recorded by <strong>DFDS</strong> Seaways relates to the Amsterdam-<br />
Newcastle and Copenhagen/Helsingborg-Oslo routes, where<br />
capacity was expanded at the end of June 2001.<br />
The sale of ships, terminals and buildings in 2002<br />
resulted in a loss of DKK 14 million <strong>com</strong>pared with a profit of<br />
DKK 166 million in 2001.<br />
Operating profit before depreciation (EBITDA) increased<br />
by DKK 166 million, or 27%, to DKK 782 million, excluding<br />
profit/loss on the sale of ships, buildings and terminals. The<br />
profit improvement derives partly from the addition of <strong>DFDS</strong><br />
Lys-Line Rederi and the full-year effect of the expansion<br />
of <strong>DFDS</strong> Seaways’ capacity, and partly from performance<br />
improvements on other activities.<br />
Depreciation and impairment rose from DKK 456 million<br />
in 2001 to DKK 649 million in 2002. Excluding write-downs,<br />
depreciation increased from DKK 431 million in 2001 to DKK<br />
499 million in 2002, which is largely attributable to <strong>com</strong>pany<br />
acquisitions and the full-year effect of the addition of PEARL<br />
OF SCANDINAVIA.<br />
Net financing costs amounted to DKK 133 million, an<br />
increase of DKK 100 million <strong>com</strong>pared with 2001. The rise<br />
should be seen in light of the increase in average net interestbearing<br />
debt of approximately DKK 1.0 billion in 2002 <strong>com</strong>pared<br />
with 2001, when a large portion of the proceeds from the sale<br />
of <strong>DFDS</strong> Dan Transport was at the disposal of <strong>DFDS</strong> until April.<br />
In addition, revenue from net value adjustments, etc., decreased<br />
by DKK 16 million in 2002.
Accrued tax on ordinary activities resulted in an in<strong>com</strong>e of DKK<br />
335 million, as <strong>DFDS</strong>’ entry into the Danish tonnage tax regime<br />
led to a reversal of deferred tax of DKK 326 million. Current tax<br />
for the year amounted to DKK 13 million in 2002.<br />
Extraordinary items after tax amounted to costs of DKK<br />
116 million related to the settlement with DSV concerning the<br />
final transfer payment on the sale of <strong>DFDS</strong> Dan Transport.<br />
The profit for the year before minority interests was<br />
thus DKK 200 million.<br />
Investments<br />
Total investment in 2002 amounted to DKK 801 million, of<br />
which DKK 652 million was invested in ships. Proceeds from<br />
the sale of tangible fixed assets, primarily ships, amounted to<br />
DKK 305 million.<br />
Cash flow<br />
Cash flow from operations rose by 21% to DKK 832 million in<br />
2002, and after the deduction of net investments of DKK 496<br />
million, the free cash flow from operations was DKK 336 million.<br />
Cash flow from net financing and extraordinary items was<br />
negative by DKK 197 million.<br />
Balance sheet<br />
At year-end, the balance sheet total was DKK 6,882 million,<br />
which is on a par with 2001. Goodwill increased by DKK 63<br />
million to DKK 85 million, primarily as a result of the acquisition<br />
of <strong>DFDS</strong> Lys-Line Rederi. Tangible assets rose by DKK 279<br />
million to DKK 5,362 million, primarily due to the acquisition of<br />
<strong>DFDS</strong> Lys-Line Rederi and two ro-pax ships. On the liabilities<br />
side, the provision for deferred tax was reduced by DKK<br />
350 million.<br />
Interest-bearing debt increased by DKK 195 million<br />
to DKK 3,090 million at year-end 2002. The ratio of interestbearing<br />
debt to equity including minority interests rose from<br />
1.08 in 2001 to 1.12 in 2002.<br />
<strong>DFDS</strong> Group – financial performance by quarter 2001/02<br />
<strong>DFDS</strong> FINANCIAL REVIEW 2002 31<br />
Valuation of ships<br />
In the shipping industry, the value of ships is normally estimated<br />
in USD, the international currency predominantly used in shipping.<br />
As a regional shipping <strong>com</strong>pany, <strong>DFDS</strong> receives its primary<br />
revenue in DKK, SEK, NOK and GBP. In 2002, the market<br />
value of ships was considerably reduced, partly as a result<br />
of the weakening of the USD. However, due to <strong>DFDS</strong>’ regional<br />
market position, this value reduction did not have a negative<br />
impact on <strong>DFDS</strong>’ earnings capacity.<br />
At 31 December 2002, the book value of ships amounted<br />
to DKK 4,858 million, which is estimated to exceed the market<br />
value by an amount in the region of DKK 400 – 500 million,<br />
based on brokers’ estimates. <strong>DFDS</strong> conducts an annual impairment<br />
test for ships on the basis of expected future earnings.<br />
The impairment test is described in more detail in the section<br />
on accounting policies on page 36. Calculations for 2002 show<br />
no current need for a further writedown on ships other than the<br />
write-down on freight ships put up for sale which was carried<br />
out on 30 September 2002.<br />
<strong>DFDS</strong>’ tonnage strategy aims to lower the average fleet<br />
age and reduce ownership share. In the <strong>com</strong>ing years, this<br />
strategy will lead to the sale of ships, which, if the present low<br />
market value level persists, may result in losses at the time of sale.<br />
Equity<br />
Equity rose by DKK 64 million to DKK 2,604 million after<br />
the DKK 189 million profit transfer for the year offset by the<br />
distributed dividend of DKK 68 million and value adjustments<br />
of hedging instruments and foreign exchange adjustments<br />
totalling DKK -58 million.<br />
Solidity rose from 39.2% in 2001 to 40.0% in 2002.<br />
The Supervisory Board of <strong>DFDS</strong> proposes that the<br />
Annual General Meeting adopt the distribution of a dividend<br />
of DKK 7 per share. The proposed amount of dividend of DKK<br />
56 million corresponds to 30% of the profit for the year after<br />
tax and minority interests.<br />
2001 2002<br />
DKK million Q1 Q2 Q3 Q4 Year total Q1 Q2 Q3 Q4 Year total<br />
Revenue 864 1,047 1,303 1,095 4,309 1,050 1,276 1,360 1,184 4,870<br />
Operating profit (EBITA) -108 193 223 17 325 -106 138 80 7 119<br />
Operating profit margin, %<br />
Profit before tax and<br />
-12.5 18.4 17.1 1.6 7.5 -10.1 10.8 5.9 0.6 2.4<br />
extraordinary items -101 183 223 -14 291 -138 89 43 -13 -19<br />
Invested capital<br />
Return on invested capital<br />
6,980 6,470 6,070 6,117 6,448 6,266 6,330 6,139 6,043 6,177<br />
(ROIC) p.a., % 4.2 10.1 15.9 10.0 5.7 -5.9 8.0 -4.7 2.5 0.0
32<br />
<strong>DFDS</strong> STATEMENTS<br />
Statements<br />
Statement by the Executive and Supervisory Boards<br />
The Executive and Supervisory Boards have today discussed and adopted the annual report for 2002 of <strong>DFDS</strong> A/S.<br />
The annual report has been prepared in accordance with the Danish Financial Statements Act, Danish accounting standards and<br />
the Copenhagen Stock Exchange’s financial reporting requirements for listed <strong>com</strong>panies. We consider the accounting policies<br />
applied to be appropriate. Accordingly, the annual report gives a true and fair view of the Group’s and the parent <strong>com</strong>pany’s assets,<br />
liabilities and financial position as well as of the results of the Group’s and the parent <strong>com</strong>pany’s operations.<br />
We re<strong>com</strong>mend that the annual report be approved at the annual general meeting.<br />
* Employee elected board members<br />
Auditors’ report<br />
Copenhagen, 18 March 2003<br />
Executive Board<br />
Ole Frie Chr. Merrild<br />
Presiding Director Director<br />
Supervisory Board<br />
Ivar Samrén Svend Jakobsen<br />
Chairman Deputy Chairman<br />
Ole Adamsen* Claus Arnhild* Jill Lauritzen Melby<br />
Anders Moberg Ingar Skaug Ib Sørensen*<br />
To the shareholders of <strong>DFDS</strong> A/S<br />
We have audited the annual report of <strong>DFDS</strong> A/S for the financial year 1 January - 31 December 2002.<br />
The annual report is the responsibility of the Executive and Supervisory Boards. Our responsibility is to express an opinion on the<br />
annual report based on our audit.<br />
Basis of opinion<br />
We conducted our audit in accordance with Danish Auditing Standards. Those standards require that we plan and perform the<br />
audit to obtain reasonable assurance that the annual report is free of material misstatement. An audit includes examining, on a test<br />
basis, evidence supporting the amounts and disclosures in the annual report. An audit also includes assessing the accounting<br />
policies used and significant estimates made by the Executive and Supervisory Boards, as well as evaluating the overall annual<br />
report presentation. We believe that our audit provides a reasonable basis for our opinion.<br />
Our audit has not resulted in any qualification.<br />
Opinion<br />
In our opinion, the annual report gives a true and fair view of the Group’s and the parent <strong>com</strong>pany’s financial position at 31 December<br />
2002 and of the results of the Group’s and the parent <strong>com</strong>pany’s operations and consolidated <strong>com</strong>pany cash flows for the financial<br />
year 1 January - 31 December 2002 in accordance with the Danish Financial Statements Act and Danish Accounting Standards.<br />
Copenhagen, 18 March 2003<br />
Kurt Gimsing Jesper Koefoed Torgny Pahle Morten Egelund<br />
State authorised public accountants State authorised public accountants<br />
KPMG C. Jespersen KPMG C. Jespersen
Accounting policies<br />
The annual report has been prepared in accordance with<br />
the provisions applying to class D enterprises in the Danish<br />
Financial Statements Act, Danish accounting standards and the<br />
Copenhagen Stock Exchange financial reporting requirements<br />
for listed <strong>com</strong>panies.<br />
The accounting policies are consistent with those of last<br />
year, apart from the following areas which have been changed<br />
as a result of the new Financial Statements Act:<br />
1. Development costs are recognised – provided certain<br />
criteria have been met – as intangible assets at cost less<br />
accumulated amortisation. Previously, development costs<br />
were recognised as incurred in the in<strong>com</strong>e statement.<br />
The change in policy is an increase in profit before tax<br />
and profit after tax for 2002 of DKK 8.4 million and DKK<br />
5.9 million, respectively. (2001: DKK 0.7 million and DKK<br />
0.5 million, respectively). Equity at 31 December 2002<br />
have increased by DKK 17.1 million (31 December 2001:<br />
DKK 6.3 million) as a result of the change.<br />
2. The fair value of derivative financial instruments<br />
designated as hedges of future assets and liabilities is<br />
recognised in equity until the hedged item is realised.<br />
Previously, derivative financial instruments designated as<br />
hedges of future assets and liabilities were not recognised<br />
in the balance sheet. The change in policy has no effect<br />
on the profit before tax or the profit after tax for 2002,<br />
but results in a decrease of equity at 31 December 2002<br />
of DKK 85.8 million (31 December 2001: a decrease of<br />
DKK 19.5 million).<br />
3. Proposed dividends are recognised as a separate<br />
item under equity until they have been adopted at the<br />
<strong>DFDS</strong> ACCOUNTING POLICIES<br />
annual general meeting. After this date, dividends are<br />
recognised as a liability. Previously, proposed dividends<br />
that had not yet been adopted at the annual general<br />
meeting were recognised as short-term liabilities. The<br />
change in policy results in an increase in equity at<br />
31 December 2002 of DKK 52.7 million (31 December<br />
2001: DKK 67.7 million).<br />
Comparative figures and financial highlights have been restated<br />
as a result of the change in accounting policies, except regarding<br />
the accounting treatment of derivative financial instruments.<br />
Comparative figures for derivative financial instruments<br />
have only been restated at 31 December 2001 in accordance<br />
with Danish Accounting Standard no. 3 and by reference to<br />
IAS 39.<br />
The accumulated effect of the change in accounting<br />
policies is an increase in profit before tax for 2002 of DKK 8.4<br />
million (2001: DKK 0.7 million). The change in policy results in<br />
an increase of tax for the year of DKK 2.5 million (2001: DKK<br />
0.2 million). Accordingly, profit after tax for 2002 is increased<br />
by DKK 5.9 million (2001: DKK 0.5 million).<br />
Total assets at 31 December 2002 are increased by<br />
DKK 32.5 million (31 December 2001: DKK 10.1 million) and<br />
equity are decreased by DKK 16.1 million (31 December 2001:<br />
an increase of DKK 54.5 million).<br />
The accounting estimates related to passenger ships have<br />
been changed in accordance with Danish accounting standard<br />
no. 10 implying that the carrying amount of ships at 1 January<br />
2002 is divided into <strong>com</strong>ponents with different useful lives. For<br />
that purpose the useful lives of all <strong>com</strong>ponents have been<br />
2001 2001 2002 2002<br />
previous changed previous changed<br />
accounting Change accounting accounting Change accounting<br />
DKK ‘000 Reference policy in policy policy policy in policy policy<br />
In<strong>com</strong>e statement<br />
Profit before depreciation (EBITDA) 1 777,141 4,056 781,197 756,370 11,751 768,121<br />
Depreciation 1 -452,687 -3,389 -456,076 -645,479 -3,361 -648,840<br />
Operating profit (EBITA) 1 324,454 667 325,121 110,891 8,390 119,281<br />
Profit before tax 1 290,514 667 291,181 -27,202 8,390 -18,812<br />
Tax on profit for the year 1 -38,227 -200 -38,427 337,886 -2,517 335,369<br />
Profit for the year 1 250,106 467 250,573 183,196 5,873 189,069<br />
Balance sheet<br />
Intangible assets 1 21,784 8,972 30,756 84,854 17,063 101,917<br />
Tangible assets 5,083,081 0 5,083,081 5,362,011 0 5,362,011<br />
Investments 165,440 0 165,440 32,861 0 32,861<br />
Current assets 2 1,556,715 1,111 1,557,826 1,369,643 15,475 1,385,118<br />
Total assets 6,827,020 10,083 6,837,103 6,849,369 32,538 6,881,907<br />
Equity 1,2,3 2,485,875 54,501 2,540,376 2,620,008 -16,072 2,603,936<br />
Minority interests 139,600 0 139,600 146,472 0 146,472<br />
Provisions 1,2 516,569 -5,552 511,017 201,653 -12,783 188,870<br />
Liabilities 2,3 3,684,976 -38,866 3,646,110 3,881,236 61,393 3,942,629<br />
Total equity and liabilities 6,827,020 10,083 6,837,103 6,849,369 32,538 6,881,907<br />
33
34<br />
<strong>DFDS</strong> ACCOUNTING POLICIES<br />
reassessed. The changed accounting estimates result in an<br />
increase in depreciation in 2002 of DKK 10.3 million.<br />
In the next two years the changes in accounting<br />
estimates related to passenger ships are expected to result<br />
in ship depreciation at the same level as this year, based on<br />
an unchanged fleet. When using the estimates applied in prior<br />
years, ship depreciation would have been approximately<br />
DKK 30 million lower. From 2005 the level of ship depreciation<br />
is expected to be somewhat lower, all things being equal.<br />
Recognition and measurement<br />
Revenue is recognised in the in<strong>com</strong>e statement as earned,<br />
including value adjustments of financial assets and liabilities<br />
measured at fair value or amortised cost. Equally, costs<br />
incurred to generate the year’s earnings, including depreciation,<br />
amortisation and impairment are recognised in the in<strong>com</strong>e<br />
statement.<br />
Assets are recognised in the balance sheet when it is<br />
probable that future economic benefits will flow to the Group<br />
and the value of the asset can be reliably measured.<br />
Liabilities are recognised in the balance sheet when<br />
an outflow of economic benefits is probable and the liability can<br />
be reliably measured. If a liability cannot be reasonably measured,<br />
the liability is recognised in contingent liabilities.<br />
On initial recognition, assets and liabilities are measured<br />
at cost. Subsequently, assets and liabilities are measured as<br />
described below for each individual item.<br />
Certain financial assets and liabilities are measured at<br />
amortised cost implying the recognition of a constant effective<br />
interest rate to maturity. Amortised cost is calculated as initial<br />
cost minus any principal repayments and plus or minus the<br />
cumulative amortisation of any difference between cost and<br />
nominal amount, which is due on maturity. Accordingly, any<br />
gains or losses are allocated over the term to maturity.<br />
In recognising assets and liabilities, any gains, losses<br />
and risks occurring prior to the presentation of the annual<br />
report that evidence conditions existing at the balance sheet<br />
date are taken into account.<br />
Consolidated financial statements<br />
The consolidated financial statements <strong>com</strong>prise the parent<br />
<strong>com</strong>pany <strong>DFDS</strong> A/S and subsidiaries in which <strong>DFDS</strong> A/S, at the<br />
balance sheet date, directly or indirectly holds more than 50% of<br />
the voting rights or which it, in some other way, controls. Enterprises<br />
in which the Group holds between 20% and 50% of the<br />
voting rights and over which it exercises significant influence, but<br />
which it does not control, are considered associates, cf. the<br />
Group chart.<br />
The consolidated financial statements are prepared<br />
by consolidating the parent <strong>com</strong>pany’s and the individual subsidiaries’<br />
audited financial statements, all of which are prepared<br />
in accordance with the accounting policies of the <strong>DFDS</strong> Group.<br />
On consolidation, intra-group in<strong>com</strong>e and expenses,<br />
shareholdings, intra-group balances and dividends, and realised<br />
and unrealised gains and losses on intra-group transactions<br />
are eliminated.<br />
The Group’s share of jointly controlled enterprises is<br />
recognised in the items in the consolidated financial statements<br />
at the proportionate share of the jointly controlled enterprises’<br />
in<strong>com</strong>e and expenses, assets and liabilities (proportionate<br />
consolidation).<br />
Investments in subsidiaries are set off against the<br />
proportionate share of the subsidiaries’ net asset value at the<br />
acquisition date.<br />
The Group’s investments in associates are recognised<br />
in the consolidated financial statements at the proportionate<br />
share of the associates’ net asset value.<br />
Enterprises acquired or formed during the year are<br />
recognised in the consolidated financial statements from the<br />
date of acquisition or formation. Enterprises disposed of are<br />
recognised in the consolidated financial statements until the<br />
date of disposal, except consolidation related to disposal of an<br />
entire business area, cf. below. The <strong>com</strong>parative figures are<br />
not adjusted for <strong>com</strong>panies acquired by purchase or merger,<br />
or for disposal of <strong>com</strong>panies.<br />
Acquisitions of enterprises are accounted for using the<br />
purchase method, according to which the identifiable assets<br />
and liabilities acquired are measured at their fair values at the<br />
date of acquisition. Provision is made for costs related to adopted<br />
and announced plans to restructure the acquired enterprise.<br />
Any excess of the cost of the acquisition over the fair<br />
value of the identifiable assets and liabilities acquired (goodwill),<br />
including restructuring provisions, is recognised as intangible<br />
assets and amortised on a systematic basis in the in<strong>com</strong>e statement<br />
based on an individual assessment of the useful life of<br />
the asset, not exceeding 20 years. Any excess of the fair values<br />
of the identifiable assets and liabilities acquired over the cost<br />
of the acquisition (negative goodwill), representing an anticipated<br />
adverse development in the acquired enterprises, is recognised<br />
in the balance sheet in liabilities and recognised in the in<strong>com</strong>e<br />
statement as the adverse development is realised.<br />
Negative goodwill not related to any anticipated adverse<br />
development is recognised in the balance sheet at date of<br />
acquisition and subsequently recognised in the in<strong>com</strong>e statement<br />
over the average useful lives of the non-monetary assets.<br />
Goodwill and negative goodwill from acquired enterprises<br />
can be adjusted until the end of the year following the<br />
acquisition, if the recognition and measurement of the net<br />
assets of the acquired enterprises is changed.<br />
Gains or losses on disposal of subsidiaries and associates<br />
are stated as the difference between the sales amount<br />
or disposal costs and the carrying amount of net assets at the<br />
date of disposal, including unamortised goodwill, plus anticipated<br />
disposal costs.<br />
Consolidation of disposal of business area<br />
Disposal of an entire business area is recognised in the<br />
consolidated financial statements as follows:
The Group’s share of the results of the disposed business<br />
area until the date of disposal is recognised in “Result of<br />
disposal of business area” using the equity method. The 5-year<br />
survey shows a pro forma in<strong>com</strong>e statement, which has been<br />
adjusted as a consequence of the disposal of business area<br />
in 2000.<br />
The disposal of business area is consolidated in the<br />
consolidated balance sheet and in the consolidated cash flow<br />
until the date of disposal.<br />
Minority interests<br />
In the consolidated financial statements, the items of subsidiaries<br />
are recognised in full. The minority interests’ proportionate<br />
shares of the subsidiaries’ results and equity are adjusted<br />
annually and recognised separately in the in<strong>com</strong>e statement<br />
and balance sheet.<br />
Foreign currency translation<br />
Transactions denominated in foreign currencies are translated<br />
into Danish kroner at the exchange rates at the transaction date.<br />
Receivables and payables denominated in foreign<br />
currencies are translated into Danish kroner at the exchange<br />
rates at the balance sheet date.<br />
Realised and unrealised gains and losses on foreign<br />
exchange are recognised in the in<strong>com</strong>e statement in financing, net.<br />
Fixed assets acquired in foreign currencies are translated<br />
at the exchange rates at the acquisition date. Gains and<br />
losses on hedges relating to the acquisition of fixed assets are<br />
recognised as part of the fixed asset.<br />
On translation of the Group’s foreign subsidiaries<br />
and associates, which are all separate entities, the in<strong>com</strong>e<br />
statements are translated into Danish kroner at the average<br />
exchange rates, and the balance sheet items are translated<br />
at the exchange rates at the balance sheet date.<br />
Foreign exchange differences arising on translation of<br />
the opening equity of foreign subsidiaries at the exchange<br />
rates at the balance sheet date and on translation of the in<strong>com</strong>e<br />
statements from average exchange rates to the exchange rates<br />
at the balance sheet date are recognised directly in equity.<br />
In<strong>com</strong>e statement<br />
Revenue<br />
Revenue from passenger shipping is recognised in the in<strong>com</strong>e<br />
statement at the time of departure while revenue from sea<br />
freight transport is recognised in the in<strong>com</strong>e statement at the<br />
time the freight is loaded.<br />
Revenue is measured ex VAT, taxes and discounts in<br />
relation to the sale.<br />
Costs<br />
When passenger shipping and sea freight transport are recognised<br />
as in<strong>com</strong>e, related costs are recognised in the in<strong>com</strong>e statement.<br />
<strong>DFDS</strong> ACCOUNTING POLICIES 35<br />
Operating costs related to ships<br />
Operating costs related to ships include financial and operational<br />
payments for bareboat and time-charter agreements.<br />
Furthermore, catering-related consumption of goods,<br />
ships’ bunkers consumption including hedging, and costs<br />
related to maintenance and improvement of ships that are not<br />
capitalised under tangible assets are included.<br />
Staff costs<br />
Staff costs include wages and salaries, pension contributions,<br />
and social security costs for employees in the Group. Furthermore,<br />
costs related to employees who are now retired from the<br />
Group are included.<br />
Other costs of operation, sale, and administration<br />
Other costs of operation, sale, and administration <strong>com</strong>prise<br />
operating costs concerning land-based activities, including<br />
leasing, rental, and maintenance of operating equipment. In<br />
addition, costs of sale, marketing, and administration are included.<br />
Financing, net<br />
Financing, net <strong>com</strong>prise interest in<strong>com</strong>e and expense, realised<br />
and unrealised gains and losses on securities, payables and<br />
transactions denominated in foreign currencies as well as<br />
amortisation of financial assets and liabilities.<br />
Profits/losses from investments in group enterprises<br />
and associates<br />
The proportionate share of the results before tax of the individual<br />
subsidiaries is recognised in the in<strong>com</strong>e statement of the parent<br />
<strong>com</strong>pany after full elimination of intra-group profits/losses and less<br />
amortisation of goodwill. The share of the taxes of subsidiaries<br />
is recognised as tax on profit/loss from ordinary activities.<br />
The proportionate share of the results before tax of the<br />
associates is recognised in both the parent <strong>com</strong>pany and the<br />
consolidated in<strong>com</strong>e statement in financing, net. The share of<br />
the taxes of associates is recognised as tax on profit/loss from<br />
ordinary activities.<br />
Tax on profit/loss for the year<br />
<strong>DFDS</strong> A/S is jointly taxed with a number of wholly-owned<br />
Danish subsidiaries and one foreign subsidiary. The current<br />
Danish corporation tax payable is levied on the jointly taxed<br />
<strong>com</strong>panies in proportion to their taxable in<strong>com</strong>e (full allocation<br />
with refunds for tax losses).<br />
The Group’s Danish shipping <strong>com</strong>panies and one<br />
Norwegian shipping <strong>com</strong>pany are taxed under a tonnage<br />
taxation scheme. The taxable in<strong>com</strong>e related to transportation<br />
of passengers and gods is determined on the basis of tonnage<br />
during the year. In<strong>com</strong>e related to other activities is taxed in<br />
accordance with the usual applicable tax rules.<br />
Tax for the year <strong>com</strong>prises in<strong>com</strong>e tax, tonnage tax, and<br />
changes in deferred tax for the year. The tax expense relating to<br />
the profit/loss for the year is recognised in the in<strong>com</strong>e statement,
36<br />
<strong>DFDS</strong> ACCOUNTING POLICIES<br />
and the tax expense relating to amounts directly recognised<br />
in equity is recognised directly in equity. The recognised tax<br />
expense relating to the extraordinary profit/loss for the year is<br />
allocated to this item whereas the remaining tax expense is<br />
allocated to the profit/ loss for the year from ordinary activities.<br />
Extraordinary in<strong>com</strong>e and expenses<br />
Extraordinary in<strong>com</strong>e and expenses <strong>com</strong>prise in<strong>com</strong>e and<br />
expenses that arise from events or transactions that are clearly<br />
distinct from the ordinary activities of the Group and which are<br />
not expected to recur frequently or regularly.<br />
Balance sheet<br />
Intangible assets<br />
Goodwill<br />
Goodwill is amortised over its estimated useful life determined on<br />
the basis of Management’s experience of the specific business<br />
areas. Goodwill is amortised on a straight-line basis over a<br />
maximum amortisation period of 20 years, longest for strategically<br />
acquired enterprises with long-term earnings profiles.<br />
Goodwill is subject to an annual impairment test. Goodwill<br />
is written down in the in<strong>com</strong>e statement to the recoverable<br />
amount if the carrying amount exceeds the recoverable amount.<br />
The recoverable amount is the net present value of expected<br />
future net in<strong>com</strong>e from the enterprise or activity to which the<br />
goodwill relates (value in use).<br />
The accounting treatment of the disposal of business<br />
areas, activities and enterprises to which goodwill relates is<br />
described under consolidated financial statements.<br />
Development projects<br />
Development projects, which primarily relate to the development<br />
of IT software, are recognised as intangible assets if the<br />
following criteria are met:<br />
• The projects are clearly defined and identifiable<br />
• The Group intends to use the projects<br />
• There is sufficient assurance that future earnings can cover<br />
development costs and administrative expenses<br />
• The cost can be reliably measured.<br />
Development projects which do not meet the above criteria<br />
are recognised as cost in the in<strong>com</strong>e statement.<br />
Capitalised development projects are recognised at<br />
cost less accumulated amortisation or recoverable amount, if<br />
this is lower. Cost includes costs of sub-suppliers, materials,<br />
direct wages and salaries and indirect production costs.<br />
Capitalised development projects are amortised on a<br />
straight-line basis after <strong>com</strong>pletion of the development project<br />
over the period where an inflow of economic benefits is<br />
expected. The amortisation period is normally 3-5 years,<br />
but in certain cases may be up to 10 years.<br />
Tangible assets<br />
Tangible assets are recognised at cost less accumulated<br />
depreciation and impairment.<br />
The cost of tangible assets includes costs of subsuppliers,<br />
materials, <strong>com</strong>ponents, direct wages and salaries<br />
and indirect costs of production. Interest paid from the time<br />
of payment until the date when the asset is available for use<br />
is included in cost. Cost also <strong>com</strong>prises gains and losses on<br />
transactions designated as hedges of tangible assets.<br />
Ships<br />
Rebuilding of ships is capitalised if the rebuilding involves<br />
safety-related measures, extension of useful life or improvement<br />
of earnings.<br />
The costs of other improvements and maintenance<br />
of the ships are recognised in the in<strong>com</strong>e statement as<br />
incurred. This also applies for ordinary mantenance performed<br />
during docking.<br />
The basis for depreciation is determined as the cost<br />
less expected residual value, cf. below for each type of ships.<br />
Impairment tests of ships are conducted annually.<br />
Ships are written down to recoverable amount if this is lower<br />
than the carrying amount. The recoverable amount is the higher<br />
of the net present value of the future net in<strong>com</strong>e expected from<br />
the ships (value in use) and the selling price. Value in use,<br />
which is determined on the basis of average cost of capital,<br />
WACC, is not determined for the individual ship but for the<br />
line that the ship sails. The recoverable amount of ships,<br />
which the Company expects to dispose of, is the same as<br />
the selling price.<br />
Gains or losses on disposal of ships are determined<br />
as the difference between the selling price less selling costs<br />
and the carrying amount on the disposal date. Gains or losses<br />
on disposal of ships are recognised in the in<strong>com</strong>e statement<br />
in a separate line.<br />
Passenger ships<br />
Due to differences in the wear of passenger ship <strong>com</strong>ponents,<br />
the cost of passenger ships is divided into <strong>com</strong>ponents with<br />
minor wear, for example hulls and engines, and <strong>com</strong>ponents<br />
with hard wear, for example parts of the hotel and catering area.<br />
Rebuilding, which is capitalized as previously described,<br />
is depreciated over the remaining useful life of the <strong>com</strong>ponents<br />
relating to the rebuilding.<br />
The residual value of <strong>com</strong>ponents with minor wear<br />
and <strong>com</strong>ponents with hard wear is determined as 0 DKK for<br />
passenger ships.<br />
For passenger ships <strong>com</strong>ponents with hard wear are<br />
depreciated over 10-15 years <strong>com</strong>pared to <strong>com</strong>ponents with<br />
minor wear that are depreciated over the remaining useful<br />
lives of the ships determined on the basis of a separate<br />
assessment of the individual ship. Components with minor<br />
wear are depreciated over 30-34 years calculated from the<br />
year the ship was built.
Freight- and ro/pax ships<br />
Cost related to freight- and ro/pax ships is not divided as the<br />
wear of the <strong>com</strong>ponents for these ships is broken down over<br />
the useful lives of the ships.<br />
Rebuilding, which is capitalized as previously described,<br />
is depreciated over the remaining useful lives of the ships.<br />
The residual value is determined as a percentage of<br />
the ships’ cost depending on the age of the ship at acquisition.<br />
Depreciation for freight- and ro/pax ships is provided<br />
on a straight-line basis over 25 years from the year the ship<br />
was built. As regards ships older than 20 years an individual<br />
annual assessment is made of the remaining useful lives of<br />
the ships and the residual value. The maximum useful life for<br />
freight- and ro/pax ships is 31 years.<br />
Other tangible assets<br />
Other tangible assets <strong>com</strong>prise buildings, terminals and<br />
machinery, tools and equipment.<br />
Operating equipment with a cost of acquisition below<br />
DKK 50,000 are depreciated in full in the year of acquisition.<br />
The basis for depreciation is determined as the cost<br />
less the expected residual value at the time of disposal.<br />
Depreciation is provided on a straight-line basis over the<br />
expected useful lives of the assets.<br />
The expected useful lives are as follows:<br />
Buildings 25-50 years<br />
Terminals, etc. 10-40 years<br />
Machinery, tools and equipment 4-7 years<br />
Other tangible assets are written down to the recoverable<br />
amount if this is lower than the carrying amount.<br />
Gains or losses on the disposal of other tangible assets<br />
are determined as the difference between the selling price less<br />
disposal costs and the carrying amount at the date of disposal.<br />
The gains or losses are recognised in the in<strong>com</strong>e statement as<br />
other operating in<strong>com</strong>e or other costs of operation, sale and<br />
administration, respectively.<br />
Investments in group enterprises and associates<br />
Investments in group enterprises and associates are measured<br />
in the balance sheet at the proportionate share of the enterprises’<br />
net asset values calculated in accordance with the<br />
accounting policies of the parent <strong>com</strong>pany adjusted for unamortised<br />
goodwill, negative goodwill not recognised as in<strong>com</strong>e<br />
and unrealised intra-group profits and losses.<br />
Group enterprises and associates with negative net<br />
asset values are measured at DKK 0 (nil), and any amounts<br />
owed by such enterprises are written down by the group<br />
<strong>com</strong>panies’ share of the negative net asset value. Where the<br />
<strong>DFDS</strong> ACCOUNTING POLICIES 37<br />
negative net asset value exceeds the amount owed, the<br />
remaining amount is recognised under provisions if the parent<br />
<strong>com</strong>pany or other group <strong>com</strong>panies have issued guarantees<br />
or other letters of indemnity toward the trading partners of<br />
the <strong>com</strong>pany.<br />
Net revaluation of investments in group enterprises<br />
and associates is transferred to the reserve for net revaluation<br />
in equity according to the equity method to the extent that the<br />
carrying amount exceeds cost.<br />
Other investments are recognised at fair value. If fair<br />
value cannot be determined, other investments are measured<br />
at cost as the Company, due to nature of the other investments,<br />
cannot measure the fair value of separate <strong>com</strong>ponents or<br />
calculate the net present value.<br />
Inventories<br />
Inventories, including catering supplies and bunkers, are<br />
measured at cost based on the FIFO method or the net realisable<br />
value if this is lower.<br />
Receivables<br />
Receivables are recognised at amortised cost. Write-down is<br />
made for bad debt losses.<br />
Securities<br />
Securities are recognised at fair value, which for listed securities<br />
is the marked price on the balance sheet date.<br />
Equity<br />
Dividends<br />
Proposed dividends are recognised as a liability at the date<br />
when they are adopted at the annual general meeting. The<br />
expected dividend payment for the year is disclosed as a<br />
separate item under equity.<br />
Treasury shares<br />
The cost of acquisition and consideration received from treasury<br />
shares are recognised directly as retained earnings in equity<br />
on the date of acquisition or disposal. Accordingly, gains and<br />
losses on disposal are not recognised in the in<strong>com</strong>e statement.<br />
Holdings of treasury shares are recognised in the balance<br />
sheet at zero value.<br />
Provisions<br />
Provisions are recognised in the balance sheet at fair value.<br />
Pensions<br />
Provision is made for pension benefits for which the Company<br />
is liable. Other pension benefits are recognised in the in<strong>com</strong>e<br />
statement as they are provided.<br />
Other provisions<br />
Other provisions are recognised when, as a result of past events,<br />
the Group has a legal or a constructive obligation and it is
38<br />
<strong>DFDS</strong> ACCOUNTING POLICIES<br />
probable that there may be an outflow of resources embodying<br />
economic benefits to settle the obligation.<br />
Financial liabilities<br />
Amounts owed to mortgage credit institutions and banks, relating<br />
to loans which the Group expects to hold to maturity, are recognised<br />
at the date of borrowing at the net proceeds received less<br />
transaction costs paid. In subsequent periods, the financial<br />
liabilities are measured at amortised cost, corresponding to the<br />
capitalised value using the effective interest rate. Accordingly,<br />
the difference between the proceeds and the nominal value is<br />
recognised in the in<strong>com</strong>e statement over the term of the loan.<br />
Other liabilities, which include trade payables and amounts<br />
owed to group enterprises, are recognised at amortised cost.<br />
Corporate tax<br />
Current tax payable and receivable is recognised in the<br />
balance sheet as tax <strong>com</strong>puted on the taxable in<strong>com</strong>e and<br />
tonnage taxation for the year. Current tax payable for the jointly<br />
taxed <strong>com</strong>panies is recognised in the parent <strong>com</strong>pany’s financial<br />
statements.<br />
Deferred tax is measured on all temporary differences<br />
between the carrying amount and the tax base of assets and<br />
liabilities. However, deferred tax is not recognised on temporary<br />
differences relating to goodwill, which is not deductible for tax<br />
purposes, where temporary differences arise at the date of<br />
acquisition without affecting either profit/loss for the year or<br />
taxable in<strong>com</strong>e.<br />
Deferred tax relating to assets and liabilities subject to<br />
tonnage taxation is recognised to the extent that deferred tax is<br />
expected to occur.<br />
Deferred tax assets are recognised at the expected<br />
value of their utilisation. Adjustment is made to deferred tax<br />
resulting from elimination of unrealised intra-group profits<br />
and losses.<br />
Deferred tax is measured on the basis of the expected<br />
use and settlement of the individual assets and liabilities and<br />
according to the tax rules and at the tax rates applicable at the<br />
balance sheet date when the deferred tax is expected to crystallise<br />
as current tax. The Danish tax rate is 30%. The tax rates<br />
for foreign <strong>com</strong>panies range from 15 to 40%. The change in<br />
deferred tax as a result of changes in tax rates is recognised in<br />
the in<strong>com</strong>e statement.<br />
Derivative financial instruments<br />
Derivative financial instruments are initially recognised in the<br />
balance sheet at cost and are subsequently measured at fair value.<br />
Positive and negative fair values of derivative financial instruments<br />
are recognised in other receivables and payables, respectively.<br />
Changes in the fair value of derivative financial instruments<br />
designated as and qualifying for recognition as a hedge<br />
of the fair value of a recognised asset or liability are recognised<br />
in the in<strong>com</strong>e statement together with changes in the value of<br />
the hedged asset or liability.<br />
Changes in the fair value of derivative financial instruments<br />
designated as and qualifying for recognition as a hedge of<br />
future assets or liabilities are recognised directly in equity.<br />
In<strong>com</strong>e and expenses relating to such hedging transactions<br />
are transferred from equity on realisation of the hedged item<br />
and recognised in the same item as the hedged item.<br />
For derivative financial instruments that do not qualify<br />
for hedge accounting, changes in fair value are recognised in<br />
the in<strong>com</strong>e statement when they occur.<br />
Segment information<br />
The Group’s risks and its internal financial management relate<br />
primarily to the divisions <strong>DFDS</strong> Seaways and <strong>DFDS</strong> Tor Line.<br />
Consequently, segment information is disclosed for these<br />
divisions and <strong>com</strong>plies with the Group’s accounting policies.<br />
Cash flow statement<br />
The cash flow statement has been prepared according to the<br />
indirect method and shows the consolidated cash flows from<br />
operating, investing, and financing activities for the year, and<br />
the consolidated cash and cash equivalents at the beginning<br />
and end of the year.<br />
The cash flow effect of acquisition and disposal of enterprises<br />
is shown separately in cash flows from investing activities.<br />
Cash flows from acquisitions of enterprises are recognised in the<br />
cash flow statement from the date of acquisition. Cash flows<br />
from disposal of enterprises are recognised up until the date<br />
of disposal.<br />
Cash flows from operating activities<br />
Cash flows from operating activities are calculated on the basis of<br />
the profit/loss before amortisation and depreciation and financing,<br />
net and adjusted for non-cash operating items, changes in<br />
working capital, payments relating to financial and extraordinary<br />
items and corporation tax paid.<br />
Cash flows from investing activities<br />
Cash flows from investing activities <strong>com</strong>prise payments in<br />
connection with acquisitions and disposal of enterprises<br />
and activities and of intangible assets, tangible assets and<br />
investments.<br />
Cash flows from financing activities<br />
Cash flows from financing activities <strong>com</strong>prise changes in the<br />
size or <strong>com</strong>position of the Group’s share capital, payment of<br />
dividends to shareholders and the raising and repayment of<br />
mortgage loans and other long-term and short-term debt.<br />
Cash and cash equivalents<br />
Cash and cash equivalents <strong>com</strong>prise cash and securities.
<strong>DFDS</strong> In<strong>com</strong>e statement<br />
Parent Company Consolidated<br />
DKK ‘000 DKK ‘000<br />
2001 2002 Note In<strong>com</strong>e statement 2002 2001<br />
In<strong>com</strong>e:<br />
37,763 48,625 1 Revenue 4,870,047 4,309,489<br />
120,000 0 Profit on disposal of ships, buildings, and terminals -13,677 165,747<br />
157,763 48,625 Total in<strong>com</strong>e 4,856,370 4,475,236<br />
Costs:<br />
0 0 Operating costs related to ships -2,388,092 -2,137,486<br />
-32,727 -48,696 2 Staff costs -1,160,136 -1,060,817<br />
-32,687 -34,689 3,4 Other costs of operation, sales, and administration -540,021 -495,736<br />
-65,414 -83,385 Total costs -4,088,249 -3,694,039<br />
92,349 -34,760 Operating profit before depreciation (EBITDA) 768,121 781,197<br />
8,9 Depreciation and impairment<br />
0 0 Ships -568,024 -373,438<br />
-1,881 -1,271 Other fixed assets -80,816 -82,638<br />
-1,881 -1,271 Total depreciation and impairment -648,840 -456,076<br />
90,468 -36,031 Operating profit (EBITA) 119,281 325,121<br />
132,804 -37,334 Profit before tax, group enterprises 0 0<br />
0 0 8,20 Goodwill amortization and impairment -5,485 -1,363<br />
65,728 43,455 5 Financing, net -132,608 -32,577<br />
289,000 -29,910 Profit before tax and extraordinary items -18,812 291,181<br />
-38,427 335,450 6 Tax on profit from ordinary activities 335,369 -38,427<br />
250,573 305,540 Profit before extraordinary items and minority interests 316,557 252,754<br />
0 -116,471 7 Extraordinary items after tax -116,471 0<br />
250,573 189,069 Profit for the year before minority interests 200,086 252,754<br />
0 0 Minority interests’ share of the profit for the year -11,017 -2,181<br />
250,573 189,069 <strong>DFDS</strong> A/S’ share of the profit for the year 189,069 250,573<br />
Proposed profit appropriation<br />
72,000 56,000 Proposed dividends, DKK 7 per share (2001: DKK 9 per share)<br />
-4,257 -3,311 Dividends, treasury shares<br />
182,830 136,380 Retained earnings<br />
250,573 189,069<br />
<strong>DFDS</strong> GROUP ACCOUNTS 39
40<br />
<strong>DFDS</strong> GROUP ACCOUNTS<br />
<strong>DFDS</strong> Balance sheet for the year ended 31 December<br />
Parent Company Consolidated<br />
DKK ‘000 DKK ‘000<br />
2001 2002 Note Assets 2002 2001<br />
Fixed assets:<br />
Intangible assets:<br />
0 0 Goodwill 84,855 21,784<br />
0 0 Development projects 4,011 7,672<br />
0 0 Development projects in progress 13,051 1,300<br />
0 0 8 Intangible assets 101,917 30,756<br />
Tangible assets:<br />
2,626 2,268 Buildings 44,202 49,738<br />
0 0 Terminals 101,927 91,979<br />
0 0 Ships 4,857,566 4,617,083<br />
3,272 1,187 Machinery, tools and equipment 175,016 225,463<br />
770 2,394 Work in progress and prepayments 183,300 98,818<br />
6,668 5,849 9 Tangible assets 5,362,011 5,083,081<br />
Investments:<br />
1,611,302 1,862,488 10 Investments in group enterprises 0 0<br />
400,000 400,000 10 Amounts owed by group enterprises 0 0<br />
0 0 9 Investments in associates 3,955 6,911<br />
17,737 18,409 9 Other investments 28,906 158,529<br />
2,029,039 2,280,897 Investments 32,861 165,440<br />
2,035,707 2,286,746 Total fixed assets 5,496,789 5,279,277<br />
Current assets:<br />
0 0 Inventories 65,066 66,645<br />
Receivables<br />
409 2,545 Trade receivables 355,585 416,052<br />
352,423 624,573 Amounts owed by group enterprises 0 0<br />
0 0 Amounts owed by associates 2,937 17,358<br />
253,326 239,799 11 Other receivables 365,539 398,087<br />
0 0 15 Deferred tax assets 8,116 6,672<br />
5,562 528 Prepayments 22,673 35,831<br />
611,720 867,445 Receivables 754,850 874,000<br />
239 32 Securities 37 244<br />
230,211 805 12 Cash at bank and in hand 565,165 616,937<br />
842,170 868,282 Total current assets 1,385,118 1,557,826<br />
2,877,877 3,155,028 Total assets 6,881,907 6,837,103
Parent Company Consolidated<br />
DKK ‘000 DKK ‘000<br />
2001 2002 Note Equity and liabilities 2002 2001<br />
Equity:<br />
800,000 800,000 Share capital 800,000 800,000<br />
519,753 519,753 Share premium 519,753 519,753<br />
5,297 0 Revaluation reserve 0 5,297<br />
218,608 544,068 Reserve for net revaluation according to equity method 0 0<br />
928,975 687,426 Retained earnings 1,231,494 1,147,583<br />
67,743 52,689 Proposed dividends 52,689 67,743<br />
2,540,376 2,603,936 13 Equity 2,603,936 2,540,376<br />
0 0 14 Minority interests 146,472 139,600<br />
Provisions:<br />
41,513 47,091 15 Deferred tax 113,762 463,998<br />
12,999 15,892 16 Pensions 18,663 19,582<br />
0 0 17 Other provisions 56,445 27,437<br />
54,512 62,983 Provisions 188,870 511,017<br />
Liabilities other than provisions:<br />
Long-term liabilities other than provisions:<br />
0 0 Mortgage debt 17,217 18,973<br />
0 0 Mortgages on ships 2,648,807 2,279,383<br />
0 0 Other long-term liabilities other than provisions 60,699 49,028<br />
0 0 18 Long-term liabilities other than provisions 2,726,723 2,347,384<br />
Short-term liabilities other than provisions:<br />
22,493 30,658 Bank loans and overdrafts 30,717 69,411<br />
4,433 4,431 Trade payables 295,234 296,797<br />
9,316 0 18 Next year’s repayment on long-term liabilities other than provisions 332,936 478,405<br />
209,782 289,510 Amounts owed by group <strong>com</strong>panies 0 0<br />
473 354 Corporate tax 18,393 37,471<br />
36,492 128,924 19 Other payables 379,495 300,607<br />
0 34,232 20 Deferred in<strong>com</strong>e 159,131 116,035<br />
282,989 488,109 Short-term liabilities other than provisions 1,215,906 1,298,726<br />
282,989 488,109 Total liabilities other than provisions 3,942,629 3,646,110<br />
2,877,877 3,155,028 Total equity and liabilities 6,881,907 6,837,103<br />
Assets pledged as securities, etc., see Notes 9 and 18.<br />
Guarantees, etc., see Note 23.<br />
Contractual <strong>com</strong>mitments and financial transactions, see Notes 21 and 24<br />
Related parties, see Note 25<br />
<strong>DFDS</strong> GROUP ACCOUNTS 41<br />
<strong>DFDS</strong> Balance sheet for the year ended 31 December
42<br />
<strong>DFDS</strong> GROUP ACCOUNTS<br />
Statement of changes in equity – Consolidated<br />
Share Share Revaluation Retained Proposed<br />
DKK ‘000 capital premium reserve earnings dividends Total<br />
Equity at 1. January 2001 800,000 519,753 86,890 973,895 0 2,380,538<br />
Effect of changed accounting policies<br />
at 1 January 2001 0 0 0 5,814 1,763,327 1,769,141<br />
Restated equity at 1 January 2001 800,000 519,753 86,890 979,709 1,763,327 4,149,679<br />
Distributed dividends 0 0 0 0 -1,763,327 -1,763,327<br />
Profit for the year 0 0 0 250,573 0 250,573<br />
Proposed dividends 0 0 0 -72,000 72,000 0<br />
Dividends treasury shares 0 0 0 4,257 -4,257 0<br />
Acquisition of treasury shares 0 0 0 -37,558 0 -37,558<br />
Reversal of revaluation of buildings on disposal 0 0 -75,405 75,405 0 0<br />
Reversal of unrealised gains on securities 0 0 -6,188 6,188 0 0<br />
Foreign exchange adjustment relating to foreign<br />
<strong>com</strong>panies’ equity at 1 January 2001 0 0 0 -37,948 0 -37,948<br />
Effect of difference between year-end and average<br />
rates on profit 0 0 0 -2,200 0 -2,200<br />
Value adjustment of hedging instruments 0 0 0 -19,523 0 -19,523<br />
Adjustments 0 0 0 680 0 680<br />
Equity at 1. January 2002 800,000 519,753 5,297 1,147,583 67,743 2,540,376<br />
Distributed dividends 0 0 0 0 -67,743 -67,743<br />
Profit for the year 0 0 0 189,069 0 189,069<br />
Proposed dividends 0 0 0 -56,000 56,000 0<br />
Dividends treasury shares 0 0 0 3,311 -3,311 0<br />
Reversal of unrealised gains on securities 0 0 -5,297 5,297 0 0<br />
Foreign exchange adjustment relating to foreign<br />
<strong>com</strong>panies’ equity at 1 January 2002 0 0 0 6,034 0 6,034<br />
Effect of difference between year-end and average<br />
rates on profit 0 0 0 1,517 0 1,517<br />
Value adjustment of hedging instruments 0 0 0 -65,173 0 -65,173<br />
Adjustments 0 0 0 -144 0 -144<br />
Equity at 31 December 2002 800,000 519,753 0 1,231,494 52,689 2,603,936
<strong>DFDS</strong> GROUP ACCOUNTS 43<br />
Statement of changes in equity – Parent Company<br />
Net<br />
revaluation<br />
according to<br />
Share Share Revaluation the equity Retained Proposed<br />
DKK ‘000 capital premium reserve method earnings dividends Total<br />
Equity at 1. January 2001 800,000 519,753 86,890 306,620 667,275 0 2,380,538<br />
Effect of changed accounting policies<br />
at 1 January 2001 0 0 0 5,814 0 1,763,327 1,769,141<br />
Restated equity at 1 January 2001 800,000 519,753 86,890 312,434 667,275 1,763,327 4,149,679<br />
Distributed dividends 0 0 0 0 0 -1,763,327 -1,763,327<br />
Profit for the year 0 0 0 0 250,573 0 250,573<br />
Proposed dividends 0 0 0 0 -72,000 72,000 0<br />
Dividends treasury shares 0 0 0 0 4,257 -4,257 0<br />
Acquisition of treasury shares 0 0 0 0 -37,558 0 -37,558<br />
Reversal of revaluation of buildings<br />
on disposal 0 0 -75,405 0 75,405 0 0<br />
Reversal of unrealised gains<br />
on securities 0 0 -6,188 0 6,188 0 0<br />
Net revaluation according to the<br />
equity method 0 0 0 -93,826 93,826 0 0<br />
Foreign exchange adjustment relating<br />
to foreign <strong>com</strong>panies’ equity<br />
at 1 January 2001 0 0 0 0 -37,948 0 -37,948<br />
Effect of difference between year-end<br />
and average rates on profit 0 0 0 0 -2,200 0 -2,200<br />
Value adjustments of hedging instruments 0 0 0 0 -19,523 0 -19,523<br />
Adjustments 0 0 0 0 680 0 680<br />
Equity at 1 January 2002 800,000 519,753 5,297 218,608 928,975 67,743 2,540,376<br />
Distributed dividends 0 0 0 0 0 -67,743 -67,743<br />
Profit for the year 0 0 0 0 189,069 0 189,069<br />
Proposed dividends 0 0 0 0 -56,000 56,000 0<br />
Dividends treasury shares 0 0 0 0 3,311 -3,311 0<br />
Reversal of unrealised gains<br />
on securities 0 0 -5,297 0 5,297 0 0<br />
Net revaluation according to the<br />
equity method 0 0 0 325,460 -325,460 0 0<br />
Foreign exchange adjustment relating<br />
to foreign <strong>com</strong>panies’ equity<br />
at 1 January 2002 0 0 0 0 6,034 0 6,034<br />
Effect of difference between year-end<br />
and average rates on profit 0 0 0 0 1,517 0 1,517<br />
Value adjustments of hedging instruments 0 0 0 0 -65,173 0 -65,173<br />
Adjustments 0 0 0 0 -144 0 -144<br />
Equity at 31 December 2002 800,000 519,753 0 544,068 687,426 52,689 2,603,936
44<br />
<strong>DFDS</strong> GROUP ACCOUNTS<br />
<strong>DFDS</strong> Consolidated Cash Flow Statement<br />
DKK ‘000 Note 2002 2001<br />
Profit before depreciation (EBITDA) 768,121 781,197<br />
Adjustments for non-cash operating items 41,766 -169,354<br />
Net change in cash and cash equivalents:<br />
Receivables and inventories 113,091 230,191<br />
Payables including other short-term liabilities other than provisions -53,692 -127,172<br />
Taxes paid -37,244 -26,775<br />
Cash flows from operating activities before financing and extraordinary items 832,042 688,087<br />
Financing, net -122,828 -32,577<br />
Cash flows from operating activities 709,214 655,510<br />
Investments in:<br />
Ships -652,129 -1,374,054<br />
Buildings and terminals -47,765 -35,948<br />
Operating equipment -43,826 -60,628<br />
Intangible assets, etc. -11,751 -15,071<br />
Deposit related to acquisition of enterprise -10,498 -140,792<br />
Acquisition of <strong>com</strong>panies 22 -3,664 -372,092<br />
Acquisition of minority interests -31,088 0<br />
Associates -157 -4,934<br />
Total investments -800,878 -2,003,519<br />
Disposal of fixed assets:<br />
Ships 325,937 135,875<br />
Buildings and terminals 20,337 220<br />
Operating equipment 32,520 28,725<br />
Payment relating to adjustment of acquisition price for disposal of <strong>com</strong>panies -74,000 0<br />
Total disposal of fixed assets 304,794 164,820<br />
Cash flows from investing activities -496,084 -1,838,699<br />
Repayment and redemptions of mortgages on ships -481,890 -145,526<br />
Repayment and redemptions of other financial loans -33,993 -17,118<br />
Total repayments and redemptions -515,883 -162,644<br />
Proceeds from loans secured by mortgages on ships 360,000 672,396<br />
Proceeds from other financial loans 0 442<br />
Total proceeds from loans 360,000 672,838<br />
Change in operating credits etc. -38,694 676,405<br />
Acquisition of treasury shares 0 -37,558<br />
Dividends paid to shareholders -67,743 -1,763,327<br />
Other adjustments -5,801 -16,565<br />
Other financial items -112,238 -1,141,045<br />
Cash flows from financing activities -268,121 -630,851<br />
Cash flow from operating, investing and financing activities -54,991 -1,814,040<br />
Cash at bank and in hand and securities at 1 January 617,181 2,431,585<br />
Foreign exchange adjustment of cash at bank and in hand and securities at 1 January 3,012 -364<br />
Cash at bank and in hand and securities at 31 December 565,202 617,181<br />
The above cannot be derived directly from the in<strong>com</strong>e statement and the balance sheet
Notes<br />
Note 1 Segment information<br />
Activities Profit Value of<br />
DKK ‘000 Revenue before financing fixed assets Liabilities<br />
2002<br />
<strong>DFDS</strong> Seaways 2,266,800 127,227 2,083,369 2,204,334<br />
<strong>DFDS</strong> Tor Line 2,642,664 26,250 3,389,163 2,940,655<br />
Other 48,240 -36,104 424,257 938,527<br />
Eliminations -87,657 -3,577 -400,000 -1,952,017<br />
Total <strong>DFDS</strong> Group 4,870,047 113,796 5,496,789 4,131,499<br />
2001<br />
Profit Value of<br />
Revenue before financing fixed assets Liabilities<br />
<strong>DFDS</strong> Seaways 2,108,869 73,590 2,367,951 2,283,060<br />
<strong>DFDS</strong> Tor Line 2,237,684 159,773 2,886,921 2,559,809<br />
Other 37,703 90,395 424,405 334,145<br />
Eliminations -74,767 0 -400,000 -1,019,887<br />
Total <strong>DFDS</strong> Group 4,309,489 323,758 5,279,277 4,157,127<br />
In accordance with the transitional provisions in the Danish Financial Statements Act no segment information has been prepared for the secondary<br />
(geographic) segment.<br />
<strong>DFDS</strong> NOTES 45
46<br />
<strong>DFDS</strong> NOTES<br />
Notes<br />
Parent Company Consolidated<br />
DKK ‘000 DKK ‘000<br />
2001 2002 2002 2001<br />
Note 2 Staff costs<br />
31,712 41,762 Wages and salaries 1,001,391 904,247<br />
787 6,612 Pensions 43,729 35,620<br />
228 322 Social security costs, etc. 115,016 120,950<br />
32,727 48,696 1,160,136 1,060,817<br />
8,675 5,004 Remuneration and pensions to the parent <strong>com</strong>pany’s Executive Board 5,004 8,675<br />
1,361 1,657 Pensions to the parent <strong>com</strong>pany’s Executive Board 1,657 1,361<br />
1,013 2,000 Remuneration to the parent <strong>com</strong>pany’s Supervisory Board 2,000 1,013<br />
55 66 Average number of employees 4,070 4,187<br />
Part of the amount paid in remuneration and pensions to the parent <strong>com</strong>pany’s Executive Board has been recharged to other group <strong>com</strong>panies. No unusual<br />
agreements have been entered into with the Executive Board relating to pension and severance terms.<br />
<strong>DFDS</strong> has established a share option scheme for 22 present and former employees. The share option scheme includes 170,840 shares in <strong>DFDS</strong> A/S,<br />
of which 36,270 options at a price of 363 - 443 can be exercised from 1 March 2002 and till 6 weeks after the publication of the financial statements for 2003,<br />
88,070 options at a price of 144 - 151 that can be exercised from 1 March 2004 and till 6 weeks after the publication of the financial statements 2005, and<br />
46,500 options at a price of 150 that can be exercised from 1 March 2005 and till 6 weeks after the publication of the financial statements for 2006.<br />
Executive board Executive employees Other employees Total<br />
Number Fair value Number Fair value Number Fair value Number Fair value<br />
Allotted in 1999, at a price of 363-443 0 0 0 0 36,270 1 36,270 1<br />
Allotted in 1999, at a price of 144-151 23,400 382 14,625 239 9,945 162 47,970 783<br />
Allotted in 2001, at a price of 144-151 11,800 219 20,800 387 7,500 139 40,100 745<br />
Allotted in 2002, at a price of 150 15,000 283 31,500 595 0 0 46,500 878<br />
Total 50,200 884 66,925 1,221 53,715 302 170,840 2,407<br />
At 31 December 2002 no allotted share options have been exercised.<br />
The fair value of the share options at 31 December 2002 is measured using the Black-Scholes model. Calculations are based on a volatility of 22,5%,<br />
dividends of DKK 6 per share and a risk-free interest rate of 4,6%.<br />
Note 3 Other costs of operation, sales, and administration<br />
8,233 10,313 Operating costs, land-based activities 100,575 69,048<br />
0 0 Selling costs, external 210,899 201,893<br />
24,454 24,376 Other costs 228,547 224,795<br />
32,687 34,689 540,021 495,736<br />
Note 4 Fees paid to auditors appointed at the annual general meeting<br />
1,900 2,480 Fees, KPMG C. Jespersen 7,142 6,101<br />
Fees, State Authorised Public Accountants Torgny Pahle and<br />
300 300 Morten Egelund 300 300<br />
1,600 2,222 Fees for non-audit services, KPMG C. Jespersen 4,248 3,156<br />
Fees for non-audit services, State Authorised Public Accountants<br />
0 0 Torgny Pahle and Morten Egelund 0 0
Notes<br />
Parent Company Consolidated<br />
DKK ‘000 DKK ‘000<br />
2001 2002 2002 2001<br />
Note 5 Financing, net<br />
Interest in<strong>com</strong>e and similar items<br />
0 0 Share of profit/loss in associates 3,319 2,972<br />
16,473 67,115 Foreign exchange gains 95,704 56,276<br />
57,559 69,525 Interest in<strong>com</strong>e from group enterprises 0 0<br />
56,342 8,656 Interest in<strong>com</strong>e 19,617 69,920<br />
130,374 145,296 Total interest in<strong>com</strong>e and similar items 118,640 129,168<br />
Interest expenses and similar items<br />
-20,817 -63,993 Foreign exchange losses -78,971 -23,750<br />
-35,006 -25,618 Interest expense for group enterprises 0 0<br />
-6,416 -12,071 Interest expense -170,019 -133,312<br />
-2,407 -159 Other interest expense and similar items -2,258 -4,683<br />
-64,646 -101,841 Total interest expenses and similar items -251,248 -161,745<br />
65,728 43,455 Financing, net -132,608 -32,577<br />
The Group’s foreign exchange gains in 2001 include a gain of DKK 7 million concerning cancellation of interest swaps that are not related to a specific loan.<br />
<strong>DFDS</strong> A/S makes forward exchange transactions etc. on behalf of all group <strong>com</strong>panies and, therefore, exchange gains and losses in <strong>DFDS</strong> A/S regard the<br />
group’s gross transactions. Transactions entered into on behalf of subsidiaries are transferred to the subsidiaries on back-to-back terms.<br />
Note 6 Tax<br />
No Danish tax was paid in the parent <strong>com</strong>pany in 2002, and the <strong>com</strong>pany has no tax liability for that year.<br />
<strong>DFDS</strong> NOTES 47<br />
-473 0 Current tax -13,211 -36,779<br />
-33,407 2,507 Current joint tax contribution 0 0<br />
0 0 Adjustment of deferred tax due to the transition to tonnage taxation 326,943 0<br />
4,821 -5,932 Deferred tax 27,626 -16,502<br />
4,216 -8,741 Adjustments of deferred tax, previous years 6,312 14,854<br />
-13,584 347,220 Tax, group enterprises 0 0<br />
-38,427 335,054 347,670 -38,427<br />
can be specified as follows:<br />
-38,427 335,450 Tax on profit/loss from ordinary activities 335,369 -38,427<br />
0 0 Tax on profit/loss from extraordinary activities 0 0<br />
-38,427 335,450 Tax on profit for the year 335,369 -38,427<br />
0 -396 Tax on changes in equity 12,301 0<br />
-38,427 335,054 Total tax for the year 347,670 -38,427<br />
Tax on profit/loss on ordinary activities can be specified as follows:<br />
-86,700 8,973 Tax on profit before tax and extraordinary items 5,644 -87,354<br />
Adjustment to <strong>com</strong>puted tax in foreign subsidiaries <strong>com</strong>pared<br />
12,407 -1,195 to the 30% tax rate -1,195 12,407<br />
Tax effect of:<br />
13,850 10,272 Adjustments, group enterprises 0 163<br />
-2,590 -18,284 Non-deductible items 14,787 1,113<br />
20,390 0 Profit on sale of building 0 20,390<br />
0 326,943 Adjustments due to tonnage tax 326,943 0<br />
0 0 Tonnage tax -4,498 0<br />
4,216 8,741 Adjustments of tax related to previous years -6,312 14,854<br />
-38,427 335,450 Effective tax 335,369 -38,427
48<br />
<strong>DFDS</strong> NOTES<br />
Notes<br />
Parent Company Consolidated<br />
DKK ‘000 DKK ‘000<br />
2001 2002 2002 2001<br />
Note 7 Extraordinary items after tax<br />
0 -116,471 Loss on sale of business activity -116,471 0<br />
0 0 Tax on extraordinary items 0 0<br />
0 -116,471 -116,471 0<br />
In February 2002, a case concerning settlement of the balance with DSV (De Sammensluttede Vognmænd A/S) regarding the disposal of <strong>DFDS</strong> Dan<br />
Transport was filed with the arbitration court by DSV. A settlement has subsequently been reached. Accordingly, the acquisition price is written down by<br />
DKK 220 million. After deduction of provisions made in <strong>DFDS</strong>, the settlement results in extraordinary expenses of DKK 116 million for <strong>DFDS</strong>.<br />
Note 8 Intangible assets<br />
Consolidated Development<br />
DKK ‘000 Goodwill Development projects projects in progress<br />
Balance at 1 January 2002 98,390 18,305 1,300<br />
Foreign exchange adjustments 2,420 0 0<br />
Additions 74,247 0 11,751<br />
Disposals -5,769 0 0<br />
Cost at 31 December 2002 169,288 18,305 13,051<br />
Balance at 1 January 2002 76,606 10,633 0<br />
Foreign exchange adjustments 1,958 0 0<br />
Amortisation 6,445 3,661 0<br />
Amortisation, disposal of assets -576 0 0<br />
Impairment and amortisation at 31 December 2002 84,433 14,294 0<br />
Carrying amount at 31 December 2002 84,855 4,011 13,051
Notes<br />
Note 9 Tangible assets and investments<br />
Machinery, Work in<br />
Consolidated tools and progress and Investments Other<br />
DKK ‘000 Buildings Terminals Ships equipment prepayments in associates investments<br />
Balance at 1 January 2002 63,665 226,904 6,930,385 520,453 98,818 4,042 158,529<br />
Foreign exchange adjustments 270 -7,269 79,759 -7,535 76 53 0<br />
Transferred to/from other items 2,712 0 24,314 0 -27,026 0 0<br />
Additions related to acquisitions 0 0 503,496 0 0 0 0<br />
Additions 0 28,232 560,177 43,826 111,487 157 11,169<br />
Disposals -8,647 -36,804 -948,687 -72,471 -55 -3,591 -140,792<br />
Cost at 31 December 2002 58,000 211,063 7,149,444 484,273 183,300 661 28,906<br />
Balance at 1 January 2002 13,927 134,925 2,313,302 294,990 0 0 0<br />
Foreign exchange adjustments -492 -2,275 8,382 -2,883 0 0 0<br />
Depreciation 1,665 12,076 418,024 63,414 0 0 0<br />
Impairment 0 0 150,000 0 0 0 0<br />
Depreciation on assets sold -1,302 -35,590 -597,830 -46,264 0 0 0<br />
Impairment and depreciation at<br />
31 December 2002 13,798 109,136 2,291,878 309,257 0 0 0<br />
Balance at 1 January 2002 0 0 0 0 0 2,869 0<br />
Disposals 0 0 0 0 0 301 0<br />
Profit 0 0 0 0 0 3,319 0<br />
Dividend from associates 0 0 0 0 0 -3,195 0<br />
Adjustments at 31 December 2002 0 0 0 0 0 3,294 0<br />
Carrying amount at 31 December 2002 44,202 101,927 4,857,566 175,016 183,300 3,955 28,906<br />
Interest recognised in cost<br />
at 1 January 2002 26,953 1,254<br />
Interest recognised for the year 2,372 1,573<br />
Interest recognised in cost<br />
at 31 December 2002 29,325 2,827<br />
Carrying amount of assessed Danish land<br />
and buildings, etc. 2,267 4,556<br />
Latest assessment of Danish land<br />
and buildings, etc. 6,190 9,920<br />
Carrying amount of assets pledged<br />
as securities 0 6,415 3,704,060<br />
Work in progress and prepayments include prepayments related to new buildings, DKK 97 million.<br />
The carrying amount of ships includes passenger ships, DKK 2,021 mio., of which amount DKK 582 mio. is related to <strong>com</strong>ponents with hard wear and<br />
DKK 1,439 mio. is related to <strong>com</strong>ponents with minor wear.<br />
<strong>DFDS</strong> NOTES 49
50<br />
<strong>DFDS</strong> NOTES<br />
Notes<br />
>>> Note 9 continued<br />
Parent Company Machinery, tools Other<br />
DKK ‘000 Buildings and equipment Work in progress investments<br />
Balance at 1 January 2002 3,408 16,521 770 17,737<br />
Additions 0 1,344 1,624 672<br />
Disposals -429 -3,233 0 0<br />
Costs at 31 December 2002 2,979 14,632 2,394 18,409<br />
Balance at 1 January 2002 782 13,249 0 0<br />
Depreciation 47 1,224 0 0<br />
Depreciation, disposal of assets -118 -1,028 0 0<br />
Impairment and depreciation at 31 December 2002 711 13,445 0 0<br />
Carrying amount at 31 December 2002 2,268 1,187 2,394 18,409<br />
Carrying amount of assessed Danish land and buildings, etc. 2,267<br />
Latest assessment of Danish land and buildings, etc. 6,190<br />
Carrying amount of assets pledged as securities 0<br />
Note 10 Investments in and amounts owed by group enterprises<br />
Investment in Amounts owed by<br />
DKK ‘000 group enterprises group enterprises<br />
Cost at 1 January 2002 1,385,598 400,000<br />
Adjustment of net revaluation related to subsidiaries -74,263 0<br />
Cost at 31 December 2002 1,311,335 400,000<br />
Accumulated revaluation at 1 January 2002 231,850<br />
Adjustment of revaluation at 1 January 2002 due to change in accounting policies -13,242<br />
Foreign exchange adjustments of group enterprises’ equity at 1 January 2002 6,034<br />
Effect of difference between year-end rate and average rates on profit 1,517<br />
Profit before tax, group enterprises -37,334<br />
Tax in group enterprises 347,220<br />
Value adjustment of hedging instruments recognised in equity -66,096<br />
Adjustment of net revaluation related to subsidiaries 74,263<br />
Other adjustments -144<br />
Accumulated revaluations at 31 December 2002 544,068<br />
Set-off of negative equity against receivables 7,085<br />
Carrying amount at 31 December 2002 1,862,488 400,000<br />
Adjustment of net revaluation related to subsidiaries relates to the subsidiaries that were demerged from <strong>DFDS</strong> A/S to <strong>DFDS</strong> Seaways A/S and<br />
<strong>DFDS</strong> Tor Line A/S at 1 January 2000.<br />
Note 11 Other receivables<br />
Of other receivables for the Group DKK 3 million falls due after one year (2001: DKK 222 million). For the parent <strong>com</strong>pany DKK 0 million falls due after one<br />
year (2001: DKK 215 million).<br />
Note 12 Cash at bank and in hand<br />
At 31 December 2002 cash at bank and in hand, DKK 243 million, was placed on deposit as security for mortgages on ships.
Notes<br />
Parent Company Consolidated<br />
DKK ‘000 DKK ‘000<br />
2001 2002 2002 2001<br />
Note 13 Equity<br />
The Company’s share capital, which is not divided into different classes of shares, is divided in 8,000,000 shares of DKK 100 each.<br />
The Company’s holding of treasury shares:<br />
Number of shares Number of shares<br />
162,990 472,990 Balance at 1 January 472,990 162,990<br />
310,000 0 Additions 0 310,000<br />
472,990 472,990 Treasury shares at 31 December 472,990 472,990<br />
57,657 65,457 Market value of treasury shares as of 31 December 65,457 57,657<br />
At the annual general meeting in April 2002 the Supervisory Board was authorised – until the annual general meeting 2003 – to acquire treasury shares<br />
at a nominal value totallng 10% af the Company’s share capital.<br />
The <strong>com</strong>pany has not acquired treasury shares in 2002. The Company’s holdings of treasury shares at 31 December 2002 is 472,990 shares, corresponding<br />
to 5,91% (2001: 5,91%) of the Company’s share capital. Treasury shares have among other things been acquired to cover share option scheme for 22<br />
present and former employees.<br />
The development in share capital is stated below:<br />
500,000 Share capital at 1 January 1998<br />
300,000 Capital increase in the autumn 1999<br />
800,000 Share capital at 31 December 2002<br />
Equity includes foreign exchange adjustments in subsidiaries as follows:<br />
0 Foreign exchange adjustments 1 January 2002<br />
6,034 Foreign exchange adjustment relating to foreign <strong>com</strong>panies’ equity 1 January 2002<br />
1,517 Effect of difference between year-end and average rates on profit<br />
7,551 Foreign exchange adjustments 31 December 2002<br />
Note 14 Minority interests<br />
Minority interests at 1 January 139,600 1,764<br />
Foreign exchange adjustments at 1 January 5,550 -6,936<br />
Share of profit for the year 11,017 2,181<br />
Addition 48,829 145,396<br />
Disposals -58,835 -2,842<br />
Foreign exchange adjustments 311 37<br />
Minority interests at 31 December 146,472 139,600<br />
Additions of minority interests for the year mainly relate to minority interests in <strong>DFDS</strong> Lys Line Rederi AS while disposal of minority interests for the year is<br />
due to <strong>DFDS</strong>’ additional acquisition of shares in AB LISCO Baltic Service.<br />
<strong>DFDS</strong> NOTES 51
52<br />
<strong>DFDS</strong> NOTES<br />
Notes<br />
Parent Company Consolidated<br />
DKK ‘000 DKK ‘000<br />
2001 2002 2002 2001<br />
Note 15 Deferred tax<br />
38,332 41,513 Deferred tax at 1 January 457,326 460,619<br />
0 0 Change in accounting policies at 1 January 0 -5,752<br />
38,332 41,513 457,326 454,867<br />
Adjustment of deferred tax due to the transition to<br />
0 0 tonnage taxation at 1 January -326,943 0<br />
-4,821 5,932 Deferred tax for the year -27,626 16,502<br />
8,002 -354 Adjustment, previous years 2,182 -9,909<br />
0 0 Acquisitions 0 1,627<br />
0 0 Foreign exchange adjustments, etc. 707 -5,761<br />
41,513 47,091 Deferred tax at 31 December 105,646 457,326<br />
Deferred tax concerns:<br />
0 0 Ships 6,749 336,277<br />
802 -1,052 Buildings, terminals, and operating equipment -4,122 823<br />
-10,005 -11,662 Provisions -12,302 -14,869<br />
50,716 1,247 Foreign subsidiaries 1,247 50,716<br />
0 -2,236 Tax deficit carried forward -47,440 0<br />
0 0 Reserves exempt from tax according to national legislation 82,779 102,701<br />
0 60,794 Other 78,735 -18,322<br />
41,513 47,091 105,646 457,326<br />
Deferred tax is recognised in the balance sheet by:<br />
0 0 Deferred tax asset -8,116 -6,672<br />
41,513 47,091 Deferred tax liability 113,762 463,998<br />
41,513 47,091 105,646 457,326<br />
By joining the tonnage taxation scheme, Danish shipping <strong>com</strong>panies are subject to the requirements of the scheme until 2012. The <strong>com</strong>panies are not<br />
expected to withdraw from the scheme and consequently no deffered tax relating to assets and liabilities subject to tonnage taxation has been provided for.<br />
If either <strong>DFDS</strong> Seaways A/S or <strong>DFDS</strong> Tor Line A/S withdraws from the tonnage taxation scheme, deferred tax of an amount not exceeding DKK 319 million<br />
may crystallise.
Notes<br />
Parent Company Consolidated<br />
DKK ‘000 DKK ‘000<br />
2001 2002 2002 2001<br />
Note 16 Pensions<br />
15,041 12,999 Balance at 1 January 2002 19,582 21,406<br />
0 0 Foreign exchange adjustments -557 262<br />
-528 -527 Used during the year -4,433 -528<br />
-2,072 0 Reversal of unused provisions 586 -3,829<br />
0 2,275 Provision for the year 2,358 131<br />
Change in present values for the year due to the<br />
558 1,145 passage of time etc. 1,127 2,140<br />
12,999 15,892 Pensions at 31 December 2002 18,663 19,582<br />
The pensions benefits are expected to be payable in:<br />
2,874 6,123 0 - 1 year 8,894 7,516<br />
6,059 5,839 1 - 5 years 5,839 6,059<br />
4,066 3,930 After 5 years 3,930 6,007<br />
12,999 15,892 18,663 19,582<br />
Note 17 Other provisions<br />
Balance at 1 January 2002 27,437 20,000<br />
Used during the year -2,437 0<br />
Reversal of unused provisions 0 -10,000<br />
Provisions for the year 31,445 17,437<br />
Other provisions at 31 December 2002 56,445 27,437<br />
Other provisions are expected to be payable in:<br />
0 - 1 year 7,514 9,895<br />
1 - 5 years 32,686 17,542<br />
After 5 years 16,245 0<br />
56,445 27,437<br />
Of the Group’s provisions DKK 17.5 million relate to the Group’s share of planned costs concerning warranty repairs on ships and DKK 38.9 million<br />
relate to costs decided on concerning implementation of the Group’s fleet strategy.<br />
<strong>DFDS</strong> NOTES 53
54<br />
<strong>DFDS</strong> NOTES<br />
Notes<br />
Parent Company Consolidated<br />
DKK ‘000 DKK ‘000<br />
2001 2002 2002 2001<br />
Note 18 Long-term liabilities other than provisions<br />
Mortgage debt<br />
0 0 Long-term 17,217 18,973<br />
9,316 0 Short-term 1,756 10,951<br />
9,316 0 Total mortgage debt 18,973 29,924<br />
Mortgages on ships<br />
0 0 Long-term 2,648,807 2,279,383<br />
0 0 Short-term 329,307 467,164<br />
0 0 Total mortgages on ships 2,978,114 2,746,547<br />
Other long-term liabilities<br />
0 0 Long-term 60,699 49,028<br />
0 0 Short-term 1,873 290<br />
0 0 Total other long-term liabilities 62,572 49,318<br />
Liabilities other than provsions are recognised in the<br />
balance sheet as follows:<br />
0 0 Long-term liabilities other than provisions 2,726,723 2,347,384<br />
9,316 0 Short-term liabilities other than provisions 332,936 478,405<br />
9,316 0 Total liabilities other than provsions 3,059,659 2,825,789<br />
9,778 0 Market value 3,084,387 2,852,495<br />
9,316 0 Nominal value 3,053,236 2,816,793<br />
Long-term liabilities falling due more than 5 years after the end<br />
0 0 of the financial year 1,232,965 1,063,313<br />
As security for mortgages on ships cash at bank and in hand of DKK 243 mio. is placed on deposit.<br />
The Group’s total liabilities includes:<br />
Interest rate at 31 December 2002, % p.a. Carrying amount<br />
Currency Expiry Interest 2002 2001 2002 2001<br />
DKK 2002 Variable 0.0 6.1 0 220,000<br />
DKK 2006 Fixed, non-callable 6.7 6.7 305,627 358,166<br />
DKK 2009-12 Variable * 4.1 4.4 1,540,000 1,277,500<br />
DKK 2010 Fixed 7.5 7.5 18,973 29,924<br />
EUR 2007-09 Variable 4.4 3.8 251,498 204,065<br />
GBP 2008 Variable 4.2 4.4 47,939 49,319<br />
NOK 2006-12 Variable 7.6 0.0 286,937 0<br />
SEK 2007-09 Variable * 4.6 4.6 608,685 686,815<br />
Long-term liabilities, including<br />
next year’s repayment total 3,059,659 2,825,789<br />
Average interest rate 4.9 4.8<br />
An interest rate hedge of DKK 1 billion has been entered into with a view to hedge part of the loans marked with * at a maximum interest of 6% and<br />
a minimum interest of 5%.<br />
Moreover, interest on future raising of loans for financing of new buildings from Flensburg Shipyard of DKK 1,2 billion is hedged by swap-agreements with<br />
interest rates of between 5.4% and 5.6%. The term of the swap-agreements is 12 years.
Notes<br />
Parent Company Consolidated<br />
DKK ‘000 DKK ‘000<br />
2001 2002 2002 2001<br />
Note 19 Other payables<br />
0 0 Accrued interest 30,851 31,245<br />
0 143 Public authorities 33,937 58,604<br />
5,241 8,220 Holiday pay obligations, etc. 103,930 77,817<br />
0 115,832 Hedging instruments 115,832 28,877<br />
31,251 4,729 Other 94,945 104,064<br />
36,492 128,924 379,495 300,607<br />
Note 20 Deferred in<strong>com</strong>e<br />
Negative goodwill specified below is included in the consolidated deferred in<strong>com</strong>e. In<strong>com</strong>e for the year related to negative goodwill has been<br />
set off against impairment and amortisation of goodwill.<br />
Negative goodwill<br />
Balance at 1 January 3,711 0<br />
Additions 31,763 3,711<br />
Cost at 31 December 35,474 3,711<br />
Balance at 1 January 93 0<br />
In<strong>com</strong>e for the year 960 93<br />
In<strong>com</strong>e at 31 December 1,053 93<br />
Carrying amount at 31 December 34,421 3,618<br />
Besides negative goodwill deferred in<strong>com</strong>e include payments on account related to passenger shipping and allocation of costs due to lack of<br />
suppliers’ invoices.<br />
<strong>DFDS</strong> NOTES 55
56<br />
<strong>DFDS</strong> NOTES<br />
Notes<br />
Items in the balance sheet stated in foreign currency<br />
Note 21 Currency and interest rate risks and derivative financial instruments applied<br />
The Group’s receivables and debtors as of 31 December 2002 classified by currency and hedged positions.<br />
Forward<br />
Currency Date of maturity Receivables Payables exchange contracts Net position<br />
EUR 0-1 year 303,889 -113,642 79,106 269,353<br />
More than 1 year 3,177 -220,421 0 -217,244<br />
USD 0-1 year 36,693 -31,062 157,225 162,856<br />
More than 1 year 12,536 0 0 12,536<br />
GBP 0-1 year 102,819 -62,593 68,851 109,077<br />
More than 1 year 0 -45,597 0 -45,597<br />
NOK 0-1 year 76,395 -61,455 153,020 167,960<br />
More than 1 year 0 -260,356 0 -260,356<br />
SEK 0-1 year 288,453 -190,625 -72,675 25,153<br />
More than 1 year 0 -538,317 0 -538,317<br />
LTL 0-1 year 23,701 -7,853 0 15,848<br />
PLN 0-1 year 3,283 -1,945 0 1,338<br />
DKK 0-1 year 432,977 -548,635 0 -115,658<br />
More than 1 year 0 -1,678,464 0 -1,678,464<br />
Other 0-1 year 5,303 -4,140 0 1,163<br />
1,289,226 -3,765,105 385,527<br />
The net position does not include net investments in foreign subsidiaries.<br />
Further, the Group’s contractual obligations (in EUR) concerning acquisitions of ships total DKK 1,511 million.<br />
Hedging of expected future transactions<br />
Deferred recognition of gain/losses in the in<strong>com</strong>e<br />
statement to be realised after the balance sheet date<br />
Expected future transactions Hedge instrument 0-1 year More than 1 year<br />
Goods purchased and sold Forward exchange contract -6,792 0<br />
Interests Interest swap* 0 -56,840<br />
Interests Interest rate option (collar) -17,070 -27,211<br />
Goods purchased Oil contract for forward delivery 10,917 0<br />
* Executed in connection with the delivery of new ships from Flensborg Shipyard.<br />
-12,945 -84,051
Notes<br />
>>> Note 21 continued<br />
Interest risks<br />
As regards the Group’s financial assets and liabilities the following reassessment and repayment dates are agreed on depending on which date falls due first.<br />
Reassessment/maturity date<br />
Of which carries a Effective<br />
Category 0-1 year 1-5 years More than 5 years fixed rate of interest rate of interest<br />
Trade receivables 352,830 2,755 0 0 0.0%<br />
Other receivables 365,539 0 0 0 0.0%<br />
Short-term liabilities -882,970 0 0 0 0.0%<br />
Mortgage debt -18,973 0 0 -18,973 7.5%<br />
Mortgages on ships -2,978,114 0 0 -305,627 4.8%<br />
Other long-term debt -62,572 0 0 0 4.4%<br />
Loan <strong>com</strong>mitment * -468,000 -702,000 0 0 0.0%<br />
Interest rate option (collar) 1,003,750 0 0 0 5.0%<br />
Interest swap (principal) variable * 468,000 702,000 0 0 0.0%<br />
Interest swap (principal) fixed 0 0 1,170,000 1,170,000 5.5%<br />
Total -2,220,510 2,755 1,170,000 845,400<br />
* Executed in connection with the delivery of new ships from Flensborg Shipyard.<br />
Acquisition of <strong>com</strong>panies:<br />
Note 22 Acquisition of <strong>com</strong>panies and activities<br />
Consolidated<br />
DKK ‘000<br />
<strong>DFDS</strong> NOTES<br />
2002 2001<br />
Intangible assets 0 23<br />
Tangible assets 503,496 506,459<br />
Investments in associates 0 555<br />
Inventories 0 9,538<br />
Receivables 13,898 53,668<br />
Prepayments 7 5,750<br />
Securities 1,424 0<br />
Cash at bank and in hand 8,553 97,724<br />
Minority interests -40,275 -145,396<br />
Negative deferred tax, net 0 1,627<br />
Long-term liabilities other than provisions -353,457 -209<br />
Short-term liabilities other than provisions -54,589 -61,832<br />
Corporate tax -295 -775<br />
Net assets 78,762 467,132<br />
Goodwill from acquisition of <strong>com</strong>panies and activities 74,247 6,395<br />
Negative goodwill 0 -3,711<br />
Acquisition price 153,009 469,816<br />
Of this amount, cash at bank and in hand -8,553 -97,724<br />
Cash acquisition price 144,456 372,092<br />
Acquisition price placed on deposit in 2001 -140,792 0<br />
Cash generated from acquisition of enterprises 3,664 372,092<br />
57
58<br />
<strong>DFDS</strong> NOTES<br />
Notes<br />
Note 23 Guarantees<br />
Guarantees amount to DKK 63.8 million (2001: DKK 79.5 mio.) for the Group.<br />
Guarantees amount to DKK 2,689.1 million (2001: DKK 2,780.3 mio.) for the Parent Company.<br />
As at 31 December 2002 the Group is party to a number of lawsuits. As 31 December 2002 the out<strong>com</strong>e of these lawsuits is not expected to affect<br />
the Group’s financial position apart from amounts recognised in the balance sheet.<br />
Parent Company Consolidated<br />
DKK ‘000 DKK ‘000<br />
2001 2002 2002 2001<br />
Note 24 Contractual <strong>com</strong>mitments<br />
The calculated net present value of contractual <strong>com</strong>mitments include:<br />
128,200 128,200 Rental contracts on land and buildings, term 1-108 years 159,900 165,000<br />
0 0 Contract for newbuildings 1,511,100 1,218,700<br />
0 0 Chartered ships 445,500 191,170<br />
Lease contracts on operating equipment consisting of containers,<br />
0 1,200 trailers, cranes, and vehicles, term 1-5 years 7,100 5,200<br />
0 0 Lease contracts on other operating equipment, term 1-7 years 5,900 6,000<br />
0 0 Lease of harbour terminals, term 12 years 596,800 462,500<br />
0 0 Other contractual <strong>com</strong>mitments, term 1-5 years 274,600 579,700<br />
128,200 129,400 3,000,900 2,628,270<br />
A discount factor of between 3.0% - 6.0% p.a. is applied at the <strong>com</strong>putation of net present values taking into account the term and geographic location ot the<br />
contractual obligations.<br />
In connection with the acquisition of LISCO, <strong>DFDS</strong> accepted an obligation to make investments in AB LISCO Baltic Service of USD 60 million before the end<br />
of 2004. The investments do not have to be by cash payment. Other contractual <strong>com</strong>mitments include <strong>DFDS</strong>’ outstanding obligation as at 31 December 2002,<br />
DKK 275 million. Furthermore, <strong>DFDS</strong> has accepted an obligation regarding employment of the employees.<br />
Note 25 Related parties<br />
The <strong>DFDS</strong> Group’s related parties exercising control are Vesterhavet A/S, Copenhagen, which holds more than 50% of the shares in <strong>DFDS</strong> A/S,<br />
and JL Fondet, Copenhagen, as the JL Fondet by statute exercises control over Vesterhavet A/S. The members of the Executive and Supervisory Boards<br />
of Vesterhavet A/S and JL Fondet are also related parties.<br />
Further, related parties <strong>com</strong>prise all <strong>com</strong>panies owned by JL Fondet, <strong>DFDS</strong>’ subsidiaries and associates cf. page 59, and these <strong>com</strong>panies’ Executive and<br />
Supervisory Boards, executive employees and close members of the family of those.<br />
Apart from intra-group balances, which are eliminated on consolidation, the usual Executive Board remuneration and Supervisory Board emoluments,<br />
and the below transactions, no related party transactions have been carried out during the year.<br />
Regarding J. Lauritzen A/S and Stena Tor Line HB, trade in 2001 and 2002 has primarily related to rendering of services and chartering of freight ship,<br />
respectively. Trade is conducted on arm’s length basis.<br />
Services rendered to related parties:<br />
DKK ‘000 2002 2001<br />
J. Lauritzen A/S 1,811 1,794<br />
Stena Tor Line HB 48,477 48,449
Group Companies<br />
<strong>DFDS</strong> GROUP COMPANIES 59<br />
Company Ownership Share * Country City Currency Share Capital<br />
<strong>DFDS</strong> A/S Denmark Copenhagen DKK 800,000,000<br />
<strong>DFDS</strong> (Bahamas) Ltd. Bahamas Nassau USD 1,000<br />
<strong>DFDS</strong> Tor Line NV Belgium Gent EUR 62,000<br />
<strong>DFDS</strong> Stevedoring A/S Denmark Esbjerg DKK 500,000<br />
<strong>DFDS</strong> Baltic Line A/S Denmark Copenhagen DKK 500,000<br />
<strong>DFDS</strong> Tor Line A/S Denmark Copenhagen DKK 125,000,000<br />
<strong>DFDS</strong> Seaways A/S Denmark Copenhagen DKK 150,000,000<br />
<strong>DFDS</strong> Canal Tours A/S Denmark Copenhagen DKK 1,000,000<br />
<strong>DFDS</strong> Seaways (Polen) A/S Denmark Copenhagen DKK 600,000<br />
<strong>DFDS</strong> Shipping Logistics A/S Denmark Copenhagen DKK 500,000<br />
<strong>DFDS</strong> Tor Line (Guernsey) Ltd. England Guernsey GBP 1,000<br />
<strong>DFDS</strong> Seaways Ltd. England Harwich GBP 8,050,000<br />
<strong>DFDS</strong> Tor Agencies Plc. England Harwich GBP 25,500,000<br />
<strong>DFDS</strong> Seaways Holding Ltd. England Harwich GBP 250,000<br />
<strong>DFDS</strong> Tor Line Ltd. England Immingham GBP 2,000,000<br />
<strong>DFDS</strong> Seaways BV Holland Ijmuiden EUR 18,000<br />
<strong>DFDS</strong> Tor Line BV Holland Rotterdam EUR 23,000<br />
<strong>DFDS</strong> Italia SRL Italy Genova EUR 77,000<br />
Latlines SIA Latvia Riga LVL 2,000<br />
AB LISCO Baltic Service 86.6 Lithuania Klaipeda LTL 323,907,000<br />
UAB Keltu Terminalas Lithuania Klaipeda LTL 100,000<br />
Laivyno Technikos Prieziuros Base Lithuania Klaipeda LTL 3,300,000<br />
UAB Krantas Travel Lithuania Klaipeda LTL 658,000<br />
UAB Krantas Shipping Lithuania Klaipeda LTL 1,850,000<br />
UAB LISCO Crew Lithuania Klaipeda LTL 110,000<br />
UAB <strong>DFDS</strong> Tor Line Lithuania Vilnius LTL 10,000<br />
<strong>DFDS</strong> Tor Line AS Norway Oslo NOK 200,000<br />
NorthSea Terminal AS Norway Oslo NOK 1,000,000<br />
<strong>DFDS</strong> Lys-Line Rederi AS 66 Norway Oslo NOK 24,990,000<br />
<strong>DFDS</strong> Norway Holding AS Norway Oslo NOK 12,000,000<br />
<strong>DFDS</strong> Seaways Spôlka z.o.o Poland Gdynia PLZ 50,000<br />
<strong>DFDS</strong> Tor Line Holding AB Sweden Gothenburg SEK 100,000<br />
<strong>DFDS</strong> Tor Line AB Sweden Gothenburg SEK 25,000,000<br />
<strong>DFDS</strong> Seaways AB Sweden Gothenburg SEK 2,050,000<br />
<strong>DFDS</strong> (Deutschland) GmbH Germany Hamburg EUR 102,000<br />
LISCO Baltic Service GmbH 51 Germany Kiel DEM 26,000<br />
<strong>DFDS</strong> Seaways Inc. USA Fort Lauderdale USD 100,000<br />
22 Inactive subsidiaries<br />
Associated <strong>com</strong>panies<br />
Westcoast Offshore Base A/S 50 Denmark Esbjerg DKK 1,000,000<br />
Stena Tor Line HB 50 Sweden Gothenburg SEK -<br />
UAB Krantas Forwarding 50 Lithuania Klaipeda LTL 100,000<br />
* Unless otherwise indicated, the <strong>com</strong>panies are 100% owned.
60<br />
<strong>DFDS</strong> GROUP FLEET<br />
<strong>DFDS</strong> Group Fleet<br />
as of 31 December 2002<br />
Passenger ships Year built GT Pass.<br />
Pearl of Scandinavia 1989/01 40039 2166<br />
Crown of Scandinavia 1994 35498 2110<br />
Queen of Scandinavia 1981/00 34093 1756<br />
Prince of Scandinavia 1975/91/97 22528 1614<br />
Princess of Scandinavia 1976/91/98 22528 1620<br />
Duke of Scandinavia 1978/00 19589 1241<br />
Ro-pax ships *) Year GT Lane Pass.<br />
built metres<br />
Dana Gloria 2002 20140 2494 302<br />
Dana Sirena 2002 20140 2494 302<br />
Mermaid II ***) 1972 13730 1094 93<br />
Transparaden ***) 1976 13700 1470 104<br />
Freight ships (ro-ro) Year built GT Lane<br />
metres<br />
Tor Scandia **) 1981 33652 2600<br />
Tor Flandria **) 1981 33652 2600<br />
Tor Selandia 1998 24196 2772<br />
Tor Suecia 1999 24196 2772<br />
Tor Britannia 2000 24196 2772<br />
Tor Dania 1978/95 21850 2562<br />
Tor Belgia 1978/94 21491 2562<br />
Tor Minerva 1978/99 21215 2070<br />
Tor Humbria 1978 20165 2128<br />
Tor Futura 1996/00 18725 2308<br />
Tor Anglia 1977/89 17492 2450<br />
Tor Baltica 1977/86 14374 1866<br />
Tor Maxima ***) 1978/95 17068 2723<br />
Stena Gothica***) 1975/90 14406 1950<br />
Tor Gothia ***) 1971/77 12259 1650<br />
Tor Hollandia ***) 1973/77 12254 1650<br />
Tor Cimbria ***) 1986 12189 2026<br />
Nor Hav ***) 1980 5846 1015<br />
Newbuildings to be No. GT Lane Pass.<br />
delivered in 2003/04 metres<br />
Duchess of Scandinavia**) 16794 620 840<br />
Flensburg newbuilding 721 30800 3900<br />
Flensburg newbuilding 722 30800 3900<br />
Flensburg newbuilding 723 30800 3900<br />
Flensburg newbuilding 724 30800 3900<br />
Flensburg newbuilding 725 30800 3900<br />
AB LISCO Baltic Service<br />
Ro-pax ships *) Year built GT Lane Pass.<br />
meters<br />
Kaunas 1989 25606 1500 235<br />
Vilnius 1987 22341 1500 120<br />
Klaipeda 1987 21890 1500 12<br />
Palanga 1979 11630 1140 126<br />
Ro-ro ships Year built GT Lane<br />
meters<br />
Tor Neringa 1975 12494 1745<br />
Panevezys 1985 6894 602<br />
Siauliai 1985 6894 602<br />
Container ships Year built GT TEU ****)<br />
Rasa 1998 3893 353<br />
Aukse 1997 3893 353<br />
Gediminas 1996 3097 264<br />
Vytautas 1995 3097 256<br />
Kestutis 1993 3972 221<br />
Jogaila 1992 3988 221
<strong>DFDS</strong> Lys-Line Rederi AS<br />
Sideport and container ships Year built GT TEU ****)<br />
Lysvik 1998 5656 112<br />
Lysbris 1999 5656 112<br />
Lysblink 2000 5656 112<br />
Lysfoss 1989/99 4471 56<br />
Lystind 1990/00 4471 56<br />
Lys-Skog 1991/98 4471 56<br />
Lyshav 1985 3176 38<br />
Lysholmen 1981/94 2876 44<br />
Lys Carrier ***) 1994 2446 176<br />
Lys Clipper ***) 1994 2456 176<br />
Lys Chris ***) 1993 2416 197<br />
Auriga ***) 1996 2460 176<br />
Aries ***) 1997 2456 176<br />
Atair ***) 1995 1864 82<br />
Algol ***) 1995 1864 82<br />
Antares ***) 1995 1864 82<br />
Alk ***) 1998 6362 700<br />
Merino ***) 1997 3999 523<br />
<strong>DFDS</strong> Canal Tours A/S<br />
Tourist boats Year built Boat type Passengers<br />
Ole Lukøje 2000 Restaurant<br />
boat, covered<br />
133<br />
Klods Hans 1998 Restaurant<br />
boat, covered<br />
133<br />
Snedronningen 1995 Covered 144<br />
Nattergalen 1994 Covered 144<br />
Gilleleje NB 14 2003 Open 168<br />
Tinsoldaten 2002 Open 168<br />
Moster 2001 Open 168<br />
Svinedrengen 1998 Open 168<br />
Fyrtøjet 1997 Open 168<br />
Skorstensfejeren 1996 Open 168<br />
Hyrdinden 1996 Open 168<br />
Den Grimme Ælling 1992 Open 168<br />
Tommelise 1991 Open 168<br />
Den Lille Havfrue 1989 Open 168<br />
HMF XIII 1953 Open 160<br />
HMF III 1949 Open 120<br />
*) Ro-pax: Combined ro-ro and passenger ship<br />
**) Bare-boat (B-B): Leased tonnage<br />
***) Chartered tonnage<br />
****) TEU: 20-foot equivalent unit<br />
Passenger ship: PEARL OF SCANDINAVIA<br />
Ro-pax-ship: DANA GLORIA<br />
Sideport and container ship: LYSFOSS<br />
Ro-ro-ship: TOR SELANDIA<br />
<strong>DFDS</strong> GROUP FLEET<br />
61
62<br />
<strong>DFDS</strong> COMMERCIAL DUTIES<br />
Commercial Duties<br />
The Supervisory Board<br />
of <strong>DFDS</strong> A/S<br />
Ivar Samrén (Chairman)<br />
Svend Jakobsen (Deputy Chairman)<br />
Ole Adamsen *)<br />
Claus Arnhild *)<br />
Anders Moberg<br />
Jill Lauritzen Melby<br />
Ingar Skaug<br />
Ib Sørensen *)<br />
*) Employee-elected<br />
The Executive Board<br />
of <strong>DFDS</strong> A/S<br />
Ole Frie, Presiding Director *)<br />
Christian Merrild, Chief Financial Officer *)<br />
*) Authorized to sign for the <strong>com</strong>pany<br />
Ole Frie<br />
Christian Merrild<br />
Ivar Samrén<br />
Svend Jakobsen<br />
Ole Adamsen<br />
Claus Arnhild
Jill Lauritzen Melby<br />
Anders Moberg<br />
Ingar Skaug<br />
Ib Sørensen<br />
Commercial duties for the Supervisory Board and<br />
Executive Board in Danish Limited Companies<br />
The Board of Directors<br />
Ivar Samrén, 64<br />
House of Business Partners A/S (Chairman)<br />
Egmont Fonden (Chairman)<br />
Egmont International Holding A/S (Chairman)<br />
Ejendomsselskabet Vognmagergade 11 Aps (Chairman)<br />
Ejendomsselskabet Gothersgade 55 Aps (Chairman)<br />
Otto Mønsted Aktieselskab A/S (board member)<br />
Ole Adamsen, 61<br />
Byggekram-Fuglebjerg Tømmerhandel A/S (board member)<br />
EKM Holding A/S (board member)<br />
Svend Jakobsen, 67<br />
N.P. Utzon A/S (Chairman)<br />
NTR Holding A/S (board member)<br />
Ejendomsaktieselskabet Hermes (board member)<br />
Lokalbanen A/S (Chairman)<br />
Anders Moberg, 53<br />
Lego A/S (board member)<br />
Velux A/S (board member)<br />
Ingar Skaug, 56<br />
J. Lauritzen A/S (board member)<br />
The Executive Board<br />
Ole Frie, 58<br />
Scanva Diesel A/S (board member)<br />
Eimskip Danmark A/S (board member)<br />
<strong>DFDS</strong> COMMERCIAL DUTIES<br />
63
64<br />
<strong>DFDS</strong> CORPORATE GOVERNANCE<br />
Corporate Governance at <strong>DFDS</strong><br />
The principles of corporate governance applied by <strong>DFDS</strong> are<br />
largely determined by the Danish Public Limited Companies<br />
Act, the Financial Statements Act, the rules and regulations of<br />
the Copenhagen Stock Exchange as well as <strong>DFDS</strong>’ Articles of<br />
Association, rules of procedure and other internal policies. The<br />
following is an outline of the most important principles relating<br />
to the exercise of corporate governance at <strong>DFDS</strong>.<br />
Corporate governance, shareholders<br />
and the Annual General Meeting<br />
<strong>DFDS</strong> regularly assesses initiatives that facilitate be<strong>com</strong>ing a<br />
shareholder of <strong>DFDS</strong> A/S and exercising the attendant rights.<br />
The share denomination was therefore reduced in 1999 from<br />
DKK 1,000 to DKK 100.<br />
The Articles of Association of <strong>DFDS</strong> do not contain any<br />
restrictions on voting rights as each share of DKK 100 confers<br />
one vote on the holder.<br />
The Annual General Meeting is held in Greater<br />
Copenhagen before the end of May. The Annual General<br />
Meeting is convened by the Supervisory Board of <strong>DFDS</strong> with<br />
at least 14 days’ notice by and announcement in the Danish<br />
Official Gazette and in two national daily newspapers.<br />
Similarly, all shareholders listed in the register of<br />
shareholders receive an invitation to the Annual General<br />
Meeting with at least 14 days’ notice. The invitation contains<br />
the agenda and the main proposals.The full annual report is<br />
available at <strong>DFDS</strong>’ website at least 14 days before the Annual<br />
General Meeting, and is forwarded upon request.<br />
Any shareholder is entitled to submit a specific issue<br />
for consideration by the Annual General Meeting by sending<br />
a written proposal no later than two months after the end of<br />
the financial year. Eight days before the Annual General<br />
Meeting, the agenda, the <strong>com</strong>plete wording of all proposals<br />
and the annual report will be available for inspection at <strong>DFDS</strong>’<br />
head office.<br />
<strong>DFDS</strong>’ Annual General Meeting will be webcast from<br />
<strong>DFDS</strong>’ website.<br />
Supervisory Board and Executive Board<br />
<strong>DFDS</strong>’ rules of procedure for the Supervisory Board prescribe<br />
that the management of the <strong>com</strong>pany, including appropriate<br />
corporate organization, shall be handled by the Supervisory<br />
Board and the Executive Board.<br />
The day-to-day management of the <strong>com</strong>pany is<br />
handled by the Executive Board in accordance with <strong>DFDS</strong>’<br />
rules of procedure for the Executive Board, which describe<br />
the distribution of tasks and responsibilities between the<br />
Supervisory Board and the Executive Board, and the business<br />
procedures, authorizations and instructions for the Supervisory<br />
Board and Executive Board.<br />
The Supervisory Board ensures that a strategic plan<br />
and budget are prepared every year, as well as monthly and<br />
quarterly reports.<br />
The Supervisory Board appoints the Executive Board<br />
of the <strong>com</strong>pany, and decisions of an exceptional nature or of<br />
major importance can only be implemented by the Executive<br />
Board on the basis of special authorization granted by the<br />
Supervisory Board.<br />
In 2002, the Supervisory Board held seven board<br />
meetings, one of which was a two-day meeting focusing on<br />
<strong>DFDS</strong>’ overall objectives and strategies.<br />
The Supervisory Board of <strong>DFDS</strong> consists of eight<br />
members, of whom three are employee-elected members.<br />
Directors cannot be nominated for re-election after the age of 70.<br />
The members elected by the Annual General Meeting<br />
are independent of the <strong>com</strong>pany, as no members have<br />
previously been employed by the <strong>com</strong>pany or acted as<br />
professional advisors for the <strong>com</strong>pany. No members have<br />
a significant strategic interest in the <strong>com</strong>pany except as<br />
shareholders.
In 2002, three members of the Supervisory<br />
Board were of foreign nationality<br />
Commercial duties held by the Supervisory Board are stated on<br />
page 63 of this annual report, and the number of <strong>DFDS</strong> shares<br />
held by the Supervisory Board can be found on page 65. The<br />
members of the Supervisory Board of <strong>DFDS</strong> are remunerated<br />
by an annual fee, which is stated in note 2 on page 46 of<br />
this annual report. <strong>DFDS</strong> does not offer a stock option plan<br />
to the Supervisory Board.<br />
Members, elected by the Annual General Meeting,<br />
are elected for one year at a time. The average seniority of<br />
Supervisory Board members was 3.5 years at the end of 2002,<br />
and the highest seniority was 12 years. In 2002, three<br />
members of the Supervisory Board of <strong>DFDS</strong> were of foreign<br />
nationality, two Swedish and one Norwegian.<br />
The Supervisory Board of <strong>DFDS</strong> does not use directors’<br />
<strong>com</strong>mittees in its work.<br />
A stock option plan has been established for the<br />
Executive Board of <strong>DFDS</strong>, and its content is described in note<br />
2 on page 46. The Executive Board’s holding of <strong>DFDS</strong> shares<br />
is stated on this page.<br />
Management’s Number Market value<br />
share holdings of shares year-end<br />
2002, DKK<br />
Supervisory Board 2,236 309,462<br />
Executive Board 1,672 231,405<br />
Other insiders 948 131,203<br />
Total share holdings 4,856 672,070<br />
Relationship between Vesterhavet A/S<br />
and <strong>DFDS</strong> A/S<br />
At the end of 2002, Vesterhavet A/S held 56% of the share<br />
capital of <strong>DFDS</strong> A/S.<br />
It is the policy of Vesterhavet that <strong>DFDS</strong> is managed<br />
independently by the Supervisory Board and Executive Board<br />
of <strong>DFDS</strong>.<br />
Policy governing <strong>DFDS</strong>’ purchase of<br />
own shares<br />
It is the policy of <strong>DFDS</strong> that <strong>DFDS</strong> can only trade in its own<br />
shares for a period of four weeks following the publication of a<br />
quarterly or annual report.<br />
<strong>DFDS</strong> CORPORATE GOVERNANCE<br />
Reporting and Investor Relations<br />
<strong>DFDS</strong> has prepared an Investor Relations Manual summarizing<br />
all the guidelines and policies relating to the publication of<br />
information in general and to the Copenhagen Stock Exchange<br />
and financial markets in particular. The manual also includes<br />
all external and internal rules to be <strong>com</strong>plied with by <strong>DFDS</strong><br />
employees when handling inside information and trading in<br />
<strong>DFDS</strong> shares.<br />
<strong>DFDS</strong> strives to publish Stock Exchange Reports in<br />
Danish and <strong>English</strong> simultaneously.<br />
Every quarter, <strong>DFDS</strong> holds a meeting with share<br />
analysts in connection with the publication of its quarterly report.<br />
The presentation shown at the meeting is available at <strong>DFDS</strong>’<br />
website immediately after the meeting. Other Investor Relations<br />
information can also be found at the website.<br />
<strong>DFDS</strong> has issued quarterly reports since the third<br />
quarter of 2001.<br />
Financial management and audits<br />
<strong>DFDS</strong>’ financial management is based on weekly, monthly and<br />
quarterly reports. The development in passenger numbers<br />
and freight units is reported weekly for the entire Group.<br />
In addition, weekly booking reports are issued, with a time<br />
horizon of six months. Monthly reports are issued on financial<br />
performance at activity, divisional and Group level.<br />
Quarterly Group reports are prepared containing consolidated<br />
financial statements, profit forecast for the full year,<br />
and a detailed directors’ report reviewing financial performance<br />
at activity, divisional and Group level. The directors’ report also<br />
contains information on financial developments and the <strong>DFDS</strong><br />
share. All reports <strong>com</strong>pare actual figures with the budget and<br />
expected figures.<br />
<strong>DFDS</strong>’ financial statements are audited by two<br />
<strong>com</strong>panies of auditors elected by the Annual General Meeting<br />
for one year at a time.<br />
Risk management<br />
<strong>DFDS</strong>’ policies for managing operational and financial risks are<br />
described in more detail on pages 26-27 of this annual report.<br />
65
66<br />
<strong>DFDS</strong> DEFINITIONS AND GLOSSARY<br />
Definitions and Glossary<br />
Definitions<br />
Operating profit (EBITA)<br />
Operating profit margin<br />
Net operating profit after<br />
tax (NOPAT)<br />
Invested capital<br />
Return on invested<br />
capital (ROIC)<br />
Calculated weighted<br />
average cost of capital<br />
(WACC)<br />
Profit for analytical<br />
purposes<br />
Return on equity<br />
Equity ratio<br />
Earnings per share (EPS)<br />
P/E ratio<br />
Dividend per share<br />
Dividend payout ratio<br />
Dividend yield<br />
Equity per share<br />
Price/book value<br />
Profit after depreciation and impairment on<br />
tangible assets<br />
Operating profit (EBITA)<br />
Revenue<br />
x 100<br />
Operating profit (EBITA) plus financial in<strong>com</strong>e<br />
and extraordinary items minus payable tax for the<br />
year adjusted for the tax effect of interest costs<br />
Net current assets (non-interest-bearing current<br />
assets minus non-interest-bearing liabilities) plus<br />
accumulated goodwill, tangible assets, investments,<br />
cash at bank and in hand and securities, minus<br />
provision for pensions and other provisions<br />
NOPAT<br />
Invested capital<br />
x 100<br />
Average capital cost percentage for liabilities and<br />
equity, weighted according to the capital structure<br />
Profit for the year before minority interests<br />
excluding adjustment for previous years’ taxes,<br />
reversal of deferred taxes and extraordinary items<br />
Profit for analytical purposes<br />
Average equity plus minority interests<br />
Equity plus minority interests<br />
Total assets<br />
x 100<br />
Profit for analytical purposes<br />
Weighed average number of shares<br />
Share price at year end<br />
Earnings per share (EPS)<br />
Dividend for the year<br />
Number of shares at year end<br />
Dividend for the year<br />
Profit for analytical purposes<br />
Dividend per share<br />
Share price at year end<br />
Equity<br />
Number of shares at year end<br />
Market value<br />
Equity<br />
x 100<br />
Glossary<br />
The Executive Board:<br />
The Executive Management of <strong>DFDS</strong> under<br />
Danish securities law<br />
Group Management: Group Management<br />
and associated staff functions<br />
The Company: <strong>DFDS</strong> A/S<br />
Business areas: Common term used to<br />
denote <strong>DFDS</strong>’ two main business areas:<br />
passenger and freight liner shipping<br />
Divisions: <strong>DFDS</strong> Seaways and <strong>DFDS</strong> Tor Line<br />
Ro-ro ships: Roll on-roll off ships – ships<br />
where cargo is driven on and off.<br />
Lo-lo ships: Lift on-lift off ships – ships where<br />
cargo is lifted on and off.<br />
Ro-pax: A <strong>com</strong>bined ro-ro freight and<br />
passenger ship<br />
Side-port ships: Ships that can be<br />
loaded/unloaded from the side of the vessel<br />
Lane metre: A unit of space (linear metre)<br />
represented by an area of deck 1 metre in<br />
length by 2.5 metres wide<br />
Time charter: Contract for the lease of a ship<br />
with crew for certain period of time.<br />
Gate-to-gate: Sea transport from port terminal<br />
to port terminal<br />
Northern Europe: Scandinavia, the Benelux<br />
countries, Great Britain, Germany, Poland and<br />
the Baltic countries<br />
Moody’s: Moody’s Investor Service, an<br />
international credit rating <strong>com</strong>pany<br />
P-1, Prime 1: Banks with high credit rating and<br />
ability for punctual payment of short term loans<br />
Black-Scholes model: Methos for valuation<br />
of options<br />
Back-to-back: A loan where a bank connects<br />
lender and borrower<br />
Intermodal transport: A transport that<br />
<strong>com</strong>bines different modes of transport
EDITING <strong>DFDS</strong> A/S<br />
DESIGN AND PRODUCTION KPTO as<br />
PHOTO Mogens Carrebye<br />
PRINTING Phønix-Trykkeriet A/S<br />
<strong>DFDS</strong> ADDRESSES<br />
Head offices until 1 September 2003:<br />
<strong>DFDS</strong> A/S<br />
Sankt Annæ Plads 30<br />
1295 Copenhagen K<br />
Tel: +45 33 42 33 42<br />
Fax: +45 33 42 33 41<br />
www.dfds.<strong>com</strong><br />
<strong>DFDS</strong> Seaways A/S<br />
Sankt Annæ Plads 30<br />
1295 Copenhagen K<br />
Tel: +45 33 42 33 42<br />
Fax: +45 33 42 31 59<br />
www.dfdsseaways.dk<br />
<strong>DFDS</strong> Tor Line A/S<br />
Sankt Annæ Plads 30<br />
DK-1295 Copenhagen K<br />
Tel: +45 33 42 33 00<br />
Fax: +45 33 42 33 01<br />
www.dfdstorline.<strong>com</strong><br />
Head offices after 1 September 2003:<br />
<strong>DFDS</strong> A/S<br />
Sundkrogsgade 11<br />
2100 Copenhagen Ø<br />
Tel: +45 33 42 33 42<br />
Fax. +45 33 42 33 41<br />
www.dfds.<strong>com</strong><br />
<strong>DFDS</strong> Seaways A/S<br />
Sundkrogsgade 11<br />
2100 Copenhagen Ø<br />
Tel: +45 33 42 33 42<br />
Fax: +45 33 42 31 59<br />
www.dfdsseaways.dk<br />
<strong>DFDS</strong> Tor Line A/S<br />
Sundkrogsgade 11<br />
2100 Copenhagen Ø<br />
Tel: +45 33 42 33 00<br />
Fax: +45 33 42 33 01<br />
www.dfdstorline.<strong>com</strong><br />
The addresses of <strong>DFDS</strong>’ sales subsidiaries, locations<br />
and offices can be found at <strong>DFDS</strong> websites.
<strong>DFDS</strong> A/S<br />
SANKT ANNÆ PLADS 30<br />
DK-1295 COPENHAGEN K<br />
DENMARK<br />
TEL: +45 3342 3342<br />
FAX: +45 3342 3341<br />
WWW.<strong>DFDS</strong>.DK<br />
CVR/VAT NO.: DK 14 19 47 11