- Page 1 and 2:
STRUCTURAL GEOLOGY, PROPAGATION MEC
- Page 4 and 5:
Abstract Low-porosity, low-permeabi
- Page 6 and 7:
delivered with fortitude, humor, su
- Page 8 and 9:
Chapter 3—Energy-release model of
- Page 10 and 11:
List of Illustrations Figure A. Cov
- Page 12 and 13:
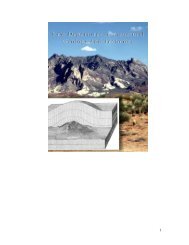
Figure A. Cover photo that accompan
- Page 14 and 15:
likely present in subsurface sandst
- Page 16 and 17:
hooking-tip interactions—using th
- Page 18 and 19:
and sandstone, my co-authors—Moha
- Page 20 and 21:
the hard data from which accurate p
- Page 22 and 23:
Although the Aztec sandstone experi
- Page 24 and 25:
Waterpocket Fault 36 o 26‘ N 0 1
- Page 26 and 27:
Cenozoic Mesozoic Paleozoic Quatern
- Page 28 and 29:
3.3. Deformation The Aztec also has
- Page 30 and 31:
There also are relatively high-angl
- Page 32 and 33:
(e) (f) (c) 500µm compaction band
- Page 34 and 35:
dihedral angle of 80° or more, and
- Page 36 and 37:
5. Compaction band orientations Ori
- Page 38 and 39:
n = 20 M n = 20 P n = 22 B n = 20 R
- Page 40 and 41:
were encountered, giving the dihedr
- Page 42 and 43:
Eichhubl et al., 2004) did not lend
- Page 44 and 45:
P (a) (c) S P S Figure 1.10. Stereo
- Page 46 and 47:
possible, and use these to better c
- Page 48 and 49:
1.5(ρgz) (b) WEST Willow Tank Uppe
- Page 50 and 51:
9. Acknowledgements My sincere than
- Page 52 and 53:
The term compaction band (CB) was c
- Page 54 and 55:
Pollard, 2002). The particular util
- Page 56 and 57:
Hue-based image analysis using MATL
- Page 58 and 59:
a direct genetic relationship (Hill
- Page 60 and 61:
Compaction band fin Depositional be
- Page 62 and 63:
suggests—that to first approximat
- Page 64 and 65:
Porosity Porosity 0.3 0.25 0.2 0.15
- Page 66 and 67:
pore-clogging clay—due presumably
- Page 68 and 69:
500 µm Figure 2.9. Electron backsc
- Page 70 and 71:
(a) (b) σ 3 σ 1 x 3 x 1 x 1 (c) u
- Page 72 and 73:
6. Elastic properties Despite a lon
- Page 74 and 75: Comparison of the two approaches es
- Page 76 and 77: term in (6a) and (6c) begins to dom
- Page 78 and 79: MPa MPa 80 70 60 50 40 30 20 10 0 0
- Page 80 and 81: 2002) and use a BEM approach (Crouc
- Page 82 and 83: MPa 10 4 10 3 10 2 10 1 10 −5 10
- Page 84 and 85: concentration of quartz plasticity
- Page 86 and 87: conducted on well-cemented sandston
- Page 88 and 89: ~ 62 m compaction band trend 500µm
- Page 90 and 91: Sternlof et al. (2005) have suggest
- Page 92 and 93: 2005). It consists of a long (infin
- Page 94 and 95: ⎡ ∆ ⎤ ⎧ p 1 ∆ ⎛ M ⎞
- Page 96 and 97: which point the inelastic strain ha
- Page 98 and 99: they can exert significant effects
- Page 100 and 101: interact is inversely proportional
- Page 102 and 103: (a) (b) (c) (d) Figure 4.3. Typical
- Page 104 and 105: Viewed individually, CB traces tend
- Page 106 and 107: (a) (b) (c) (d) (e) (f) Figure 4.7.
- Page 108 and 109: 1973; Mardon, 1988; Peck et al., 19
- Page 110 and 111: undamaged host rock. That CBs canno
- Page 112 and 113: 0.5 0.4 0.3 0.2 0.1 0.5 0.4 0.3 0.2
- Page 114 and 115: Normalized stress magnitude 3 2.5 2
- Page 116 and 117: helps to explain why the oblique ap
- Page 118 and 119: and ts = G·ds + H·dn (2) where tn
- Page 120 and 121: plastic compaction, as suggested by
- Page 122 and 123: To determine the sensitivity of pro
- Page 126 and 127: 6.3. Approaching tip interactions A
- Page 128 and 129: 0.2 0.15 0.1 0.05 0 −0.05 −0.1
- Page 130 and 131: 0.2 0.15 0.1 0.05 0 −0.05 −0.1
- Page 132 and 133: the hooking patterns commonly obser
- Page 134 and 135: (a) (b) (c) σ1 compaction band max
- Page 136 and 137: σ 3 σ 2 σ 1 Figure 4.24. Schemat
- Page 138 and 139: NV UT CA AZ Park Road Map Detail Pa
- Page 140 and 141: compaction band Figure 5.2. Typical
- Page 142 and 143: 3. Computational method The methodo
- Page 144 and 145: compaction band A 5 mm A‘ compact
- Page 146 and 147: 4. Application to the Aztec sandsto
- Page 148 and 149: Permeability (mD) 10 4 10 3 10 2 10
- Page 150 and 151: B‘ A‘ A c f m c m c f c f c f c
- Page 152 and 153: equivalent of the Aztec sandstone,
- Page 154 and 155: effective permeability represents a
- Page 156 and 157: NV UT CA AZ Park Road Map Detail Pa
- Page 158 and 159: Commonly from ~1 mm to ~1.5 cm in t
- Page 160 and 161: Although systematic arrays of DBs p
- Page 162 and 163: to 2 m, with both sets in a cross-h
- Page 164 and 165: y identical blocks all subject to t
- Page 166 and 167: contiguous areas. This type of char
- Page 168 and 169: (0,b) n 3 (0,0) f 2 n 2 n 1 (a,0) (
- Page 170 and 171: 6.1. Parallel Effective permeabilit
- Page 172 and 173: By contrast, band-parallel effectiv
- Page 174 and 175:
Relative Effective Permeability 1.0
- Page 176 and 177:
(a) (b) (c) 0 meters 3 = 10-2 kb /k
- Page 178 and 179:
Though grossly systematic, anastomo
- Page 180 and 181:
168
- Page 182 and 183:
100 meters 5 meters NV UT CA AZ Par
- Page 184 and 185:
compaction band trend 500µm Figure
- Page 186 and 187:
Cover Outcrop Band N 100 meters 20
- Page 188 and 189:
(CBs) and the matrix rock in all si
- Page 190 and 191:
The finite volume discretization fo
- Page 192 and 193:
isotropic) can lead to numerical di
- Page 194 and 195:
5. Simulations Three sets of 2-D si
- Page 196 and 197:
Normalized ∆P ∆P ratio (n/p) 4.
- Page 198 and 199:
P P P P I I P P Case 1 P P Case 2 I
- Page 200 and 201:
Case 1 Case 1 Case 1 (a) (b) (c) In
- Page 202 and 203:
5.2.2. Discussion The elliptical pa
- Page 204 and 205:
5.3.1. Results With the regional gr
- Page 206 and 207:
(a) (b) Leak 200 meters Regional gr
- Page 208 and 209:
anticipated sustainable pumping rat
- Page 210 and 211:
Finally, there is the issue of fore
- Page 212 and 213:
200
- Page 214 and 215:
Bakke, S., and Øren, P. E., 1997,
- Page 216 and 217:
Carpenter, D. G., and Carpenter, J.
- Page 218 and 219:
Eichhubl, P., Taylor, W. L., Pollar
- Page 220 and 221:
Karimi-Fard, M., Durlofsky, L. J.,
- Page 222 and 223:
-, 1987, Fracture from a straight c
- Page 224 and 225:
Shipton, Z. K., and Cowie, P. A., 2
- Page 226:
Wong, T. F., David, C., and Zhu, W.


