Krzysztof Wnuk
Krzysztof Wnuk
Krzysztof Wnuk

Create successful ePaper yourself
Turn your PDF publications into a flip-book with our unique Google optimized e-Paper software.
Visualizing, Analyzing and Managing<br />
the Scope of Software Releases in<br />
Large-Scale Requirements<br />
Engineering<br />
<strong>Krzysztof</strong> <strong>Wnuk</strong><br />
Doctoral Thesis, 2012<br />
Department of Computer Science<br />
Faculty of Engineering<br />
Lund University
ISSN 1404-1219<br />
ISBN 978-91-976939-7-4<br />
Dissertation 39, 2012<br />
LU-CS-DISS:2012-2<br />
Department of Computer Science<br />
Faculty of Engineering<br />
Lund University<br />
Box 118<br />
SE-221 00 Lund<br />
Sweden<br />
Typeset using LATEX<br />
Printed in Sweden by Tryckeriet i E-huset, Lund, 2012<br />
c○ 2012 <strong>Krzysztof</strong> <strong>Wnuk</strong><br />
Email:
Abstract<br />
Large market-driven software companies face new challenges in requirements<br />
engineering and management that emerged due to their recent extensive<br />
growth. At the same time, the pressure generated by competitors’<br />
and users’ expectations demands being more competitive, creative and<br />
flexible to more quickly respond to a rapidly changing market situation. In<br />
the pursuit of staying competitive in this context, new ideas on how to improve<br />
the current requirements engineering practice are requested to help<br />
maintaining the engineering efficiency while coping with growing size and<br />
complexity of requirements engineering processes and their products.<br />
This thesis focuses on visualizing, analyzing and managing the scope<br />
of software releases in large-scale requirements management for developing<br />
software products to open markets. In particular, this thesis focuses on<br />
the following requirements management activities in the mentioned context,<br />
namely: scope management, decision making, obsolete requirements<br />
and requirements consolidation. The goals of the research effort in this<br />
thesis are to provide effective methods in supporting mentioned requirements<br />
management activities in a situation when the size of them and their<br />
complexity require large time and skills efforts.<br />
Based on empirical research, where both quantitative and qualitative<br />
approaches were utilized, this thesis reports on improved understanding<br />
of requirements scoping in very-large projects by investigating factors affecting<br />
decision making, causes and effects of oversoping and presents visualization<br />
techniques to assist scope management for large-scale software<br />
product development contexts. The technical solutions reported in this<br />
thesis were empirically evaluated in case studies in a large-scale context<br />
and designed in close collaboration with our industry partners. Additionally,<br />
the benefits of using linguistic methods for requirements consolidation<br />
are investigated in a replicated experimental study based on a relevant<br />
industry scenario. Finally, the phenomenon of obsolete software requirements<br />
and their impact on industry practice is explored.<br />
i
Acknowledgements<br />
The work presented in this thesis was funded by the Swedish Governmental<br />
Agency for Innovation Systems under the grants UPITER and UPITER2,<br />
Efficient Requirements Architecture in Platform-Based Requirements Management<br />
for Mobile Terminals.<br />
First and foremost, I am particularly grateful to my supervisor, Professor<br />
Björn Regnell, for his invaluable expertise and advice, inspiring and challenging<br />
discussions, and endless patience that supported me throughout<br />
this work. I would also like to thank my assistant supervisor, Professor<br />
Martin Höst, for his enthusiastic guidance and comments on my work.<br />
The research presented in this thesis was conducted in close cooperation<br />
between academia and industry. Therefore, I am particularly grateful<br />
to Brian Berenbach from Siemens Corporate Research and Dr. Lena Karlsson,<br />
Lic. Eng. Thomas Olsson, Dr. Even-André Karlsson from Sony Mobile<br />
for their commitment. I am grateful to all participants of the studies presented<br />
in this thesis.<br />
Recognition must also be given here to the co–authors of my papers<br />
and others who have helped writing and reviewing them. In particular,<br />
I would like to thank Professor Tony Gorschek for excellent collaboration<br />
and advise, Lic. Eng. Lars Nilsson, Dr. David Callele and Leora Callele for<br />
their perfection in language reviews of my articles and this thesis, which<br />
significantly improved their legibility.<br />
I would like to thank my colleagues in the Software Engineering Research<br />
Group for an inspiring and supporting collaboration atmosphere. I<br />
want to thank all other colleagues at the Department of Computer Science<br />
for for providing an excellent environment to work in.<br />
Last but not least, I would like to thank my wife Agata, the rock of our<br />
family, the light and love of my life, for her unwavering love and support.<br />
Also, to my family and friends: thank you for constantly reminding me<br />
what is the most important in life.<br />
iii<br />
<strong>Krzysztof</strong> <strong>Wnuk</strong><br />
In the year of grace 2012
Contents<br />
Introduction 1<br />
1 Setting the Context ........................ 7<br />
1.1 Software and requirements engineering ........ 7<br />
1.2 Requirements management in a large-scale market<br />
driven context ....................... 11<br />
2 Research Focus .......................... 14<br />
3 Related Work ........................... 19<br />
3.1 Engineering and researching large-scale software systems<br />
............................ 19<br />
3.2 Requirements prioritization, product management,<br />
release planning and roadmapping .......... 28<br />
3.3 Visualization in software and requirements engineering<br />
............................. 32<br />
3.4 Natural Language Processing techniques in requirements<br />
management .................... 35<br />
3.5 Obsolescence in software and requirements engineering,<br />
Obsolete Software Requirements (OSRs) ..... 36<br />
3.6 Scoping in software projects and in requirements engineering<br />
.......................... 38<br />
4 Research Methodology ...................... 39<br />
4.1 Research design ...................... 40<br />
4.2 Research strategies used ................. 40<br />
4.3 Data collection methods used .............. 42<br />
4.4 Research classification .................. 44<br />
4.5 Validity ........................... 46<br />
5 Research Results .......................... 48<br />
5.1 Main contribution of RQ1 ................ 48<br />
5.2 Main contribution of RQ2 ................ 49<br />
5.3 Main contribution of RQ3 ................ 50<br />
5.4 Main contribution of RQ4 ................ 51<br />
5.5 Main contribution of RQ5 ................ 52<br />
5.6 Main contribution of RQ6 ................ 52<br />
6 Further Research ......................... 53<br />
v
6.1 FR1: Scoping by Controlling Opportunity Losses . . 53<br />
6.2 FR2: Providing Scalable Requirements Architectures 58<br />
6.3 FR3: Additional investigations of possible usage of a<br />
linguistic tool support for requirements management<br />
related tasks. ....................... 61<br />
6.4 FR4: Methods for handling OSRs. ........... 68<br />
6.5 FR5: Investigation of overscoping in other contexts<br />
and the impact of agile practices on overscoping. . . 69<br />
6.6 FR6: Investigation of additional factors that may affect<br />
decision lead-times and decision outcomes. . . . 71<br />
6.7 FR7: Extending the proposed visualization techniques<br />
on the system requirements level visualization. Improving<br />
the user interaction. Additional empirical<br />
evaluations. ........................ 72<br />
References ................................ 73<br />
Paper I: What Happened to Our Features? Visualization and Understanding<br />
of Scope Change Dynamics in a Large-Scale Industrial<br />
Setting 95<br />
1 Introduction ............................ 97<br />
2 The case company ......................... 98<br />
3 Research Methodology ...................... 99<br />
4 Feature Survival Charts ..................... 100<br />
5 Evaluation results ......................... 101<br />
6 Scope tracking measurements .................. 103<br />
6.1 Definition of measurements ............... 104<br />
6.2 Theoretical analysis of measurements ......... 105<br />
6.3 Empirical application of measurements ........ 106<br />
7 Conclusions ............................ 113<br />
References ................................ 117<br />
Paper II: Replication of an Experiment on Linguistic Tool Support for<br />
Consolidation of Requirements from Multiple Sources 119<br />
1 Introduction ............................ 121<br />
2 Industrial Problem Description ................. 123<br />
3 Related Work ........................... 125<br />
4 Experimental Design ....................... 128<br />
4.1 Goals, Hypothesis, Parameters and Variables ..... 131<br />
4.2 Subjects .......................... 132<br />
4.3 Treatments ......................... 135<br />
4.4 Requirements ....................... 136<br />
4.5 Tools ............................ 136<br />
4.6 Correct Consolidation .................. 140<br />
4.7 Instrumentation ...................... 140<br />
4.8 Data Collection Procedure ................ 141<br />
vi
4.9 Validity Evaluation .................... 142<br />
5 Experiment execution ....................... 145<br />
6 Experiment results analysis ................... 147<br />
7 Experiment results interpretation and discussion ....... 152<br />
7.1 Interpretation of this experiment ............ 152<br />
7.2 Interpretation of the results from both experiments . 157<br />
7.3 Discussion ......................... 158<br />
8 Conclusions ............................ 160<br />
References ................................ 165<br />
Paper III: Obsolete Software Requirements 173<br />
1 Introduction ............................ 175<br />
2 Background and Related Work ................. 176<br />
3 Research methodology ...................... 178<br />
3.1 Research questions .................... 178<br />
3.2 Research design ...................... 179<br />
3.3 Validity ........................... 181<br />
4 Results and Analysis ....................... 184<br />
4.1 Demographics ....................... 185<br />
4.2 Defining obsolete requirements (RQ1) ......... 189<br />
4.3 The potential impact of OSRs (RQ2) .......... 192<br />
4.4 Requirements types and OSRs (RQ3) ......... 195<br />
4.5 Methods to identify OSRs (RQ4) ............ 198<br />
4.6 Handling of identified obsolete software requirements<br />
(RQ5) ............................ 200<br />
4.7 Context factors and obsolete software requirements<br />
(RQ6 and RQ7) ...................... 203<br />
4.8 Where in the requirements life cycle should OSRs be<br />
handled (RQ7) ...................... 206<br />
4.9 Existing processes and practices regarding managing<br />
OSRs (RQ5) ........................ 208<br />
4.10 Summary of results .................... 211<br />
5 Conclusions and Further Work ................. 213<br />
References ................................ 215<br />
Paper IV: Are You Biting Off More Than You Can Chew? A Case<br />
Study on Causes and Effects of Overscoping in Large–Scale Software<br />
Engineering 223<br />
1 Introduction ............................ 226<br />
2 Related work ............................ 228<br />
3 The case company ......................... 230<br />
3.1 Organisational set-up .................. 230<br />
3.2 Phase-based process ................... 231<br />
3.3 Agile development process ............... 232<br />
4 Research method ......................... 234<br />
vii
4.1 Phase one: pre-study and hypothesis generation . . . 235<br />
4.2 Phase two: an interview study at the case company . 237<br />
4.3 Phase three: validation of results via questionnaire . 238<br />
5 Interview results ......................... 239<br />
5.1 Causes of overscoping (RQ1) .............. 239<br />
5.2 Root cause analysis (RQ1) ................ 243<br />
5.3 Effects of overscoping (RQ2) .............. 246<br />
5.4 Impact of agile RE practices (RQ3) ........... 249<br />
6 Validation questionnaire on interview results ......... 250<br />
6.1 Causes and root causes (RQ1) .............. 250<br />
6.2 Effect of overscoping (RQ2) ............... 251<br />
6.3 Impact of agile RE practices (RQ3) ........... 252<br />
7 Interpretation and discussion .................. 255<br />
7.1 Causes of overscoping (RQ1) .............. 255<br />
7.2 The effects of overscoping (RQ2) ............ 259<br />
7.3 How agile RE practices may impact overscoping (RQ3)262<br />
7.4 Threats to validity and limitations ........... 263<br />
8 Conclusions and further work .................. 265<br />
References ................................ 269<br />
Paper V: Factors Affecting Decision Outcome and Lead-time in Large-<br />
Scale Requirements Engineering 275<br />
1 Introduction ............................ 277<br />
2 Related Work ........................... 278<br />
3 Case Company Description ................... 280<br />
4 Research Design .......................... 283<br />
4.1 Research questions .................... 284<br />
4.2 Research methods .................... 285<br />
4.3 Validity ........................... 288<br />
5 Results and Discussion ...................... 289<br />
5.1 Test Selection ....................... 289<br />
5.2 Survey Data Analysis .................. 290<br />
5.3 Factors that affect the decision lead–time: RQ1 .... 291<br />
5.4 Factors that affect the decision outcome: RQ2 ..... 296<br />
5.5 Effect of lead–time on the decision outcome - RQ3 . . 300<br />
6 Conclusions ............................ 301<br />
References ................................ 309<br />
Paper VI: Scope Tracking and Visualization for Very Large-Scale Requirements<br />
Engineering 315<br />
1 Introduction ............................ 317<br />
2 Background and Related Work ................. 317<br />
3 Case Study Description ...................... 322<br />
4 Research methodology ...................... 324<br />
4.1 Research questions .................... 324<br />
viii
4.2 Research design and methods used .......... 324<br />
4.3 Validity evaluation .................... 327<br />
5 Feature Survival Charts+ ..................... 328<br />
5.1 FSC+ as a visual technique for very-large agile-inspired<br />
projects: RQ1 ....................... 332<br />
5.2 X-axis and Y-axis representations: RQ1a, RQ1b .... 333<br />
5.3 Sorting and filtering FSC+s: RQ1c and RQ1d ..... 334<br />
6 Feature decision patterns analysis and visualization: RQ2 . . 334<br />
6.1 Decision archetypes: RQ2a ............... 336<br />
6.2 Interview results regarding decision patterns analysis:<br />
RQ2 .......................... 337<br />
6.3 Visualizing decision patterns: RQ2b .......... 337<br />
7 Conclusions ............................ 341<br />
References ................................ 345<br />
ix
Introduction<br />
Software becomes more and more pervasive and gains more and more importance<br />
in our lives. As a result, our dependence on software intensive<br />
system in everyday life increases. At the same time, the intangible and<br />
abstract nature of software artifacts demands revisiting and often redefining<br />
engineering approaches for constructing complex systems, established<br />
originally in other than software domains. The constant need to esteem<br />
new ways of achieving repeatability and quality control over the software<br />
production process gets particularly important for large software systems.<br />
In these systems, the adhered diversity and complexity may severely impede<br />
the management of software development processes. Similarly, as the<br />
size and complexity of software systems continues to increase, they result<br />
in increasingly large and complex sets of requirements. Currently, many<br />
companies are facing the problem of dealing with enormous complexity<br />
of requirements engineering related artifacts, where current requirements<br />
engineering technology can provide useful but only partial solutions.<br />
This thesis focuses on visualizing, analyzing and managing the scope<br />
of projects in large-scale requirements engineering contexts. The research<br />
presented in this thesis aims for improving the understanding of largescale<br />
requirements engineering contexts, in particular the nature of requirements<br />
management related activities, as well as providing methods for<br />
supporting some of these activities. The results from this thesis concern<br />
scoping, managing obsolete requirements and requirements consolidation<br />
tasks. The presented visualization techniques are applied to very-large<br />
software projects, increasing the understanding and assisting in improving<br />
the scoping process at the case company.<br />
This thesis includes a collection of six papers. This introduction provides<br />
a background for the papers and relationships between the studies.<br />
Section 1 gives the introduction to the context of the thesis. Section 2 defines<br />
the focus of this thesis. Section 3 provides related work in the related<br />
subareas of requirements engineering. Section 4 describes the methodology<br />
used in this thesis. Throughout this introduction, the papers included<br />
in this thesis will be refereed to their roman number (see the list below).<br />
Other references can be found at the end of this introduction section.<br />
1
Included papers<br />
The following six papers are included in the thesis:<br />
I What Happened to Our Features? Visualization and Understanding<br />
of Scope Change Dynamics in a Large–Scale Industrial Setting<br />
<strong>Krzysztof</strong> <strong>Wnuk</strong>, Björn Regnell and Lena Karlsson<br />
In Proceedings of the 17th IEEE International Requirements Engineering<br />
Conference (RE’ 09), Atlanta, Georgia, USA, August 31 - September<br />
04, IEEE, 2009, pp. 89–98<br />
II Replication of an Experiment on Linguistic Tool Support for Consolidation<br />
of Requirements from Multiple Sources<br />
<strong>Krzysztof</strong> <strong>Wnuk</strong>, Björn Regnell and Martin Höst<br />
Empirical Software Engineering Journal (ESEJ), Springer, vol. 17, Jan.<br />
2012, pp. 305–344<br />
III Obsolete Software Requirements<br />
<strong>Krzysztof</strong> <strong>Wnuk</strong>, Tony Gorschek and Shuiab Zahda<br />
Under revision for Information and Software Technology journal, Elsevier,<br />
2012<br />
IV Are You Biting Off More Than You Can Chew? A Case Study on<br />
Causes and Effects of Overscoping in Large–Scale Software Engineering<br />
Elizabeth Bjarnason, <strong>Krzysztof</strong> <strong>Wnuk</strong> and Björn Regnell<br />
Information and Software Technology (IST) journal, vol. 54, issue 10,<br />
October 2012, Elsevier, pp. 1107–1124<br />
This article is an extended version of the related article XVI presented<br />
at the 4th International Workshop on Software Product Management<br />
(IWSPM’ 2010) which received the best paper award<br />
V What Decision Characteristics Influence Decision Making in Large–<br />
Scale Market–Driven Requirements Engineering?<br />
<strong>Krzysztof</strong> <strong>Wnuk</strong>, Jaap Kabbedijk, Sjaak Brinkkemper and Björn Regnell<br />
under revision for the Software Quality Journal, Springer, 2012<br />
This article is an extended version of the related article XIV presented<br />
at the First International Workshop on Product Line Requirements<br />
Engineering and Quality (PLREQ’ 10)<br />
VI Scope Tracking and Visualization for Very Large-Scale Requirements<br />
Engineering<br />
<strong>Krzysztof</strong> <strong>Wnuk</strong>, Tony Gorschek, Björn Regnell and Even-André Karlsson<br />
submitted to the IEEE Transactions on Software Engineering Journal,<br />
IEEE, 2012<br />
2
Contribution Statement<br />
<strong>Krzysztof</strong> <strong>Wnuk</strong> is the main author for five included papers. This means<br />
responsibility for running the research process, dividing the work between<br />
co–authors, and conducting most of the writing. The research in Papers<br />
I,II,III, and VI was mainly performed by <strong>Krzysztof</strong> <strong>Wnuk</strong>, who designed<br />
and conducted most of the work, as well as reported on the studies. <strong>Krzysztof</strong><br />
<strong>Wnuk</strong> wrote most of Papers I, II, III, V and VI, with the assistance from coauthors.<br />
The execution of the study reported in Paper III was performed<br />
by Shuiab Zahda and the execution of the study reported in Paper V was<br />
performed by Jaap Kabbedijk.<br />
For Paper IV, <strong>Krzysztof</strong> <strong>Wnuk</strong> actively participated in the study design<br />
and wrote significant parts of the text. Most of the design was performed<br />
together with the co–authors, while most of the execution and analysis was<br />
performed by Elizabeth Bjarnason.<br />
Related Publications<br />
The following papers are related but not included in the thesis:<br />
VII Can We Beat the Complexity of Very Large–Scale Requirements<br />
Engineering?<br />
Björn Regnell, Richard Berntsson Svensson, and <strong>Krzysztof</strong> <strong>Wnuk</strong><br />
In Proceedings of the 14th International Working conference on Requirements<br />
Engineering: Foundation for Software Quality (REFSQ’08),<br />
Montpellier, France, June 16-17, 2008, LNCS 5025, Springer-Verlag<br />
Berlin, Heidelberg, pp. 123-128<br />
This paper presents challenges faced in very large–scale requirements<br />
engineering, which is the context of this thesis. This paper is partly<br />
included in Section 3.1 of the Introduction.<br />
VIII Scaling up requirements engineering – exploring the challenges of<br />
increasing size and complexity in market-driven software development<br />
<strong>Krzysztof</strong> <strong>Wnuk</strong>, Björn Regnell and Brian Berenbach<br />
In Proceedings of the 17th International Working Conference on Requirements<br />
Engineering: Foundation for Software Quality (REFSQ’11),<br />
Essen, Germany, March 28-30, 2011 , LNCS 6606, Springer-Verlag,<br />
Berlin, Heidelberg, pp. 54-59<br />
This paper presents challenges faced when scaling up requirements<br />
engineering to very large projects, which is the context of this thesis.<br />
This paper is partly included in Section 3.1 of the Introduction.<br />
IX Visualization of Feature Survival in Platform–Based Embedded Systems<br />
Development for Improved Understanding of Scope Dynamics<br />
3
<strong>Krzysztof</strong> <strong>Wnuk</strong>, Björn Regnell and Lena Karlsson<br />
In Proceedings of the 2008 International Requirements Engineering<br />
Visualization workshop (REV’08), Barcelona, Spain, 8 September 2008,<br />
IEEE, pp. 41-50<br />
X Investigating Upstream versus Downstream Decision–Making in<br />
Software Product Management<br />
<strong>Krzysztof</strong> <strong>Wnuk</strong>, Richard Berntsson Svensson and Björn Regnell<br />
Third International Workshop on Software Product Management (IWSPM<br />
2009), Atlanta, Georgia, USA, September 01, 2009, IEEE, pp. 23-26<br />
XI Feature Transition Charts for Visualization of Cross–Project Scope<br />
Evolution in Large–Scale Requirements Engineering for Product<br />
Lines<br />
<strong>Krzysztof</strong> <strong>Wnuk</strong>, Björn Regnell and Lena Karlsson<br />
In Proceedings of the Fourth International Workshop on Requirements<br />
Engineering Visualization (REV’09), Atlanta, Georgia, USA,<br />
August 30, 2009, IEEE, pp. 11-20<br />
XII An Industrial Case Study on Large–Scale Variability Management<br />
for Product Configuration in the Mobile Handset Domain<br />
<strong>Krzysztof</strong> <strong>Wnuk</strong>, Björn Regnell, Jonas Andersson, and Samuel Nygren<br />
In Proceedings of the Third International Workshop on Variability<br />
Modelling of Software-Intensive Systems (VAMOS’09), Seville, Spain,<br />
January 28-30, Research Report 29 Universität Duisburg-Essen, 2009,<br />
pp.155-164<br />
XIII Architecting and Coordinating Thousands of Requirements – An<br />
Industrial Case Study<br />
<strong>Krzysztof</strong> <strong>Wnuk</strong>, Björn Regnell and Claes Schrewelius<br />
In Proceedings of the 15th International Working Conference on Requirements<br />
Engineering: Foundation for Software Quality (REFSQ<br />
’09), Amsterdam, The Netherlands, June 8-9 2009, LNCS 5512, Springer-<br />
Verlag, Berlin, Heidelberg, pp. 118-123<br />
XIV What decision characteristics influence decision making in market–<br />
driven large–scale software product line development?<br />
Jaap Kabbedijk, <strong>Krzysztof</strong> <strong>Wnuk</strong>, Björn Regnell and Sjaak Brinkkemper<br />
In Proceedings of the International Workshop on Product Line Requirements<br />
Engineering and Quality workshop (PLREQ’10), Essen,<br />
Germany, July 3, 2010 Hildesheimer Informatik-Berichte, Volume:<br />
2010, pp. 42-53<br />
XV Guiding Requirements Scoping Using ROI: Towards Agility, Openness<br />
and Waste Reduction<br />
<strong>Krzysztof</strong> <strong>Wnuk</strong>, David Callele and Björn Regnell<br />
4
In Proceedings of the 18th IEEE International Requirements Engineering<br />
Conference (RE’10), Sydney, Australia, 27 September - 1 October<br />
2010, IEEE, pp. 409-410<br />
XVI Overscoping: Reasons and consequences: A case study on decision<br />
making in software product management<br />
Elizabeth Bjarnason, <strong>Krzysztof</strong> <strong>Wnuk</strong> and Björn Regnell<br />
In Proceedings of the Fourth International Workshop on Software<br />
Product Management (IWSPM 2010), Sydney, Australia, September<br />
26, 2010, IEEE, pp. 30-39<br />
XVII More than requirements: Applying requirements engineering techniques<br />
to the challenge of setting corporate intellectual policy, an<br />
experience report<br />
David Callele and <strong>Krzysztof</strong> <strong>Wnuk</strong><br />
In Proceedings of the Fourth International Workshop on Requirements<br />
Engineering and Law (RELAW 2011), Trento, Italy, August 30,<br />
2011, IEEE, pp. 35-42<br />
XVIII A case study on benefits and side–effects of agile practices in largescale<br />
requirements engineering<br />
Elizabeth Bjarnason, <strong>Krzysztof</strong> <strong>Wnuk</strong> and Björn Regnell<br />
In proceedings of the 1st Workshop on Agile Requirements Engineering<br />
(AREW 2011), Lancaster, UK, July 26 2011, ACM, New York, NY,<br />
USA, pp. 1-5<br />
XIX An empirical study on the importance of quality requirements in<br />
industry<br />
Jose Luiz de la Vara, <strong>Krzysztof</strong> <strong>Wnuk</strong>, Richard Berntsson Svensson, Juan<br />
Sanchez and Björn Regnell<br />
In the Proceedings of the 23rd International Conference Software Engineering<br />
and Knowledge Engineering (SEKE 2011), Miami Beach,<br />
USA, 7 - 9 July, 2011, Knowledge Systems Institute Graduate School,<br />
pp. 438-443<br />
XX Requirements are slipping through the gaps: A case study on causes<br />
and effects of communication gaps in large-scale software development<br />
Elizabeth Bjarnason, <strong>Krzysztof</strong> <strong>Wnuk</strong> and Björn Regnell<br />
In the Proceedings of the 19th IEEE International Requirements Engineering<br />
Conference (RE’11), Trento, Italy, August 29 - September 02,<br />
2011, IEEE, pp. 37-46<br />
XXI Requirements scoping visualization for project management<br />
<strong>Krzysztof</strong> <strong>Wnuk</strong> and David Callele<br />
5
In Proceedings of the 2nd International Conference on Software Business<br />
(ICSOB 2011), Brussels, Belgium, June 8-10, 2011, Lecture Notes<br />
in Business Information Processing, vol. 80, Springer-Verlag Berlin<br />
Heidelberg, pp. 168-180<br />
XXII Challenges in supporting the creation of data minable regulatory<br />
codes: a literature review<br />
<strong>Krzysztof</strong> <strong>Wnuk</strong> and Brian Berenbach<br />
In the Proceedings of the 21st Annual International Symposium of<br />
the International Council on Systems Engineering (INCOSE 2011),<br />
INCOSE San Diego, CA, June 20 - June 23, 2011, INCOSE-International<br />
Council on Systems Engineering, pp. 1097-1114<br />
XXIII How can Open Source Software Development help Requirements<br />
Management gain the potential of Open Innovation: An Exploratory<br />
Study<br />
<strong>Krzysztof</strong> <strong>Wnuk</strong>, Dietmar Pfahl, David Callele and Even-André Karlsson<br />
In print for the ACM / IEEE International Symposium on Empirical<br />
Software Engineering and Measurement (ESEM), 19-20 September,<br />
Lund, Sweden, 2012<br />
XXIV Controlling Lost Opportunity Costs in Agile Development – the<br />
Basic Lost Opportunity Estimation Model for Requirements Scoping<br />
<strong>Krzysztof</strong> <strong>Wnuk</strong>, David Callele, Even-André Karlsson and Björn Regnell<br />
In print for the Third International Conference on Software Business,<br />
ICSOB 2012, MIT Sloan School of Management, 18-20 June, 2012<br />
XXV Industrial comparability of student artifacts in traceability recovery<br />
research – An exploratory survey<br />
Markus Borg, <strong>Krzysztof</strong> <strong>Wnuk</strong> and Dietmar Pfahl<br />
In the Proceedings of the 16th European Conference on Software Maintenance<br />
and Reengineering, Szeged, Hungary, March 27, 2012, IEEE,<br />
pp. 181-189<br />
XXVI Towards scalable information modeling of requirements architectures<br />
<strong>Krzysztof</strong> <strong>Wnuk</strong>, Markus Borg and Saïd Assar<br />
In print for the First International Workshop on Modeling for Data-<br />
Intensive Computing, October 15-18, 2012, Florence, Italy<br />
XVII The Effect of Stakeholder Inertia on Product Management<br />
<strong>Krzysztof</strong> <strong>Wnuk</strong>, Richard Berntsson Svensson and David Callele<br />
In print for the Second International Workshop on Requirements Engineering<br />
for Systems and Systems-of-Systems (RESS’12), 25 September<br />
2012, Chicago, IL, USA<br />
6
1 Setting the Context<br />
1.1 Software and requirements engineering<br />
In 1960s, when the term Software Engineering (SE) was introduced, software<br />
was just a small, marginal part of an expensive computing machine.<br />
Changes over the last forty years have been remarkable, resulting in a situation<br />
where the software, not the hardware, is the main cost of a computing<br />
machine. Over the last decades, software engineering gained importance<br />
and is currently an engineering discipline that influences all aspects of software<br />
production, from the initial idea recognition and its specification to<br />
the post development software maintenance activities. The fact that software<br />
engineering is an engineering discipline implies that its products are<br />
things that work. As a result, software products are produced by applying<br />
theories and tools where these are appropriate (Sommerville, 2007).<br />
The main focus of software engineering is the practical problems of producing<br />
software. To build software, software engineers need to use their<br />
knowledge of computers and computing to solve problems. Therefore, the<br />
essential part in the definition of software engineering is understanding<br />
the nature of the problem in order to be able to apply the right “computing<br />
machinery” to solve it (Pfleeger, 2001). Software engineering is also<br />
considered as a part of system engineering discipline (Sommerville, 2007).<br />
Today’s software solutions are often very large and complex. The size<br />
and complexity explosion was partly the reason for establishing the software<br />
engineering field at the NATO Software Engineering Conference in<br />
1968 (Naur and Randell, 1968). Since then, software engineering continued<br />
as a profession and field of study dedicated to creating better quality<br />
software that is more affordable, easier to maintain and quicker to build.<br />
Thanks to that effort, it is possible today to produce software systems with<br />
millions lines of code that can be robust, effective and secure. In a similar<br />
manner, it can be stated that the Requirements Engineering (RE) field was<br />
established partly due to extensively growing size of requirements specifications<br />
which created needs to provide engineering means to activities related<br />
with discovering system functionalities and constraints (Jacobs et al,<br />
1994).<br />
Producing large and complex software systems requires finding software<br />
engineering methods and techniques that can demonstrate coping<br />
with the scale and complexity of these systems. The scalability can be defined<br />
as a possibility of using a certain method or technique on a much<br />
bigger set of artifacts without an exponential, or other very significant, increase<br />
of the cost of using this technique. The cost is defined here both in<br />
terms of required effort and skills to tackle a given problem. Unsurprisingly,<br />
computer science and programming scientific articles seem to report<br />
scalable methods or paradigms more often than software engineering research<br />
literature. The main difficulty of successfully researching scalable<br />
7
software engineering mechanisms lies in the human-intense nature of software<br />
engineering tasks that limit automatic analysis and transformation<br />
possibilities.<br />
Producing a software system includes a set of activities and associated<br />
results which are called the software process. The high-level activities of software<br />
specification, development, validation and evolution are parts of software<br />
processes. Software process models are ways of abstracting, defining<br />
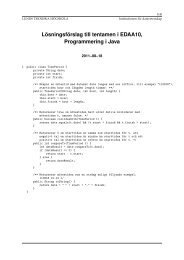
and connecting these activities. Figure 1 depicts the first published software<br />
development model, called the waterfall model (Royce, 1970). This<br />
model is still used in 40% of the companies, according to the survey from<br />
2003 (Neill and Laplante, 2003). The simplicity of this model is unquestionably<br />
one of its strong points (Pfleeger, 2001). The five principal stages<br />
of the model contains the following activities (Sommerville, 2007; Royce,<br />
1970):<br />
Requirements<br />
definition<br />
Systemand y<br />
softwaredesign<br />
Implementation<br />
andunittesting<br />
Integrationand<br />
systemtesting<br />
y g<br />
Operation Operationand and<br />
maintenance<br />
Figure 1: The software life cycle waterfall model (Sommerville, 2007;<br />
Royce, 1970)<br />
• Requirements analysis and definition - in this phase, high level goals,<br />
constrains and functionality are discussed are agreed on with system<br />
users. The resulting agreement on the content of the software system<br />
is often documented in a document called a system specification<br />
8
• System and software design - the initial set of high-level requirements<br />
is mapped onto an overall system architecture comprising both hardware<br />
and software elements. At this stage, the fundamental software<br />
system abstractions and their relationships are also defined<br />
• Implementation and unit testing - in this phase, software developers<br />
realize the software design into working software units. The accordance<br />
of the functionality of each working unit with the requirements<br />
is verified in unit testing<br />
• Integration and system testing - the previously produced software units<br />
are integrated, and the integration correctness is tested as a complete<br />
system to ensure that the software requirements have been met<br />
• Operation and maintenance - in the final phase, errors that were not<br />
discovered in earlier stages of the life cycle are addressed, improving<br />
the implementation of system units and enhancing the system’s<br />
services when requirements are discovered<br />
The waterfall received many critics since being introduced. McCraken<br />
and Jackson (1981) pointed out that the model imposes a project management<br />
structure on system development. Furthermore, Curtis et al (1987)<br />
noted that the waterfall model’s major shortcoming lies in its inability to<br />
treat software as a problem-solving process and to consider software development<br />
process as a manufacturing process rather than a creation process.<br />
As a result, other software development process models were proposed.<br />
One of the proposed models is the spiral model proposed by Boehm<br />
(1988), where the software development process is represented as a spiral.<br />
A phase in this model is represented as a loop in a spiral with four sectors:<br />
(1) objective setting, (2) risk assessment and reduction, (3) development<br />
and validation and (4) planning. The proposed model explicitly recognizes<br />
and analyzes risks stressing the importance of continuous risk management.<br />
Another model, called the prototyping model, allows all or part of<br />
the system to be constructed quickly to understand or clarify issues, it has<br />
the same objective as an engineering prototype. Blazer’s transformational<br />
model (1981) tries to reduce the opportunity for error by eliminating several<br />
development steps. Finally, new software development models that<br />
have recently emerged, such as Agile (Cunningham, 2012) and Software<br />
Product Lines (Pohl et al, 2005b) paradigms.<br />
According to the Agile manifesto, (1) individuals and interactions should<br />
be put over processes and tools, and (2) the contract negotiation should be<br />
sustained by a close customer collaboration (Cunningham, 2012). Moreover,<br />
the Agile manifesto favors responding to change rather than following<br />
a plan, and the value of delivering early prototypes to the customer<br />
rather than a comprehensive documentation. On the other hand,<br />
the Software Product Lines (SPL) paradigm provides a strategic reuse of<br />
9
assets within an organization. SPLs help to cope with complexity of today’s<br />
software-intensive systems by using platform and mass customization<br />
during their development (Pohl et al, 2005b).<br />
The requirements analysis and definition phase has changed from being<br />
initially recognized as a simple planning phase where the requirements<br />
are written down to a separated research field within software engineering.<br />
Many definitions of requirements engineering were proposed since<br />
the field was established. The classical definition of requirements engineering<br />
given by Sommerville (2007) defines it as “the process of understanding<br />
and defining what services are required from the system and identifying<br />
the constraints of the system’s operation and development”. The use<br />
of the term “engineering” implies that the techniques used to ensure that<br />
system requirements are complete, consistent and relevant should be applied<br />
in a systematic way, and that the whole process should be repeatable.<br />
Kotonya (1998) compares requirements engineering to “system analysis”<br />
which is mainly concerned about analyzing and specifying business systems.<br />
However, system analysis is mainly focusing on business aspects,<br />
while requirements engineering is often concerned with both business and<br />
system concerns of a system to be developed. The importance of requirements<br />
engineering is stressed by Aurum and Wohlin (2005) as one of the<br />
most crucial stages in software design and development when the critical<br />
problem of designing the right software for the customer is tackled. Aurum<br />
and Wohlin extend the definition of requirements engineering with<br />
the identification of goals for a proposed system, the operation and conversion<br />
of these goals into services and constraints, as well as the assignment<br />
of responsibilities for the resulting requirements to agents as humans, devices<br />
and software (Aurum and Wohlin, 2005; Sommerville, 2007). The initially<br />
proposed ways of grasping the requirements engineering discipline<br />
need further extensions, for example in the Market-Driven Requirements<br />
Engineering (MDRE) context described later in this chapter.<br />
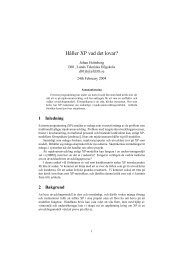
There are many different views on what to include into the requirements<br />
engineering process (Kotonya and Sommerville, 1998; Sommerville,<br />
2007; Neill and Laplante, 2003; Berenbach et al, 2009). The view depicted<br />
in Figure 2, illustrates the requirements engineering process in four highlevel<br />
sub-processes, namely: (1) feasibility study, (2) requirements elicitation<br />
and analysis, (3) requirements specification and (4) requirements validation<br />
(Sommerville, 2007). Another view on the requirements engineering<br />
process, provided by Kotonya (1998), consists a set of three structured<br />
activities, namely: (1) requirements elicitation, (2) requirements analysis<br />
and negotiation and (3) requirements validation. Their overall goal is to<br />
produce, validate and maintain a system requirements document.<br />
The four main sub-processes of the requirements engineering process<br />
model provided by Sommerville (2007) are complemented by the “feasibility<br />
study” sub-process concerned with assessing whether the system is<br />
useful to the business. Figure 2 illustrates also the relationships between<br />
10
these activities and documents produced at each stage in the requirements<br />
engineering process. The model presented in Figure 2 is one among many<br />
defined in the requirements engineering discipline. Another example is the<br />
spiral model that accommodates approaches to a development in which<br />
the requirements are developed to different levels of detail. The number of<br />
iterations around the spiral can vary, so the spiral can be exited after some<br />
or all of the user requirements have been elicited (Boehm, 1988).<br />
Feasibility y<br />
study<br />
Feasibility Feasibilityreport report<br />
Requirements<br />
Requirements<br />
elicitationand<br />
analysis<br />
Systemmodels<br />
Requirements<br />
Requirements<br />
specification<br />
Userandsystem<br />
requirements<br />
Requirements q<br />
validation<br />
Requirements<br />
Document<br />
Figure 2: A requirements engineering process example (Sommerville,<br />
2007).<br />
1.2 Requirements management in a large-scale market driven<br />
context<br />
Changes to existing requirements and new requirements arriving to the<br />
project are inevitable situations at all stages of the system development<br />
process (Kotonya and Sommerville, 1998). Furthermore, a common case<br />
is that a significant part of an initial system’s requirements will be modified<br />
before it is put into service (1998). This fact may often cause serious<br />
problems for the development of the system. To cope with changes to requirements,<br />
Requirements Management (RM) activities are necessary to<br />
document and control these changes. Requirements management can also<br />
11
e considered as a process of managing large amount of information and<br />
ensuring that it is delivered to the right people at the right time.<br />
The principal requirements management activities, according to Kotonya<br />
and Sommerville (1998), are: (1) change control and (2) change impact assessment.<br />
The change impact assessment comprises warrants that proposed<br />
changes have a known impact on the requirements and software<br />
system. The change control ensures that, if a change is accepted, its impact<br />
on design and implementation artifacts will be addressed (Kotonya and<br />
Sommerville, 1998). Also, managing requirements relationships and managing<br />
dependencies between the requirements can be considered as a part<br />
of RM. Therefore, RM activities are performed in parallel to the requirements<br />
engineering activities and they play a supportive role for them. According<br />
to Chrissis (2004), the purpose of requirements management is to<br />
manage all post-elicitation results in a project or product, and to identify<br />
inconsistencies between those requirements and a project’s plans or outcomes.<br />
Berenbach et al (2009) go a step further and outline requirements<br />
management activities that take place in most, if not all, projects. They<br />
list tasks such as identifying volatile requirements, establishing policies<br />
for requirements processes, prioritizing requirements, establishing and updating<br />
the requirements baselines, documenting decisions and allocating<br />
requirements to releases (Berenbach et al, 2009). Other concerns of requirements<br />
management involve management of relationships between<br />
requirements, and management of dependencies between requirements<br />
documents and other documents produced during the software engineering<br />
process. This thesis focuses on requirements management for Market-<br />
Driven Requirements Engineering (MDRE) contexts.<br />
Software can in general be released in two modes. The first one is called<br />
a customer specific mode (also called bespoke or contract-driven) when a<br />
software product is built to fulfill the contract agreement. The other one<br />
is called a market-driven mode (or packaged software or commercial off-the<br />
shelf) when a software product is addressed to a certain market or group<br />
of users. While the main objective in the bespoke mode is often to fulfill<br />
a contract and to comply with a requirements specification, the marketdriven<br />
mode focus mainly to deliver the right product at the right time to<br />
the targeted market (Regnell and Brinkkemper, 2005). Moreover, in the bespoke<br />
requirements engineering, the success of a software product can be<br />
measured by its compliance to a previously agreed requirements specification.<br />
In Market-Driven Requirements Engineering (MDRE), the situation is<br />
however much more complex. Here, the success of the software product is<br />
mainly dependent on the market response which can not be fully assumed<br />
’a-priori’. Therefore, the release time is also important (Wohlin et al, 1995;<br />
Sawyer, 2000; Chen et al, 2005), or for some cases even more important<br />
than the functionality that the newly released product is providing. The<br />
previous fact puts hard time constraints on the requirements engineering<br />
and management activities, demanding them to be more flexible, scalable<br />
12
and less time consuming (McPhee and Eberlein, 2002). For example, while<br />
setting the scope in a bespoke software project involves time-consuming<br />
negotiations and conflict mitigations, in MDRE the scope of the project has<br />
to be set using prioritization techniques based on market predictions and<br />
effort estimates (Karlsson, 1998; Sawyer, 2000; Carlshamre, 2002b). There<br />
is no consensus made between the customer and the contractor of the system,<br />
which means that the responsibility for the selection process is only<br />
on the contractor who must venture its implications.<br />
A company that is operating in a MDRE context should continuously<br />
monitor the market situation by checking competitors’ latest achievements,<br />
researching market needs and collecting all possible feedback from the<br />
market in a chase for achieving or maintaining the cutting edge position<br />
within its operational business. This chase after an optimal market window,<br />
together with other reasons, creates a constant flow of new requirements<br />
and ideas throughout the entire software product lifetime (Karlsson<br />
et al, 2002). As a result, the volume of the requirements database continues<br />
to grow, putting requirements management techniques and documentation<br />
systems to test. Therefore, the requirements process for MDRE<br />
needs to be enriched with procedures to capture and analyze this constant<br />
flow of requirements (Higgins et al, 2003). Software products in MDRE<br />
are continuously evolving and are delivered in multiple releases. The release<br />
planning has to focus on time-to-market and return of investment<br />
factors. On the contrary, bespoke requirements engineering focuses on one<br />
major release which follows the maintenance period. Finally, the results<br />
of the effort put during the project can be seen much quicker in the bespoke<br />
requirements engineering case where validation is made continuously<br />
though the contract. In MDRE, the market is primarily verifying the<br />
final products (Regnell and Brinkkemper, 2005).<br />
The complexity and size of software intense systems continues to grow,<br />
which in turn gives increasingly large and complex sets of requirements.<br />
At the same time, requirements engineering research literature provides<br />
industrial examples (Natt och Dag et al, 2004, 2005; Regnell et al, 2006)<br />
where current RE technology have a useful but partial effect. Managing<br />
large numbers of requirements is an inevitable part of managing requirements<br />
in MDRE. The flow of new requirements is almost always delivering<br />
more requirements for software products than the actual development resources<br />
can implement during each project cycle. As a result, the size and<br />
complexity of the requirements databases grow even faster than the size<br />
and complexity of actual software products. In this thesis, this situation is<br />
named Large-Scale Requirements Engineering (LSRE) or even Very Large-<br />
Scale Requirements Engineering (VLSRE). These contexts are characterized<br />
in Paper VII, while the definitions and descriptions also are repeated in<br />
Section 3.1. The size of the requirements databases in a VLSRE case may<br />
exceed tens of thousands of requirements, which puts new expectations<br />
on requirements management methods and tool support. Furthermore, as<br />
13
development projects grow in complexity and new products with many<br />
features are released to the market, the importance of good practices in<br />
requirements management grows (Berenbach et al, 2009). Improving the<br />
scalability of requirements engineering and management tools, processes<br />
and methods is crucial for succeeding in VLSRE contexts. Most of the research<br />
in this thesis, apart from the experiment study reported in Paper II,<br />
has been conducted in a VLSRE context.<br />
Software Product Lines (SPL) have gained more prominence amongst<br />
large software companies. SPLs provide a strategic reuse of assets withing<br />
an organization (Pohl et al, 2005b). Reuse of common features between<br />
product is called variability management. Variability is defined as the possibility<br />
of a software artifact having more than one behavior in its lifecycle<br />
(Svahnberg, 2003). Variability management is the result of software<br />
products changing from originally rather static systems to highly extensible<br />
and dynamically changing contemporary software systems (van Gurp<br />
et al, 2001).<br />
An SPL concept called scoping is the process of selecting requirements<br />
to implement in the forthcoming project (Wohlin and Aurum, 2005; Greer<br />
and Ruhe, 2004). Scoping is a key activity for achieving economic benefits<br />
in product line development (Schmid, 2002). It is important to mention that<br />
SPLs apply to more than just the source code and extends to other artifacts<br />
used to construct software products. New products are created by reusing<br />
as much software artifacts as possible. Some of the benefits of using the<br />
SPL approach are: (1) decreased time-to-market, (2) improved control over<br />
unpredicted growth, (3) improved quality of the product (Linden et al,<br />
2007) or (4) achieved reuse goals (Clements and Northrop, 2002). When<br />
using SPLs, a system’s complexity and cost have an invese relationship.<br />
SPLs increase the possibility of flexibility within the organization, since<br />
the knowledge in the organization is more widely deployed (Clements and<br />
Northrop, 2002).<br />
2 Research Focus<br />
Empirical studies were conducted to shape the research goals for this thesis.<br />
Paper VII reported on the exploration of and the experiences in a very<br />
large-scale requirements engineering context. Three challenging research<br />
areas in very large-scale requirements engineering are identified in this paper.<br />
• Challenge 1: Sustainable requirements architectures: fighting information<br />
overload. The term requirements architecture is here understood<br />
as the underlying structure by which the requirements are<br />
organized. This includes the data model of the requirements with<br />
their pre-conceived attributes and relations. In very large-scale requirements<br />
engineering (see Section 3.1 for the precise defonition of<br />
14
the VLSRE context), the amount of information that must be managed<br />
is immense and impossible to grasp by a single person. Therefore,<br />
the need emerged for scalable requirements architectures that<br />
are sustainable and allow for controlled growth. Scalable requirements<br />
architectures help the requirements engineers in a large organization<br />
to track the myriad of issues that continuously emerge.<br />
Paper III deals with this research challenge. Paper XXVI presents a<br />
modeling framework for requirements artifacts dedicated to a largescale<br />
market-driven requirements engineering context.<br />
• Challenge 2: Effective requirements abstractions: fighting combinatorial<br />
explosions. Managing interdependencies, prioritization,<br />
resource estimation, and change impact analysis are critical in VL-<br />
SRE. The inevitable combinatorial explosions significantly increase<br />
the complexity of the mentioned tasks. A major vehicle for fighting<br />
these combinatorial explosions may be the use of abstraction mechanisms<br />
and experience-based heuristics. Papers I, II, VI and XXVI deal<br />
with this research challenge. Paper XXII explores challenges in supporting<br />
the creation of data minable regulatory codes in very largescale<br />
requirements projects.<br />
• Challenge 3: Emergent quality predictions: fighting over-scoping.<br />
Given a competitive market and a large and demanding set of stakeholders,<br />
there appears to be an inevitable shortage of resources to<br />
meet quality expectations. Predicting the system level quality that<br />
emerges from a myriad of details is challenging, sometimes resulting<br />
in a sustained risk of defining a too large scope for platform development.<br />
Papers I, IV, V, VI, IX, X, XI, XII, XIV, XV, XVI, XXII, XXIII,<br />
XXIV, XXV and XXVII cover aspects related to this research area.<br />
A two-stage empirical investigation was conducted into large-scale requirements<br />
engineering contexts, and was reported in Papers VIII and XIII.<br />
First, seven practitioners from Sony Ericsson were questioned regarding<br />
the tasks in very large-scale requirements engineering and the quality attributes<br />
of requirements architecture. The results are reported in Paper<br />
XIII.<br />
Next, six participants from two additional companies were interviewed<br />
in order to obtain an improved understanding of the challenges in scaling<br />
up requirements engineering processes. We focused on understanding<br />
which challenges are exacerbated in large or very large-scale contexts.<br />
These challenges helped in defining the research goals and provided input<br />
to the papers reported in this thesis. We identified five additional challenges.<br />
• Challenge 4: Scoping. This includes the challenge of getting to see<br />
the "big picture" of numerous scoping decisions. This challenge calls<br />
15
for further research into visualizing the scope of a project. Scope visualizations<br />
could help minimize effort wasted on features that are later<br />
removed from the scope of a project. The scoping challenge also calls<br />
for further research into developing lightweight methods for scope<br />
management that can scale up to VLSRE. Papers I, IV, V, VI, IX, X, XI,<br />
XII, XIV, XV, XVI, XXII, XXIII, XXIV, XXV and XXVII cover aspects<br />
related to this challenge. This challenge is related to challenge 3.<br />
• Challenge 5: Organization and responsibility. This includes the<br />
challenge of managing growing organizations with overlapping roles<br />
and untrained newcomers. This requires better understanding of<br />
how to organize a growing software organization. Clearly defined<br />
roles can minimize the problem of work "falling between the chairs".<br />
• Challenge 6: Communication gaps. This includes the differences in<br />
understanding the requirements by different roles and direct communication<br />
with customers. This challenge calls for further research<br />
into supporting the multiple-viewpoint understanding and the interpretation<br />
of complex sets of requirements. It also calls for discovering<br />
methods which improve conveying the voice of the customers by<br />
customer representatives. Paper XX investigates this challenge.<br />
• Challenge 7: Process misalignments. These occur when interacting<br />
sub-processes are not coordinated and synchronized. This challenge<br />
calls for further research into improved synchronization of processes,<br />
faster communication of process changes, and the development of<br />
methods for assessing the scalability of requirements management<br />
processes. Paper XVIII investigates this challenge.<br />
• Challenge 8: The Structure of RE artifacts. This includes how to<br />
group, reuse, understand and control changes in large and complex<br />
sets of requirements. This challenge calls for investigations into requirements<br />
artifact structures that are effective and efficient in the<br />
large. Papers VIII and XXVI investigate this challenge. This is also<br />
related to challenge 1.<br />
The research focus of this thesis centers on an amalgamation of the<br />
identified research challenges 1, 2, 3 and 4: providing visualization of scoping<br />
dynamics for very-large projects (Papers I and VI); speeding up information<br />
analysis (Paper II); reducing the information overload (Paper III);<br />
understanding the reasons and consequences of setting a too large scope<br />
of a project (Paper IV); and factors affecting scoping decisions (Paper V).<br />
The remaining related challenges 5, 6, 7 and 8 are not investigated in this<br />
thesis 1 .<br />
The main research questions investigated in this thesis are as follows:<br />
1The investigation of the remaining related challenges 5, 6, 7 and 8 is a part of future work,<br />
e.g. see Papers XX and XXVI.<br />
16
• RQ1: How can the scope dynamics in a large-scale software development<br />
context be visualized?<br />
• RQ2: Does the linguistic method of finding similar requirements outperform<br />
the searching and filtering method of the requirements consolidation?<br />
• RQ3: What are obsolete software requirements? What is their impact<br />
on industry practice? How are they identified and managed?<br />
• RQ4: What are the causes and effects of overscoping?<br />
• RQ5: What decision characteristics influence decision making in largescale<br />
market-driven requirements engineering?<br />
• RQ6: How can the scope change dynamics in a large-scale agileinspired<br />
requirements engineering context be visualized?<br />
PaperXIII<br />
PaperVII<br />
PaperVIII<br />
Result:Empiricalinvestigation<br />
oflinguisticsupportfor<br />
requirementsconsolidation<br />
Result:What<br />
decision<br />
characteristics<br />
influencedecision<br />
making<br />
PaperII<br />
RQ2<br />
Contextexploration,research<br />
goalsformulationand<br />
challengesdiscovery<br />
Prioritization<br />
CHALLENGE1:<br />
INFORMATIONOVERLOAD<br />
RQ3<br />
PaperV PaperIV<br />
Result:<br />
Visualizationof<br />
scopechangesand<br />
scopemetrics<br />
CHALLENGE2:<br />
COMBINATIORALEXPLOSIONS<br />
CHALLENGE3:<br />
SCOPING<br />
PaperI PaperVI<br />
Result:Empiricaldefinitionand<br />
investigationofObsoleteSoftware<br />
Requirements<br />
PaperIII<br />
Result:<br />
Visualizationof<br />
scopechangesin<br />
agileprojectsand<br />
decisionarchetypes<br />
Result:Causes<br />
andeffectsof<br />
ovescoping<br />
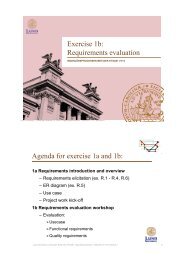
Figure 3: The relationships between challenges, research questions and papers<br />
presented in this thesis.<br />
Figure 3 depicts relationships between research questions and research<br />
challenges. Paper II addresses research challenge 2. In Paper II (addressing<br />
research question RQ2), a replicated experiment designed to further investigate<br />
the linguistic tool support for the requirements consolidation task is<br />
reported. In this experiment, new requirements are analyzed against those<br />
17
already present in a requirements database, and similarities are discovered<br />
and recorded. Forty five subjects were assigned to use either linguistic<br />
similarity or searching and filtering for the requirements consolidation<br />
Paper III addresses research challenge 1 and RQ3. This paper empirically<br />
investigates how outdated information is managed in requirements<br />
repositories. In the absence of mechanisms to clean up outdated information,<br />
the amount of information grows continuously. Paper III surveyed<br />
219 respondents from 45 countries, exploring the phenomenon of OSRs<br />
by: (1) eliciting a definition of OSRs as seen by practitioners in industry, (2)<br />
exploring ways to identify and manage OSRs in requirements documents<br />
and databases, (3) investigating the potential impact of OSRs, (4) exploring<br />
the effects of project context factors on OSRs, and (5) defining what types<br />
of requirements are most likely to become obsolete.<br />
Papers I, IV, V and VI explored the third challenge, scoping. In Paper<br />
I, addressing research question RQ1, the Feature Survival Charts scope visualization<br />
technique was implemented and evaluated in three projects.<br />
The evaluation demonstrated that the charts can effectively focus investigations<br />
of reasons behind scoping decisions, and that they can be valuable<br />
for future process improvements. A set of scoping measurements is also<br />
proposed, analyzed theoretically and evaluated empirically with data from<br />
the cases.<br />
Paper IV, addressing research question RQ4, reports from a case study<br />
aimed at understanding overscoping in a large-scale, market-driven requirements<br />
engineering context. The results provide a detailed picture of<br />
overscoping as a phenomenon including a number of causes, root causes<br />
and effects. Paper IV also indicates that overscoping is mainly caused by<br />
operating in a fast-moving, market-driven context. Weak awareness of<br />
overall goals, in combination with low development involvement in early<br />
phases, may contribute to ’biting off’ more than a project can ’chew’. Furthermore,<br />
overscoping may lead to a number of potentially serious and<br />
expensive consequences, including quality issues, delays, and failure to<br />
meet customer expectations.<br />
Paper V, addressing research question RQ5, investigates what factors<br />
influence the decision lead times and the decision outcomes. A large decision<br />
log in a retrospective case study at a large software company was<br />
statistically analyzed and the results were validated in a survey among industry<br />
participants.<br />
Paper VI, addressing research question RQ6, extends the Feature Survival<br />
Charts technique to a very large agile-inspired context. Paper VI also<br />
presents decision patterns and archetypes derived from this context.<br />
The list of challenges, albeit derived from several companies in an empirical<br />
investigation, should not be considered as the only list of issues<br />
in large-scale requirements engineering. Several authors investigated and<br />
reported challenges in requirements engineering (Curtis et al, 1988; Hall<br />
et al, 2002; Karlsson et al, 2002; Maccari, 1999; Lubars et al, 1993) Among<br />
18
other challenges not investigated in this thesis are, for example: managing<br />
requirements interdependencies (Carlshamre et al, 2001), managing quality<br />
requirements (Berntsson Svensson, 2009), allocating resources (Trautmann<br />
and Philipp, 2009), integrating requirements engineering with the<br />
development process (Maccari, 1999), estimating cost (Magazinovic and<br />
Pernstål, 2008) or defining scalable requirements management processes<br />
(Berenbach et al, 2009).<br />
3 Related Work<br />
The research in this thesis relates to various aspects of requirements engineering<br />
and management. The concepts that the research is mostly related<br />
to are: large-scale software engineering, market-driven requirements engineering,<br />
requirements management, requirements prioritization, release<br />
planning and roadmapping, and finally requirements visualization. These<br />
aspects, together with examples of scientific contributions, are presented<br />
in the sub-chapters that follow.<br />
3.1 Engineering and researching large-scale software systems<br />
One of the interesting characteristics of the requirements engineering is the<br />
ability to abstract large parts of the source code and pack them under a concise<br />
name of the feature. Depending on the abstraction level, 50 000 lines of<br />
the source code solution may be represented as a single market feature, or<br />
as a set of 200 system level requirements related with 200 quality aspects.<br />
This ability of compression may lead to the situation when requirements<br />
engineering research reported in a large-scale context actually operates on<br />
a small amount of high-level information, simplifying the problem of scalability.<br />
As a result, reported methods do not have to be fully scalable, unless<br />
they only operate on this high abstraction level.<br />
While browsing requirements engineering research literature, it is tempting<br />
to make the statement that most research reported follows the mentioned<br />
abstraction level simplification. A precise definition of the context<br />
where the result of an inquiry applies, or have been performed, is undoubtedly<br />
a proper, but rare, behavior. When the simplification of the placement<br />
of the reported results on the abstraction ladder is made, addressing the<br />
scalability of achieved results becomes difficult. As a step towards clarifying<br />
the mentioned issue, related Paper VII proposes a classification of<br />
the orders of magnitude in requirements engineering is introduced, also<br />
repeated here. Table 1, also available in Paper VII, defines four orders of<br />
magnitude in RE, based on the size of the set of requirements that are managed<br />
by an organization that develops software-intensive systems. The<br />
levels are inspired by the characterization of orders of magnitude in the<br />
19
digital circuits integration field.<br />
The number of requirements was chosen as a proxy for complexity,<br />
as it is believed in Paper VII that increased numbers of customers, end<br />
users, developers, subcontractors, product features, external system interfaces,<br />
etc. come along with increased number of requirements generated<br />
in the RE process. This in turn increase the complexity of requirements<br />
engineering. Furthermore, Paper VII suggests that the complexity of a<br />
set of requirements is heavily related to the nature of interdependencies<br />
among requirements, see e.g. Carlshamre et al (2001) for an empirical investigation<br />
of interdependencies. With a realistic degree of interdependencies<br />
among n-tuples of requirements, it can be hypothesized that the<br />
number of interdependencies to elicit, document and validate increases<br />
significantly with the increased number of requirements. When shifting<br />
from MSRE to LSRE, a typical heuristic for dealing with the complexity<br />
of interdependency management is to bundle requirements into partitions<br />
and thereby creating a higher level of abstraction, where interdependencies<br />
among bundles can be managed with reasonable effort. When shifting<br />
from LSRE to VLSRE, the conjecture is that even the number of bundles<br />
gets too high and the size of bundles becomes too large to allow for<br />
interdependency management with desired effectiveness. If the number<br />
requirements bundles becomes too large, the interdependency links loose<br />
practical usefulness as they relate to coarse grained abstractions.<br />
SSRE and MSRE are a common scale in research papers that seek to<br />
validate a proposed method or tool. For example, in Feather et al (2000), a<br />
specific tool is validated only with a set of 67 requirements and Hayes et<br />
al (2004) used a dataset with 19 high level and 49 low-level requirements.<br />
In this situation, it is possible to enumerate and manage complex relations<br />
among requirements, even with dense relation patterns. However, it is<br />
believed in Paper VII that few industrial situations in current system development<br />
can avoid stretching beyond SSRE and even MSRE. Only a few<br />
examples in RE literature that discusses LSRE (such as Park et al (1998))<br />
and VLSRE (such as Natt och Dag et al (2004)) can be found whether the<br />
author believes that LSRE is common industrial practice, confirmed also<br />
by Brinkkemper (2004).<br />
The belief presented in Paper VII saying that a significant number of<br />
companies that currently face LSRE will grow into the situation of VLSRE<br />
is confirmed by Berenbach et al (2009), who report on large project with<br />
thousands of requirements Siemens is working with. Berenbach et al (2009)<br />
also mentioned that one of the current misconceptions about requirements<br />
engineering is the statement that processes that work for a small number<br />
of requirements will scale whether, according to him, requirements engineering<br />
processes do not scale well unless crafted carefully.<br />
Another problem mentioned by Berenbach et al (2009) is the requirements<br />
explosion during a large project when the processes put in place at<br />
the beginning of a project do not take into consideration the number of re-<br />
20
Table 1: Orders of magnitude in requirements engineering , based on Paper VII.<br />
Abrev. Level Order of magnitude Sample empir- Interdependency management conjectures<br />
ical evidence with current RE technology<br />
SSRE Small-Scale 10 requirements Managing a complete set of interdepen-<br />
Requirements<br />
dencies requires small effort.<br />
Engineering<br />
MSRE Medium-Scale 100 requirements (Feather et al, Managing a complete set of interdepen-<br />
Requirements<br />
2000) dencies is feasible but requires large ef-<br />
Engineering<br />
fort.<br />
LSRE Large-Scale 1000 requirements (Park and Managing a complete set of interdepen-<br />
Requirements<br />
Nang, 1998) dencies is practically unfeasible, but fea-<br />
Engineering<br />
sible among small bundles of requirements.<br />
VLSRE Very Large-Scale 10000 requirements (Regnell et al, Managing a complete set of interdepen-<br />
Requirements<br />
2006) dencies among small bundles of require-<br />
Engineering<br />
ments is unfeasible in practice.<br />
21
quirements that may need to be managed. As an example (also repeated<br />
in Figure 4), Berenbach et al (2009) gave a project with 50 features to start<br />
that may not appear to be a large project. After a not unreasonable explosion<br />
of each feature to 100 or more high-level requirements the project<br />
can grow up to over 5000 high-level requirements. Adding an additional<br />
explosion layer of detail needed to implement the product in both its functional<br />
and quality aspects and create test cases can wind up with a total of<br />
50000 requirements and at least the same number of traces. Such a number<br />
of requirements to manage and trace in unreasonable for today’s large<br />
projects.<br />
1. An initial set of 50<br />
high level features<br />
may not appear to be a<br />
large project<br />
3. The project can<br />
grow up to over<br />
5000 high-level<br />
requirements<br />
50 features<br />
5000 high-level<br />
requirements<br />
50000 requirements + 50000<br />
traces<br />
2. Each high level<br />
feature is redefined<br />
to 100 or more highlevel<br />
requirements<br />
4. Adding an<br />
additional explosion<br />
layer of detail<br />
needed for<br />
implementation<br />
5. A total of 50000 requirements and<br />
at least the same number of traces<br />
Figure 4: An example of an explosion of the number of requirements during<br />
a project (Berenbach et al, 2009).<br />
To illustrate the complexity in VLSRE, an industrial example outlined<br />
in Paper VII is summarized here. This example provides a case description<br />
of embedded system engineering in the mobile phones domain, based<br />
on experience at Sony Ericsson which has faced a transition from LSRE to<br />
VLSRE in the last years, while remaining competitive on the market with<br />
a growing number of around 5 000 employees. Mobile phones include<br />
a wide range of features related to e.g. communication, business applications<br />
and entertainment. The technological content is complex and includes<br />
advanced system engineering areas such as radio technology, memory<br />
technology, communication protocols, security, audio and video, digital<br />
rights management, gaming, positioning etc.<br />
22
The complexity of requirements engineering is driven by a large and<br />
diverse set of stakeholders, both external and internal. Table 2 gives examples<br />
of stakeholders that generate requirements. Some stakeholders are<br />
counted in billions, such as consumers of different segments, while some<br />
are counted in hundreds, such as operators. In the case of Sony Ericsson,<br />
the requirements that are generated from internal and external stakeholders<br />
amount to several tens of thousands. Figure 5 provides a simplified picture<br />
of the different types of requirements and their relations. Similar to the<br />
case provided by Feather et al (2000) and Gorschek and Wohlin (2006), requirements<br />
originating from external stakeholders, called market requirements,<br />
are separated from, but linked to system requirements that are input<br />
to platform scoping in a Software Product Line (SPL) setting. Market<br />
requirements are mainly generated by operators submitting specifications<br />
with thousands of requirements that require statements of compliance. The<br />
total number of market requirements as well as platform system requirements<br />
at Sony Ericsson each exceeds 10 000. In order to make scoping feasible,<br />
platform system requirements are bundled into hundreds of features<br />
that represent the smallest units that can be scoped in or out. In order to<br />
support product development, the platform capabilities are organized into<br />
configuration packages that improve over time, as more and more features<br />
are implemented for each new version of a platform. Products are configured<br />
through assemblies of configuration packages according to the rules<br />
of how they can be combined based on their interdependencies.<br />
The reported publications that focus on large-scale software or requirements<br />
engineering can be classified into: (1) empirical reports from largescale<br />
contexts that often provide a number of challenges, (2) papers that<br />
literally evaluate or present a technique that is suitable for large contexts<br />
and (3) vision papers, often written by senior members of the software engineering<br />
community that provocatively bring the scalability issue to the<br />
future research agenda. In the sub-chapters that follow, more detailed results<br />
from the literature investigation are presented in the mentioned categories.<br />
3.1.1 Technical solutions or methods.<br />
Among the papers that report a technique or solution suitable for largescale<br />
software engineering contexts, Carman et al (1995) present a framework<br />
for engineering software reliability that was proposed at a large company<br />
called Bellcore. The framework, together with different reliability<br />
modeling tools, have been tested in pilot tests. Natt och Dag et al (2004)<br />
proposed a method to speed up requirements management that was applied<br />
to a context with over 10 000 requirements. Kaushik et al (2011) used<br />
information retrieval techniques to find traces between 13380 tests cases<br />
and a query of nine random software bugs.<br />
Communication and coordination are considered by Garg (1989) as play-<br />
23
Table 2: Examples of stakeholders that generate requirements (see Paper<br />
VII for more details).<br />
External Stakeholders Internal Stakeholders<br />
Competitors Accessories<br />
Consumers of different segments<br />
Customer Services<br />
Content providers Market research<br />
Legislation authorities Marketing and customer relations<br />
Operators Platform development (SW+HW)<br />
Retailers Product,<br />
planning<br />
application and content<br />
Service providers Product development (SW+HW)<br />
Shareholders Product management<br />
Standardization bodies Product management<br />
Subcontractors and component<br />
providers<br />
Sourcing, supply and manufacturing<br />
Technology and research development<br />
Usability engineering<br />
ing a central role in any large-scale cooperative effort. The article presented<br />
a design method based on “Intelligent Software Hypertext System” which:<br />
(1) can support a flexible and general purpose model for information management<br />
(hypertext) and (2) can support various software life cycle models.<br />
Linger et al (2007) discussed “function extraction technology” as an<br />
emerging software engineering research area. This technology aims to extend<br />
the possibilities of automatic computation of software components<br />
and their compositions into systems.<br />
Travassos et al (2008) presented and discussed an experimentation environment<br />
that could support large-scale experimentation and knowledge<br />
management in software engineering. The presented “Software Engineering<br />
Environment Framework” provides a set of facilities to allow geographically<br />
distributed software engineers and researchers to accomplish and<br />
manage experimentation processes and to manage the scientific knowledge<br />
during different studies. The methodological viewpoint on largescale<br />
software engineering was also taken by Kitchenham et al (2007) who<br />
recommend adopting a more systematic approach to accumulate and report<br />
large quantities of empirical evidence. The proposed solution is to<br />
use quasi-experimental designs to improve the methodology of large-scale<br />
software engineering empirical studies.<br />
24
Market Requirements<br />
~10000<br />
MR1<br />
MR2<br />
Platform System Requirements ~10000<br />
Features ~100<br />
Configuration Packages ~100<br />
PSR1<br />
PSR2<br />
F1<br />
MR4 MR3<br />
PSR3 F3 CP3<br />
SR1<br />
SR2<br />
SR3<br />
Cv1<br />
Cv2<br />
Component<br />
Versions ~100<br />
Supplier<br />
Requirements ~1000<br />
F2<br />
Pv1<br />
Pv2<br />
Pv3<br />
Platform<br />
Versions ~10<br />
CP1<br />
CP2<br />
Products ~100<br />
P1<br />
P2<br />
P3<br />
MR Market Requirement<br />
PSR Platform System Req<br />
P Product<br />
SR Supplier Requirement<br />
Cv Component version<br />
Pv Platform version<br />
CP Configuration Package<br />
F Feature<br />
Figure 5: Orders of magnitude in different artifacts of a specific VLSRE<br />
case (see Paper VII for more details).<br />
3.1.2 Empirical reports from large-scale contexts.<br />
A significant fraction of empirical reports from large-scale contexts is written<br />
by practitioners from large companies. Among them, Conrad and Gall<br />
(2008) reported on lessons learned and challenges faced in the development<br />
of large-scale systems. The list of challenges comprises:<br />
• Large number of customer requirements<br />
• Formal interface to customer<br />
• Management of customer expectations<br />
• Changing technology<br />
• Traceability<br />
• Scope change and creep<br />
• Resource fluctuation<br />
The challenges were reviewed by requirements engineering experts at<br />
Siemens Corporate Research, who agreed that similar challenges could<br />
25
exist across projects with similar characteristics at numerous companies.<br />
One of the lessons learned was to establish a traceability model. Duan<br />
et al (2009a) used clustering techniques to assist in the prioritization process.<br />
The technique were evaluated on an example of 202 requirements.<br />
Cleland-Huang et al (2005) explored strategies for incorporating supporting<br />
information into a traceability recovery algorithm. The strategies were<br />
evaluated on a dataset consisting 180 functional requirements. Both mentioned<br />
examples can be classified as MSRE according to Paper VII.<br />
Berenbach et al (2009) stresses the importance of requirements engineering<br />
for large projects is stressed. Berenbach et al also presented a list<br />
of the common misconceptions about requirements engineering. One of<br />
the misconceptions is that processes which work for a small number of<br />
requirements will scale. According to Berenbach et al, requirements engineering<br />
processes do not scale well unless crafted carefully, and scalability<br />
of requirements engineering processes is challenging.<br />
Another view on LSRE is presented by Bergman et al (2002) who investigated<br />
the political nature of requirements for large systems and argued<br />
that requirements engineering theory and practice must become more engaged<br />
with these facets. Requirements for large systems are, according<br />
to Bergman et al (2002), constructed through a political decision process.<br />
In this process, requirements emerge as mappings between solution space<br />
and problem space. These solution spaces are “complex socio-technical<br />
ensembles” that often exhibit non-linear behavior in expansion due to domain<br />
complexity and political ambiguity.<br />
Ebert (2004) presented techniques for pragmatically dealing with nonfunctional<br />
requirements in large telecommunication systems. Cleland-Huang<br />
et al (2008) proposed an elicitation and prioritization process that utilizes<br />
data-mining and recommender technologies to facilitate the active involvement<br />
of many thousands of stakeholders. The presented solution was<br />
claimed as scalable and capable to support elicitation and prioritization<br />
of requirements for very large systems.<br />
3.1.3 Challenges and visions<br />
Another significant part of articles about large or very large-scale software<br />
and requirements engineering represents the future vision type of articles.<br />
These articles are often written in a provocative way by senior researchers<br />
within the field to stimulate the community to tackle some of the research<br />
challenges and opportunities. Among them, Boehm (2006) identified eight<br />
relatively surprise-free trends: (1) the increasing interaction of software<br />
engineering and systems engineering, (2) increased emphasis on users and<br />
end value, (3) increased emphasis on systems and software dependability<br />
(4) increasingly rapid change, (5) increasing global connectivity and need<br />
for systems to interoperate, (6) increasingly complex “systems of systems”,<br />
(7) increasing needs for COTS, reuse and legacy systems and software in-<br />
26
tegration and (8) computational plenty. Boehm (2006) also stated that, traditionally,<br />
system and software development processes were recipes for<br />
“standalone stovepipe systems” with a high risk of inadequate interoperability<br />
with other stovepipe systems. The lack of a common denominator<br />
for those stovepipe systems may cause unacceptable delays, uncoordinated<br />
and conflicting plans, ineffective or dangerous decisions and inability<br />
to cope with rapid changes.<br />
Herbsleb (2007) reflected on an increasing global connectivity and described<br />
a desired future for global development together with the problems<br />
that stand in the way of achieving that vision. Herbsleb outlined<br />
research challenges in four critical areas: (1)software architecture, (2) eliciting<br />
and communicating requirements, (3) environments and tools as well<br />
as (4) orchestrating global development. He named large-scale software<br />
development, when teams are geographically distributed, Global Software<br />
Development (GSD), and focused on technical coordination in GSD. The<br />
key phenomenon of GSD is the coordination over distance in a sense of<br />
managing dependencies between the tasks. The geographical and temporal<br />
distance can be considered as an additional, more process oriented,<br />
dimension of large-scale systems together with size and complexity.<br />
Damian (2007) considered globalization to be one of the major research<br />
challenges in requirements engineering. A global context makes it more<br />
difficult to seek out and to integrate the necessary knowledge. Process mismatches,<br />
differing technical and domain vocabularies, incompatible environments,<br />
and conflicting assumptions can be particularly problematic in<br />
a GSD context (Bhat et al, 2006). The challenge of supporting the ongoing<br />
negotiation processes prevalent throughout the project life-cycle is also important<br />
for multi-site companies (Curtis et al, 1988; Damian and Zowhgi,<br />
2003). Further challenge in GSD is to better understand what media are<br />
suitable for the different kinds of communication among all the business<br />
stakeholders, analysts and developers. Damian (2007) listed the following<br />
challenges in stakeholders’ global interaction:<br />
• Knowledge-acquisition and knowledge sharing processes that enable<br />
the exploration of stakeholders’ needs<br />
• Iterative processes that allow the reshaping of this understanding<br />
throughout the entire project<br />
• Effective communication and coordination processes that support the<br />
first two types of processes listed<br />
In 2006, the Software Engineering Institute (SEI), together with the U.S.<br />
Department of Defense (DoD) established a team of researchers and practitioners<br />
in order to investigate very complex systems characterized by<br />
thousands of platforms, sensors, decision nodes, weapons and war fighters<br />
connected through heterogeneous networks. The systems under consideration<br />
were characterized as pushing far beyond the size of current systems<br />
27
y every measure: number of lines of code, number of people employing<br />
the system for different purposes, amount of data stored, accessed, manipulated<br />
and refined, number of connections and interdependencies among<br />
software component and number of hardware elements.<br />
The systems were named as Ultra-Large-Scale (ULS) systems (Northrop<br />
et al, 2006). A ULS system could be compared with a biological system,<br />
with its community of interdependent and competing organisms and changing<br />
environment. The relevant concepts include complexity, decentralized<br />
control, hard-to-predict effects of certain kinds of disruptions, difficulty of<br />
monitoring and assessment, and the risks in monocultures (Northrop et al,<br />
2006). The ULS systems were characterized by (Northrop et al, 2006):<br />
• Decentralization. The scale of ULS systems imposes their decentralization<br />
in a variety of ways<br />
• Inherently conflicting, unknowable, and diverse requirements. The<br />
amount of stakeholders and the diversity of their needs in ULS systems<br />
will be immense. This will make impossible to solve all the<br />
conflicts between stakeholders needs<br />
• Continuous evolution and deployment. ULS systems will continuously<br />
evolve, causing constant challenges in integration, interoperability<br />
and deployment<br />
• Heterogeneous, inconsistent, and changing elements. A ULS system<br />
will be constructed from un-matching and evolving parts, causing<br />
many misfits and incompatibilities especially in the extension<br />
phase<br />
As it won’t be impossible to solve all conflicts in ULS systems, mechanisms<br />
will have to be proposed, or will automatically emerge, to resolve<br />
conflicts locally among those who have an immediate interest in them.<br />
ULS systems will also experience "wicked problems" when requirements<br />
are neither knowable in advance (because the final agreement about the<br />
system’s functionality can not be reached due to its changeable nature)<br />
nor stable (because each developed solution changes the view on the problem<br />
and the problem itself). As a result, no solution is considered to have<br />
"solved" the problem (Northrop et al, 2006).<br />
3.2 Requirements prioritization, product management, release<br />
planning and roadmapping<br />
Decision processes are the driving forces to organize corporations’ success<br />
(DeGregorio, 1999). At the same time, important decisions are often<br />
subjective (Strigini, 1996; Andriole, 1998). Software managers and decision<br />
makers need a better decision support in order to cope with the fast paste<br />
of changes in software technology (Aurum and Wohlin, 2003). Researchers<br />
28
have contributed in creating a better support for decision making based<br />
on their best knowledge and experience, computational and human intelligence,<br />
as well as methods and techniques (Ruhe, 2003). The decisionmaking<br />
process is considered as the dominant activity after the requirements<br />
are captured, analyzed and specified on the way towards their implementation.<br />
Aurum and Wohlin (2002; 2003) investigated decision making<br />
in requirements engineering by using classical decision making models,<br />
and they also illustrated illustrate how to integrate these models with<br />
requirements engineering process models.<br />
An integral part of market-driven requirements engineering contexts is<br />
a constant flow of new requirements arriving from multiple sources (Regnell<br />
and Brinkkemper, 2005). Making decisions about which of these incoming<br />
requirements implement and which not is a vital part of developing<br />
software systems that meet stakeholders’ needs and expectations (Karlsson<br />
and Ryan, 1997; Regnell et al, 1998). At the same time, it is almost impossible<br />
to involve all stakeholders to prioritize requirements, and there<br />
are usually more requirements than the company can implement within a<br />
given time and resources constraints (Berander, 2004). Thus, it is necessary<br />
to select a subset of requirements to implement in the forthcoming project,<br />
and hence postpone the implementation of other requirements to a later<br />
point in time (Wohlin and Aurum, 2005; Greer and Ruhe, 2004). This selection<br />
process is often called scoping, and is considered as a key activity for<br />
achieving economic benefits in product line development (Schmid, 2002).<br />
The requirements selection and release planning process is supported by<br />
a requirements prioritization, which can be defined as the activity during<br />
which the most important requirements for a system are identified (Sommerville,<br />
2007). The criteria that determine the priority of a requirement include:<br />
(1) importance to users and customers, (2) implementation cost, (3)<br />
logical implementation order and (4) financial benefit (Lethola and Kauppinen,<br />
2004). As a result, prioritization techniques help to make the outcome<br />
of sometimes difficult choices of which requirements to implement<br />
less surprising (Karlsson and Ryan, 1997).<br />
There are several prioritization techniques introduced in the literature.<br />
An important contribution in this topic has been made by Karlsson et al (1997)<br />
who provided a method based on pair-wise comparisons. The method, utilizing<br />
the Analytical Hierarchical Process (AHP) (Saaty, 1980), provides a<br />
valuable assistance in the prioritization task. Others, such as Beck (2000),<br />
introduced a planning game method for prioritization. The planning game<br />
method uses ordinal scale for grouping and ranking requirements. The<br />
grouping is usually based on cost, value and risk criteria. On the other<br />
hand, Karlsson et al (1996; 1997) introduced a numeral assignment technique<br />
that uses grouping requirements in for example three or five groups,<br />
usually based on customer value. The result is presented on the ordinal<br />
scale. Leffingwell and Widrig (2003) proposed a method called the 100$<br />
test or cumulative voting. It has been proposed suitable in distributed en-<br />
29
vironments, and is based on assigning fictional money to requirements and<br />
the results are presented on a rational scale. Koziolek (2012) proposed prioritizing<br />
quality requirements based on software architecture evaluation<br />
feedback. Perini et al (2007) compared the accuracy of AHP and CBRanking<br />
prioritization techniques. Duan et al (2009b) suggested automating<br />
a significant part of the prioritization process among a large number of<br />
stakeholders while Veerappa and Letier (2011) proposed using clustering<br />
techniques to identify relevant group of stakeholders that should be considered<br />
in the prioritization process. Avesani et al (2005) suggested casebased<br />
ranking to address the scalability issues of the AHP prioritization<br />
technique. Wiegers (2003) presents a method that combines the customer<br />
value, penalty if the requirements is not implemented, implementation<br />
cost and risk. Dot voting, binary search tree and the Kano Model are also<br />
used to prioritize requirement in agile projects (Bakalova et al, 2011).<br />
Although a significant progress has been made and reported in the prioritization<br />
techniques research, there are several issues related to this task.<br />
Firstly, there may be conflicts among customers’ prioritization lists (Berander,<br />
2004). In this situation, it is important to handle different stakeholders<br />
in a structured way. Regnell et al (2001) suggest that the most suitable<br />
strategy in the current market segment should be used to adjust each stakeholder’s<br />
influence in the prioritization process. Secondly, it is often the case<br />
that requirements arriving to the company are specified at different levels<br />
of abstraction, impeding the requirements prioritization process (Gorschek<br />
and Wohlin, 2006). Thirdly, requirements dependencies can also influence<br />
the prioritization outcome (Herrmann and Daneva, 2008). Their significant<br />
impact on the prioritization process makes it even more complex. One of<br />
these dependencies is the inevitable relation between functional and nonfunctional<br />
requirements which are often neglected during the prioritization<br />
task.<br />
Fourthly, the number of requirements to prioritize also impedes the prioritization<br />
process. In small-scale or even medium-scale requirements engineering,<br />
it is feasible to perform the prioritization task on a low level<br />
of abstraction where, in large- or very large-scale requirements engineering<br />
contexts the prioritization of low level requirements may be very time<br />
consuming or even impossible. Several studies proposed different ways of<br />
improving the scalability of requirements prioritization techniques: by using<br />
machine learning (Duan et al, 2009b), clustering (Veerappa and Letier,<br />
2011), case-based ranking (Avesani et al, 2005). Finally, it is challenging to<br />
use business value as a main prioritization criterion (Racheva et al, 2010),<br />
proving quantitative method to sizing quality requirements (Herrmann<br />
and Daneva, 2008)<br />
Releasing software to an open market is often done in several releases<br />
and then software is managed and developed as a product (Albourae and<br />
Ruhe, 2006; van de Weerd et al, 2006b). As a result, a product manager role<br />
emerged, bringing new types of tasks in MDRE context to cope with the<br />
30
shift from primarily developing customized software to developing software<br />
as a product (van de Weerd et al, 2006a,b). The special nature of<br />
software creates specific challenges in product management for software<br />
solutions, listed by van de Weerd (2006b):<br />
• No cost for manufacturing and distributing extra copies<br />
• The change to software product can be made rather easy by patches<br />
and release updates<br />
• The complexity of organizing requirements and tracing changes tasks<br />
is high<br />
• Software products are much more frequently released, partly due to<br />
their changeable characteristics<br />
• The software product manager’s responsibilities regarding the product<br />
functionality do not go along with authority over the development<br />
team.<br />
The benefits of software products, as it can be seen from the list above,<br />
come along with challenges and more complex requirements organization.<br />
Two integral parts of software product management are product roadmapping<br />
and release planning. Roadmapping includes planning how to use<br />
available technological resources and scientific knowledge, and their relationships<br />
over a period of time (Vähäniitty et al, 2002). Roadmapping<br />
is a form of forecasting a product or product family evolution overtime,<br />
including their relationships (R. E. Albright, 2003). Regnell and Brinkkemper<br />
(2005) define a roadmap document as a document including product<br />
releases plans over a time frame of three to five years. The literature<br />
provides many types of roadmap documents, (Schalken et al, 2001)<br />
where the one suitable for MDRE contexts release planning is the Product-<br />
Technology Roadmap. Roadmapping is a complex task, and it brings challenges<br />
in co-operation in different layers of product development, continuous<br />
communication (R. E. Albright, 2003), dependencies handling between<br />
related products, and coping with rapid technology changes (Carmel, 1999).<br />
Release planning, also called release management is another important<br />
activity in software product management. Software release management<br />
is the process of making software available to or obtained by its users (van<br />
der Hoek et al, 1997). Core functions in this process are requirements prioritization,<br />
release planning, constructing and validating a release requirements<br />
document and scope management. Various techniques have been<br />
proposed or explored in order to support release planning, namely integer<br />
linear programming (Abramovici and Sieg, 2002), the analytical hierarchy<br />
process (Saaty, 1980), stakeholders’ opinions on requirements importance<br />
(Ruhe and Saliu, 2005), constraints programming (Regnell and Kuchcinski,<br />
2011) and linear programming techniques using requirements interdependencies<br />
(Carlshamre, 2002a). Release planning is challenging due<br />
31
to: uncertainty of the information (Ruhe, 2009), many factors that may affect<br />
requirements priorities, requirements dependencies (Carlshamre et al,<br />
2001), changing viewpoints and quality requirements (Jantunen et al, 2011;<br />
Berntsson Svensson, 2011).<br />
The criteria identified as important by Wohlin and Aurun (2005) in selecting<br />
which requirements to include to the next project comprise: competitors,<br />
delivery date, development cost and stakeholder priority of requirement.<br />
The last two criteria are similar to the cost-value approach proposed<br />
by Karlsson and Ryan (1997) and to the QUPER model (Regnell et al,<br />
2008). Paper I analyzes the reasons for deciding what to remove from the<br />
scope of a project.<br />
Researchers have been investigating various aspects of MDRE, starting<br />
with Potts, who claimed that “during requirements analysis one party<br />
does not always elicit requirements from another, nor does it payback requirements<br />
so the other can accept, reject or refine them”. Thus, requirements<br />
in MDRE context are actually proposed or invented, rather than<br />
elicited (Potts, 1995). This fact adds additional dimensions to requirements<br />
engineering and requirements management process definitions, and is often<br />
responsible for an immense increase of complexity of RE and RM related<br />
activities. Regnell et al (1998) presented a specific industrial requirements<br />
engineering process for packaged software, which helped the studied<br />
company to achieve a measurable improvement in the delivery precision<br />
and product quality. The same author has researched the requirements<br />
selection task for MDRE (Regnell et al, 2004) and explored bottlenecks<br />
in MDRE processes (Höst et al, 2001). Berntsson Svensson focused<br />
on roadmapping of quality requirements in MDRE (Berntsson Svensson,<br />
2011). Others, such as Booth (2001) or Karlsson (2002), have focused on<br />
reporting challenges in MDRE based on empirical investigations, while<br />
Carlshamre et al (2000) focused on comparing two market driven requirements<br />
management models and emphasizing the crucial task of managing<br />
requirements dependencies.<br />
3.3 Visualization in software and requirements engineering<br />
Customers of software products are often non-technical people. Therefore,<br />
visualization in software engineering is a way of a more effective communication<br />
with these customers (Avison and Fitzgerald, 1998). For example,<br />
diagrams have an advantage of more concisely conveying the information<br />
(DeMarco, 1978) than the sentential representation of information<br />
(Larkin and Simon, 1987). Diagrams are scalable and can support a<br />
large number of perceptual inferences, which can easily be analyzed by<br />
humans (Larkin and Simon, 1987). As a result, many visual notations have<br />
been proposed since Goldstine and von Neumann’s (1948) first flowcharts<br />
notation in 1948, and are currently used not only for supporting implemen-<br />
32
tation and testing (Ball and Erick, 1981; Knight and Munro, 2000; Jones<br />
et al, 2000), but also other facets of software development (Ogawa et al,<br />
2007; Sellier and Mannion, 2006; Tory and Moller, 2004; Hornecker and<br />
Buur, 2006; Vasile et al, 2006; MacDonell, 2005; Biffl et al, 2005; Koschke,<br />
2003; Gotel et al, 2008). The strengths of visual notations are also used to<br />
develop software using the Model Driven Development (MDD) paradigm,<br />
where software is automatically generated from models (Beydeda et al,<br />
2005).<br />
The visual syntax of notations proposed in software engineering literature<br />
is treated with less attention than their semantics (Moody, 2009;<br />
Moody et al, 2010). The decisions about semantics (content) seam to be<br />
treated with great care. At the same time, visual representation (form)<br />
is considered a matter of aesthetics rather than effectiveness (Hitchman,<br />
2002) despite that the positive influence of the visual forms of notations<br />
on their understandability has already been confirmed in a number of empirical<br />
studies (Purchase et al, 2002; Nordbotten and Crosby, 2001; Masri<br />
et al, 2008). Moody (2009) provides a set of design principles in order to<br />
achieve a visually efficient notation and establish a scientific foundation<br />
for designing visual notations in software engineering. Moody’s analysis<br />
(2009) focuses on achieving cognitive effectiveness in terms of speed,<br />
ease and accuracy with which a representation can be processed by the<br />
human mind (Larkin and Simon, 1987).<br />
As an early phase of software development, requirements engineering<br />
is communication intensive. Therefore, it requires intensive and efficient<br />
communication among multiple stakeholders in order to agree upon the<br />
needs for a new software system or its extensions. Effective visualization<br />
techniques may significantly improve this communication by envisioning<br />
the real value of requirements. Visualization have, according to<br />
Gotel (2007), been used to support three aspects of requirements engineering:<br />
• Structure and relationships - visualizing the hierarchical structure<br />
of requirements documents, requirements patterns, or more complex<br />
graphs. Also, requirements traceability matrices are regularly<br />
created to convey linkage between artifacts and support change impact<br />
analysis (Duan and Cleland-Huang, 2006; Ozakaya, 2006; Sellier<br />
and Mannion, 2006; Osawa and Ohnishi, 2007; Supakkul and Chung,<br />
2010)<br />
• Elicitation support - visual prototypes, story board, mock-ups used<br />
to help stakeholders to explore requirements. If these initial drawings<br />
are made using a software tool, then the role of this type of visualization<br />
is more transient as they can be reused in later refinement<br />
activities (Pichler and Humetshofer, 2006; Feather et al, 2006; Zenebe<br />
and Norcio, 2007; Sutcliffe et al, 2011)<br />
33
• Modeling - providing a visualization of requirements specified in a<br />
formal language in order to facilitate validation activities. I*, goal<br />
modeling, behavioral views, modeling stakeholder concerns and UML<br />
frameworks fall into this category and therefore it can be concerned<br />
as the dominant focus of research efforts in requirements engineering<br />
visualization (Teyseyre, 2002; UML, 2010; Konrad et al, 2006; Evermann,<br />
2008; Sen and Jain, 2007; Isazadeh et al, 1999; Moody et al,<br />
2009; Ugai et al, 2010; Gonzales-Baixauli et al, 2004)<br />
Some researchers proposed using visualizations for supporting requirements<br />
engineering decision making. Finkelstein et al (2008) visualized the<br />
trade-offs of fairness between multiple customers. Schneider et al (2008) visualized<br />
informal communication, Feather et al (2006) visualized requirements<br />
risks while Gandhi and Lee (2007) proposed using requirements visualization<br />
to support understanding risk assessment during certification.<br />
Karlsson and Ryan visualized prioritization results (1997) while Ruhe and<br />
Saliu (2005) visualized release plans.<br />
When requirements and their attributes are represented in a textual<br />
form, the resulting structure is a table or spreadsheet representation. In<br />
this case, the access to multi-placed and spread information can be challenging<br />
and overwhelming. Since visual notations offer more dimensions<br />
to represent information than text (Tufte, 1990), they are more efficient in<br />
representing the mentioned complex information structures and highlight<br />
the most relevant interactions and aspects (Dulac et al, 2002). As an example,<br />
Gotel et al (2007) proposed taking a set of requirements represented<br />
in this traditional textual form, supplemented by the structured UML diagrams,<br />
and rendering them in a way that proposes shared comprehension<br />
of the full set of a number of requirements-related questions, e.g. revealing<br />
unknown patterns. Some situations where this approach may be useful are<br />
for example: ensuring that the requirements are grounded in authoritative<br />
and representative source or providing a quick glance of the risks, cost and<br />
effort needed to implement requirements. In this thesis, visualizations are<br />
used to provide an overview of scoping processes in a very-large requirements<br />
engineering context.<br />
Recent research in requirements visualization provide a variety of new<br />
visualization techniques that aim for "getting to see" requirements in new<br />
ways. Among proposed techniques, Lee at al. (2003) proposed an iconic<br />
technique that provides an excellent example of using both the shape and<br />
the color as additional dimensions to achieve greater cognitive dissonance.<br />
Another technique to visually represent requirements using a metaphorical<br />
approach is the Volcanic World Visualization technique, proposed by<br />
Gotel et al(2007) .<br />
34
3.4 Natural Language Processing techniques in requirements<br />
management<br />
Natural Language Processing (NLP) is a set of techniques for analyzing<br />
natural language on various levels and for various tasks and purposes<br />
(Liddy, 2003). Information Retrieval (IR), defined as finding unstructured<br />
material within larger material based on a given information need (Manning<br />
et al, 2008), is overlapping with NLP. IR puts emphasis on the process<br />
of finding information while NLP puts emphasis on techniques used in<br />
the searching process. In this thesis, we use the term NLP, as suggested by<br />
Falessi et al (2010).<br />
Although using NLP techniques for requirements management tasks<br />
need to be supervised by practitioners (Ryan, 1993), they provide new possibilities<br />
of improving requirements management. These possibilities have<br />
been explored in a number of publications. Among those publications that<br />
include some kind of empirical evaluations, the majority of the proposed<br />
NLP techniques and tools are used to examine the quality of requirements<br />
specifications. The quality of requirements specifications is analyzed, for<br />
example in terms of the number of ambiguities (Fantechi et al, 2003; Macias<br />
and Pulman, 1995). Kamsties et al (2001) proposed detecting ambiguities<br />
using inspections while Rupp et al (2000) produced logical forms associated<br />
with parsed sentences to detect ambiguities.<br />
Among other quality attributes of requirements artifacts analyzed using<br />
NLP techniques, Fabbrini et al (2001) proposed a tool that could improve<br />
understandability, consistency, testability and correctness of requirements<br />
documents. Edwards et al (1995) presented a tool that uses rulebased<br />
parsing to translate requirements from natural languages and thus<br />
help requirements analysis and maintenance throughout the system lifecycle.<br />
Gervasi et al (2000) presented natural language processing techniques<br />
to perform a lightweight validation of natural language requirements<br />
which was argued to have low computational and human costs.<br />
Apart from assisting with assessing the quality of requirements, NLP<br />
techniques were also used for tasks such as extracting abstractions from<br />
text documents (Aguilera and Berry, 1991; Goldin and Berry, 1997), synthesizing<br />
crucial requirements from a range of documents that includes<br />
standards, interview transcripts, and legal documents (Sawyer et al, 2002),<br />
or identifying domain abstractions (Rayson et al, 2000). On the other hand,<br />
Sawyer et al (2005) proposed using statistical NLP techniques in supporting<br />
early phase requirements engineering while Gervasi (1999) used lexical<br />
features of the requirements to cluster them according to specific criteria,<br />
thus obtaining several versions of a requirements document. The sectional<br />
structure of these documents, and the ordering of requirements in each<br />
section, are optimized to facilitate understanding for specific purposes.<br />
Enabling and maintaining requirements dependencies through traceability<br />
enables their efficient tracking (Cleland-Huang et al, 2012). By es-<br />
35
tablishing traceability links between requirements and other software project<br />
artifacts, lifecycle tasks such as change impact analysis (Cleland-Huang<br />
et al, 2003), coverage analysis (Antoniol et al, 2002), linking of rationale<br />
and source to requirements (Ramesh and Jarke, 2001), requirements consolidation<br />
(Natt och Dag et al, 2006), finding reusable elements (Winkler<br />
and Pilgrim, 2010) and finally requirements validation and verification, become<br />
more manageable or efficient.<br />
Vector Space Model (VSM) or Latent Semantic Indexing (LSI) information<br />
retrieval models (Baeza-Yates and Ribeiro-Neto, 1999) are among the<br />
most frequently used models to retrospectively (Asuncion et al, 2010) identify<br />
traces. Natt och Dag et al (2004; 2005; 2006) used VSM to measure linguistic<br />
similarities to link market requirements to product requirements.<br />
Cleland-Huang et al (Lin et al, 2006; Duan et al, 2009b; Cleland-Huang<br />
et al, 2010; Laurent et al, 2007) used VSM and the Poirot tool in several<br />
experiments while Antoniol (Antoniol et al, 2002) used VSM to recover<br />
links between source code and documentation. Hayes et al developed the<br />
RETRO tool to link requirements to design documents using vector-space<br />
models (Hayes Huffman et al, 2003), as well as LSI (Hayes Huffman et al,<br />
2006). Finally, DeLucia used LSI to recover traceability links in software<br />
management systems (De Lucia et al, 2007) and Sultanov et al (2010) applied<br />
swarm techniques for requirements tracing.<br />
3.5 Obsolescence in software and requirements engineering,<br />
Obsolete Software Requirements (OSRs)<br />
Changes in software business are both rapid and significant and involve<br />
not only changing programming fundamentals and languages (Odersky<br />
et al, 2008), hardware and technologies Fons et al (2012), pricing and ownership<br />
(Jansen et al, 2012), but also business models, software product and<br />
services (Cusumano, 2008). For example, a recent shift of focus in software<br />
business from product to services (Cusumano, 2008) have ignited<br />
serious changes into software pricing models, development and management<br />
models, requirements management and software release plans. As<br />
a result, software companies need to shift focus and re-prioritize the requirements<br />
for their future products focusing on the functional and quality<br />
requirements more suitable for service oriented architecture solutions.<br />
Another example of rapidly changing environment is MDRE where<br />
requirements are continuously issued by customers and other stakeholders<br />
(Regnell and Brinkkemper, 2005). The paste of changes may sometimes<br />
be very high resulting in requirements and features becoming quickly obsolete.<br />
Frequent and unplanned requirements changes can also cause scope<br />
creep, requirements creep and requirements leakage (also referred as uncontrolled<br />
requirements creep) (Robertson and Robertson, 1999; Iacovou<br />
and Dexter, 2004). Scope creep can then lead to significant scope reductions<br />
as overcommitment challenges are addressed. This, in turn, postpones the<br />
36
implementation of the planned functionality and can cause requirements<br />
to become obsolete and in the end even project failures (Iacovou and Dexter,<br />
2004).<br />
Software artifact obsolescence has been mentioned in the context of obsolete<br />
hardware and electronics in, for example, military, avionics or other<br />
industries. Herald et al proposed an obsolescence management framework<br />
for system components that is concerned with system design and evolution<br />
phases (Herald et al, 2009). Although this framework contains a technology<br />
roadmapping component, it does not explicitly mention obsolete requirements.<br />
Merola (2006) focused on the software obsolescence problem<br />
on the COTS components level for defense systems of systems. He stressed<br />
that even though the software obsolescence issue has been recognized as<br />
being of equal gravity to the hardware obsolescence, it has not reached<br />
the same visibility. Some of the proposed solutions for managing software<br />
obsolescence outlined by Merola include: (1) negotiating with the vendor<br />
to downgrade the software license, (2) using wrappers and software application<br />
programming interfaces, or (3) performing market analysis and<br />
surveys of software vendors.<br />
Despite a rather clear relation to managing requirements for software<br />
product, the phenomenon of Obsolete Software Requirements seems to be<br />
underrepresented in literature. To the best of our knowledge, only a handful<br />
of articles and books mention the terms obsolete requirements or/and<br />
obsolete features. Among the existing evidence, Loesch and Ploederoeder<br />
(2007) claimed that the variability explosion in a software product line context<br />
is partially the result of not removing obsolete variable features. Murphy<br />
and Rooney (2006) stressed that requirements have ’a shelf life’ and<br />
suggested that the longer it takes from defining requirements to implementation,<br />
the higher the risk of change. This inflexibility is also mentioned<br />
by Ruel et al (2010) who stated that change makes requirements obsolete,<br />
which in turn can dramatically extend project timelines and increase the<br />
total cost of a project. Similarly, Stephen et al (2011) listed obsolete requirements<br />
as one of the symptoms of failure of IT project for the UK government.<br />
While the report does not define OSRs per se, the symptom of failure<br />
is ascribed to OSRs and them blocking the timely adoption of the potential<br />
of new technologies.<br />
The phenomenon of OSRs has not yet been recognized by neither the<br />
IEEE 830 standard (IEEE, 1997) nor CMMI version 1.3 (Software Engineering<br />
Institute, 2011). On the other hand, some researchers mentioned obsolete<br />
requirements. Savolainen et al (Savolainen et al, 2005) classified product<br />
line requirements into four categories: non-reusable, mandatory, variable<br />
and obsolete. Moreover they proposed a short definition of obsolete<br />
requirements and the process of managing these requirements for software<br />
product lines "by marking them obsolete and hence not available for selection<br />
into subsequent systems". Mannion et al (Mannion et al, 2000) proposed<br />
a category of variable requirements called obsolete and suggest deal-<br />
37
ing with them in a similar way as described by Savolainen et al (Savolainen<br />
et al, 2005).<br />
Obsolescence of requirements can also be defined as their low volatility,<br />
thus OSRs and requirements volatility are highly related. SWEBOOK<br />
classifies requirements into a number of dimensions and one of the them<br />
is volatility and stability. SWEBOK mentions that some volatile requirements<br />
may become obsolete (IEEE Computer Society, 2004). Kulk and Verhoef<br />
(Kulk and Verhoef, 2008) reported that the maximum requirements<br />
volatility rates depend on size and duration of a project. They proposed a<br />
model that calculates the “maximum healthy volatility ratios” for projects.<br />
On the other hand, Zowghi and Nurmuliani (Zowghi and Nurmuliani,<br />
2002) proposed a taxonomy of requirement changes where one of the reasons<br />
for requirements changes is obsolete functionality, defined as “functionality<br />
that is no longer required for the current release or has no value<br />
for the potential users”.<br />
3.6 Scoping in software projects and in requirements engineering<br />
Defining the right scope of a project that fits into the project schedule has<br />
been recognized as a known risk in project management (Boehm, 1989).<br />
In 1996, Withey explored scoping in software product lines arguing that<br />
the economies of scope are the saving obtained when building more product<br />
with less input. Thus, the scope is defined by Withey as the common<br />
part of a software product line (Withey, 1996). Scoping and scope management<br />
were also considered as integral parts of release planning and software<br />
product management (van der Hoek et al, 1997). Other early work<br />
on software product lines scoping focused on identification of the scope of<br />
a software product line (DeBaud and Schmid, 1998, 1999).<br />
Software product lines scoping is considered as a key activity for achieving<br />
economic benefits in product line development (Schmid, 2002). Despite<br />
that, the existing work in software product line focus mainly on the identification<br />
aspect of scoping, e.g. (Kishi et al, 2002; Savolainen et al, 2007;<br />
Fritsch and Hahn, 2004; John and Eisenbarth, 2009; Helferich et al, 2005;<br />
Kang et al, 2002; Pohl et al, 2005a; Riebisch et al, 2001; Taborda, 2004; Park<br />
and Kim, 2005). In a survey of scoping, John and Eisenbarth summarized<br />
16 scoping approaches (John and Eisenbarth, 2009). Seven of the listed<br />
methods take features or product features as input.<br />
Fritsch and Hahn (2004) presented a method of checking whether or not<br />
a set of products should constitute a product line for a given target market.<br />
Helferich et al (2005) focused on creating customer-oriented product<br />
portfolios while Kang et al (2002) focused on using marketing and product<br />
plan during the product line asset development. Furthermore, Pohl et<br />
al (2005a) discussed scoping in relation to product management and product<br />
portfolio planning while Park and Kim (2005) proposed a process for<br />
38
domain and economic analysis of core product line assets based on variability<br />
analysis. Riebisch et al (2001) proposed a scoping method based<br />
on four priority levels and a decision table while Taborda (2004) suggested<br />
using release matrices for scoping and release planning.<br />
In MDRE (Regnell and Brinkkemper, 2005), continuously arriving requirements<br />
contribute to creating a state of congestion in the requirements<br />
handling process when more requirements enter the process than can be<br />
handled with the available resources (Karlsson et al, 2002). As a result,<br />
the selection process becomes a compromise where (due to the project being<br />
overloaded with requirements) the development of already committed<br />
features may need to be sacrificed at the expense of wasted effort. Several<br />
reasons for removing features form the scope were identified in Paper I.<br />
Related work on scoping in project and product management often focus<br />
on a phenomenon of scope creep, defined as uncontrolled expansion<br />
of initially decided scope (Carter et al, 2001; Kulk and Verhoef, 2008; De-<br />
Marco and Lister, 2003; Hall et al, 2002; Iacovou and Dexter, 2004). Scope<br />
creep could be caused by: (1) sales stuff agreeing to deliver unrealistically<br />
large features without checking the scheduling implications first (Hall et al,<br />
2002) or (2) stakeholders unable to concur on project goals (DeMarco and<br />
Lister, 2003). As a result, scope creep can have serious negative consequences<br />
on project, including project failures (Iacovou and Dexter, 2004).<br />
One of the possible ways to mitigate negative effects of scope creep is<br />
combining evolutionary prototyping and risk-mitigation strategies (Carter<br />
et al, 2001). Patton (2003) suggested that combining interaction design and<br />
extreme programming could help to get the right and yet flexible scope of<br />
a project.<br />
Another related phenomenon is requirements scrap which is defined as a<br />
situation when the scope of a project both increases but also decreases (Kulk<br />
and Verhoef, 2008). Whether increase of the project scope is simply scope<br />
creep, decrease of the scope could be a result of shrinking budgets or running<br />
out of schedule (Kulk and Verhoef, 2008). Paper I visualized a requirements<br />
scrap situation and Paper IV investigated the causes and effects of<br />
overscoping which include: many changes after the project scope is set,<br />
quality issues, wasted effort and customer expectations not always met,<br />
see Paper IV for more details. Finally, requirements churn phenomenon occurs<br />
when changes to requirements do not affect the size of requirements<br />
during the project. Kulk et al (2008) presented an example of requirements<br />
churn when colors in an interface need to changed and buttons reordered<br />
in an interfaces.<br />
4 Research Methodology<br />
The research effort in software engineering is aiming for answering questions<br />
regarding developing, maintaining and evaluating software. Con-<br />
39
ducting research in software engineering requires studying software engineers<br />
as they work (Singer et al, 2007). Therefore, the research methods<br />
(Glass, 1994; Wohlin et al, 2000) used in this thesis were applied based<br />
on their empirical potential. At the same time, the research presented<br />
in this thesis could be characterized as conducted using a pragmatic approach<br />
(Easterbrook et al, 2007) because a greater interest was put on obtaining<br />
practical knowledge as a more valuable source of information.<br />
Various research designs, strategies and data collection methods were<br />
used to deal with the research challenges and to develop answers to the<br />
research questions outlined in Section 2.<br />
4.1 Research design<br />
According to Robson (2002), there are two main approaches to research:<br />
the fixed and the flexible research design. Wohlin et al (2000) call these approaches<br />
research paradigms. The fixed research design, also called the<br />
quantitative research design (Wohlin et al, 2000), can be characterized by<br />
the fact that the design is finished before the data collection starts. Because<br />
of that, this approach can also be called a “theory-driven” research<br />
design (Robson, 2002). The fixed research design is often used to find which<br />
one of two or more proposed solutions can exhibit a different behavior. The<br />
results of studies conducted using the fixed research design are reported<br />
in terms of groups rather than individuals (Robson, 2002). Therefore, the<br />
weakness of the fixed research design is an inability to capture the individual<br />
characteristics of individual human behavior (Robson, 2002).<br />
In contrast, the flexible research design, also called the qualitative paradigm<br />
(Wohlin et al, 2000), evolves during the research process when the data<br />
collection and analysis are intertwined. Qualitative data is typically nonnumerical,<br />
often focused on words, but may also include numbers. Fixed<br />
and flexible research designs can further be classified into research strategies,<br />
described in the section that follows. The research presented in this<br />
thesis uses both types of research designs (see Table 3).<br />
4.2 Research strategies used<br />
The choice of research strategy is an important step in research methodology<br />
and it is limited by the prerequisites for the investigation to be performed<br />
(Wohlin et al, 2000). Research strategies could also be called research<br />
methods (Easterbrook et al, 2007). In this thesis, the name research<br />
strategies is used to avoid confusion with data collection methods. Robson<br />
provides a list of research strategies in social science (Robson, 2002). In this<br />
thesis, the following research strategies have been used:<br />
Case study. This strategy can be categorized as a traditional flexible research<br />
strategy. The reason why it is considered as a flexible design is the<br />
fact that the details of the design typically “emerge” during data collec-<br />
40
tion and analysis. The case study can be both quantitative and qualitative<br />
(Wohlin et al, 2000). Case studies are recognized as appropriate methods<br />
to understand complex social phenomena (Yin, 2003). Software engineering<br />
is, in general, a complex social phenomenon which allows investigators<br />
using the case study approach to preserve its holistic and meaningful<br />
characteristics. Therefore, Runeson et al(Runeson and Höst, 2009; Runeson<br />
et al, 2012) pointed out that the case study methodology is “well suited for<br />
many kinds of software engineering research”. The ability to understand<br />
the complexity of the analyzed problem rather than abstracting from it is a<br />
principal advantage of performing qualitative case studies (Seaman, 1999).<br />
Moreover, Wieringa and Heerkens (2007) classified case study as a well<br />
suited for requirements engineering research, even though the results of a<br />
case study are more difficult to interpret and generalize than the results of<br />
an experiment (Wohlin et al, 2000).<br />
Action research. The important part of this strategy is to influence or<br />
change some aspects of whatever is in the focus of the inquiry (Robson,<br />
2002; Davison et al, 2004; Easterbrook et al, 2007). Close collaboration between<br />
researchers and those who are the focus of the research is central to<br />
action research. Further, action research focuses on "authentic" problems<br />
and authentic "knowledge outcomes"(Easterbrook et al, 2007). The result<br />
of using this strategy comprises: (1) an improvement of a practice of some<br />
kind, (2) the improvement of the understanding of a practice by its practitioners,<br />
and (3) the improvement of the situation in which the practice<br />
takes place. Easterbrook et al(2007) argues that a large part of the software<br />
engineering research is actually using this strategy. It is a common scenario<br />
in software engineering research that ideas are originally developed<br />
by trying them out on real development projects, and reporting the experiences<br />
(Easterbrook et al, 2007). Moreover, (2007) put action research on the<br />
list of the methods that can be used in requirements engineering research.<br />
Action research is closely related to case study(Runeson and Höst, 2009).<br />
Experimental strategy. This strategy can be categorized as a traditional<br />
fixed design research strategy (Robson, 2002). In experimental strategy,<br />
the researcher introduces a controlled change into the context of the experiment<br />
in order to see the result of this change on the object of the experiment.<br />
The measured effect of manipulation is then statistically analyzed to<br />
confirm the significance of the effect (Wohlin et al, 2000). The details of the<br />
design are fully pre-specified before the main data collection begins (there<br />
is typically a “pilot” phase before this when the feasibility of the design is<br />
checked and changes made if needed). The need to conduct experiments<br />
in software engineering was for the first time emphasized in the middle<br />
of the 1980’s by Basili and Rombach (1988) and stressed by many others<br />
later on (Potts, 1993; Basili, 1996; Fenton et al, 1994; Glass, 1994; Kitchenham<br />
et al, 1995). Experiments are mainly quantitative since they focus on<br />
measuring different variables, changing them, and measuring them again<br />
(Wohlin et al, 2000). Replicated experiments play an important role in soft-<br />
41
ware engineering by allowing us to build knowledge about which results<br />
or observations hold under which conditions (Shull et al, 2008).<br />
Survey. This strategy can be used to characterize a broad population<br />
of individuals (Easterbrook et al, 2007; Rea and Parker, 2005). Defining<br />
clear research questions and a representative sample from a population<br />
are important preconditions for conducting survey research (Easterbrook<br />
et al, 2007; Robson, 2002). This strategy, also called "‘non-experimental<br />
strategy"’, is similar to the experimental strategy but researchers do not attempt<br />
to change the studied context or behavior of participants (Robson,<br />
2002). Interviews or questionnaires can be used to collect data (Wohlin<br />
et al, 2000) and variables can be measured and controlled. Hypothesis testing<br />
is also possible in survey research (Rea and Parker, 2005). Easterbrook<br />
et al (2007) listed survey research as one of the research methods in software<br />
engineering.<br />
4.3 Data collection methods used<br />
Selecting data collection methods is a necessary and important part of the<br />
research methodology (Easterbrook et al, 2007; Lethbridge et al, 2005; Robson,<br />
2002). Since requirements engineering involves real people working<br />
in real environments, researching requirements engineering is essential to<br />
study practitioners as they solve real problems (Lethbridge et al, 2005).<br />
Wrongly selected data collection methods may not reveal all characteristics<br />
of the data under analysis and may harm the analysis phase and even<br />
the results of the study.<br />
There are many data collection methods (Lethbridge et al, 2005; Robson,<br />
2002). Therefore, selecting appropriate data collection methods requires<br />
careful consideration of the research design as well as the pragmatics<br />
of the research setting (Easterbrook et al, 2007). Many aspects affect<br />
this selection process, where one of the most common is the degree of involvement<br />
of software engineers (Lethbridge et al, 2005). During the data<br />
collection, it is important to quantify the advantages and disadvantages<br />
of the different techniques from the perspectives of the experimenter, the<br />
participants, reliability and the generalizability of the results (Easterbrook<br />
et al, 2007; Lethbridge et al, 2005). Therefore, multiple techniques can be<br />
used to overcome the limitations of single techniques (Easterbrook et al,<br />
2007; Lethbridge et al, 2005), for example while gathering data from multiple<br />
perspectives. We have used multiple techniques for data collection in<br />
Papers I, V and VI.<br />
The data collection methods used in this thesis are presented with respect<br />
to the taxonomy of techniques based on the degree of involvement<br />
of software engineers presented by Lethbridge et al (2005) and by the taxonomy<br />
presented by Robson (2002). Among the first degree techniques,<br />
where software engineers were directly involved in the study, interviews<br />
and questionnaires were used. Among the second degree techniques, the<br />
42
instrumenting systems technique was used in this thesis. Among the third<br />
degree of involvement techniques, the analysis of electronic databases of<br />
work performed was used. Additionally, content analysis technique described<br />
by Robson (2002) was also used in this thesis.<br />
Interviews. Interviews are the most straightforward instrument for<br />
data collection (Lethbridge et al, 2005). Interviews can be used in studies<br />
where the goal is to explore challenges (Karlsson et al, 2002) or gain<br />
opinions, about the process or product (Lethbridge et al, 2005). Interviews<br />
are flexible and inquisitive (Lethbridge et al, 2005) and recommended for<br />
software engineering research (Runeson and Höst, 2009). Despite their<br />
time consuming nature, interviews brings the possibility to follow up answers<br />
given by participants of the study, interpret the tone of their voice,<br />
expressions and intonations. Depending on the resources available, interviews<br />
can be used to collect small or large volumes of data (Runeson<br />
et al, 2012). According to Robson (2002), interviews can be classified into<br />
three types: fully structured, semi-structured and unstructured. In this<br />
thesis, semi-structured interviews were used. Semi-structured interviews<br />
use a set of predetermined questions but also allow improvisation and exploration<br />
(Robson, 2002; Runeson and Höst, 2009). Questions order and<br />
wording can be changed. Furthermore, particular questions which seem<br />
inappropriate with a particular interviewee can be omitted, or additional<br />
ones included. In this thesis, semi-structures interviews were performed<br />
in Papers IV and VI.<br />
Questionnaires. Questionnaires are one of the possible data collection<br />
techniques for survey research strategies (Easterbrook et al, 2007; Robson,<br />
2002; Singer et al, 2007). Questionnaires allow collection of large amount<br />
of data in a cost and time effective way (Lethbridge et al, 2005; Rea and<br />
Parker, 2005). Furthermore, web-based questionnaires allow data collection<br />
from geographically diverse locations. Moreover, the time to deliver<br />
and send back the questionnaire is significantly reduced and the task of<br />
filling the questionnaire is simplified (Punter et al, 2003). Questionnaires<br />
are suitable for software engineering research (Pfleeger and Kitchenham,<br />
2001; Lethbridge et al, 2005; Singer et al, 2007). On the other hand, poor<br />
questions wording and low response rates are the two most common disadvantages<br />
of questionnaires. Lethbridge et al reported a 5% response rate<br />
from web based software engineering surveys (Lethbridge et al, 2005). The<br />
response rate in Paper III was about 8%.<br />
Content analysis. Content analysis technique deals with artifacts produced<br />
during software development process. It is classified as an “unobtrusive<br />
measure”, which means that data collection does not affect collected<br />
documents (Robson, 2002). The gathered information, which in this<br />
case can be a variety of written information, is analyzed and conclusions<br />
based on the content are reported. The indirect involvement of software<br />
engineers in the data collection task makes this technique suitable for large<br />
volumes of data, which is the case for the studies in Papers I, II, V and VI.<br />
43
It is also a useful technique to be utilized when the goal of the study is<br />
to gather or propose a set of metrics (Lethbridge et al, 2005), as in Paper<br />
I. The content analysis technique can also be used as a secondary method<br />
(Robson, 2002), see Paper VI.<br />
Instrumenting systems. The prerequisite of using this techniques is<br />
to have access to software engineers’ environment when they are working,<br />
but does not require direct contact between the participants and the<br />
researchers. This indirect nature of this techniques make is suitable for<br />
collecting large volumes of data (Lethbridge et al, 2005). In the instrumenting<br />
systems technique, the researcher builds "instrumentation" into<br />
the software tools used by software engineers (Singer et al, 2007). In this<br />
thesis, the instrumentation technique is used in Papers I, and VI to visualize<br />
information recorded in the requirements management tool. The visualization<br />
techniques provide process monitoring facilities not available by<br />
the requirements management tools. Since people tend to be poor judges<br />
of factors such as relative frequency and duration of the various activities<br />
they perform, this technique can be used to provide such information accurately<br />
(Singer et al, 2007). On the other hand, it is difficult to analyze data<br />
from an instrumented system meaningfully, in this case the scope changes<br />
history recorded. This disadvantage of this method may require using another<br />
data collection method. This technique was also indirectly used in<br />
Paper II.<br />
Analysis of electronic databases of work performed. The work performed<br />
by developers and software engineers is often stored and managed<br />
in various types of electronic databases (Singer et al, 2007). The information<br />
and the records how the information was created and managed are<br />
a rich source of information for software engineering researchers (Singer<br />
et al, 2007; Lethbridge et al, 2005). This data analysis technique is suitable<br />
for large amounts of data. The collected data is not influenced by the presence<br />
of a researcher. The disadvantage of this technique comprises low or<br />
sometimes lack of control over the quality and quantity of the information<br />
gathered (Lethbridge et al, 2005). This technique has been used in Paper V<br />
where decision logs were studied, in Paper II where the results of requirements<br />
consolidation were analyzed and in papers I and VI where decision<br />
making history was analyzed and visualized.<br />
4.4 Research classification<br />
Table 3 provides the mapping between the presented papers, research strategies,<br />
designs and data collection methods used.<br />
A flexible research design as well as a case study and action research<br />
strategies were used in Paper I. Due to a limited number of publications<br />
within the requirements engineering field that exclusively addresses issues<br />
related to scope management in very large projects, a literature review<br />
was not conducted. The need for investigating scope management in<br />
44
Table 3: Research Classification<br />
Paper Research<br />
Design<br />
Research Strategies Data Collection Methods<br />
I flexible Case study, action Analysis of electronic databases<br />
research<br />
of the work performed, content<br />
analysis and instrumenting systems<br />
II fixed Experiment Instrumenting systems and analysis<br />
of electronic databases of<br />
work performed<br />
III fixed Survey Questionnaires<br />
IV flexible Case study Interviews<br />
V flexible Case study Analysis of electronic databases<br />
of worked performed, content<br />
VI flexible Case study, action<br />
analysis and questionnaires<br />
Instrumenting systems, analysis<br />
research<br />
of electronic databases of the<br />
work performed, content analysis<br />
and interviews<br />
large project emerged from interviews reported in Papers VIII and XIII. We<br />
used analysis of electronic databases of the work performed, content analysis<br />
and instrumenting systems to collect the empirical data. We analyzed<br />
the database where the information about managing features and making<br />
decisions about them was stored. A set of scripts was implemented to automatically<br />
analyze the available data and provide the FSC visualizations.<br />
A fixed research design was used in Paper II. The goal of Paper II was to<br />
experimentally assess whether a natural language processing functionality<br />
can provide a better assistance in a task of finding similar requirements<br />
than the searching and filtering functionalities. Since two treatments were<br />
compared in this study, the experimental research strategy was used. The<br />
effect of the manipulation was measured on students. The details of the<br />
design were fully pre-specified before the data collection began. Instrumenting<br />
systems and analysis of electronic databases of work performed<br />
were used to collect the empirical data.<br />
A fixed research design was also used in Paper III. A survey research<br />
strategy was utilized to investigate the phenomenon of obsolete software<br />
requirements. The goals were to define the phenomenon of obsolete software<br />
requirements, investigate how they are handled in industry today<br />
and their potential impact. The literature review conducted before executing<br />
the survey, revealed that only a handful of papers discuss this topic.<br />
45
The questionnaire data collection method was used in Paper III.<br />
A flexible research design was used in Paper IV. A case study is chosen<br />
as a research strategy. The main reason to use this strategy is the nature of<br />
the investigated research questions. The phenomenon under investigation,<br />
in this case oversoping, was studied in its natural environment (Yin, 2003;<br />
Runeson et al, 2012). In-depth analysis of a single case helps to understand<br />
the surrounding context of the investigated phenomenon. Interviews were<br />
used as a method for data collection.<br />
A flexible research design was also used in Paper V. A case study was<br />
chosen as a research strategy and analysis of electronic databases of the<br />
work performed was first used to collect the empirical data about factors<br />
affecting decision lead-times and outcomes. Next, a questionnaire was<br />
used to validate the findings from the first phase of the study.<br />
The aims for Paper VI were accordingly: (1) to develop a method for<br />
visualizing the scoping process in agile-inspired continuous development<br />
of embedded systems and (2) to identify decision patterns and archetypes<br />
based on a very-large record of decisions from the case company. A flexible<br />
research design was used in this paper. Case study and action research<br />
strategies were used. Researchers were involved in several steps towards<br />
implementing the visualization technique, applying the technique on an<br />
empirical set of data, and finally using findings from the previous steps to<br />
influence and improve the scoping practice at the case company.<br />
The instrumentation tool into the requirements management tool was<br />
built. The exported data provided input for the implementation of the<br />
FSC+ visualization technique of scoping decisions over time. Next, the<br />
analysis of visual representation of the work performed in the scoping process<br />
was performed. Several thousands of features were visualized and analyzed.<br />
Furthermore, meetings with practitioners and informal interviews<br />
were held while developing the visualization technique in order to collect<br />
feedback and suggestions about it. Finally, interviews with practitioners<br />
were held in order to discuss the results from applying the technique as<br />
well as its usefulness. The evaluation of the solution and suggestions for<br />
further improvements were collected.<br />
4.5 Validity<br />
Even though selecting proper research strategies and methods is an important<br />
step of conducting meaningful research, it does not imply that the<br />
results should be trusted without any doubts or questions. Therefore, the<br />
results of any research effort should be interpreted in the light of the threats<br />
to the validity (Wohlin et al, 2000). A thorough and upstanding criticism<br />
of the results is the only way of enabling or rejecting possibilities of generalization<br />
or replication. Thanks to threats of validity, researchers can distinguish<br />
which results corroborate under which conditions, making them<br />
more useful for building up knowledge. These criteria are useful for eval-<br />
46
uating various studies, including controlled experiments, most case studies<br />
and survey research (Wohlin et al, 2000; Yin, 2003; Easterbrook et al,<br />
2007; Runeson et al, 2012). Several threats to validity classifications were<br />
used in this thesis (Robson, 2002; Yin, 2003; Wohlin et al, 2000). The below<br />
presented description and discussion of threats to validity is based on the<br />
classification suggested by Wohlin et al(2000).<br />
Internal validity concerns the question about the confounding factors<br />
that may affect the causal relationship between the treatment and the outcome<br />
(Wohlin et al, 2000). Experiments are the type of studies where addressing<br />
internal validity is critical (Wohlin et al, 2000). If a researcher incorrectly<br />
concludes that the treatment affects the outcome without knowing<br />
that a third factor has caused or significantly influenced the outcome,<br />
then the study has a low degree of internal validity (Wohlin et al, 2000).<br />
Internal validity threats have been given the greatest attention in experimental<br />
and quasi-experimental research. In case studies, it should only<br />
be a concern for a causal type of studies where an investigator is trying to<br />
determine whether there is a casual relationship between events x and y<br />
without knowing that some third factor z may actually have caused y (Yin,<br />
2003; Runeson et al, 2012). This logic is not applicable to descriptive or exploratory<br />
studies which are not concerned with making causal claims (Yin,<br />
2003). In this thesis, multiple techniques were used to address internal validity<br />
threats, including: (1) continuous validation of emerging results and<br />
techniques for Papers I and VI, (2) sending transcripts back to interviewees<br />
to validate the correctness of derived causal relationships in Paper IV, (3)<br />
performing a replication on an experiment to show the range of conditions<br />
under which experimental results hold in Paper II or (4) reviewing the survey<br />
questions by a native English speaker in Paper III and (5) conducting<br />
a survey to compare the results from the content analysis in Paper V.<br />
Conclusion validity arises from the ability to draw correct conclusions<br />
about the relation between the treatment and the outcome (Wohlin et al,<br />
2000). Conclusion validity is related to the reliability of the analysis procedures<br />
used in a study (Runeson et al, 2012). In qualitative case studies,<br />
there is a risk of drawing different conclusions if another person will analyze<br />
the interview material. In experiments, conclusion validity could be<br />
addressed by using appropriate statistical tests (Wohlin et al, 2000), see Paper<br />
II. Conclusion validity could also be called reliability (Yin, 2003; Runeson<br />
et al, 2012). A typical criticism of a single case study is the question<br />
if a follow-up interview study would produce different results, even if the<br />
same research procedures are followed. If the same analysis procedures are<br />
used and the same results are obtained, then the study has a high degree of<br />
reliability (Yin, 2003). Several methods of addressing conclusion validity<br />
were used in this thesis, e.g. recording and transcribing interviews in Papers<br />
IV,using observer triangulation during the data analysis and storing<br />
all artifacts from the case studies in Papers I, V and VI.<br />
the following techniques were used to address threats to the conclusion<br />
47
validity: performing multiple case studies on the topic of scope dynamics<br />
visualization in Papers I and VI, combining two data collection procedures<br />
in Paper V, conducting workshop sessions with additional participants in<br />
Paper IV, and replication of an experiment in Paper III. Finally, for all studies<br />
presented in this thesis, a documentation of the studies was created in<br />
enable replications and the questions used were published online.<br />
Construct validity is concerned with the relation between theories behind<br />
the research and the observations (Wohlin et al, 2000). Construct validity<br />
concerns the quality of the construct (or operational measures (Yin,<br />
2003)) developed when conducting the study or measuring certain effects.<br />
The use of multiple sources of evidence and a chain of evidences may increase<br />
the construct validity (Yin, 2003) in order to ensure that the result is<br />
an effect of the treatment. Case studies have often been criticized for using<br />
"‘subjective"’ judgments to collect the data (Yin, 2003). Interview studies<br />
need to ensure that the questions stated are interpreted in the same way by<br />
the researcher and the interviewed person (Runeson et al, 2012). Multiple<br />
sources of evidence were used in Papers I, IV, V and VI.<br />
External validity is related to establishing the domain, task or people to<br />
which a study’s findings can be generalized. Results obtained in the context<br />
of a unique environment, or with a specific group of subjects, may not<br />
be fully transferable to other contexts and environments. The ways of minimizing<br />
this type of validity treats are using theory in single-case studies<br />
or using replication logic in multiple-case studies (Yin, 2003). Moreover,<br />
if a case study is focusing on explaining or understanding a phenomenon<br />
in its natural setting, then the attempt to generalize from the study is outside<br />
its aims (Runeson et al, 2012). We addressed external validity threats<br />
by combining a case study and a survey in Paper V, conducting a survey<br />
in Paper III and relating the findings from each study to the state of the<br />
research published in other papers. However, external validity should be<br />
taken into consideration for Papers I, IV and VI.<br />
5 Research Results<br />
The main contributions of this thesis are presented in relation to each research<br />
question outlined in Section 2. For each addressed research question,<br />
the main threats to validity of the research results are summarized.<br />
More detailed contributions and threats to the validity of each paper in<br />
this thesis can be found in the respective paper.<br />
5.1 Main contribution of RQ1<br />
The main contributions of Paper, I addressing RQ1, is the Feature Survival<br />
Chart technique for showing project scope changes over time. The FSC<br />
is applied to three large projects. The results of this empirical evaluation<br />
48
demonstrate that the charts can effectively help in investigating reasons<br />
behind scoping decisions. Furthermore, Paper I provides a set of scoping<br />
measurements, theoretically analyzed and applied to the empirical data<br />
given by the case company.<br />
5.1.1 Main validity issues of RQ1<br />
The main validity issue in Paper I is concerned with external validity. The<br />
FSCs have been designed with the requirements management process in<br />
mind. However, the author believes that the visualization technique can<br />
provide means of describing complex scoping processes also for other software<br />
management and requirements management process models, see Paper<br />
VI. The second major threat to external validity is concerning the general<br />
application of the FSC. The concept has been tested on empirical data<br />
from the same company, making the results or evaluation, although positive,<br />
falling short on the attempt of generalization. However, since visualization<br />
techniques are generally recognized as useful in increasing the<br />
understanding of complex or changing datasets, the questions regarding<br />
this threat can be limited to details of presented visual techniques rather<br />
than their general usefulness. This type of discussion is outlined in Paper<br />
VI. The decisions on which projects the visualization techniques should be<br />
tested on were made together with practitioners, minimizing the construct<br />
validity threat. Finally, the solution was accepted to be implemented as<br />
a part of a requirements management measurement and assessment tool,<br />
extending its usefulness over the participants involved in the evaluation.<br />
5.2 Main contribution of RQ2<br />
The main contribution of Paper II, addressing RQ2, are the results of an<br />
experiment performed to assess if a linguistic method for finding similar<br />
requirements can over-perform searching and filtering. The results from<br />
the original experiment are confirmed in five out of six tested hypotheses.<br />
Moreover, the replication confirms that using NLP techniques help to miss<br />
fewer requirements links and make more correct links. The second contribution<br />
of this study is the result of the cross-experimental hypotheses<br />
testing. Finally, the paper discuss the reasons behind results discrepancies.<br />
5.2.1 Main validity issues of RQ2<br />
The first main threat, related to external validity of this study, is the number<br />
of analyzed requirements during the experiment. Since only a relatively<br />
small number of requirements is analyzed during the experiment, it<br />
is hard to generalize the results on a very large set of requirements, which<br />
often is the case in industrial settings. The second main threat is related to<br />
conclusion validity, since on the contrary to the original study, where sub-<br />
49
jects worked independently, in the replicated experiment they were asked<br />
to work in pairs. This threat was addressed by performing the analysis of<br />
a pre-study questionnaires filled in by all experiment participants. During<br />
this analysis, the differences in knowledge of English, industrial experience<br />
and experience from the courses have been compared to assess the<br />
degree of heterogeneity of pairs.<br />
The third main threat is the difference in user interfaces of compared<br />
tools, which may result in a performance difference. This threat has been<br />
addressed by giving subjects that used the more complicated tool more<br />
time to get familiar with the user interface.<br />
The last main threat is related to the awareness of subjects about their<br />
own errors. This may have influenced the number of correct and faulty<br />
links. Also, when subjects knew that the time was measured, it is possible<br />
that they were more aware of the time spent and therefore effecting the<br />
performance results. This threat was addressed by explicitly mentioning<br />
that the subjects can not gain anything from performing better or worse<br />
with the task, and also by mentioning that the correct answer in not known.<br />
5.3 Main contribution of RQ3<br />
The main contribution of Paper III (addressing research question RQ3) are<br />
the results from a survey conducted among 219 respondents from 45 countries<br />
exploring the phenomenon of OSRs by: (1) eliciting a definition of<br />
OSRs as seen by practitioners in industry, (2) exploring ways to identify<br />
and manage OSRs in requirements documents and databases, (3) investigating<br />
the potential impact of OSRs, (4) exploring effects of project context<br />
factors on OSRs, and (5) defining what types of requirements are most<br />
likely to become obsolete.<br />
The results clearly indicate that OSRs are a significant challenge for<br />
companies developing software systems – OSRs were considered serious<br />
by 84.3% of the respondents. Moreover, a clear majority of the respondents<br />
indicated no use of methods or tools to support identification and<br />
handling of OSRs, and only 10% of survey respondents reported having<br />
automated support. This indicates that there is a need for developing automated<br />
methods or tools to support practitioners in the identification and<br />
management of OSRs. Further, our study revealed that manually managing<br />
OSRs is currently the dominant procedure, leaving the scalability of<br />
currently used methods in question. Finally, the study reports that larger<br />
project are more negatively impacted by OSRs.<br />
5.3.1 Main validity issues of RQ3<br />
The main validity of RQ3 is related to construct validity threats. The phrasing<br />
of questions is a threat to construct validity. The authors of this paper<br />
and an independent native English speaker and writer-reviewer revised<br />
50
the questionnaire to alleviate this threat. To minimize the risk of misunderstanding<br />
or misinterpreting the survey questions, a pilot study was<br />
conducted on master students in software engineering.<br />
The low statistical power threat to conclusion validity was addressed<br />
by using as suitable statistical tests as was possible on the given type of<br />
data. Before running the tests, we tested if assumptions of the statistical<br />
tests were not violated. Further, the reviews of the questionnaire and the<br />
pilot study addressed the instrumentation threat to internal validity.<br />
5.4 Main contribution of RQ4<br />
The main contribution of Paper IV, addressing research question RQ4, is<br />
improved understanding of causes and effects of overscoping. The results<br />
provide a detailed picture of overscoping as a phenomenon including a<br />
number of causes, root causes and effects. The results indicate that overscoping<br />
is mainly caused by operating in a fast-moving, market-driven domain.<br />
Continous requirements inflow, weak awareness of overall goals, in<br />
combination with low development involvement in early phases may contribute<br />
to ’biting off’ more than a project can ’chew’. Furthermore, overscoping<br />
may lead to a number of potentially serious and expensive consequences,<br />
including quality issues, delays and failure to meet customer expectations.<br />
Finally, the study indicates that overscoping occurs also when<br />
applying agile RE practices, though the overload is more manageable and<br />
perceived to result in less wasted effort when applying a continuous scope<br />
prioritization, in combination with gradual requirements detailing and a<br />
close cooperation within cross-functional teams.<br />
5.4.1 Main validity issues of RQ4<br />
The main threat to description validity regarding to RQ4 is misinterpretation<br />
of the interviewees. This threat was addressed by recording the<br />
interviews and performing observer triangulation on the transcripts and<br />
sending the transcripts back to the interviewees. The main threat to interpretation<br />
validity is the risk of imposing the hypothesis onto the interviewees.<br />
To address this threat, open interview questions were always posed<br />
before asking specific questions based on the hypothesis. The main threat<br />
to theory validity for this study is the risk of missing additional or alternative<br />
factors. One source of this threat is the limited set of practitioners<br />
from which data has been gathered. Another potential source is the risk<br />
of observer biases related to the researcher’s pre-knowledge of the company.<br />
The main threat to theory validity is the risk of missing additional<br />
or alternative factors. This threat was mitigated by conducting workshops<br />
with additional participants who suggested additional factors that may affect<br />
overscoping. Finally, we used analytical generalization to draw conclusions<br />
without statistical analysis and, under certain conditions, relating<br />
51
them also to other cases.<br />
5.5 Main contribution of RQ5<br />
The main contribution of Paper V, addressing RQ5, are the results from a<br />
statistical analysis of a large requirements engineering decision log and<br />
from a survey among industry participants. The results show that the<br />
number of products affected by a decision has a positive impact on the decision<br />
leadtime. Furthermore, the results in Paper V confirms that change<br />
requests issued by important customers are more likely to be accepted.<br />
Finally, Paper V suggests that the leadtime to reject a change proposal is<br />
longer than to accept it.<br />
5.5.1 Main validity issues of RQ5<br />
The main threat to internal validity is the number of investigate factors that<br />
may impact decision making in requirements engineering. This threat was<br />
minimized by investigating as many possible factors that could influence<br />
the decision lead-time and decision outcome as possible. The identified<br />
relationships were confronted with the results from the survey in which<br />
these relationships were further tested. The main threat to construct validity<br />
is the quality of the dataset used. The decision log used in the study<br />
was an archival record, which could be considered as stable, exact and<br />
quantitative. Whenever decisions in the log were incomplete or ambiguous,<br />
the inconsistencies were discussed them with the responsible product<br />
manager to avoid making wrong interpretations. To alleviate the threats<br />
to construct validity of the survey part of the study, an independent senior<br />
researcher experienced in the area reviewed the questionnaire. To address<br />
the main threat to external validity in the study, a survey was designed<br />
and executed among industry practitioners. The generalizability of the results<br />
is strengthen as the majority of the survey respondents worked with<br />
companies with a typical project generating not more than 100 requests.<br />
5.6 Main contribution of RQ6<br />
The main contributions of Paper VI, addressing RQ6, are the FSC+ technique<br />
to visualize scope changes in large-scale agile inspired projects, definition<br />
and analysis of decision patterns and definition of feature archetypes.<br />
The FSC+ scope visualizations are designed to be flexible and capable of<br />
visualizing the scope according to the current needs of practitioners. The<br />
sorting, filtering, color scheme and the time span of the charts can be adjusted<br />
and changed depending on project characteristics. The identification<br />
and empirical analysis of the most common decision patterns help to<br />
better understand the degree of adherence to the process guidelines and<br />
52
the reasons for not following the process in some cases. The atomic decision<br />
visualizations also allow analyzing the degree of process adherence.<br />
The identified decision patterns and decision archetypes enable projecting<br />
of the feature decision patterns in future based on the pattern matching<br />
principle.<br />
5.6.1 Main validity issues of RQ6<br />
The main threat to validity of RQ6 is the single company threat to external<br />
validity. The results and techniques presented in Paper VI are based<br />
on a single company case study and thus their transferability can be questioned.<br />
On the other hand, the size of the analyzed dataset and its diversity<br />
significantly increases external validity of the findings. The second main<br />
threat is related to conclusion validity. The evaluation is based on subjective<br />
opinions collected during interviews.<br />
6 Further Research<br />
Table 4 outlines the topics for further research. The overall research plan is<br />
intended to continue with the same general focus as presented in this thesis,<br />
namely to increase the understanding of various aspects of large and<br />
very large-scale requirements engineering decision making and to support<br />
some aspects with new methods or tools. Further, it is also important to<br />
continue the empirical investigation of VLSRE contexts to more precisely<br />
understand their nature.<br />
6.1 FR1: Scoping by Controlling Opportunity Losses<br />
Visualized in papers I and VI projects experienced continuous and frequent<br />
changes of the project scope. The visualized contexts were changing<br />
rapidly as the scope of the projects was adjusted to competitive pressures<br />
and market changes. However, the prioritization techniques reported in<br />
the literature Karlsson and Ryan (1997); Beck (2000); Leffingwell and Widrig<br />
(2003) model the scoping decisions as discrete decisions in time which can<br />
lead to the following issues: (1) the form of the scope decision is typically<br />
binary (keep or cancel) and final, (2) other options, such as investigate<br />
further, reschedule, decompose or refine are not considered and may<br />
impede flexibility in highly dynamic markets. The resulting continuous<br />
re-prioritization of the project scope creates a risk of uncontrolled scope<br />
changes and overscoping, see Paper IV.<br />
In the presence of inevitable uncertainties and changes to the project<br />
scope, we present a novel way of looking at the task of requirements scoping.<br />
We postulate to consider the decision-making criteria as temporal<br />
functions, not absolute values, which facilitates their use even in dynamic<br />
53
FR7 Extending the proposed visualization techniques on<br />
the system requirements level visualization. Improving<br />
the user interaction. Additional empirical<br />
evaluations.<br />
FR 6 Investigation of additional factors that may affect<br />
decision lead-times and decision outcomes<br />
FR 5 Investigation of overscoping in other contexts and<br />
the impact of agile practices on overscoping<br />
Case studies focusing on investigation of<br />
ovescoping and the impact of agile practices on<br />
overscoping<br />
Case studies focusing on investigating additional<br />
factors that could affect decision lead-times and<br />
decision outcomes<br />
FR 4 Methods for handling OSRs Prototype development and industrial case studies<br />
54<br />
ability<br />
FR3 Additional investigations of supporting the human<br />
analyst and using the NCD for requirements trace-<br />
work<br />
Instrumenting systems and case studies<br />
Further Research Description Research Approach<br />
FR1 Scoping by Controlling Opportunity Losses Further empirical case studies<br />
FR2 Providing scalable requirements architectures Case studies with the iMORE modeling frame-<br />
Table 4: Further research plans and ideas.
situations with uncertain scoping decisions. In this way, different management<br />
techniques, such as introducing excess numbers of features into the<br />
process and allowing the requirements process to find the strongest, can be<br />
addressed.<br />
The LOEM (Lost Opportunity Estimation Model) model is based on the<br />
assumptions that the following factors are temporal functions:<br />
• Market value An innovative feature conveying a competitive advantage<br />
may have significantly greater value than, for example, a maintenance<br />
feature.<br />
• Development costs Development costs accrue at different rates, at different<br />
phases of the project. Scoping decisions can include risk analyses<br />
if these costs are known.<br />
6.1.1 The Value and Cost Functions<br />
The value function V (t) is the estimated market value, expressed as follows:<br />
b<br />
V(t) dt (1)<br />
a<br />
where t = a and t = b are the times when the functionality starts to have<br />
market value and the functionality cease to have any value in the market.<br />
The cost function C (t) is the summation of the individual cost factors<br />
over time, expressed as follows:<br />
b<br />
n b<br />
C(t) dt where C(t) = ∑ Ck(t) dt (2)<br />
a<br />
k=1<br />
a<br />
where a is the beginning of the work on a certain feature and b is either<br />
the end of implementing the feature or the moment when the feature was<br />
removed from the scope. k is the number of cost factors included in the<br />
estimate, e.g. requirements management or development costs.<br />
6.1.2 Return on Investment Threshold<br />
We propose that features under investigation should be kept within project<br />
scope until an ROI threshold level is reached. If the feature ROI is less than<br />
the ROI threshold, the feature is canceled. The ROI threshold, δ is not<br />
simply value/cost – it generally includes many other business factors such<br />
as probability of market success, based on past performance, and analyses<br />
of projected market conditions at the time of product release.<br />
b<br />
a<br />
b<br />
a<br />
V(t) dt<br />
≤ δ (3)<br />
C(t) dt<br />
55
The flexibility inherent in the development process can be manipulated<br />
by adjustments to the value of δ. We note that the value of δ may not be the<br />
same for different types of features – speculative features may need larger<br />
δ values than infrastructure or enabling features, see equation 3.<br />
6.1.3 Feature Impact<br />
The overall impact of a set of features within a development cycle can be<br />
calculated using the following equation:<br />
K<br />
∑<br />
k=1<br />
b<br />
a Vk(t) dt<br />
b<br />
a Ck(t) dt − δ <br />
k<br />
where K is the number of features analyzed, a is the point in the project<br />
when the feature was added and b when the feature was canceled. The<br />
values for a and b are not the same for different k. If the feature impact is<br />
negative, then the project manager can not expect that the product cycle<br />
will be profitable as a whole. A negative value for feature impact is generally<br />
acceptable only if there are enough infrastructure features (whose true<br />
value is deferred) to offset revenue generating features.<br />
6.1.4 Initial LOEM Model Validation<br />
The utility of this model was initially investigated using data from the<br />
same large industrial project as in the rest of this paper. The project has<br />
223 features and 120 features were canceled before the end of the analysis<br />
period. The results from the initial validation shows that so much as 77%<br />
of the total effort spent on features that were descoped before the end of<br />
the requirements management process could have been saved if the project<br />
management will immediately decide to descope each feature that passes<br />
the critical level of 1,5 RIO threshold. Based on the promising results of the<br />
initial validation, we believe that the model can be applied to both process<br />
improvement and postmortem analysis of scoping decisions. For more details<br />
regarding the model, see Paper XV.<br />
6.1.5 The Basic Lost Opportunity Estimation Model (BLOEM) for Requirements<br />
Scoping<br />
The Basic Lost Opportunity Estimation Model is a model dedicated to<br />
companies that use agile-inspired software development methods. The<br />
model supports requirements scoping in the environments where the timedependent<br />
business value estimates change as the requirements analysis<br />
process progresses. Companies utilizing agile-inspired development models<br />
attempt to increase requirements process flexibility and process responsiveness<br />
to unexpected changes in scope using continuous scope update<br />
56<br />
(4)
and one-dimensional (relative) market-value estimates as a substitute for<br />
real values (Racheva et al, 2010). The BLOEM attempts to control wasted<br />
effort by facilitating earlier identification of feature cancellation candidates,<br />
promoting constructive use of resources. The model enhances existing processes<br />
by providing input to the keep/cancel scoping decision.<br />
The BLOEM model operates on a single return on investment calculation<br />
represented by the value function which can be relative or absolute<br />
value for candidate features. The model is based on the market-driven<br />
requirements engineering premise that the value of a requirement is a temporal<br />
function that is sensitive to market forces and opportunities - often a<br />
feature will only have market value for a limited time. Even features that<br />
offer unique capabilities see a significant reduction in their market value<br />
when competitors catch up and offer the feature in their own products.<br />
The total value V (t) is represented is the same way as in the LOEM<br />
model, see equation 1. The value function will depend on the characteristics<br />
of the target market and must be estimated when applying the model.<br />
The BLOEM model assumes that features under investigation should<br />
be kept within the project scope until a defined value threshold (δ), known<br />
as the Final Decision Point (FDP), is reached. The threshold value can be<br />
unique to each feature and should be estimated per feature. High-value<br />
features (e.g. priority in the top 25%) could have the FDP threshold set<br />
higher than less valuable features (e.g. priority in the bottom 25%). Final<br />
decisions as to whether to keep (and realize the investment) or cancel (and<br />
minimize losses) are then delayed for the most valuable features while the<br />
least valuable features are canceled relatively early. The FDP can be used<br />
as to enforce a budget-like approach to the scoping management process.<br />
We consider all canceled features to be wasted effort. However, investments<br />
in features that are canceled before the threshold are considered controlled<br />
waste: there is waste but it is under management control and the risk<br />
of inter-feature dependencies is held to an acceptable level. Features that<br />
are canceled after the final decision point are uncontrolled waste - something<br />
unexpected has happened and time or resource constraints cannot be met<br />
for this release cycle.<br />
The flexibility of the decision process can be adjusted by tuning the<br />
value of δ. The overall impact of a set of K of withdrawn or canceled features<br />
is calculated using formula 5:<br />
<br />
K b<br />
a<br />
∑<br />
k=1<br />
Vk(t) dt − δk (5)<br />
K<br />
6.1.6 Initial BLOEM Model Validation<br />
BLOEM was initially validated using a set of 166 features analyzed by<br />
a very-large company that utilizes agile-inspired development methods.<br />
The feature status in the data set ranged from the definition phase, through<br />
57
implementation, to completion. During this period 87 features were canceled.<br />
Under the assumption of the constant value function, the average<br />
uncontrolled waste was 10.2% of the normalized value for the 25 features<br />
that were withdrawn after their final decision point. Under the assumption<br />
of the normal value function, the average uncontrolled waste was 20.3% of<br />
the normalized value for the 4 features that were withdrawn after their<br />
final decision point. The 25 features remained in the process for a cumulative<br />
1021 days after the FDP while the 4 features remained in the process<br />
for a cumulative 75 days after the FDP. The resources expended upon these<br />
features during this period represent both direct costs and lost opportunity<br />
costs. For more details, please refer to Paper XXIV.<br />
6.2 FR2: Providing Scalable Requirements Architectures<br />
The amount of data in large-scale software engineering contexts continues<br />
to grow and it challenges the efficiency of software engineering efforts. At<br />
the same time, requirements and associated information are key elements<br />
of successful software projects. For large and very-large projects, designing<br />
scalable requirements architectures is one of the strategic challenges to<br />
tackle, see Section 2.<br />
We suggest a framework for requirements information modeling. The<br />
iMORE framework (information Modeling in Requirements Engineering)<br />
is developed with collaboration with our industry partners in an action<br />
research mode (Robson, 2002). The framework is based on the distinction<br />
between the external information structures and internal information<br />
structures, outlined in Figure 6 by a dashed line. The inclusion of the external<br />
information structures was stressed as very important by the industrial<br />
practitioners during the development of the model. This is caused by a<br />
large and continuously changing number of sources of requirements and<br />
other information types that directly interact with the company, including<br />
competitors, suppliers, open source components and other partners. The<br />
need to access external information is valid of all abstraction levels of the<br />
model; from source code to product portfolio documents.<br />
The information is divided into three main blocks: the upstream, the<br />
requirements and the downstream blocks. In the ’upstream block’ all highlevel<br />
information is stored, including the goals, strategies and business<br />
needs. In the ’requirements block’ all requirements associated information<br />
is stored, including functional requirements, quality requirements, constraints,<br />
legal requirements and regulations. The source code, bug reports,<br />
code documentation and other related information is stored in the ’downstream’<br />
block.<br />
The last main element in the iMORE framework is handling temporal<br />
aspect of the information structure, depicted by a vertical arrow in Figure 6.<br />
The temporal aspects include capturing the evolution of the data models<br />
in terms of the evolution of the artifacts and their associated structures. To<br />
58
Structures of external<br />
information that contribute<br />
and interact with the<br />
company<br />
WHY<br />
HOW<br />
Upstream:<br />
- Goals<br />
Upstream<br />
- Strategies<br />
- Business needs<br />
Uea<br />
Features<br />
Requirements<br />
- Functional<br />
Upstream<br />
- Quality<br />
- Constraints<br />
Test UFe cases<br />
Downstream<br />
- Source code<br />
Upstream<br />
- Bug reports<br />
- Code documentation<br />
A company context<br />
Attributes<br />
& dependencies<br />
External structures An internal structure<br />
Figure 6: The iMORE modeling framework.<br />
Figure 7: The iMORE meta-model.<br />
59<br />
Time evolution
manage this aspect, the underlying meta-model defines ’Evolution’ type of<br />
links between two artifacts. Using this category of links, users can handle<br />
the evolution over time of artifacts and their structure.<br />
A simple traceability meta-model derived from related works (Ramesh<br />
and Jarke, 2001) and previous research (El Ghazi and Assar, 2008) was used<br />
to design the information structure. The information structure is depicted<br />
in Figure 7. The structure of an element to be stored in the repository and to<br />
be traced in the software project is constructed using two generic concepts:<br />
artifact and attribute. An attribute can be an atomic element of information<br />
(e.g. owner, release date, version number, URL) or any complex structure<br />
(e.g. list of modification dates). The set of attributes is not only limited to a<br />
particular block of information but may also cover several blocks or even<br />
the entire information structure creating a set of ’global’ attributes. Finally,<br />
any artifact in the repository can be linked to other artifacts. Five categories<br />
of links are predefined in the iMORE meta-model; they are briefly<br />
explained using the following examples:<br />
• A requirement document A contributes to the specification of a design<br />
feature B<br />
• A design feature A satisfies an external law based constraint B<br />
• A design feature A depends on another design feature B<br />
• A design specification A is the result of the evolution of a design<br />
specification B<br />
• An external law based constraint A is the rationale for a requirement<br />
document B<br />
The initial evaluation of the iMORE framework was conducted with<br />
industry experts at three companies. All five respondents confirmed the<br />
need for modeling requirements information in a more findable and understandable<br />
way. Further, all respondents agreed to the distinction and<br />
stressed that external information currently dominated their daily work.<br />
Respondents suggested what information and when should be integrated<br />
with the model, see Paper XXVI for more details.<br />
One of five respondents suggested that managing the temporal aspect<br />
of the information structure isn’t so important. Another respondent suggested<br />
creating an attribute called "‘period of validity"’ for managing the<br />
temporal aspect. Two respondents suggested using triggers based on attributes<br />
to manage the temporal aspect. Finally, one respondent suggested<br />
a method based on combining baselines and trigger-based updates. For<br />
more details regarding the iMORE model and the initial evaluation, please<br />
refer to Paper XXVI.<br />
60
6.3 FR3: Additional investigations of possible usage of a<br />
linguistic tool support for requirements management<br />
related tasks.<br />
Paper II presents the results from an evaluation of linguistic support for<br />
identification of similar requirements. The natural language processing<br />
field can provide a number of other techniques that can automatically analyze<br />
natural language documents. For example, Latent Semantic Indexing<br />
(De Lucia et al, 2007), probabilistic models (Rayson et al, 2000), or swarm<br />
techniques could be used to analyze requirements (Sultanov and Huffman<br />
Hayes, 2010). Future research is planned to focus on unsupervised natural<br />
language processing methods, for example clustering (Duan et al, 2009a)<br />
or searching methods, that may provide valuable help with impact analysis.<br />
Finally, it is also planned to test the above mentioned techniques for<br />
other relevant tasks in large-scale requirements management, e.g. creating<br />
data minable regulatory codes, see Paper XXII for more details.<br />
6.3.1 Supporting the Human Analyst<br />
Another possible alley for future research is to focus on the manual part<br />
of the process when the human analyst need to analyze candidate links<br />
and determine which of them are true link and which are false positives.<br />
Recent work by Huffman Hayes et al (2010) focuses on the role of human<br />
analyst in requirements traceability. What is missing in their work is the<br />
ability of the automated traceability method to show to the analyst the difference<br />
between the true positive and the false positive. This brings us<br />
to the challenging problem of relevance in information science (Borlund,<br />
2003).<br />
Several measures were proposed to better evaluate IR methods. Järvelin<br />
and Kekäläinen (Järvelin and Kekäläinen, 2002) proposed measures based<br />
on cumulated gain, combining the degree of relevance and rank. They<br />
give an indication about the quality of a method, but does not evaluate<br />
the support for decision making. Spink and Greisdorf (Spink and Greisdorf,<br />
2001) suggested the median effect as a measure to evaluate the way<br />
the distribution of relevance judgments of retrieved items are generated<br />
by a method. However, this method is mainly focused on being an alternative<br />
to dichotomous measures. Kekäläinen and Järvelin (Kekäläinen and<br />
Järvelin, 2002) also identified the weakness of just evaluating binary relevance<br />
as is the case for recall and precision, and they proposed generalized<br />
recall and precision, which reward IR methods that extract more relevant<br />
items. These measures also do not evaluate how easy it is to make decisions.<br />
Other measures, e.g. expected search length (Cooper, 1968), normalized<br />
recall measure (Rocchio, 1966), sliding ratio measure (Pollack, 1968),<br />
satisfaction-frustration-total measure (Myaeng and Korfhage, 1990) can all<br />
be used to credit methods presenting relevant items high up the list, but<br />
61
again the evaluation of decisions making support is not targeted.<br />
Our approach to the problem above is to introduce the Signal-to-Noise<br />
Ratio (SNR), a measure widely used in science and engineering to quantify<br />
how much a signal has been corrupted by noise, to information retrieval<br />
research and requirements engineering.<br />
SNR = P signal<br />
P noise<br />
SNR = mu<br />
sigma<br />
In its classical definition, see equation 6, signal-to-noise is a ratio between<br />
the average power of the signal (P signal) and the average power of<br />
the noise (P noise) (Gonzalez and Woods, 2006). Since signals have usually a<br />
very wide dynamic range, the logarithmic decibel scale is used to express<br />
SNR. There exist alternative definitions of SNR, like for example the ratio<br />
of mean (mu) to standard deviation (sigma) of a signal or measurement, see<br />
equation 7. This definition is commonly used in image processing (Gonzalez<br />
and Woods, 2006; Stathaki, 2008; Raol, 2009; Russ, 1999) where the<br />
SNR of an image is usually calculated as the ratio of the mean pixel value<br />
to the standard deviation of the pixel values over a given neighborhood.<br />
The higher the ratio, the less obtrusive the background noise is. In other<br />
words it is a ratio between the meaningful information and the background<br />
noise. In our case, the signal is represented by the correct link between two<br />
objects while the noise is represented by all other potential links.<br />
Precision and recall are widely used statistical classifications. They can<br />
be seen as measures of exactness or fidelity (precision) or completeness<br />
(recall) (Baeza-Yates and Ribeiro-Neto, 1999). If every result retrieved from<br />
the task is relevant, we can say that the precision is equal to 1. However,<br />
the precision value 1 does not say if all existing relevant documents were<br />
retrieved. Therefore, if all relevant documents are retrieved by the task<br />
the recall will be 1. Similarly as for the precision, the recall value 1 does<br />
not say anything about how many irrelevant document were also retrieved<br />
with all relevant. These measures can be suitable for measuring the quality<br />
of the result of the automatic classification task, but do not assume that<br />
someone, for example a requirements analyst will use the results as a list<br />
of possible candidates in linking similar objects (Natt och Dag et al, 2006).<br />
In this case, the measures described above give only an indication of the<br />
entire result set, without assessing the quality of how distinctive the correct<br />
answers are from the incorrect ones. We assume that this support can help<br />
the human analyst to assign more correct links and minimize the number<br />
of false positive links (Natt och Dag et al, 2006).<br />
62<br />
(6)<br />
(7)
6.3.2 Rationale for defining Signal-to-Noise ratio<br />
To illustrate the rationale for defining yet another measure, we use the example<br />
of linguistic tool support for requirements consolidation from Paper<br />
II. In this case, a similarity measure was used to propose a list of requirements<br />
candidates and their similarity score to one actually analyzed. The<br />
requirements analyst uses the resulting list of candidates to assign links<br />
between two or more similar requirements. In the replicated experiment<br />
performed in Paper II, a set of 30 requirements has been analyzed against<br />
160 other requirements. The key with correct answers, consisting of 20<br />
links, was prepared before the experiment. Once the correct links were assigned<br />
they have been checked with the output of the tool to assess which<br />
position on the candidate list they will be classified.<br />
Figure 8: Histogram of the positions of similar requirements in the automatically<br />
produced ranked list of similar requirements (Natt och Dag et al,<br />
2006)<br />
Figure 8 depicts a histogram of the distribution of the positions at which<br />
the correct links appear on the ranked list of candidates produced by the<br />
tool Natt och Dag et al (2006). For the data set used in Natt och Dag et al<br />
(2006), almost all (17 out of 20) of the correct answers end up at position<br />
8 or better in the ranked list, and could therefore be quickly spotted. The<br />
question that remains unanswered here is what are the similarity scores for<br />
all the incorrect links proposed on the list (false positives). For example, if<br />
63
a correct answer has position 8 on the list, what are the similarity values<br />
for the 7 other answers ranked as more similar than the correct answer.<br />
These false positives need to be analyzed in order to find the correct link.<br />
The decision which links to reject may be hard if the similarity scores of<br />
all incorrect but highly ranked requirements are very similar to the score<br />
of the correct answer. In other words, the analysts may get mislead by the<br />
fact that the noise is highly ranked than the correct signal.<br />
We propose three versions of Signal-to-Noise that can be applied for<br />
evaluation of automatic methods for supporting decision-oriented tasks in<br />
software and requirements engineering. The first measure, called Individual<br />
SNR is the ratio between the correct answer and the closest incorrect<br />
answer on the list of candidates, see equation 8. In a case when the correct<br />
answer is not ranked as number one on the list of candidates, the Individual<br />
SNR is an average value of the two closest incorrect proposals, one higher<br />
than the correct one and one lower than the correct answer. The individual<br />
SNR describes the ability of spotting the correct answer among the closest<br />
proposed incorrect answer(s).<br />
score_corr<br />
SNRindividual =<br />
(8)<br />
(score_incorr_down + scope_incorr_up)/2<br />
The second version of SNR we propose is the Maximum Noise SNR<br />
which is the ratio of the similarity degree of the correct answer of the candidates<br />
list to the maximum value of similarity of the incorrect answer presented<br />
in the list of candidates, see equation 9.<br />
score_corr<br />
SNRMax =<br />
∑ score_incorrect<br />
MAX<br />
The third proposed version of SNR is called Average SNR. It is defined<br />
as the ratio between the value of similarity of the correct answer to the<br />
average noise ratio value above a certain threshold, see equation 10. The<br />
threshold in Figure 8 has been set to 15, which means that candidate requirements<br />
that scored below number 15 on the candidate list were not<br />
considered. The average SNR definition considers a similarity value or<br />
any other measure used rather than a certain number on the ranked list as<br />
the threshold.<br />
score_corr<br />
SNR Avg =<br />
n<br />
∑<br />
i=1<br />
nbr_of_incorrect_hits<br />
6.3.3 Empirical Application of SNR<br />
(9)<br />
∀i < threshold (10)<br />
score_incorrect<br />
The initial evaluation of the SNR measures was performed on the same<br />
dataset as used in Paper II. The analysis was performed for two methods<br />
64
of measuring the similarity between the requirements: (1) the linguistic<br />
method based on Vector Space Model (Natt och Dag et al, 2005; Natt och<br />
Dag, 2010) and (2) the Normalized Compression Distance (NCD) method<br />
based on information theory (Cilibrasi et al, 2012). The set contains 30 requirements<br />
that are checked against 160 requirements. There exist 20 correct<br />
links between the requirement sets. Knowing which links are correct,<br />
we compared the values of the similarity scores for the correct and incorrect<br />
answers.<br />
The results from measuring the three types of SNR are presented in Tables<br />
5 and 6. For the average SNR calculations we use similarity value<br />
0.5 as the threshold value. The very low similarity measures of the NCD<br />
forced us to lower the threshold to 0.4 for this method, accepting that direct<br />
comparisons no longer are possible. Requirement R19, the only quality requirement<br />
in the dataset, was in all calculations considered as an outlier<br />
and disregarded. Its format and structure leads to too high similarity values.<br />
A quick comparison between the two techniques is presented in Table 7.<br />
It is rather clear that both methods provide poor support for the analyst<br />
who has to make decisions supported by the similarity value. The SNRs<br />
are in all cases close to 1 and the correct link is in the most cases not the<br />
first on the list. The linguistic VSM based approach (Natt och Dag et al,<br />
2005; Natt och Dag, 2010) has in all cases higher SNR than the normalized<br />
compression distance method.<br />
As it can be seen in Table 5 only for one requirements (R19) the SNR<br />
is more than 2. The is the above mentioned quality requirement that was<br />
consider as an outlier. In all other cases the values range from 0.69 to 1.2,<br />
depending on the type of the SNR. The Na values in Tables 5 and 6 for the<br />
AvgSNR corresponds in this case to the situation when the measurement<br />
could not be performed: for example in case of R9 and R16 both the correct<br />
answer and the highest noise were below the threshold 0.5. Moreover, for<br />
some data points, the values for MaxSNR and AvgSNR are identical (R3<br />
and R17), which means in this case that there are only two data points<br />
above the threshold and the top candidate is the noise (R3 case) or a correct<br />
signal (R17). The equal values for both IndSNR and MaxSNR indicate that<br />
the correct answer is number one on the list of candidates, see R2, R5, R11,<br />
R17, R18 and R19 in Table 5. The average value for IndSNR is slightly<br />
higher (1.035) than for MaxSNR (0.93) and AvgSNR (0.974) 7. Finally, the<br />
biggest median value represents results for AvgSNR (1.06), comparing to<br />
IndSNR(1.009) and MaxSNR(0.94)<br />
The results for measuring all three types of SNR for the Normalized<br />
Compression Distance method of assessing the similarity between requirements<br />
are more dispersed, see Table 6. The values range from 0.28 to 1.04.<br />
The positions where the correct answer ended up on the list of candidates<br />
are much lower than for the linguistic similarity measure method, only for<br />
4 cases it is within the top 10 candidates. The average and the median for<br />
65
Table 5: The results from measuring all three types of SNR for the ReqSimile<br />
tool that uses the VSM model.<br />
Requirement IndSNR MaxSNR AvgSNR Pos. on the<br />
list<br />
R1 (SC13) 1.04 0.98 1.16 2<br />
R2 (41104) 1.26 1.26 1.34 1<br />
R3 (41112) 1.12 0.97 0.97 2<br />
R4 (41114) 1 0.68 0.68 3<br />
R5 (41123) 1.04 1.04 1.14 1<br />
R6 (41301) 1.005 0.89 0.95 5<br />
R7 (41307) 1.009 0.57 0.62 64<br />
R8 (41309) 0.97 0.79 0.83 15<br />
R9 (41414) 1.02 0.91 Na 3<br />
R10 (41601) 0.99 0.95 1.19 3<br />
R11 (41606) 1.008 1.008 1.07 1<br />
R12 (41608) 0.99 0.94 1.06 5<br />
R13 (41710) 1.02 0.89 0.92 8<br />
R14 (41804) 1.009 0.94 1.20 6<br />
1.001 0.91 1.20 8<br />
R15 (41811) 1.001 0.89 1.06 12<br />
R16 (4205) 1.01 0.89 Na 2<br />
R17 (43302) 1.12 1.12 1.12 1<br />
R18 (43303) 1.05 1.05 1.05 1<br />
R19 (43402) 2.7 2.7 Na 1<br />
66
Table 6: The results from measuring all three types of SNR for the tool<br />
using the NCD model.<br />
Requirement IndSNR MaxSNR AvgSNR Pos. on the<br />
list<br />
R1 (SC13) 1.03 0.93 0.97 4<br />
R2 (41104) 1 0.49 0.49 111<br />
R3 (41112) 1 0.75 Na 20<br />
R4 (41114) 1.06 0.84 Na 5<br />
R5 (41123) 1.01 1.01 1.04 1<br />
R6 (41301) 0.99 0.42 0.48 155<br />
R7 (41307) 1.003 0.66 0.72 97<br />
R8 (41309) 0.998 0.84 0.86 57<br />
R9 (41414) 1 0.597 0.62 134<br />
R10 (41601) 1.007 0.66 0.79 80<br />
R11 (41606) 1.01 0.8 Na 52<br />
R12 (41608) 0.98 0.85 0.92 13<br />
R13 (41710) 1 0.89 1 9<br />
R14 (41804) 0.993 0.91 0.99 14<br />
1 0.77 0.84 73<br />
R15 (41811) 1 0.73 NaN 95<br />
R16 (4205) 0.93 0.507 0.57 92<br />
R17 (43302) 0.99 0.564 0.564 41<br />
R18 (43303) 1 0.537 0.537 29<br />
R19 (43402) 0.996 0.28 0.389 136<br />
67
Table 7: Comparison of the three SNR measures and position of the correct<br />
link for VSM and NCD<br />
VSM NCD<br />
Average IndSNR 1.035 1<br />
Median IndSNR 1.009 1<br />
Average MaxSNR 0.930 0.724<br />
Median MaxSNR 0.94 0.75<br />
Average AvgSNR 0.974 0.759<br />
Median AvgSNR 1.06 0.75<br />
Average Position 7.526 56.947<br />
Median Position 3 52<br />
the IndSNR are the highest among all types of SNR.<br />
The results presented above, although preliminary, give a clear indication<br />
that the studied method provide poor support for the human analyst.<br />
Confronted with very hardly distinguishable similarity values, the analyst<br />
has to review a large amount of candidate links in order to find the correct<br />
answers. This creates a risk for additional false positives, which is actually<br />
confirmed by Cuddeback et al (Cuddeback et al, 2010). Initial results<br />
clearly indicate that the analyst could have difficulties in finding the right<br />
answer when looking at the similarity values. Thus, future work is needed<br />
to better understand how IR methods can better support human analyst<br />
judgments.<br />
6.4 FR4: Methods for handling OSRs.<br />
Paper III reported that OSRs have a serious impact on companies developing<br />
software intensive systems. At the same time, 73.6% of our respondents<br />
reported that their requirements engineering process does not take OSRs<br />
into consideration. Therefore, future work should be directed towards developing<br />
requirements management processes that take OSRs into consideration.<br />
Paper III also reports that identification and management of OSRs is<br />
predominantly a manual activity, and less than 10% of the respondents reported<br />
having any automated functionality for OSRs identification. Thus,<br />
it is planned to further research scalable methods and tools for automated<br />
identification and management of OSRs.<br />
One avenue for future research is to integrate identification of obsolete<br />
elements into the iMORE modeling framework, see Section 6.2. Using the<br />
"‘period of validity"’ attribute could be one of the possible mechanisms of<br />
managing the temporal aspect of requirements. Furthermore, creating a<br />
68
trigger that indicates when a requirement is implemented or integrated in<br />
a product, or has been integrated for the last 2 releases or more may help<br />
to identify OSRs. Finally, identifying potentially obsolete requirements<br />
among requirements that were not changed, edited or modified could be<br />
one of the possible ways to manage them.<br />
Another interesting avenue for future research is to investigate the feasibility<br />
of using garbage collection (McCarthy, 1960) methods to manage<br />
obsolete requirements. Several possible algorithms for garbage collection<br />
were proposed, e.g. references counting (Collins, 1960), "mark and sweep"<br />
algorithm (McCarthy, 1960) and the copying algorithm (Minsky, 1963). The<br />
references counting and "mark and sweep" algorithms need to analyze<br />
each allocated block of memory, which in requirements case would be all<br />
requirements in the requirements database. Another challenging problem<br />
with applying these methods for requirements garbage collection is the<br />
fact that they rely on pointers pointing at the memory blocks. Thus, it<br />
seems that accurate traceability is a prerequisite of requirements garbage<br />
identification using the above methods. Since both establishing (Hayes<br />
Huffman et al, 2003) and maintaining (Cleland-Huang et al, 2003) traceability<br />
links are considered challenging, this may negatively impact the<br />
accuracy of the garbage collection algorithms. The issue of accurate traceability<br />
links need to be resolved while applying the copying algorithm for<br />
requirements garbage collection, while copying the objects from the "‘active<br />
objects"’ space to "‘garbage"’ space.<br />
Two additional and interesting issues should be investigated and solved<br />
when attempting to use classical garbage collection algorithms on requirements.<br />
First, how to know when to run the garbage collection? The "‘full<br />
memory"’ trigger to start garbage collection can’t be directly reused as the<br />
requirements databases get rarely full. Thus, it appears to be more logical<br />
to start requirements garbage collection when a number of requirements<br />
triggers are activated, based on certain attributes or other criteria. Second,<br />
an issue remains about how to categorize requirements that do not have<br />
traceability links. The dataset used in Paper II contained these types of<br />
requirements. Although not linked with other requirements or other documents,<br />
they could still be needed for the project purposes and thus should<br />
not be garbage collected.<br />
6.5 FR5: Investigation of overscoping in other contexts and<br />
the impact of agile practices on overscoping.<br />
Further work in relation to Paper IV and research question RQ4 focuses on<br />
more case studies that investigate overscoping at other companies. It is especially<br />
interesting to investigate overscoping at companies that use agileinspired<br />
processes and methods. The questionnaire respondents in Paper<br />
IV mostly agreed that the three identified agile requirements engineering<br />
practices may positively impact the challenge of overscoping. Further, the<br />
69
espondents suggested that overscoping is still present in the new (agile)<br />
way of working at the case company, thus it is more manageable. Therefore,<br />
additional investigations are necessary to better understand how the<br />
iterative requirements engineering (Cao and Ramesh, 2008) helps to avoid<br />
overscoping.<br />
The impact of other aspects such as organization set up, the involvement<br />
of development teams in early phases of requirements definition and<br />
communication on overscoping is also planned to be investigated in the<br />
future. In related paper XX, a case study aiming at a deeper understanding<br />
the causes and effects of communication gaps in large-scale industrial set<br />
up is presented. We discovered that communication gaps are caused by the<br />
following factors: scale, common view, temporal aspect and decision structures.<br />
The size and complexity of the software development increases the<br />
challenge of requirements communication. Study XX discovered communication<br />
gaps between the requirements engineers and a number of stakeholders,<br />
result in missing requirements, e.g. for quality. Instead, these<br />
requirements surface in later phases, thus, incurring increased cost. Common<br />
views and mutual understanding are necessary for communication to<br />
be productive. Weak understanding of each other’s roles and responsibilities<br />
causes gaps in communication. For example, the testers’ competences<br />
are not utilized when defining and reviewing requirements, or the requirements<br />
engineers are not consulted when making implementation choices<br />
that affect the requirements.<br />
Temporal aspects can came into play when there is a lack of continuity<br />
in requirements awareness through the project life cycle. This may cause<br />
gaps in the requirements communication. Hand-over points, e.g. defined<br />
by the process, where the responsibility is passed on to new roles constitute<br />
a risk of missing vital requirements knowledge and awareness. This may<br />
result in requirements being misunderstood and incorrectly implemented,<br />
or, making decisions that affect the requirements without considering all<br />
relevant aspects. For example, if there is no requirements awareness in the<br />
implementation phase, the developers tend to make their own requirement<br />
modifications without considering the impact on the customer or on other<br />
parts of the development organization, such as test.<br />
Decision structures also contribute to communication gaps. Weak, or unclear,<br />
visions or goals for the software development (due to not being communicated<br />
or not being clear enough) contributes to weak communication,<br />
primarily, between those defining the requirements and the development<br />
unit, since there is no mutual understanding of the goal.<br />
Paper XX also reports that communication gaps can have serious and<br />
expensive consequences in terms of wasted effort and quality issues, as<br />
well as, not meeting the customers’ expectations and even communicating<br />
an incorrect picture of what requirements a product fulfills. Furthermore,<br />
communication gaps can contribute to overscoping and to even more communication<br />
gaps, i.e. the software development ends up in a "‘vicious cy-<br />
70
cle"’.<br />
Another interesting avenue for future research about overscoping is to<br />
investigate the impact of cost and schedule estimations on overscoping.<br />
Achieving correct cost and schedule estimation at the high-level (in agile<br />
projects) is considered challenge (Ramesh et al, 2010). Thus, transitioning<br />
into agile-inspired processes may not directly mitigate the negative impact<br />
of inaccurate cost estimations on overscoping. In a related study, Jørgensen<br />
et al (2004) discovered that too optimistic estimates may lead to effort overruns<br />
(in other words overscoping) for projects where complete specification<br />
and quality were prioritized. This relates to one of the causes of overscoping<br />
discovered in Paper IV, namely detailed requirements specification<br />
produced upfront, cause C5. In another study, Jørgensen et al (2012)<br />
studied the imperfect relation between the actual and the estimated cost,<br />
concluding that projects with the size measured based on the actual cost<br />
report an increase in cost overrun with increase project size. Thus may<br />
suggest that for very-large projects, the cost overrun will be quite high,<br />
which confirms findings from Paper I. Finally, as reported by Jørgensen,<br />
(2004), practitioners perceived factors outside their own control as a reason<br />
for effort estimates errors.<br />
6.6 FR6: Investigation of additional factors that may affect<br />
decision lead-times and decision outcomes.<br />
Two of the investigated in Paper V relationships turned out to be statistically<br />
significant and confirmed by the survey respondents: (1) the leadtime<br />
to make a decision increases when more product are affected by a<br />
decision and (2) change requests issued by important customer are more<br />
likely to be accepted. Therefore, future work should be directed towards<br />
investigating why the other investigated relationships turned out to be not<br />
statistically significant.<br />
One interesting avenue for future research is to investigate the relationship<br />
between time to make a decision and the importance of the customer.<br />
62.8% of survey respondents indicated that time to make the decision is<br />
shorter when the decision is filled by an important customer. In a related<br />
study, Taylor et al (Taylor et al, 2011) reported that large customers more<br />
frequently get their requests implemented. Paper V confirms this statement<br />
both in the statistical analysis and in the survey. Therefore, it is a<br />
subject of future work to further explore if this statement can be extended<br />
to the decision outcome as well as if this relationship holds for further other<br />
datasets with more balanced ratio of internal to external errands.<br />
Another interesting avenue for future research is to further investigate<br />
if the release date or number may influence the decision lead-time and<br />
outcome. Paper V could not statistically confirm that this factor affects<br />
decision lead-time or outcome due to conflicting results between the statistical<br />
analysis and the survey. At the same time, the release planning<br />
71
literature Ruhe (2003); Ruhe and Greer (2003); Ruhe and Saliu (2005); Ngo-<br />
The and Ruhe (2005b,a); Ruhe (2009); Karlsson and Ryan (1997); Bagnall<br />
et al (2001) implicitly suggest that the next release is the most important<br />
and thus decision lead-times should be shorter for errands regarding this<br />
release. Thus, we believe that future investigations are needed to resolve<br />
the role of the release number in decision making efficiency and outcomes.<br />
Additional factors such as the number of stakeholders involved or the<br />
number of dependencies between software components could also affect<br />
decision lead-times and outcomes. Furthermore, future work is planned<br />
to formulate a function of estimated lead-time in relation to the decision<br />
outcome based on the identified impacting factors and gathered empirical<br />
data. Since the average lead-time needed to reject a decision is statistically<br />
significantly longer that the lead-time needed to accept a decision,<br />
see Paper V for more details, there should exist a "tilting point" in time<br />
after which most change requests are rejected. We believe that this tilting<br />
point is related to the average time that a product generated value, the<br />
characteristics of the customers and stakeholders, the development model<br />
and the release frequency used by a company. These assumptions should<br />
be investigated together with the final decision point concept presented in<br />
related Papers XV and XXIV.<br />
6.7 FR7: Extending the proposed visualization techniques<br />
on the system requirements level visualization. Improving<br />
the user interaction. Additional empirical evaluations.<br />
A carefully designed visualization could assist with for example a typical<br />
requirements comprehension problem of gaining a quick assessment on<br />
the ”health” of a set of requirements (Gotel et al, 2007). This task is usually<br />
impeded by the need to browse through disjoint textual requirements documentation<br />
and accompanying models. The visualizations presented in<br />
Papers I and VI bring a quick and clear assessment on the scoping process<br />
for large projects, but can also be a base for more in-depth analysis while<br />
envisioning details about the scoping process. Thus, additional studies on<br />
finding effective visual means of scope dynamics visualization are in the<br />
agenda of further research.<br />
Especially, the research is planned to be focusing on providing useful<br />
visual means that can help project and product managers to quickly assess<br />
the efficiency of the scoping process in terms of resource situation and<br />
scope capacities. Furthermore, a more in-depth study that aims for defining<br />
additional scope tracking measurements and applying them into the<br />
case company context data, is planned. Finally, additional studies on finding<br />
optimal visual metaphors for complementary aspects of scoping are<br />
planned as further research topics.<br />
72
Bibliography<br />
REFERENCES<br />
Abramovici M, Sieg OJ (2002) Status development trends of product lifecycle<br />
management systems. In: Proceedings of International Conference<br />
Integrated Product and Process Development, pp 55–70<br />
Aguilera C, Berry D (1991) The use of a repeated phrase finder in requirements<br />
extraction. Journal of Systems and Software 13:209–230<br />
Albourae T, Ruhe G (2006) Lightweight replanning of software product<br />
releases. In: Proceedings of the 1st International Workshop on Software<br />
Product Management (IWPSM 2006), pp 27–34<br />
Andriole S (1998) The politics of requirements management. IEEE Software<br />
15(6):82 –84<br />
Antoniol G, Canfora G, Casazza G, De Lucia A, Merlo E (2002) Recovering<br />
traceability links between code and documentation. IEEE Transactions<br />
on Software Engineering 28(10):970 – 983<br />
Asuncion H, Arthur U, Taylor U, Richard N (2010) Software traceability<br />
with topic modeling. In: Proceedings of the 32nd ACM/IEEE International<br />
Conference on Software Engineering - Volume 1, ACM, New York,<br />
NY, USA, ICSE ’10, pp 95–104<br />
Aurum A, Wohlin C (2002) Applying decision-making models in requirements<br />
engineering. Information and Software Technology 45(14):2–13<br />
Aurum A, Wohlin C (2003) The fundamental nature of requirements engineering<br />
activities as a decision-making process. Information and Software<br />
Technology 45(14):945–954<br />
Aurum A, Wohlin C (2005) Engineering and Managing Software Requirements.<br />
Springer<br />
Avesani P, Bazzanella C, Perini A, Susi A (2005) Facing scalability issues<br />
in requirements prioritization with machine learning techniques. Paris,<br />
France, pp 297 – 305<br />
Avison D, Fitzgerald G (1998) Information systems development methodologies<br />
techniques, and tools. John Wiley<br />
Baeza-Yates R, Ribeiro-Neto B (1999) Modern Information Retrieval.<br />
Addison-Wesley Longman Publishing Co., Inc., Boston, MA, USA<br />
Bagnall A, Rayward-Smith V, Whittley I (2001) The next release problem.<br />
Information and Software Technology 43(14):883 – 90<br />
73
REFERENCES<br />
Bakalova Z, Daneva M, Herrmann A, Wieringa R (2011) Agile requirements<br />
prioritization: What happens in practice and what is described in<br />
literature. In: Requirements Engineering: Foundation for Software Quality.<br />
Proceedings of the 17th International Working Conference, REFSQ<br />
2011, Berlin, Germany, pp 181 – 95<br />
Ball T, Erick S (1981) Software visualization in the large. IEEE Computer<br />
29(4):3–14<br />
Balzer R (1981) Transformational implementation: An example. IEEE<br />
Transactions on Software Engineering 7(1):3–14<br />
Basili V (1996) The role of experimentation in software engineering: Past,<br />
current and future. In: Proceedings of the 18th International Conference<br />
on Software Engineering (ICSE 96), pp 442–449<br />
Basili V, Rombach D (1988) The tame project: Towards improvementoriented<br />
software environments. IEEE Transactions on Software Engineering<br />
14(6):758–773<br />
Beck K (2000) Extreme Programming Explained: Embrace Change.<br />
Addison-Wesley<br />
Berander P (2004) Using students as subjects in requirements prioritization.<br />
In: Proceedings of the 2004 International Symposium on Empirical<br />
Software Engineering, pp 167–176<br />
Berenbach B, Paulish D, Kazmeier J, Rudorfer A (2009) Software & Systems<br />
Requirements Engineering: In Practice. Pearson Education Inc.<br />
Bergman M, King J, Lyytinen K (2002) Large-scale requirements analysis<br />
revisited: The need for understanding the political ecology of requirements<br />
engineering. Requirements Engineering Journal 7(3):152–171<br />
Berntsson Svensson R (2009) Managing quality requirements in software<br />
product development. Licentiate Thesis<br />
Berntsson Svensson R (2011) Supporting release planning of quality requirements:<br />
The quality performance model. PhD thesis, Lund University,<br />
Sweden<br />
Beydeda S, Book M, Gruhn V (2005) Model-Driven Software Development.<br />
Springer-Verlag<br />
Bhat J, Gupta M, Murthy S (2006) Overcoming requirements engineering<br />
challenges: Lessons from offshore outsourcing. IEEE Software 23(5):38–<br />
44<br />
74
REFERENCES<br />
Biffl S, Thurnher B, Goluch G, Winkler D, Aigner W, Miksch S (2005) An<br />
empirical investigation on the visualization of temporal uncertainties in<br />
software engineering project planning. In: Proceeding of the International<br />
Symposium on Empirical Software Engineering (ISESE 2005), pp<br />
437–446<br />
Boehm B (1988) A spiral model of software development and enchancement.<br />
Computer 22(5):61–72<br />
Boehm B (1989) Tutorial: Software risk management. Tech. Rep. ISBN-0-81<br />
86-8906-4, IEEE Computer Society<br />
Boehm B (2006) Some future trends and implications for systems and software<br />
engineering processes. Systems Engineering 9(1):1–19<br />
Booth R, Regnell B, Aurum A, Jeffrey R, Natt och Dag J (2001) Marketdriven<br />
requirements engineering challenges: An industrial case study of<br />
a process performance declination. In: Proceedings of the 6th Australian<br />
Workshop on Requirements Engineering (AWRE 2001), pp 41–47<br />
Borlund P (2003) The concept of relevance in ir. J Am Soc Inf Sci Technol<br />
54(10):913–925<br />
Brinkkemper S (2004) Requirements engineering research the industry is<br />
and is not waiting for. In: Proceedings of 10th Anniversary International<br />
Workshop on Requirements Engineering: Foundation for Software<br />
Quality (REFSQ 2004), pp 41–54<br />
Cao L, Ramesh B (2008) Agile requirements engineering practices: An empirical<br />
study. IEEE Software 25:60–67<br />
Carlshamre P (2002a) Release planning in market-driven product development:<br />
Provoking an understanding. Requirements Engineering Journal<br />
7(3):139–151<br />
Carlshamre P (2002b) A usability perspective on requirements engineering<br />
– from methodology to product development. PhD thesis, Linköping<br />
University, Sweden<br />
Carlshamre P, Regnell B (2000) Requirements lifecycle management and<br />
release planning in market-driven requirements engineering processes.<br />
In: Proceedings of the 11th International Workshop on Database and<br />
Expert Systems Applications, pp 961–965<br />
Carlshamre P, Sandahl K, Lindvall M, Regnell B, Natt och Dag J (2001) An<br />
industrial survey of requirements interdependencies in software product<br />
release planning. In: Proceedings of the Fifth IEEE International<br />
Symposium on Requirements Engineering (RE 2001), pp 84–91<br />
75
REFERENCES<br />
Carman D, Dolinsky A, Lyu M, Yu J (1995) Software reliability engineering<br />
study of a large-scale telelcommunications software system. In: Proceedings<br />
of the International Symposium on Software Reliability Engineering,<br />
pp 350–359<br />
Carmel E (1999) Global software teams: collaborating across borders and<br />
time zones. McGraw-Hill, New york<br />
Carter R, Anton A, Dagnino A, Williams L (2001) Evolving beyond requirements<br />
creep: a risk-based evolutionary prototyping model. In: Proceedings<br />
of the Fifth IEEE International Symposium onRequirements Engineering,<br />
pp 94 –101<br />
Chen J, Reilly R, Lynn G (2005) The impacts of speed-to-market on new<br />
product success: the moderating effects of uncertainty. IEEE Transactions<br />
on Engineering Management 52(2):199–212<br />
Chrissis M, Konrad M, Shrum S (2004) CMMI: Guidelines for Process Integration<br />
and Product Improvement. Pearson Education Inc.<br />
Cilibrasi R, Cruz A, Rooij S, Keijzer M (2012) The complearn suite website.<br />
<br />
Cleland-Huang J, Mobasher B (2008) Using data mining and recommender<br />
systems to scale up the requirements process. In: Proceedings of the 2nd<br />
international workshop on Ultra-large-scale software-intensive systems,<br />
pp 3–6<br />
Cleland-Huang J, Chang C, Christensen M (2003) Event-based traceability<br />
for managing evolutionary change. Software Engineering, IEEE Transactions<br />
on 29(9):796 – 810<br />
Cleland-Huang J, Settimi R, Duan C, Zou X (2005) Utilizing supporting<br />
evidence to improve dynamic requirements traceability. In: Proceedings<br />
of the 13th IEEE International Conference on Requirements Engineer (RE<br />
2005), pp 135–144<br />
Cleland-Huang J, Czauderna A, Gibiec M, Emenecker J (2010) A machine<br />
learning approach for tracing regulatory codes to product specific requirements.<br />
In: 2010 ACM/IEEE 32nd International Conference on Software<br />
Engineering, vol 1, pp 155 –164<br />
Cleland-Huang J, Gotel O, Zisman A (2012) Software and Systems Traceability.<br />
Springer<br />
Clements P, Northrop L (2002) Software Product Lines: Practices and Patterns.<br />
Addison-Wesley<br />
Collins G (1960) A method for overlapping and erasure of lists. Commun<br />
ACM 3(12):655–657<br />
76
REFERENCES<br />
Cooper W (1968) Expected search length: A single measure of retrieval<br />
effectiveness based on the weak ordering action of retrieval systems. J<br />
Am Soc Inf Sci 19(1):30–41<br />
Cuddeback D, Dekhtyar A, Hayes J (2010) Automated requirements traceability:<br />
The study of human analysts. In: 18th IEEE International Requirements<br />
Engineering Conference (RE’10), pp 231 –240<br />
Cunningham W (2012) Manifesto for agile software development. <br />
<br />
Curtis B, Krasner H, Iscoe N (1988) A field study of the software design<br />
process for large systems. Communications of the ACM 31(11):1268–<br />
1287<br />
Curtis W, Krasner H, Shen V, Iscoe N (1987) On building software process<br />
models under the lamppost. In: Proceedings of the 9th international conference<br />
on Software Engineering (ICSE 1987), pp 96–103<br />
Cusumano M (2008) The changing software business: moving from products<br />
to services. Computer 41(1):20 – 7<br />
Damian D (2007) Stakeholders in global requirements engineering:<br />
Lessons learned from practice. IEEE Software 24(2):21–27<br />
Damian D, Zowhgi D (2003) Requirements engineering challenges in<br />
multi-site software development organizations. Requirements Engineering<br />
Journal 8(3):149–160<br />
Davison R, Martinsons M, Ned K (2004) Principles of canonical action research.<br />
Information Systems Journal 14(1):65–86<br />
De Lucia A, Fasano F, Fausto F, Oliveto R, Tortora G (2007) Recovering<br />
traceability links in software artifact management systems using information<br />
retrieval methods. ACM Trans Softw Eng Methodol 16(4)<br />
DeBaud J, Schmid K (1998) Identifying and evolving the scope of software<br />
product lines. In: In Proceedings of the European Reuse Workshop 1998<br />
(ERWŠ98), pp 69–72<br />
DeBaud J, Schmid K (1999) A systematic approach to derive the scope of<br />
software product lines. In: Proceedings of the 21st International Conference<br />
on Software Engineering (ICSE 1999), pp 34–43<br />
DeGregorio G (1999) Enterprise-wide requirements and decision management.<br />
In: Proceedings of the 9th International Symposium of the International<br />
Council on System Engineering, pp 775–582<br />
DeMarco T (1978) Structured Analysis and System Specification. Yourdon<br />
Press<br />
77
REFERENCES<br />
DeMarco T, Lister T (2003) Risk management during requirements. Software,<br />
IEEE 20(5):99 – 101<br />
Duan C, Cleland-Huang J (2006) Visualization and analysis in automated<br />
trace retrieval. In: Proceedings of the First International Workshop on<br />
Requirements Engineering Visualization (REV 2006), pp 54–65<br />
Duan C, Laurent P, Cleland-Huang J, Kwiatkowski C (2009a) Towards automated<br />
requirements prioritization and triage. Requirements Engineering<br />
Journal 14(2):73–89<br />
Duan C, Laurent P, Cleland-Huang J, Kwiatkowski C (2009b) Towards automated<br />
requirements prioritization and triage. Requir Eng 14(2):73–89<br />
Dulac N, Viguier T, Leveson N, Storey M (2002) On the use of visualization<br />
in formal requirements specification. Los Alamitos, CA, USA, pp 71 – 80<br />
Easterbrook SM, Singer J, Storey M, Damian D (2007) Guide to Advanced<br />
Empirical Software Engineering, Springer, chap Selecting Empirical<br />
Methods for Software Engineering Research, pp 285–311<br />
Ebert C (2004) Dealing with nonfunctional requirements in large software<br />
systems. Annals of Software Engineering 3(1):367–395<br />
Edwards M, Flanzer M, Terry M, Landa J (1995) Recap: a requirements<br />
elicitation, capture and analysis process prototype tool for large complex<br />
systems. In: Proceedings of the First IEEE International Conference on<br />
Engineering of Complex Computer Systems, 1995. Held jointly with 5th<br />
CSESAW, 3rd IEEE RTAW and 20th IFAC/IFIP WRTP, pp 278–281<br />
El Ghazi H, Assar S (2008) A multi view based traceability management<br />
method. In: Research Challenges in Information Science, 2008. RCIS<br />
2008. Second International Conference on, pp 393 –400<br />
Evermann J (2008) A cognitive semantics for the association construct. Requirements<br />
Engineering Journal 13(3):167–186<br />
Fabbrini F, Fusani M, Gnesi S, Lami G (2001) An automatic quality evaluation<br />
for natural language requirements. In: Proceedings of the 7th<br />
International Workshop on Requirements Engineering Foundation for<br />
Software Quality (REFSQ 2001), pp 4–5<br />
Falessi D, Cantone G, Canfora G (2010) A comprehensive characterization<br />
of nlp techniques for identifying equivalent requirements. In: Proceedings<br />
of the 2010 ACM-IEEE International Symposium on Empirical Software<br />
Engineering and Measurement, ACM, New York, NY, USA, ESEM<br />
’10, pp 1–10<br />
78
REFERENCES<br />
Fantechi A, Gnessi S, Lami G, Maccari A (2003) Applications of linguistic<br />
techniques for use case analysis. Requirements Engineering Journal<br />
8(3):161–170<br />
Feather M, Cornford S, Gibbel M (2000) Scalable mechanisms for requirements<br />
interaction management. In: Proceedings of the Fourteen International<br />
Conference on Requirements Engineering (RE 2000), pp 119–129<br />
Feather M, Cornford S, Kiper J, Menzies T (2006) Experiences using visualization<br />
techniques to present requirements, risks to them, and options<br />
for risk mitigation. In: Proceedings of the First International Workshop<br />
on Requirements Engineering Visualization (REV 2006), pp 80–89<br />
Fenton N, Pfleeger S, Glass R (1994) Science and subscience: A challenge<br />
to software engineers. IEEE Software 11(4):86–96<br />
Finkelstein A, Harman M, Mansouri SA, Ren J, Zhang Y (2008) "fairness<br />
analysis" in requirements assignments. Barcelona, Catalunya, Spain, pp<br />
115 – 124<br />
Fons F, Fons M, Canto E, Lopez M (2012) Deployment of run-time reconfigurable<br />
hardware coprocessors into compute-intensive embedded applications.<br />
Journal of Signal Processing Systems 66(2):191 – 221<br />
Fritsch C, Hahn R (2004) Product line potential analysis. In: SPLC, pp 228–<br />
237<br />
Gandhi R, Lee SW (2007) Visual analytics for requirements-driven risk<br />
assessment. 445 Hoes Lane - P.O.Box 1331, Piscataway, NJ 08855-1331,<br />
United States<br />
Garg P (1989) On supporting large-scale decentralized software engineering<br />
processes. In: Proceedings of the 28th IEEE Conference on Decision<br />
and Control, pp 1314–1317<br />
Gervasi V (1999) Environment support for requirements writing and analysis.<br />
PhD thesis, University of Pisa<br />
Gervasi V, Nuseibeh B (2000) Lightweight validation of natural language<br />
requirements: A case study. In: Proceedings of the 4th International Conference<br />
on Requirements Engineering, Society Press, pp 113–133<br />
Glass R (1994) The software research crisis. IEEE Software 11(6):42–47<br />
Goldin L, Berry D (1997) Abstfinder, a prototype natural language text abstraction<br />
finder for use in requirements elicitation. Automated Software<br />
Engineering pp 375–412<br />
79
REFERENCES<br />
Goldstine H, von Neuman J (1948) Planning and coding of problems for an<br />
electronic computing instrument. Tech. rep., The Institute of Advanced<br />
Study Princeton, New Jersey<br />
Gonzales-Baixauli B, Prado-Leite J, Mylopoulos J (2004) Visual variability<br />
analysis for goal models. Los Alamitos, CA, USA, pp 198 – 207<br />
Gonzalez R, Woods R (2006) Digital Image Processing (3rd Edition).<br />
Prentice-Hall, Inc., Upper Saddle River, NJ, USA<br />
Gorschek T, Wohlin C (2006) Requirements abstraction model. Requirements<br />
Engineering Journal 11:79–101<br />
Gotel O, Marchese F, Morris S (2007) On requirements visualization. In:<br />
Proceedings of the Second International Workshop on Requirements Engineering<br />
Visualization (REV 2007), pp 80–89<br />
Gotel O, Marchese F, Morris S (2008) The potential for synergy between information<br />
visualization and software engineering visualization. In: Proceedings<br />
of the 12th International Conference Information Visualisation,<br />
pp 547–552<br />
Greer D, Ruhe G (2004) Software release planning: an evolutionary and<br />
iterative approach. Information and Software Technology 46(4):243–253<br />
Hall T, Beecham S, Rainer A (2002) Requirements problems in twelve software<br />
companies: an empirical analysis. IEEE Software 149(5):153 – 160<br />
Hayes Huffman J, Dekhtyar A, Osborne J (2003) Improving requirements<br />
tracing via information retrieval. In: Proceedings of the 11th IEEE International<br />
Conference on Requirements Engineering, IEEE Computer<br />
Society, Washington, DC, USA, RE ’03, pp 138–147<br />
Hayes Huffman J, Dekhtyar A, Sundaram S, Howard S (2004) Helping<br />
analysts trace requirements: an objective look. In: Proceedings of the<br />
12th IEEE International Requirements Engineering Conference (RE’04),<br />
pp 249 – 259<br />
Hayes Huffman J, Dekhtyar A, Sundaram S (2006) Advancing candidate<br />
link generation for requirements tracing: The study of methods. IEEE<br />
Trans Softw Eng 32(1):4–19<br />
Helferich A, Herzwurm A, Schockert G (2005) Mass customization of enterprise<br />
applications: Creating customer oriented product portfolios instead<br />
of single systems. In: Proceedings of the 3rd Interdisciplinary<br />
World Congress on Mass Customization and Personalization<br />
Herald T, Verma D, Lubert C, Cloutier R (2009) An obsolescence management<br />
framework for system baseline evolution perspectives through the<br />
system life cycle. Syst Eng 12:1–20<br />
80
REFERENCES<br />
Herbsleb J (2007) Global software engineering: The future of sociotechnical<br />
coordination. Future of Software Engineering 1(1):188–198<br />
Herrmann A, Daneva M (2008) Requirements prioritization based on benefit<br />
and cost prediction: An agenda for future research. In: Proceedings<br />
of the 16th IEEE International Requirements Engineering Conference,<br />
RE’08, Barcelona, Catalunya, Spain, pp 125 – 134<br />
Higgins S, Laat M, Gieles P, Geurts E (2003) Managing requirements for<br />
medical it products. IEEE Software 20(1):26-33<br />
Hitchman S (2002) The details of conceptual modeling notations are important<br />
- a comparison of relationship normative language. Communication<br />
AIS 9(10):188–198<br />
Hornecker E, Buur J (2006) Getting a grip on tangible interaction: A framework<br />
on physical space and social interaction. In: In Proceeding of the<br />
SIGCHI Conference on Human Factors in Computing Systems, pp 437–<br />
446<br />
Höst M, Regnell B, Natt och Dag J, Nedstam J, Nyberg C (2001) Exploring<br />
bottlenecks in market-driven requirements management. Journal of<br />
Systems and Software 59(3):323–332<br />
Iacovou C, Dexter A (2004) Turning around runaway information technology<br />
projects. Engineering Management Review, IEEE 32(4):97 –112<br />
IEEE (1997) IEEE recommended practice for software requirements specifications,<br />
830-1998. <br />
<br />
IEEE Computer Society (2004) Software Engineering Body of Knowledge<br />
(SWEBOK). Angela Burgess, EUA, URL <br />
Isazadeh A, Lamb D, Shepard T (1999) Behavioural views for software requirements<br />
engineering. Requirements Engineering 4(1):19 – 37<br />
Jacobs S, Jarke M, Pohl K (1994) Report on the first international ieee symposium<br />
on requirements engineering. Automated Software Engineering<br />
1(1):129–132<br />
Jansen S, Brinkkemper S, Souer J, Luinenburg L (2012) Shades of gray:<br />
Opening up a software producing organization with the open software<br />
enterprise model. Journal of Systems and Software 85(7):1495 – 1510<br />
Jantunen S, Lehtola L, Gause D, Dumdum U, Barnes R (2011) The challenge<br />
of release planning. In: Proceedings of the Fifth International Workshop<br />
on Software Product Management (IWSPM’2011), pp 36 –45<br />
81
REFERENCES<br />
Järvelin K, Kekäläinen J (2002) Cumulated gain-based evaluation of ir techniques.<br />
ACM Trans Inf Syst 20(4):422–446<br />
John I, Eisenbarth M (2009) A decade of scoping: a survey. In: Proceedings<br />
of the 13th International Software Product Line Conference, Carnegie<br />
Mellon University, Pittsburgh, PA, USA, SPLC ’09, pp 31–40<br />
Jones J, Harrold M, Stasko J (2000) Visualization of test information to assist<br />
fault localization. In: Proceedings of the 24th International Conference<br />
on Software Engineering (ICSE 2002), pp 198–205<br />
Jørgensen M, Molkken-Ostvold K (2004) Reasons for software effort estimation<br />
error: Impact of respondent role, information collection approach,<br />
and data analysis method. IEEE Transactions on Software Engineering<br />
30(12):993 – 1007<br />
Jørgensen M, Halkjelsvik T, Kitchenham B (2012) How does project size<br />
affect cost estimation error? statistical artifacts and methodological challenges.<br />
International Journal of Project Management<br />
Kamsties E, Berry D, Paech B (2001) Detecting ambiguities in requirements<br />
documents using inspections. In: Proceedings of the First Workshop on<br />
Inspection in Software Engineering (WISE 2001), pp 68–80<br />
Kang K, Donohoe P, Koh E, Lee J, Lee K (2002) Using a marketing and<br />
product plan as a key driver for product line asset development. In: Proceedings<br />
of the Second International Conference on Software Product<br />
Lines, Springer-Verlag, London, UK, SPLC 2, pp 366–382<br />
Karlsson J (1996) Software requirements prioritizing. In: Proceedings of the<br />
2nd International Conference on Requirements Engineering (ICRE 96), p<br />
110<br />
Karlsson J (1998) A systematic approach for prioritizing software requirements.<br />
doctorial dissertation,. PhD thesis, Linköping University, Sweden<br />
Karlsson J, Ryan K (1997) A cost-value approach for prioritizing requirements.<br />
IEEE Software 14(5):67–74<br />
Karlsson J, Wohlin C, Regnell B (1997) An evaluation of methods for prioritizing<br />
software requirements. Information and Software Technology<br />
39(14-15):939–947<br />
Karlsson L, Åsa G Dahlstedt, Natt Och Dag J, Regnell B, Persson A (2002)<br />
Challenges in market-driven requirements engineering - an industrial<br />
interview study. In: Proceedings of the Eighth International Workshop<br />
on Requirements Engineering: Foundation for Software Quality (REFSQ<br />
2002)<br />
82
REFERENCES<br />
Kaushik N, Tahvildari L, Moore M (2011) Reconstructing traceability between<br />
bugs and test cases: An experimental study. In: Reverse Engineering<br />
(WCRE), 2011 18th Working Conference on, pp 411 –414<br />
Kekäläinen J, Järvelin K (2002) Using graded relevance assessments in ir<br />
evaluation. Journal of American Society of Information Science Technology<br />
53(13):1120–1129<br />
Kishi T, Noda N, Katayama T (2002) A method for product line scoping<br />
based on decision-making framework. In: Proceeding Second International<br />
Software Product Lines Conference (SPLC 2002), pp 53–65<br />
Kitchenham B, Pickard L, Pfleeger SL (1995) Case studies for method and<br />
tool evaluation. IEEE Software 12(4):52–62<br />
Kitchenham B, Budgen D, Brereton P, Turner M, Charters S, Linkman S<br />
(2007) Large-scale software engineering questions - expert opinion or<br />
empirical evidence? IET Software 1(5):161–171<br />
Knight C, Munro M (2000) Virtual but visible software. In: Proceedings<br />
of the IEEE International Conference on Information Visualization, pp<br />
198–205<br />
Konrad S, Gall M (2008) Requirements engineering in the development of<br />
large-scale systems. In: Proceedings of the 16th International Requirements<br />
Engineering Conference (RE 2008), pp 217–222<br />
Konrad S, Goldsby H, Lopez K, Cheng B (2006) Visualizing requirements<br />
in uml models. In: Proceedings of the First International Workshop on<br />
Requirements Engineering Visualization (REV 2006), pp 1–10<br />
Koschke R (2003) Software visualization in software maintenance, reverse<br />
engineering, and re-engineering: a research survey. Journal of Software<br />
Maintenance and Evolution Research and Practice 15(2):87–109<br />
Kotonya G, Sommerville I (1998) Requirements Engineering. John Wiley<br />
and Sons<br />
Koziolek A (2012) Research preview: Prioritizing quality requirements<br />
based on software architecture evaluation feedback. In: Proceedings 18th<br />
International Working Conference on Requirements Engineering: Foundation<br />
for Software Quality. REFSQ 2012, Berlin, Germany, pp 52 – 8<br />
Kulk G, Verhoef C (2008) Quantifying requirements volatility effects. Sci<br />
Comput Program 72(3):136–175<br />
Larkin J, Simon H (1987) Why a diagram is (sometimes) worth ten thousand<br />
words. Cognitive Science 11(1):65–100<br />
83
REFERENCES<br />
Laurent P, Cleland-Huang J, D C (2007) Towards automated requirements<br />
triage. In: Proceedings of the 15th IEEE International Requirements Engineering<br />
Conference, RE ’07., pp 131 –140<br />
Lee M, Reilly R, Butavicius M (2003) An empirical evaluation of chernoff<br />
faces, star glyphs and spatial visualization for binary data. In: Proceedings<br />
of the Australian Symposium on Information Visualization, pp 1–10<br />
Leffingwell D, Widrig D (2003) Managing Software Requirements: A Unified<br />
Approach. Addison-Wesley<br />
Lethbridge T, Sim S, Singer J (2005) Studying software engineers: Data collection<br />
techniques for software field studies. Empirical Software Engineering<br />
Journal 10(3):311–341<br />
Lethola L, Kauppinen M (2004) Empirical evaluation of two requirements<br />
prioritization methods in product development projects. In: Proceedings<br />
of the 11th European Conference EuroSPI, pp 161–170<br />
Liddy E (2003) Natural Language Processing. Encyclopedia of Library and<br />
Information Science, 2nd Ed., NY. Marcel Decker, Inc<br />
Lin J, Lin CC, Cleland-Huang J, Settimi R, Amaya J, Bedford G, Berenbach<br />
B, Ben Khadra O, Duan C, Zou X (2006) Poirot: A distributed tool<br />
supporting enterprise-wide automated traceability. In: Proceedings of<br />
the 14th IEEE International Requirements Engineering Conference, IEEE<br />
Computer Society, Washington, DC, USA, RE ’06, pp 356–357<br />
Linden F, van der Schmid K, Rommes E (2007) Software Product Lines<br />
in Action The Best Industrial Practice in Product Line Engineering.<br />
SpringerVerlag<br />
Linger R, Pleszkoch M, Burns L, Hevner A, Walton G (2007) Nextgeneration<br />
software engineering: Function extraction for computation<br />
of software behavior. In: Proceedings of the 40th Annual Hawaii International<br />
Conference on System Sciences (HICSS 2007), pp 9–17<br />
Loesch F, Ploederoeder E (2007) Restructuring variability in software product<br />
lines using concept analysis of product configurations. In: proceedings<br />
of the 11th European Conference on Software Maintenance and<br />
Reengineering, CSMR ’07, pp 159 –170<br />
Lubars M, Potts C, Richter C (1993) A review of the state of the practice in<br />
requirements modeling. In: Requirements Engineering, 1993., Proceedings<br />
of IEEE International Symposium on, pp 2 –14<br />
Maccari A (1999) The challenges of requirements engineering in mobile<br />
telephones industry. Database and Expert Systems Applications, International<br />
Workshop on 0:336–345<br />
84
REFERENCES<br />
MacDonell S (2005) Visualization and analysis of software engineering<br />
data using self-organizing maps. In: Proceeding of the International<br />
Symposium on Empirical Software Engineering (ISESE 2005), pp 115–<br />
124<br />
Macias B, Pulman S (1995) A method for controlling the production of specifications<br />
in natural language. The Computer Journal 48(4):310–318<br />
Magazinovic A, Pernstål J (2008) Any other cost estimation inhibitors? In:<br />
Proceedings of the Second ACM-IEEE International Symposium on Empirical<br />
Software Engineering and Measurement, pp 233–242<br />
Manning C, Raghavan P, Schtze H (2008) Introduction to Information Retrieval.<br />
Cambridge University Press, New York, NY, USA<br />
Mannion M, Lewis O, Kaindl H, Montroni G, Wheadon J (2000) Representing<br />
requirements on generic software in an application family model. In:<br />
Proceedings of the 6th International Conerence on Software Reuse: Advances<br />
in Software Reusability, Springer-Verlag, London, UK, pp 153–<br />
169<br />
Masri K, Parker D, Gemino A (2008) Using iconic graphics in entityrelationship<br />
diagrams: The impact on understanding. Journal of<br />
Database Management 19(3):22–41<br />
McCarthy J (1960) Recursive functions of symbolic expressions and their<br />
computation by machine, part i. Commun ACM 3(4):184–195<br />
McCracken D, Jackson M (1981) A minority dissenting opinion. In: W.W.<br />
Cotterman, et al. (Eds.). Systems Analysis and Design - A Foundation<br />
for the 1980s., pp 551–553<br />
McPhee C, Eberlein A (2002) Requirements engineering for time-to-market<br />
projects. In: Proceedings Ninth Annual IEEE International Conference<br />
and Workshop on the Engineering of Computer-Based Systems, pp 17–<br />
24<br />
Merola L (2006) The cots software obsolescence threat. In: Commercialoff-the-Shelf<br />
(COTS)-Based Software Systems, 2006. Fifth International<br />
Conference on,p7pp.<br />
Minsky M (1963) A lisp garbage collector algorithm using serial secondary<br />
storage. Tech. rep., Cambridge, MA, USA<br />
Moody D (2009) The “physics” of notations: Towards a scientific basis for<br />
constructing visual notations in software engineering. IEEE Transactions<br />
on Software Engineering 35(6):756–779<br />
85
REFERENCES<br />
Moody D, Heymans P, Matulevicius R (2010) Visual syntax does matter:<br />
improving the cognitive effectiveness of the i* visual notation. Requirements<br />
Engineering 15:141–175<br />
Moody DL, Heymans P, Matulevicius R (2009) Improving the effectiveness<br />
of visual representations in requirements engineering: An evaluation of<br />
i* visual syntax. In: Proceedings of the 17th IEEE International Conference<br />
on Requirements Engineering, Atlanta, GA, United states, pp 171 –<br />
180<br />
Murphy D, Rooney D (2006) Investing in agile: Aligning agile initiatives<br />
with enterprise goals. Cutter IT Journal 19(2):6 –13<br />
Myaeng SH, Korfhage RR (1990) Integration of user profiles: models and<br />
experiments in information retrieval. Information Processing & Management<br />
26(6):719 – 738<br />
Natt och Dag J (2010) The reqsimile tool website. <br />
<br />
Natt och Dag J, Gervasi V, Brinkkemper S, Regnell B (2004) Speeding up<br />
requirements management in a product software company: Linking<br />
customer wishes to product requirements through linguistic engineering.<br />
In: Proceedings of the 12th International Requirements Engineering<br />
Conference (RE 2004), pp 283–294<br />
Natt och Dag J, Gervasi V, Brinkkemper S, Regnell B (2005) A linguistic engineering<br />
approach to large-scale requirements management. IEEE Software<br />
22(1):32–39<br />
Natt och Dag J, Thelin T, Regnell B (2006) An experiment on linguistic<br />
tool support for consolidation of requirements from multiple sources<br />
in market-driven product development. Empirical Software Engineering<br />
Journal 11(2):303–329<br />
Naur P, Randell B (1968) Software engineering: Report of a conference<br />
sponsored by the nato science committee. Tech. rep., NATO Scientific<br />
Affairs Division<br />
Neill C, Laplante P (2003) Requirements engineering: the state of the practice.<br />
IEEE Software 20(6):40-45<br />
Ngo-The A, Ruhe G (2005a) Decision support in requirements engineering.<br />
In: Aurum A, Wohlin C (eds) Engineering and Managing Software<br />
Requirements, Springer Berlin Heidelberg, pp 267–286<br />
Ngo-The A, Ruhe G (2005b) Engineering and Managing Software Requirements,<br />
Springer, chap Decision Support in Requirements Engineering,<br />
pp 267–286<br />
86
REFERENCES<br />
Nordbotten J, Crosby M (2001) The effect of graphic style on data model<br />
interpretation. Information Systems Journal 9(2):139–155<br />
Northrop L, Felier P, Habriel RP, Boodenough J, Linger R, Klein M, Schmidt<br />
D, Sullivan K, Wallnau K (2006) Ultra-Large-Scale Systems: The Software<br />
Challenge of the Future. Software Engineering Institute<br />
Odersky M, Spoon L, Venners B (2008) Programming in Scala: A Comprehensive<br />
Step-by-step Guide, 1st edn. Artima Inc<br />
Ogawa M, Bird K, Deyanbu C, Gourley A (2007) A visualization social interaction<br />
in open source software project. In: Proceedings of the 6th International<br />
Asia-Pacific Symposium on Visualization (APVIS 2007), pp<br />
25–32<br />
Osawa K, Ohnishi A (2007) Similarity map for visualizing classified scenarios.<br />
In: Proceedings of the Second International Workshop on Requirements<br />
Engineering Visualization (REV 2007), pp 80–89<br />
Ozakaya O (2006) Representing requirements relationships. In: Proceedings<br />
of the First International Workshop on Requirements Engineering<br />
Visualization (REV 2006), pp 75–84<br />
Park S, Kim SD (2005) A systematic method for scoping core assets in product<br />
line engineering. In: Proceedings of the 12th Asia-Pacific Software<br />
Engineering Conference, APSEC ’05.,p8pp.<br />
Park S, Nang J (1998) Requirements management in large software system<br />
development. In: Proceedings of the IEEE International Conference on<br />
Systems, Man and Cybernetics, pp 2680–2685<br />
Patton J (2003) Unfixing the fixed scope project: Using agile methodologies<br />
to create flexibility in project scope. Agile Development Conference/Australasian<br />
Database Conference 0:146<br />
Perini A, Ricca F, Susi A, Bazzanella C (2007) An empirical study to compare<br />
the accuracy of ahp and cbranking techniques for requirements prioritization.<br />
New Delhi, India, pp 23 – 34<br />
Pfleeger S (2001) Software Engineering – Theory and practice. Prentice–<br />
Hall<br />
Pfleeger S, Kitchenham B (2001) Principles of survey research: part 1: turning<br />
lemons into lemonade. SIGSOFT Softw Eng Notes 26(6):16–18<br />
Pichler M, Humetshofer H (2006) Business process-based requirements<br />
modeling and management. In: Proceedings of the First International<br />
Workshop on Requirements Engineering Visualization (REV 2006), pp<br />
20–29<br />
87
REFERENCES<br />
Pohl K, Böckle G, Linden F, Niehaus E, Böckle G (2005a) Product management.<br />
In: Software Product Line Engineering, Springer Berlin Heidelberg,<br />
pp 163–192<br />
Pohl K, Bockle G, van der Linden F (2005b) Software Product Line Engineering:<br />
Foundations, Principles and Techniques. SpringerVerlag<br />
Pollack S (1968) Measures for the comparison of information retrieval systems.<br />
Am Doc 19(4):387–397<br />
Potts C (1993) Software engineering research revisited. IEEE Software<br />
10(5):18–28<br />
Potts C (1995) Invented requirements and imagined customers: requirements<br />
engineering for off-the-shelf software. In: Proceedings of the Second<br />
IEEE International Symposium on Requirements Engineering (RE<br />
95), pp 128–130<br />
Punter T, Ciolkowski M, Freimut B, John I (2003) Conducting on-line surveys<br />
in software engineering. In: Empirical Software Engineering, 2003.<br />
ISESE 2003. Proceedings. 2003 International Symposium on, pp 80 – 88<br />
Purchase H, Carrington D, Allder J (2002) Empirical evaluation of<br />
aesthetics-based graph layout. Empirical Software Engineering Journal<br />
7(3):233–255<br />
R E Albright TK (2003) Roadmapping in the corporation. Research-<br />
Technology Management 46(1):31–40<br />
Racheva Z, Daneva M, Sikkel K, Wieringa R, Herrmann A (2010) Do we<br />
know enough about requirements prioritization in agile projects: Insights<br />
from a case study. In: Proceedings of the 18th International IEEE<br />
Requirements Engineering Conference, IEEE Computer Society Press,<br />
Los Alamitos, pp 147–156<br />
Ramesh B, Jarke M (2001) Toward reference models for requirements traceability.<br />
Software Engineering, IEEE Transactions on 27(1):58 –93<br />
Ramesh B, Cao L, Baskerville R (2010) Agile requirements engineering<br />
practices and challenges: an empirical study. Information Systems Journal<br />
20(5):449–480<br />
Raol JR (2009) Multi-Sensor Data Fusion with MATLAB: Theory and Practice.<br />
Taylor and Francis, Inc.<br />
Rayson P, Emmet L, Garside R, Sawyer P (2000) The revere project: Experiments<br />
with the application of probabilistic nlp to systems engineering.<br />
In: Proceedings of the 5th International Conference on Applications of<br />
Natural Language to Information Systems, pp 288–300<br />
88
REFERENCES<br />
Rea L, Parker R (2005) Designing and conducting survey research: a comprehensive<br />
guide. Jossey-Bass<br />
Regnell B, Brinkkemper S (2005) Engineering and Managing Software Requirements,<br />
Springer, chap Market–Driven Requirements Engineering<br />
for Software Products, pp 287–308<br />
Regnell B, Kuchcinski K (2011) Exploring software product management<br />
decision problems with constraint solving - opportunities for prioritization<br />
and release planning. In: Proceedings of the Fifth International<br />
Workshop on Software Product Management (IWSPM’2011), pp 47 –56<br />
Regnell B, Beremark P, Eklundh O (1998) A market–driven requirements<br />
engineering process – results from an industrial process improvement<br />
programme. Requirements Engineering Journal 3(2):121–129<br />
Regnell B, Höst M, Natt och Dag J, Hjelm A (2001) Case study on distributed<br />
prioritization in market-driven requirements engineering for<br />
packaged software. Requirements Engineering Journal 6(1):51–62<br />
Regnell B, Ljungquist B, Thelin T, Karlsson L (2004) Investigation of requirements<br />
selection quality in market-driven software processes using<br />
an open source discrete event simulation framework. In: Proceedings<br />
of the 5th International Workshop on Software Process Simulation and<br />
Modeling, pp 89–93<br />
Regnell B, Olsson HO, Mossberg S (2006) Assessing requirements compliance<br />
scenarios in system platform subcontracting. In: Proceedings of the<br />
7th International Conference on Product Focused Software Process Improvement,<br />
pp 362–376<br />
Regnell B, Berntsson Svensson R, Olsson T (2008) Supporting roadmapping<br />
of quality requirements. IEEE Software 25(2):42–47<br />
Riebisch M, Streitferdt D, Philippow I (2001) Feature scoping for product<br />
lines. In: in Proceeding of PLEES’03, International Workshop on Product<br />
Line Engineering The Early Steps: Planning Modeling and Managing<br />
Robertson S, Robertson J (1999) Mastering the requirements process. ACM<br />
Press/Addison-Wesley Publishing Co., New York, NY, USA<br />
Robson C (2002) Real World Research. Blackwell Publishing<br />
Rocchio J (1966) Document retrieval systems: optimization and evaluation.<br />
PhD thesis, Harvard University, USA<br />
Royce W (1970) Managing the development of large software systems: concepts<br />
and techniques. In: Proceedings of the IEEE WESTCON Conference,<br />
pp 328–338<br />
89
REFERENCES<br />
Ruel H, Bondarouk T, Smink S (2010) The waterfall approach and requirement<br />
uncertainty: An in-depth case study of an enterprise systems implementation<br />
at a major airline company. Int J Technol Proj Manage<br />
(USA) 1(2):43 – 60<br />
Ruhe G (2003) Software engineering decision support - a new paradigm for<br />
learning software. Lecture Notes in Computer Science 2640(1):104–113<br />
Ruhe G (2009) Product Release Planning: Methods, Tools and Applications.<br />
Auerbach Publications<br />
Ruhe G, Greer D (2003) Quantitative studies in software release planning<br />
under risk and resource constraints. In: Proceedings of the International<br />
Symposium on Empirical Software Engineering (ISESE 2003), pp 262–<br />
271<br />
Ruhe G, Saliu M (2005) The art and science of software release planning.<br />
IEEE Software 22(6):47–53<br />
Runeson P, Höst M (2009) Guidelines for conducting and reporting case<br />
study research in software engineering. Empirical Software Engineering<br />
Journal 14(2):131–164<br />
Runeson P, Host M, Rainer A, Regnell B (2012) Case Study Research in<br />
Software Engineering: Guidelines and Examples. Wiley<br />
Rupp C (2000) Linguistic methods of requirements engineering (nlp). In:<br />
Proceedings of the EuroSPI 2000, pp 68–80<br />
Russ J (1999) The image processing handbook (3rd ed.). CRC Press, Inc.,<br />
Boca Raton, FL, USA<br />
Ryan K (1993) The role of natural language in requirements engineering. In:<br />
Proceedings of the IEEE International Symposium on Requirements Engineering,<br />
San Diego California, IEEE Computer Society Press, pp 240–<br />
242<br />
Saaty T (1980) The Analytic Hierarchy Process, Planning, Piority Setting,<br />
Resource Allocation. McGraw-Hill, New york<br />
Savolainen J, Oliver I, Mannion M, Z H (2005) Transitioning from product<br />
line requirements to product line architecture. In: proceedings of the<br />
29th Annual International Conference on Computer Software and Applications,<br />
COMPSAC 2005., vol 1, pp 186 – 195 Vol. 2<br />
Savolainen J, Kauppinen M, Mannisto T (2007) Identifying key requirements<br />
for a new product line. In: Proceedings of the 14th Asia-Pacific<br />
Software Engineering Conference (APSEC 2007), pp 478–485<br />
90
REFERENCES<br />
Sawyer P (2000) Packaged software: Challenges for re. In: Proceedings of<br />
the Sixth International Workshop on Requirements Engineering: Foundations<br />
of Software Quality (REFSQ 2000), pp 137–142<br />
Sawyer P, Rayson P, Garside R (2002) Revere: Support for requirements<br />
synthesis from documents. Information Systems Frontiers 4(3):343–353<br />
Sawyer P, Rayson P, Cosh K (2005) Shallow knowledge as an aid to deep<br />
understanding in early phase requirements engineering. IEEE Transactions<br />
on Software Engineering 31(11):969–981<br />
Schalken J, Brinkkemper S, Vliet H (2001) Assessing the effects of facilitated<br />
workshops in requirements engineering. In: Proceedings of the 8th Conference<br />
on Evaluation and Assessment in Software Engineering (EASE<br />
2004), Press, pp 135–144<br />
Schmid K (2002) A comprehensive product line scoping approach and its<br />
validation. In: Proceedings of the 24th International Conference on Software<br />
Engineering (ICSE 2002), pp 593–603<br />
Schneider K, Stapel K, Knauss E (2008) Beyond documents: Visualizing<br />
informal communication. Barcelona, Spain<br />
Seaman C (1999) Qualitative methods in empirical studies of software engineering.<br />
IEEE Transactions on Software Engineering 25(4):557–572<br />
Sellier D, Mannion M (2006) Visualizing product line requirements selection<br />
decision inter-dependencies. In: Proceedings of the Second International<br />
Workshop on Requirements Engineering Visualization (REV<br />
2007), pp 20–29<br />
Sen A, Jain S (2007) A visualization technique for agent based goal refinement<br />
to elicit soft goals in goal oriented requirements engineering. 445<br />
Hoes Lane - P.O.Box 1331, Piscataway, NJ 08855-1331, United States<br />
Shull F, Carver J, Vegas S, Juristo N (2008) The role of replications in empirical<br />
software engineering. Empirical Software Engineering Journal<br />
13(2):211–218<br />
Singer J, Sim SE, Lethbridge TC (2007) Guide to Advanced Empirical Software<br />
Engineering, Springer, chap Software Engineering Data Collection<br />
for Field Studies, pp 9–34<br />
Software Engineering Institute (2011) Capability maturity model integration<br />
(cmmi), version 1.3. <br />
<br />
Sommerville I (2007) Software Engineering. Addison-Wesley<br />
91
REFERENCES<br />
Spink A, Greisdorf H (2001) Regions and levels: measuring and mapping<br />
users’ relevance judgments. J Am Soc Inf Sci Technol 52(2):161–173<br />
Stathaki T (2008) Image Fusion: Algorithms and Applications. Academic<br />
Press<br />
Stephen J, Page J, Myers J, Brown A, Watson D, Magee I (2011) System<br />
error fixing the flaws in government it. Tech. Rep. 6480524, Institute for<br />
Government, London<br />
Strigini L (1996) limiting the dangers of intuitive decision making. Software,<br />
IEEE 13(1):101 –103<br />
Sultanov H, Huffman Hayes J (2010) Application of swarm techniques<br />
to requirements engineering: Requirements tracing. In: Proceedings of<br />
the 2010 18th IEEE International Requirements Engineering Conference,<br />
IEEE Computer Society, Washington, DC, USA, RE ’10, pp 211–220<br />
Supakkul S, Chung L (2010) Visualizing non-functional requirements patterns.<br />
Sydney, NSW, Australia, pp 25 – 34<br />
Sutcliffe A, Thew S, Jarvis P (2011) Experience with user-centred requirements<br />
engineering. Requirements Engineering 16(4):267 – 280<br />
Svahnberg M (2003) Supporting software architecture evolution - architecture<br />
selection and variability. PhD thesis, Blekinge Institute of Technology<br />
Taborda L (2004) Generalized release planning for product line architectures.<br />
In: Nord R (ed) Software Product Lines, Lecture Notes in Computer<br />
Science, vol 3154, Springer Berlin / Heidelberg, pp 153–155<br />
Taylor C, Miransky A, Madhavji N (2011) Request-implementation ratio<br />
as an indicator for requirements prioritisation imbalance. In: Proceedings<br />
of the 5th International Workshop on Software Product Management<br />
(IWSPM 2011), Trento, Italy, pp3–6<br />
Teyseyre A (2002) A 3d visualization approach to validate requirements. In:<br />
Proceedings of the Congreso Argentino de Ciencias dela Computacion,<br />
pp 1–10<br />
Tory M, Moller T (2004) Rethinking visualization: A high-level taxonomy.<br />
In: Proceedings of IEEE Symposium on Information Visualization, (IN-<br />
FOVIS 2004)., pp 151–158<br />
Trautmann N, Philipp B (2009) Resource-allocation capabilities of commercial<br />
project management software: An experimental analysis. In: Proceedings<br />
of the 2009 International Conference on Computers and Industrial<br />
Engineering (CIE 2009), pp 1143–1148<br />
92
REFERENCES<br />
Travassos G, dos Santos P, Neto P, Biolchini J (2008) An environment to<br />
support large scale experimentation in software engineering. In: Proceedings<br />
of the 13th IEEE International Conference on Engineering of<br />
Complex Computer Systems (ICECCS 2008), pp 193–202<br />
Tufte E (1990) Envisioning Information. Graphics Press LLC<br />
Ugai T, Hayashi S, Saeki M (2010) Visualizing stakeholder concerns with<br />
anchored map. Sydney, NSW, Australia, pp 20 – 24<br />
UML (2010) The unified modeling language webpage. <br />
<br />
Vähäniitty J, Lassenius C, Rautiainen K (2002) An approach to product<br />
roadmapping in small software product business. In: Proceedings of the<br />
7th European Conference Software Quality, pp 56–65<br />
van de Weerd I, Brinkkemper S, Nieuwenhuis R, Versendaal J, Bijlsma L<br />
(2006a) On the creation of a reference framework for software product<br />
management. In: Proceedings of the First International Workshop on<br />
Software Product Management (IWSPM 2006), pp 3–12<br />
van de Weerd I, Brinkkemper S, Nieuwenhuis R, Versendaal J, Bijlsma L<br />
(2006b) Towards a reference framework for software product management.<br />
In: Proceedings of the 14th IEEE International Requirements Engineering<br />
Conference (RE 2006), pp 319–322<br />
van der Hoek A, Hall R, Heimbigner D, Wolf A (1997) Software release<br />
management. In: Proceedings of the Sixth European Software Engineering<br />
Conference (ESEC/FSE 97), pp 159–175<br />
van Gurp J, Bosch J, Svahnberg M (2001) On the notion of variability in<br />
software product lines. In: Proceedings of the Working IEEE/IFIP Conference<br />
on Software Architecture, pp 45–55<br />
Vasile S, Bourque P, Abran A (2006) Visualization - a key concept for multidimensional<br />
performance modeling in software engineering management.<br />
In: Proceeding of the IEEE International Conference on Automation,<br />
Quality and Testing, Robotics (AQTR 2006), pp 334–339<br />
Veerappa V, Letier E (2011) Clustering stakeholders for requirements decision<br />
making. Berlin, Germany, pp 202 – 8<br />
Wiegers K (2003) Software Requirements: Practical Techniques for Gathering<br />
and Managing Requirements Throughout the Product Development<br />
Cycle. Addison-Wesley<br />
Wieringa R, Heerkens H (2007) Designing requirements engineering research.<br />
In: Proceedings of the 5th International Workshop on Comparative<br />
Evaluation in Requirements Engineering, pp 36–48<br />
93
REFERENCES<br />
Winkler S, Pilgrim J (2010) A survey of traceability in requirements engineering<br />
and model-driven development. Softw Syst Model 9(4):529–565<br />
Withey J (1996) Investment Analysis of Software Assets for Product<br />
Lines. Tech. Rep. CMU/SEI-96-TR-010, Software Engineering Institute,<br />
Carnegie Mellon University<br />
Wohlin C, Aurum A (2005) What is important when deciding to include<br />
a software requirements in a project or release? In: Proceedings of<br />
the International Symposium on Empirical Software Engineering (ISESE<br />
2005), pp 246–255<br />
Wohlin C, Min X, Magnus A (1995) Reducing time to market through optimization<br />
with respect to soft factor. In: Proceedings of the 1995 IEEE<br />
Annual International Engineering Management Conference, pp 116–121<br />
Wohlin C, Runeson P, Höst M, Ohlsson M, Regnell B, Wesslen A (2000)<br />
Experimentation in Software Engineering An Introduction. Kluwer Academic<br />
Publishers<br />
Yin R (2003) Case Study Research: Design and Methods. Sage Publications<br />
Zenebe A, Norcio A (2007) Visualization of item features, customer preference<br />
and associated uncertainty using fuzzy sets. In: Proceedings of the<br />
Annual Meeting of the North American Fuzzy Information Processing<br />
Society, pp 7–12<br />
Zowghi D, Nurmuliani N (2002) A study of the impact of requirements<br />
volatility on software project performance. In: Proceedings of the Asia-<br />
Pacific Software Engineering Conference (APSEC’2002), IEEE Computer<br />
Society, Los Alamitos, CA, USA, pp 3–11<br />
94
Paper I<br />
What Happened to Our Features? Visualization<br />
and Understanding of Scope Change Dynamics in<br />
a Large-Scale Industrial Setting<br />
<strong>Krzysztof</strong> <strong>Wnuk</strong> 1 , Björn Regnell 1 , Lena Karlsson 2<br />
1 Dept. of Computer Science, Lund University, Sweden<br />
<br />
2 Det Norske Veritas, Sweden<br />
<br />
In Proceedings of the<br />
17th International Requirements Engineering Conference (RE09),<br />
September 2009, Atlanta, USA<br />
ABSTRACT<br />
When developing software platforms for product lines, decisions<br />
on which features to implement are affected by factors<br />
such as changing markets and evolving technologies. Effective<br />
scoping thus requires continuous assessment of how changes<br />
in the domain impact scoping decisions. Decisions may have<br />
to be changed as circumstances change, resulting in a dynamic<br />
evolution of the scope of software asset investments. This paper<br />
presents an industrial case study in a large-scale setting<br />
where a technique called Feature Survival Charts for visualization<br />
of scoping change dynamics has been implemented and<br />
evaluated in three projects. The evaluation demonstrated that<br />
the charts can effectively focus investigations of reasons behind<br />
scoping decisions, valuable for future process improvements.<br />
A set of scoping measurements is also proposed, analyzed theoretically<br />
and evaluated empirically with data from the cases.<br />
The conclusions by the case company practitioners are positive,<br />
and the solution is integrated with their current requirements<br />
engineering measurement process.
1 Introduction<br />
1. INTRODUCTION<br />
Deciding which requirements to include into the scope of an upcoming<br />
project is not a trivial task. Requirements for complex systems may be<br />
counted in thousands, and not all may be included in the next development<br />
project or next release. This means that it is necessary to select a<br />
subset of requirements to implement in the forthcoming project, and hence<br />
postpone the implementation of other requirements to a later point in time<br />
(Wohlin and Aurum, 2005; Greer and Ruhe, 2004). This selection process<br />
is often called scoping and is considered as a key activity for achieving<br />
economic benefits in product line development (Schmid, 2002). While its<br />
importance has already been reported in several studies, research has not<br />
yet put broad attention to the issues of product line scoping. In particular,<br />
following Schmid (2002), we agree that existing work in domain engineering<br />
in software product lines focus mainly on the identification aspect of<br />
scoping e.g. (Kishi et al, 2002; Savolainen et al, 2007). On the other hand,<br />
some researchers have already addressed the issue of understanding underlying<br />
reasons for the inclusion of certain requirements in a specific release<br />
(Wohlin and Aurum, 2005), while others investigated one of the root<br />
causes for changing requirements, namely requirements uncertainty (Ebert<br />
and DeMan, 2005).<br />
The problem with many changes in the scoping process for product line<br />
projects has recently been identified by one of our industrial partners from<br />
the embedded systems domain. This issue has been particularly challenging<br />
for the case company, since their current requirements management<br />
tool could not provide a sufficient method to visualize and characterize this<br />
phenomena. As a remedy, the Feature Survival Chart (FSC) concept was<br />
proposed by the authors and acknowledged by the practitioners as a valuable<br />
support. This paper extends the contributions of (<strong>Wnuk</strong> et al, 2008)<br />
with (1) findings from industrial application in three projects and (2) scope<br />
tracking measurements. The proposed visualization shows the decision<br />
process of including or excluding features that are candidates for the next<br />
release. Our technique can spot the problem of setting too large a scope<br />
compared to available resources as well as increase the understanding of<br />
the consequences of setting a limited scope early. By using graphs, we can<br />
identify which features and which time frames to analyze in order to find<br />
scoping issues related to uncertainties in the estimations that decisions rely<br />
on. The charts have also shown to be useful in finding instabilities of the<br />
scoping process.<br />
The proposed set of scope tracking measurements complements the<br />
proposed visualization technique, and they aim at further increasing the<br />
understanding of the rationale and dynamics of scope changes. The measurements<br />
are analyzed both theoretically and empirically using data from<br />
three large industrial projects that contain hundreds of high-level features<br />
related to thousands of system requirements. We also present findings<br />
97
PAPER I: WHAT HAPPENED TO OUR FEATURES? VISUALIZATION AND<br />
UNDERSTANDING OF SCOPE CHANGE DYNAMICS IN A LARGE-SCALE<br />
INDUSTRIAL SETTING<br />
from discussions on the results with practitioners that ranked the usefulness<br />
of the proposed measurements and expressed their opinions about<br />
their value in scope management.<br />
The paper is structured as follows: Section 2 provides background information<br />
about the context of our industrial case study. Section 3 describes<br />
the methodology used in this study. Section 4 explains our visualization<br />
technique. Section 5 describes the results from applying our technique<br />
to three industrial projects. Section 6 defines and evaluates the proposed<br />
measurements. Section 7 provide conclusions and discusses their<br />
limitations.<br />
2 The case company<br />
Our results are based on empirical data from industrial projects at a large<br />
company that is using a product line approach (Pohl et al, 2005). The company<br />
has more than 5000 employees and develops embedded systems for<br />
a global market. There are several consecutive releases of the platform,<br />
a common code base of the product line, where each of them is the basis<br />
for one or more products that reuse the platform’s functionality and qualities.<br />
A major platform release has approximately a two year lead time<br />
from start to launch, and is focused on functionality growth and quality<br />
enhancements for a product portfolio. Minor platform releases are usually<br />
focused on the platform’s adaptations to the different products that<br />
will be launched with different platform releases. This approach creates an<br />
additional requirements flow, which in our case company is handled as a<br />
secondary flow, and arrives to the platform project usually in the middle of<br />
its life cycle. This flow enables flexibility and adaptation possibilities of the<br />
platform project, while the primary flow is dedicated to address functionality<br />
of the highest importance.<br />
There are several groups of specialists associated with various stages<br />
of the requirements management process in the case company. For this<br />
case, the most essential groups are called Requirements Teams (RTs) that elicit<br />
and specify high-level requirements for a special technical area, and Design<br />
Teams (DTs) that design and develop previously defined functionality.<br />
The company uses a stage-gate model with several increments (Cooper,<br />
1990). There are Milestones (MSs) and Tollgates (TGs) to control the project<br />
progress. In particular, there are four milestones for the requirements management<br />
and design before the implementation starts: MS1, MS2, MS3, and<br />
MS4. For each of these milestones, the project scope is updated and baselined.<br />
The milestone criteria are as follows:<br />
MS1: At the beginning of each project, long-term RT’s roadmap documents<br />
are extracted to formulate a set of features for an upcoming platform<br />
project. A feature in this case is a concept of grouping requirements<br />
that constitute a new functional enhancement to the platform. At this stage<br />
98
3. RESEARCH METHODOLOGY<br />
the features usually contain a description, its market value and effort estimates.<br />
The level of details for the features should be set up in a way<br />
that enables judgment of its market value and effort of implementation.<br />
Both values are obtained using a cost-value approach (Karlsson and Ryan,<br />
1997). The cost for implementation and the market value of features are the<br />
basis for initial scoping inclusion for each technical area. The features are<br />
reviewed, prioritized and approved. The initial scope is decided and baselined<br />
per RT, guided by a project directive and based on initial resource<br />
estimates in the primary receiving DT. The scope is then maintained in a<br />
document called Feature List, that is regularly updated each week after a<br />
meeting of the Change Control Board (CCB). The role of the CCB is to decide<br />
upon adding or removing features according to changes that happen. The<br />
history of scope changes is the input data for the visualization technique<br />
described in this paper.<br />
MS2: Features are refined to requirements which are specified, reviewed<br />
and approved. One feature usually contains ten or more requirements<br />
from various areas in the products. The features are assigned to DTs that<br />
will take responsibility for designing and implementing the assigned features<br />
after MS2. The DTs also allocate an effort estimate per feature.<br />
MS3: The effort estimates are refined and the scope is updated and<br />
baselined. DTs refine system requirements and start designing.<br />
MS4: The requirements work and design are finished, and ready to<br />
start implementation. The final scope is decided and agreed with the development<br />
resources.<br />
According to the company guidelines, most of the scoping work should<br />
be done before reaching the second milestone of the process. The secondary<br />
flow starts approximately at MS2 and is connected to the start of<br />
product projects. Both primary and secondary flows run in parallel under<br />
the same MS criteria until they are merged together when the secondary<br />
flow reaches its MS4. The requirements are written in domain-specific<br />
natural language, and contain many special terms that require contextual<br />
knowledge to be understood. In the early phases, requirements contain<br />
a high-level customer-oriented description while being refined to detailed<br />
implementation requirements at a late stage.<br />
3 Research Methodology<br />
The development of the FSC chart and corresponding scope tracking measures<br />
was performed in an interactive manner that involved practitioners<br />
from the case company. The persons that participated in the constant<br />
evolution and evaluation include one process manager, two requirements<br />
managers and one KPI (Key Performance Indicators) manager. This approach<br />
involves a set of meetings and discussion points between the researchers<br />
and the practitioners that helped to guide the research. As a part<br />
99
PAPER I: WHAT HAPPENED TO OUR FEATURES? VISUALIZATION AND<br />
UNDERSTANDING OF SCOPE CHANGE DYNAMICS IN A LARGE-SCALE<br />
INDUSTRIAL SETTING<br />
of the discussion, the important need to measure the dynamics and the nature<br />
of the scope changes emerged. After proposing and theoretically validating<br />
the measurements, it was decided to apply them to the real scoping<br />
data to empirically confirm the perceived usefulness of the metrics. All<br />
ongoing projects in the case company were investigated for possible usage<br />
of our technique. Our criteria of interest in analyzing a particular project<br />
include (1) the length of analyzed project, (2) the number of features considered<br />
in the scope of the project and (3) the possibility to visualize and<br />
analyze significant scope changes in the analyzed project. As a result, the<br />
three most interesting ones were selected. Furthermore, we have used our<br />
technique to define a set of scoping quality measurements that we evaluated<br />
by practitioners and validated using empirical data. Finally, we have<br />
performed an interview study with platform project requirements managers<br />
in order to understand the rationale and implications for scoping<br />
decisions.<br />
To gather data for this study, we have implemented an exporter to retrieve<br />
the data from the scope parameter of each feature in the Feature<br />
List document. This information was later sorted so that each feature is<br />
mapped into one row and each value of the scope attribute is mapped to<br />
an integer value. After creating graphs, a meeting with practitioners was<br />
held in order to present and discuss results as well as address issues for<br />
future work. As a result of this meeting, it was decided to introduce and<br />
evaluate a set of scope tracking measurements that may give a better insight<br />
into the scoping process practices and may help to assess their quality.<br />
As one of the measurements, it was decided to include a non-numerical<br />
reason for scope exclusion to understand their nature and implications on<br />
the stability of the requirements management process. All measurements<br />
were calculated on an industrial set of three large platform projects.<br />
4 Feature Survival Charts<br />
In this section, we briefly describe our visualization technique. The Feature<br />
Survival Chart (FSC), exampled in Figure 1.1, shows scope changes over<br />
time which is illustrated on the X-axis. Each feature is positioned on a specific<br />
place on the Y-axis so that the complete lifecycle of a single feature can<br />
be followed by looking at the same Y-axis position over time. The various<br />
scope changes are visualized using different colors. As a result, each scope<br />
change can be viewed as a change of the color. Based on discussions with<br />
practitioners we decided to use this coloring scheme: green for features<br />
considered as a part of the scope, red for features considered as de-scoped<br />
and, if applicable, different shades of green for primary and secondary<br />
flows. After sorting the features according to how long they were present<br />
in the scope, we get a graph where several simultaneous scope changes<br />
can be seen as ’steps’ with areas of different colors. The larger the red areas<br />
100
Figure 1.1: Feature Survival Chart for project A.<br />
5. EVALUATION RESULTS<br />
are, the more features are de-scoped in the particular time of the project. At<br />
the top of the graph we can see features that we called ’survivors’. These<br />
features represent functionality that was included early while lasting until<br />
the end of the scoping process. An FSC is also visualizing overall trends in<br />
scoping. In Figure 1.1 we can see that most of scoping activity happened<br />
after MS2 in the project. (Rn.m denotes formal releases.) Since most of<br />
the de-scoping was done rather late in the project, we can assume that a<br />
significant amount of effort might have been spent on features that did not<br />
survive. Thanks to the graphs, we can see which decisions have been made<br />
when and how large impact on the scope they had. The five areas marked<br />
in Figure 1.1 are further discussed in Section 6.3.5. The FSC gives a starting<br />
point for investigating why the decisions were made, and enables definition<br />
of measurements that indicate quality aspects of the scoping process.<br />
5 Evaluation results<br />
In this section, we present results from evaluating our visualization technique.<br />
We present FSCs for three large platform projects in the case com-<br />
101
PAPER I: WHAT HAPPENED TO OUR FEATURES? VISUALIZATION AND<br />
UNDERSTANDING OF SCOPE CHANGE DYNAMICS IN A LARGE-SCALE<br />
INDUSTRIAL SETTING<br />
Figure 1.2: FSC for project B.<br />
pany. The data was gathered during autumn 2008 when all three projects<br />
were running in parallel and were targeted for product releases in 2008<br />
or 2009. Each project was started at different points in time. At the time<br />
when this study was performed one of them had already passed MS4, one<br />
had launched the first platform release and the third had passed MS3. In<br />
Figures 1.1, 1.2 and 1.3 we present one FSC respectively for three projects<br />
denoted A, B and C. Additional information about the projects is presented<br />
in Table 1.1.<br />
All analyzed projects have more than 100 features ever considered in<br />
the scope. For projects B and C, the significant feature number difference is<br />
a result of running these two projects in parallel targeted to be released the<br />
same year. The technical areas are similar for all projects. We can assume<br />
that the projects affect similar groups of requirements analysts, but differ in<br />
size, time of analysis and complexity. Project A was analyzed during a time<br />
period of 77 weeks, during which period two releases of the platform were<br />
launched. The total number of scope changes in the projects is calculated<br />
from MSA and onwards.<br />
Results indicate that we in average experience almost one scope deci-<br />
102
6. SCOPE TRACKING MEASUREMENTS<br />
Figure 1.3: FSC for project C.<br />
sion per feature for each project. This fact indicates the need for a better<br />
understanding of the scoping process, e.g. by visualizing scope changes.<br />
A qualitative analysis of the graphs indicates that for all analyzed projects<br />
the dominant trend is de-scoping rather than scope increases. We name<br />
this phenomena negative scoping. For all analyzed projects we can observe<br />
negative scoping all through the analyzed period.<br />
6 Scope tracking measurements<br />
According to Basili and Rombach (1988), measurement is an effective mechanism<br />
for characterizing, evaluating, predicting and providing motivation<br />
for the various aspects of software construction processes. The same author<br />
states that most aspects of software processes and products are too<br />
complicated to be captured by a single metric. Following this thread, we<br />
have formulated questions related to external attributes of the scoping process,<br />
which in turn is related to internal attributes and a set of five measurements<br />
divided into time related measurements and feature related measurements,<br />
as described subsequently.<br />
103
PAPER I: WHAT HAPPENED TO OUR FEATURES? VISUALIZATION AND<br />
UNDERSTANDING OF SCOPE CHANGE DYNAMICS IN A LARGE-SCALE<br />
INDUSTRIAL SETTING<br />
Project Nbr. of<br />
features<br />
Table 1.1: Characteristics of analyzed projects<br />
Nbr. of<br />
technical<br />
areas<br />
Time<br />
Lenght<br />
(weeks)<br />
A 223 22 77 237<br />
B 531 23 39 807<br />
C 174 20 20 43<br />
6.1 Definition of measurements<br />
Total number of<br />
scope changes<br />
The goal with the measurements is to characterize volatility and velocity<br />
of the scoping process, as well as clarity of the reasons behind them. To address<br />
this goal, we have defined a set of five scope tracking measurements,<br />
which are presented subsequently. Four out of five measurements can be<br />
calculated based on the scope attribute value in the feature list document<br />
and time stamps for this document, while the last measurement needs a<br />
more qualitative approach that requires additional information that complements<br />
the graphs.<br />
6.1.1 Time-related scope tracking measurements:<br />
In this category we have defined one measurement:<br />
Number of positive and negative scope changes per time stamp/baseline<br />
(M1). We define a positive scope change as an inclusion of a feature<br />
into the scope of the project, while a negative change indicates exclusion<br />
from the project. We assume that the scope ideally would stabilize in the<br />
late phase of the project in order to avoid expensive late changes.<br />
6.1.2 Feature related measurements:<br />
In this category we have defined the following measurements that also can<br />
be averaged for the whole platform project:<br />
Time to feature removal (M2) - the time from the feature was introduced<br />
until it was permanently removed. The measurement can of course<br />
only be calculated for the features that have not survived until the end<br />
of the requirements management process. The interpretation of this measurement<br />
can be as follows: it is a matter of quality of the requirements<br />
management process to remove features that will not be included into the<br />
projects due to various reasons as early as possible. This approach saves<br />
more resources for the features that will be included into the scope, and<br />
increases the efficiency of the scoping process. The pitfall related to this<br />
measurement is the uncertainty whether features included into the scope<br />
104
6. SCOPE TRACKING MEASUREMENTS<br />
at the end of the requirements management process will not be excluded<br />
later due to various reasons. On the other hand, even taking this fact into<br />
consideration, we still believe that we successfully can measure M2 and<br />
get valuable indications of the final scope crystallization abilities.<br />
Number of state changes per feature (M3) - this measurement is a reflection<br />
of the measurement M1. By calculating this measurement for all<br />
features and visualizing results in the form of a distribution, we can see<br />
the fraction of complex decisions among all decisions. The interpretation<br />
of this measurement is that the fewer changes per feature in a project, the<br />
more ’stable’ the decision process is and less extra effort has to be spent<br />
on complex decisions making the project less expensive to manage. As already<br />
mentioned, high values for this measurement indicate complex and<br />
frequently altered decisions.<br />
Time to birth (M4) - for each feature that has not yet appeared in the<br />
scope, we calculate the delay time which is proportional to the number of<br />
baselines of the scope document. In our calculations, we took into consideration<br />
the fact the feature list document was baselined irregularly, and we<br />
based our calculations on the number of days between the baselines. This<br />
measurement describes the activity of the flow of new features in time.<br />
Here, similarly to M1, we have to decide what is our starting point in the<br />
project. Our interpretation assumes that we take MS1 as a starting point.<br />
In an ideal situation we expect few features with a long time to birth, since<br />
late additions to the scope create turbulence in the project.<br />
Reason for scoping decision (M5) - as the last measurement described<br />
in this study, we define reasons for scoping decisions. This measurement<br />
will be calculated as a non-numerical value and it can not be automatically<br />
derived from our graphs. As already mentioned in M1, inclusion of a new<br />
functionality is a different change compared with an exclusion of a functionality.<br />
Due to limited access to practitioners, we focused on analyzing<br />
removal of functionality. To calculate M5, we mapped each feature to its<br />
reason for inclusion, reason for exclusion and existing CCB records.<br />
6.2 Theoretical analysis of measurements<br />
In this section, we present results from a theoretical analysis of the proposed<br />
measurements. We have used two approaches: "key stage of formal<br />
measurement" (Fenton and Pfleeger, 1996) and the theoretical validation<br />
(Kitchenham et al, 1995). By following the key stages of formal measurement,<br />
we constructed empirical and mathematical systems and defined a<br />
mapping between these two systems. The attributes of an entity can have<br />
different measurements associated to them, and each measurement can be<br />
connected to different units. Some properties, for example mapping between<br />
real world entities to numbers and the fact that different entities can<br />
have the same attribute value, are by intuition satisfied for all defined measurements.<br />
In Table 1.2 we present defined attributes and relations. We also<br />
105
PAPER I: WHAT HAPPENED TO OUR FEATURES? VISUALIZATION AND<br />
UNDERSTANDING OF SCOPE CHANGE DYNAMICS IN A LARGE-SCALE<br />
INDUSTRIAL SETTING<br />
relate defined measurements with internal and external attributes of the requirements<br />
decision process. As we can see in Table 1.2, the defined set of<br />
measurements is addressing stability, velocity, volatility and understandability<br />
of the scoping process for platform projects. Although four out of<br />
five defined measurements are realized as objective numbers, conclusions<br />
drawn from them about subjective attributes of requirements management<br />
decision process are a matter of interpretation. The subjective interpretation<br />
of the results derived by our measurements is a complex task which<br />
requires a deep domain knowledge and additional information about the<br />
history of the project. We have extended our knowledge by interacting<br />
with requirements managers working with platform projects in order to<br />
derive values for M5.<br />
6.3 Empirical application of measurements<br />
In this section, we present results from an empirical evaluation of measurements<br />
defined in Section 6.1. We have evaluated M1-M4 in three large<br />
platform projects described in Section 5, and M5 in one large project. To increase<br />
the possibilities of drawing conclusions, we have decided to present<br />
time-related measurements as a function of time, while feature-related measurements<br />
are presented in the form of distributions for each evaluated<br />
project.<br />
6.3.1 Number of positive and negative scope changes per time stamp/baseline<br />
(M1).<br />
All three projects turned out to have many scope changes over time. In Figure<br />
1.4 we can see many fluctuations of M1 values both on the positive and<br />
negative side rather late in analyzed projects. This result can be explained<br />
by a stage-gate model for requirements management projects resulting in<br />
high peaks of changes around project milestones. On the other hand, we<br />
experience more than four peaks for each project, which is more than the<br />
number of milestones in the requirements management process. The distinction<br />
of positive and negative changes makes it possible to see in Figure<br />
1.4 that inclusions of new functionality into the project may be correlated<br />
with exclusions of some other functionality. The baseline number represents<br />
the version of the scope document. The best example is the peak of<br />
inclusions for Project A around baseline 38, which immediately resulted in<br />
a peak of exclusions. In this example we can also see that the magnitude<br />
of the change in both directions is similar.<br />
6.3.2 Time to remove a feature (M2).<br />
For this measurement, we present results in the form of distributions. The<br />
distribution presented in Figure 1.5 is showing that many features were<br />
106
6. SCOPE TRACKING MEASUREMENTS<br />
Table 1.2: Results from a theoretical analysis of proposed measurements, by # we mean ’number of’<br />
Entity Internal attribute External Measure Domain Scale Empirical rela- Mathematical<br />
attribute<br />
tion<br />
relation<br />
M1 Feature Size and direc- Stability of # of scope inclu- Feature Ratio negative, pos- ,=,+,-,<br />
List tion of scope the scoping sions at the time List<br />
itive, bigger etc.<br />
changes over process stamp # of scope<br />
smaller, equal<br />
time.<br />
exclusions at the<br />
to, addition,<br />
time stamp<br />
subtraction,<br />
division<br />
M2 Feature The time that Velocity of # days needed to Feature Ratio bigger, smaller, ,=,+,-,<br />
was needed to re- the final make a final de-<br />
equal to, addi- etc.<br />
move the feature scope cryscision about feation,subtrac-<br />
from the scope tallizationture exclusion<br />
tion, division<br />
process<br />
M3 Feature Number of scope Volatility and # scope changes Feature Ratio bigger, smaller, ,=,+,-,<br />
decisions per fea- dynamics of for non-survivors<br />
equal to, addi- etc.<br />
ture<br />
the scope de- needed to retion,subtraccisions.move<br />
them from<br />
tion, division<br />
the scope.<br />
M4 Feature Time when a Volatility of # days from the Feature Ratio bigger, smaller, ,=,+,-,<br />
feature was in- the scope beginning of<br />
equal to, addi- etc.<br />
cluded into the decisions. the project until<br />
tion,subtrac- scope of the<br />
a feature was<br />
tion, division<br />
project<br />
included<br />
M5 Changes Rationale for re- Clarity of Reasons for scope Scope Nominal equal and dif- ,=<br />
to feature moving features the reasons exclusions changes<br />
ferent<br />
from the scope for scope<br />
decisions<br />
107
PAPER I: WHAT HAPPENED TO OUR FEATURES? VISUALIZATION AND<br />
UNDERSTANDING OF SCOPE CHANGE DYNAMICS IN A LARGE-SCALE<br />
INDUSTRIAL SETTING<br />
Numberofinclusionsandexclusions<br />
35<br />
25<br />
15<br />
5<br />
5<br />
15<br />
25<br />
Numberofinclusionsandexclusionsofoverbaselines<br />
0 10 20 30 40 50 60 70<br />
Baselinenumberofthescopedocument<br />
ProjectA Inclusions ProjectA Exclusions ProjectB Inclusions<br />
ProjectB Exlusions ProjectC Inclusions ProjectC Exclusions<br />
Figure 1.4: Number of positive and negative changes as a function of a<br />
baseline number (M1).<br />
removed after a certain number of days in the scope. Our results reveal<br />
three different approaches for removing the features from the scope. For<br />
Project A we can see an initial scope reduction rather early, then a quite<br />
constant number of removed features, and suddenly, after about 300 days<br />
from the project start, large scope reductions. For Project B we can see that<br />
many features were removed in rather short intervals in time, and also<br />
that some significant scope reductions that occurred after 150 days in the<br />
project. On the other hand, Project C is behaving more stable in this matter,<br />
having only one large peak of removed features around 60 days from the<br />
project launch. This type of graph can be useful in assessing how good the<br />
process is in crystallizing the final scope of the platform project.<br />
6.3.3 Number of state changes per feature (M3).<br />
For this measurement, we present the results in the form of distributions.<br />
As we can see in Figure 1.6, most features required only one decision in<br />
the project. This decision usually was an exclusion from the project scope,<br />
but in some cases more than one decision per project was needed. This<br />
fact indicates that features were shifted between the primary and the sec-<br />
108
Numberofremovedfeatures<br />
40<br />
35<br />
30<br />
25<br />
20<br />
15<br />
10<br />
5<br />
0<br />
6. SCOPE TRACKING MEASUREMENTS<br />
Timetoremovethefeaturedistributionsforanalyzed<br />
projects<br />
0 50 100 150 200 250 300 350<br />
Numberofdays<br />
ProjectA ProjectB ProjectC<br />
Figure 1.5: Distributions of time to remove the feature (M2).<br />
ondary flow of requirements, or that the management had to reconsider<br />
previously made commitments. For a better understanding of more complex<br />
decisions, this measurement can be limited to the number of scope<br />
changes needed to remove the feature from the scope of the project. This<br />
measurement may give valuable insights about the complexity of decisionmaking.<br />
We have calculated a derived measurement, and the results are<br />
available online (<strong>Wnuk</strong>, 2010).<br />
6.3.4 Time to birth (M4).<br />
Empirical application of M4 presented as a distribution over time revealed<br />
that some projects have a large peak of new functionality coming into the<br />
scope of the project after 100 days from the beginning. In two out of three<br />
analyzed cases we experienced large scope extensions at various points in<br />
the project timeline. The biggest limitation of this measurement is the fact<br />
that the used process allows for a secondary flow of requirements which<br />
automatically can create large peaks of births at a certain time. We can notice<br />
this fact in Figure 1.7 as a peak of births around day 150 day for Project<br />
B, and around day 220 for Project A. Although the mentioned peaks are<br />
not necessarily revealing any unplanned behavior, Figure 1.7 reveals that<br />
109
PAPER I: WHAT HAPPENED TO OUR FEATURES? VISUALIZATION AND<br />
UNDERSTANDING OF SCOPE CHANGE DYNAMICS IN A LARGE-SCALE<br />
INDUSTRIAL SETTING<br />
Numberoffeatures<br />
200<br />
180<br />
160<br />
140<br />
120<br />
100<br />
80<br />
60<br />
40<br />
20<br />
0<br />
Numberofscopechangesperfeature<br />
1 2 3 4 5 6 7 8 9<br />
Numberofchanges<br />
ProjectA ProjectB ProjectC<br />
Figure 1.6: Distribution of number of changes per feature (M3).<br />
smaller but still significant scope inclusions appeared for project B both<br />
before and after the biggest peak of incoming features.<br />
6.3.5 Reason for scoping decision (M5).<br />
Since M5 is defined as a non-numerical measurement in order to apply it<br />
to our industrial data set and gather results, we held a meeting with two<br />
requirements managers responsible for managing project scoping information.<br />
Each of the requirements managers was responsible for one scoping<br />
project. In this paper, we focus on Project A since it was the most interesting<br />
in terms of late scope changes. Before the meeting, we prepared<br />
five scope-zones which we assumed to be the most interesting to analyze,<br />
see Figure 1.1. During the interview, a responsible requirements manager<br />
checked the reasons for a particular scope change. The reasons were analyzed<br />
both per individual feature, as well as per set of changes in order to<br />
identify possible dependencies between various decisions.<br />
Results for scope changes for project A. As we can see in Figure 1.1, we<br />
decided to include changes from both before and after MS4. The results<br />
are presented below:<br />
Zone 1 - A significant scope reduction after MS3: This zone shows a<br />
110
Numberoffeatures<br />
100<br />
80<br />
60<br />
40<br />
20<br />
0<br />
6. SCOPE TRACKING MEASUREMENTS<br />
Timetobirthdistributions<br />
0 50 100 150 200 250 300 350 400 450 500<br />
Timetobirth(days)<br />
ProjectA ProjectB ProjectC<br />
Figure 1.7: Time to birth distributions (M4).<br />
large scope reduction that happened between MS3 and MS4 in the platform<br />
project. The analysis revealed that this zone includes two reasons for<br />
de-scoping. The first one is the strategic reason and the other one is the<br />
cancellation of one of the products from the product line project.<br />
Zone2-Alarge scope inclusion after MS4: This zone shows a large<br />
set of features introduced to the scope of the project after MS4. The reasons<br />
for this change turned out to be an ongoing work to improve performance<br />
requirements. Because of this reason, it was decided shortly after MS4 to<br />
include these features into the scope.<br />
Zone 3 - A large scope inclusion together with a parallel scope exclusion:<br />
This zone represents a desired behavior of the process used in the<br />
company. The large scope inclusions show a new flow of requirements related<br />
to one of the platform releases. Our responders confirmed that all<br />
three sets of features, separated from each other on the graph, represent an<br />
introduction of a new requirements flow. The focus for the analysis in this<br />
case was to examine if there was any relation between inclusion of new<br />
requirements and exclusion of other requirements at the same time. The<br />
set of de-scoped features turned out not to be related to the big scope inclusion.<br />
As described by the interviewed requirements manager, the main<br />
reasons for these scope changes were defined as "stakeholder business de-<br />
111
PAPER I: WHAT HAPPENED TO OUR FEATURES? VISUALIZATION AND<br />
UNDERSTANDING OF SCOPE CHANGE DYNAMICS IN A LARGE-SCALE<br />
INDUSTRIAL SETTING<br />
Table 1.3: Results from practitioners’ ranking of proposed measurements.<br />
Rank Responder 1 Responder 2 Responder 3<br />
1 M2 M2 M5<br />
2 M5 M5 M1<br />
3 M1 M4 M2<br />
4 M4 M1 M4<br />
5 M3 M3 M3<br />
cision", which means that the previously defined plan was changed to accommodate<br />
other aspects of the product portfolio.<br />
Zone 4 - Some incremental scope inclusions introduced very late in<br />
the project: As we can see in Figure 1.1, this zone covers many of the incremental<br />
scope inclusions by the end of the analyzed time. Since late scope<br />
extensions may put reliability at risk, we investigated why they occurred<br />
and found out that there are many reasons behind this phenomena. One of<br />
the large changes, that involved four features, was caused by administrative<br />
changes in the requirements database. Some additional five features<br />
were included into the scope as a result of a late product gap analysis. A<br />
gap analysis is a task that requirements managers perform in order to ensure<br />
that the scheduled product features are covered by the corresponding<br />
platform project. Finally, seven features introduced into the scope turned<br />
out to be a result of late negotiations with one of the customers.<br />
Zone 5 - Late removal of previously accepted features: In this zone,<br />
we analyze removal of the features that were analyzed in zone 2. We have<br />
asked our responders why initially accepted features later were de-scoped.<br />
They replied that despite these features were initially approved, a new<br />
decision had to be made mainly due to a lack of available development<br />
resources. We also performed a quantitative analysis of reasons for descoping<br />
in Project A. The results are presented in Figure 1.8. We have analyzed<br />
120 de-scoping decisions that belong to project A. The result is shown<br />
in percentages in Figure 1.8, summing up to 100%. As we can see, 33% of<br />
the de-scoping decision were caused by a stakeholder’s business decision,<br />
and 29% by a lack of resources, while 9% of the decisions were caused by<br />
changes in product portfolios. Our largest category, stakeholder business<br />
decision is similar to the category mentioned by Wohlin et al (2005) called<br />
"Stakeholder priority of requirement". Therefore we can assume that the<br />
dominant reason for both inclusions and exclusion of certain requirements<br />
in a specific release does not differ significantly. Furthermore, criteria such<br />
as requirements volatility and resource availability seem to appear both in<br />
our study and in (Wohlin and Aurum, 2005).<br />
As an additional validation step, we asked three practitioners working<br />
112
Percentages<br />
35%<br />
30%<br />
25%<br />
20%<br />
15%<br />
10%<br />
5%<br />
0%<br />
Reasonsforscopeexclusions<br />
Lackof<br />
reasources<br />
Other<br />
Portfoliochanges<br />
Replacedorrenamed<br />
Alreadyimplemented<br />
7. CONCLUSIONS<br />
Figure 1.8: Quantitative analysis of reasons for removing features from the<br />
scope of the Project A.<br />
with scoping to rank the proposed measurements. As a criterion for ranking,<br />
we chose usefulness in understanding the scoping processes and in<br />
defining future improvements. The measurement ranked as number one<br />
is considered to be the most useful one, while the one ranked in position<br />
five is the least useful one. The results are presented in Table 3. As we can<br />
see in Table 3, M3 was ranked as the least useful, while M2 and M5 were<br />
placed in the top three positions for all responders.<br />
7 Conclusions<br />
According to Basili and Rombach (1988), software engineers and managers<br />
need real-time feedback in order to improve construction processes and<br />
products in ongoing projects. In the same manner, the organization can use<br />
post mortem feedback in order to improve the processes of future projects<br />
(Karlsson et al, 2006). Furthermore, visualization techniques used in software<br />
engineering have already proven to amplify human cognition in data<br />
intensive applications, and support essential work tasks (Botterweck et al,<br />
2008). Our visualization technique provides feedback about ongoing scop-<br />
113<br />
Unclearfeatureorrequirements<br />
Dependentofsuppliersupport
PAPER I: WHAT HAPPENED TO OUR FEATURES? VISUALIZATION AND<br />
UNDERSTANDING OF SCOPE CHANGE DYNAMICS IN A LARGE-SCALE<br />
INDUSTRIAL SETTING<br />
ing activities as well as a visualization of past project scoping activities.<br />
Measurements presented in this paper are complementing our visualization<br />
technique by quantitative characterization and qualitative rationale<br />
for scoping decisions. The results in terms of usefulness of the proposed<br />
visualization technique and scope tracking measurements were acknowledged<br />
by practitioners involved in their development as valuable since<br />
they confirm the volatility of the scope and provide a tool to analyze the<br />
various aspects of this phenomenon. The results were then used by the<br />
case company to adjust the process towards more flexibility in scope setting<br />
decisions, and a clearer scope responsibility. Our solution has confirmed<br />
to outperform the previously used table-based textual method to<br />
track the scope changes in the case company. It gives a better overview<br />
of the scoping process of the whole project on a single page size graph.<br />
The industrial evaluation has indicated that our method can be applied<br />
to large scale projects, which demonstrates the scalability of the method.<br />
Finally, the managers at the case company decided that our visualization<br />
technique should be implemented as a standard practice and is currently<br />
in widespread usage at the case company. Even if the characteristics of<br />
scope changes found may be particular to this case study, we believe that<br />
the manner in which these graphs together with measurements are used<br />
to increase the understanding of the performance of the scoping process is<br />
generally applicable.<br />
Limitations. As for any empirical study, there are threats to the validity.<br />
One threat is related to the mapping between measurements and external<br />
attributes. In software engineering we often want to make a statement of<br />
an external attribute of an object. Unfortunately, the external attributes are<br />
mostly indirect measurements and they must be derived from internal attributes<br />
of the object (Wohlin et al, 2000). We are aware that our mapping<br />
can be one of several possible mappings between internal and external attributes.<br />
We address its correctness by evaluating external attributes with<br />
practitioners in the case company. Another threat is related to the generalization<br />
of our results. Although the company is large and develops<br />
technically complex products, it cannot be taken as a representative for all<br />
types of large companies and hence the results should be interpreted with<br />
some caution. Finally, theoretical validation is context dependent and thus<br />
needs to be redone in every new context.<br />
Further work. Additional studies of scope dynamics visualization in<br />
other cases would further increase our understanding of their usefulness.<br />
Enhanced tool support with the possibility of zooming interactively may<br />
be useful, as well as depiction of size and complexity of features by visualizing<br />
their relation to the underlying system requirements. How to<br />
optimize usability of such a tool support, and the search for new possibilities<br />
while observing practitioners using the visualization techniques, are<br />
also interesting matters of further research.<br />
114
Acknowledgments<br />
7. CONCLUSIONS<br />
This work is supported by VINNOVA (Swedish Agency for Innovation<br />
Systems) within the UPITER project. Special acknowledgments to Thomas<br />
Olsson for valuable contributions on scope tracking measurements and to<br />
Lars Nilsson for valuable language comments.<br />
115
PAPER I: WHAT HAPPENED TO OUR FEATURES? VISUALIZATION AND<br />
UNDERSTANDING OF SCOPE CHANGE DYNAMICS IN A LARGE-SCALE<br />
INDUSTRIAL SETTING<br />
116
Bibliography<br />
REFERENCES<br />
Basili V, Rombach D (1988) The tame project: Towards improvementoriented<br />
software environments. IEEE Transactions on Software Engineering<br />
14(6):758–773<br />
Botterweck G, Thiel S, Nestor D, bin Abid S, Cawley C (2008) Visual tool<br />
support for configuring and understanding software product lines. In:<br />
Proceedings of the 12th International Software Product Line Conference<br />
(SPLC 2008), pp 77–86<br />
Cooper R (1990) Stage-gate systems: A new tool for managing new products.<br />
Business Horizons 33(3):44–54<br />
Ebert C, DeMan J (2005) Requirements uncertainty: Influencing factors and<br />
concrete improvements. In: Proceedings of the 27th International Conference<br />
on Software Engineering (ICSE 2005), pp 553–560<br />
Fenton N, Pfleeger S (1996) Software Metrics A Rigorous & Practical Approach.<br />
Thomson Publishing<br />
Greer D, Ruhe G (2004) Software release planning: an evolutionary and<br />
iterative approach. Information and Software Technology 46(4):243–253<br />
Karlsson J, Ryan K (1997) A cost-value approach for prioritizing requirements.<br />
IEEE Software 14(5):67–74<br />
Karlsson L, Regnell B, Thelin T (2006) Case studies in process improvement<br />
through retrospective analysis of release planning decisions. International<br />
Journal of Software Engineering and Knowledge Engineering<br />
16(6):885–915<br />
Kishi T, Noda N, Katayama T (2002) A method for product line scoping<br />
based on decision-making framework. In: Proceeding Second International<br />
Software Product Lines Conference (SPLC 2002), pp 53–65<br />
Kitchenham B, Pfleeger SL, Fenton N (1995) Towards a framework for software<br />
measurement validation. IEEE Transactions on Software Engineering<br />
21(12):929–944<br />
Pohl K, Bockle G, van der Linden F (2005) Software Product Line Engineering:<br />
Foundations, Principles and Techniques. SpringerVerlag<br />
Savolainen J, Kauppinen M, Mannisto T (2007) Identifying key requirements<br />
for a new product line. In: Proceedings of the 14th Asia-Pacific<br />
Software Engineering Conference (APSEC 2007), pp 478–485<br />
Schmid K (2002) A comprehensive product line scoping approach and its<br />
validation. In: Proceedings of the 24th International Conference on Software<br />
Engineering (ICSE 2002), pp 593–603<br />
117
REFERENCES<br />
<strong>Wnuk</strong> K (2010) Distributions of derived m3 can be accessed<br />
at. <br />
<br />
<strong>Wnuk</strong> K, Regnell B, Karlsson L (2008) Visualization of feature survival in<br />
platform-based embedded systems development for improved understanding<br />
of scope dynamics. In: Proceedings of the Third International<br />
Workshop on Requirements Engineering Visualization (REV 2008), pp<br />
41–50<br />
Wohlin C, Aurum A (2005) What is important when deciding to include<br />
a software requirements in a project or release? In: Proceedings of<br />
the International Symposium on Empirical Software Engineering (ISESE<br />
2005), pp 246–255<br />
Wohlin C, Runeson P, Höst M, Ohlsson M, Regnell B, Wesslen A (2000)<br />
Experimentation in Software Engineering An Introduction. Kluwer Academic<br />
Publishers<br />
118
Paper II<br />
Replication of an Experiment on Linguistic Tool<br />
Support for Consolidation of Requirements from<br />
Multiple Sources<br />
<strong>Krzysztof</strong> <strong>Wnuk</strong>, Martin Höst, Björn Regnell<br />
Department of Computer Science,<br />
Lund University, Sweden<br />
<br />
Empirical Software Engineering,<br />
Volume 17 Number 3, 2012, Pages 305-344<br />
ABSTRACT<br />
Large market-driven software companies continuously receive<br />
large numbers of requirements and change requests from<br />
multiple sources. The task of analyzing those requests against<br />
each other and against already analyzed or implemented functionality<br />
then recording similarities between them, also called<br />
the requirements consolidation task, may be challenging and<br />
time consuming. This paper presents a replicated experiment<br />
designed to further investigate the linguistic tool support for<br />
the requirements consolidation task. In this replication study,<br />
45 subjects, working in pairs on the same set of requirements<br />
as in the original study, were assigned to use two methods for<br />
the requirements consolidation: (1) lexical similarity and (2)<br />
searching and filtering. The results show that the linguistic<br />
method used in this experiment is not more efficient in consolidating<br />
requirements than the searching and filtering method,<br />
which contradicts the findings of the original study. However,<br />
we confirm the previous results that the assisted method (lexical<br />
similarity) can deliver more correct links and miss fewer<br />
links than the manual method (searching and filtering).
1 Introduction<br />
1. INTRODUCTION<br />
Requirements engineering in a market-driven context can be characterized<br />
by continuous elicitation, time-to-market constraints, and strong market<br />
competition (Natt och Dag, 2006a; Regnell and Brinkkemper, 2005). In<br />
this context, requirements are continuously arriving from multiple sources,<br />
throughout the development process (Regnell et al, 1998). When the company<br />
is growing and expanding, more products are created which result<br />
in a more complex variability structure, and more effort is needed to handle<br />
product customizations, for example by utilizing the Software Product<br />
Line (SPL) concept (Pohl et al, 2005). This constant flow of requirements<br />
needs to be analyzed from the perspective of new market opportunities<br />
and technical compliance. In a case when a company is large and develops<br />
complex software solutions, the quantity of information to constantly<br />
analyze and assess may severely impede the analytical capacity of requirements<br />
engineers and managers (Gorschek et al, 2007; Leuser, 2009). Providing<br />
a method that can assist in analyzing large numbers of natural language<br />
requirements for the purpose of finding and recording similarities<br />
between them can significantly reduce time needed to perform the task<br />
(Cleland-Huang et al, 2007), help to miss fewer requirements links (Natt<br />
och Dag et al, 2006) and increase the accuracy of the task.<br />
The process of analyzing incoming requirements from customers or<br />
customer representatives (also called proxy-customers) against requirements<br />
already present in the requirements repository can be called requirements<br />
consolidation. This process includes gathering incoming documents, finding<br />
similarities, and merging or linking similar descriptions into a consolidated<br />
single description that covers all analyzed aspects. This process<br />
can also be a part of the broader impact analysis task. The core of the<br />
requirements consolidation process is finding the similarities between requirements<br />
and recording them by making links between them (Natt och<br />
Dag et al, 2006). However, the number of possible links grows exponentially<br />
with the increase of the number of requirements to analyze, which<br />
may result in overwhelming the company’s management and analytical<br />
skills (Leuser, 2009). As a remedy to this problem, Natt och Dag et al<br />
(2006) developed and evaluated a method for requirements consolidation<br />
that utilizes linguistic techniques and provides a list of requirements that<br />
are the most similar to the currently analyzed requirement. The evaluation<br />
of this method showed that using the method can significantly improve<br />
the performance of the consolidation process as well as the number of correctly<br />
linked requirements, and that it can help to miss fewer requirements<br />
links (Natt och Dag et al, 2006). However, the unsupported method used in<br />
the original experiment was limited to a simple search functionality, while<br />
most currently available requirements management tools offer more advanced<br />
filtering and searching techniques.<br />
This replication study has been designed to assess whether the tool<br />
121
PAPER II: REPLICATION OF AN EXPERIMENT ON LINGUISTIC TOOL<br />
SUPPORT FOR CONSOLIDATION OF REQUIREMENTS FROM MULTIPLE<br />
SOURCES<br />
with a linguistic analysis of the similarity between requirements can still<br />
perform better than currently available commercial requirements management<br />
tools in the task of requirements consolidation. A replicated experiment<br />
has been chosen due to its falsifiable nature. Replications provide a<br />
possibility to evaluate whether the output parameters of a system remain<br />
stable if one or more input parameters are systematically changed.<br />
In this experiment, two subject groups, working in pairs, were asked<br />
to consolidate two requirements sets by finding and linking requirements<br />
that address the same underlying functionality. This replication reuses the<br />
original procedures in terms of the study design, experimental steps and<br />
the two requirement sets. The changes to the original experiment are: (1)<br />
using another set of subjects which were asked to work in pairs due to<br />
unexpected housing issues and (2) changing one of the treatments. Due<br />
to a limited number of available computers in the laboratory room, the<br />
subjects were asked to work in pairs on the assignment. Given this context,<br />
this replication study can be classified according to Shull et al (2008)<br />
as a dependent replication. However the classification provided by Shull<br />
does not define if a replication where both the population and one of the<br />
methods used to test the hypotheses is changed can also be categorized<br />
as an exact replication (Shull et al (2008) only mention changing either the<br />
population or the artifact on which the technique is applied). According<br />
to the classification by Basili et al (1999), this replication type is the one<br />
that varies the research hypotheses. The unchanged object in this replication<br />
study, also called the assisted method, is a research prototype tool,<br />
called ReqSimile (Natt och Dag, 2006b), that utilizes linguistic analysis to<br />
assist in the task of finding similar requirements. The second object, which<br />
was changed compared with the original experiment, is called the manual<br />
method, and it utilizes searching and filtering functionalities implemented<br />
in a tool called Telelogic Doors (IBM, 2010a). 1<br />
The objectives of the study are twofold: firstly to assess if a significant<br />
differences between the two methods tested in the original experiment can<br />
be confirmed in a replicated experiment setup and secondly to compare<br />
the results for the same methods between the two experimental sessions.<br />
The objectives are refined to two main research questions in Section 4.<br />
The paper is structured as follows: Section 2 provides industrial problem<br />
description. Section 3 provides related work. Section 4 describes the<br />
experimental design. Section 5 explains experiment execution procedures.<br />
Section 6 describes the experiment results analysis. Section 7 provides an<br />
interpretation of results. Section 8 concludes the paper.<br />
1 The Telelogic DOORS tool has recently changed its vendor and its name to Rational<br />
DOORS. However, since the Telelogic Doors version 8.3 was used in this experiment, we<br />
will refer to this tool throughout this paper as Telelogic Doors. Both methods were compared<br />
for the task of requirements consolidation meaning that comparing the two tools in general is<br />
outside of the scope of this paper.<br />
122
2 Industrial Problem Description<br />
2. INDUSTRIAL PROBLEM DESCRIPTION<br />
New requirements and changes to existing requirements are inevitable situations<br />
at all stages of the system development process (Kotonya and Sommerville,<br />
1998). The two principal requirements management activities<br />
that address this phenomena are: (1) change control and (2) change impact<br />
assessment. The change control ensures that, if a change is accepted, its impact<br />
on design and implementation artifacts will be addressed. The change<br />
impact assessment warrants that proposed changes have a known impact<br />
on the requirements and software system (Kotonya and Sommerville, 1998).<br />
A company that is operating in a market-driven mode should continuously<br />
monitor the market situation by checking competitors’ latest achievements,<br />
researching market needs and collecting all possible feedback from the<br />
market in a chase for achieving or maintaining the competitive advantage<br />
within its operational business. This pursuit after an optimal market window,<br />
together with other reasons, creates a constant flow of new requirements<br />
and ideas throughout the entire software product lifetime (Karlsson<br />
et al, 2002). As a result, the requirements process for market-driven<br />
contexts needs to be enriched with procedures to capture and analyze this<br />
constant flow of requirements (Higgins et al, 2003).<br />
As pointed out by practitioners from large companies (Berenbach et al,<br />
2009), when development projects grow in complexity and new products<br />
are released to the market with many features, the importance of good<br />
practices in requirements management grows. In the case when a company<br />
is large and operates globally, the diversity of customers and the<br />
complexity of software products can make the list of sources of new requirements<br />
and change requests extensively long, including: customers<br />
and proxy-customers (marketing, customer representatives and key account<br />
managers), suppliers, portfolio planners and product managers. The<br />
company’s requirements analysts should, in this, case analyze all incoming<br />
requirements and change requests in order to find an optimal set of<br />
requirements that will address the needs of as many customers as possible.<br />
In this context, the concept of Software Product Lines (SPL) (Pohl et al,<br />
2005) is often used to increase the reuse of common components while providing<br />
necessary diversity of similar products, requested by various customers.<br />
Change management in a Software Product Lines context can be particularly<br />
challenging, for example, because of the extensive and often exhaustive<br />
variability analysis that has to be performed while analyzing the<br />
impact of a change. Moreover, the requirements analyst has to consider if<br />
a certain new requirement or request has already been analyzed and what<br />
was the result of this analysis. One of the methods to assist with the analysis<br />
of incoming requirements versus those already present in the requirements<br />
database is to find and record similarities, making traceability links.<br />
In the industrial case example, provided by the original experiment, the<br />
123
PAPER II: REPLICATION OF AN EXPERIMENT ON LINGUISTIC TOOL<br />
SUPPORT FOR CONSOLIDATION OF REQUIREMENTS FROM MULTIPLE<br />
SOURCES<br />
experts became frustrated during the analysis because they had to identify<br />
compliance to the same or very similar requirements multiple times.<br />
Large parts of the new versions of requirements request documents, arriving<br />
from the same customer are typically the same as previous versions.<br />
Furthermore, the same and very similar requirements can appear in the request<br />
from different customers (Natt och Dag et al, 2006). Providing an automatic<br />
or semi-automatic method of analyzing similarity between incoming<br />
requirements could significantly decrease the amount of time needed<br />
to perform this task.<br />
The process of finding and recording similarities between software development<br />
artifacts is a part of the requirements traceability activity, which<br />
has been widely recognized as a useful method for recording relations and<br />
dependencies between software project artifacts for the purposes of change<br />
and impact analysis tasks (Ramesh et al, 1995; Wiegers, 2003; Antoniol<br />
et al, 2002; Jarke, 1998; Gotel and Finkelstein, 1994). The core of the requirements<br />
traceability task is to find and record the dependencies between the<br />
traced elements, which are assumed to be exhibited by their lexical similarity<br />
(Natt och Dag, 2006a). The importance of requirement traceability is<br />
significant; the U.S. Department of Defense invested in 2001 about 4 percent<br />
of its total IT budget on traceability issues (Ramesh and Jarke, 2001).<br />
Other large companies, have also stressed the importance of implementing<br />
traceability in their industry projects (Samarasinghe et al, 2009; Berenbach<br />
et al, 2009; Konrad and Gall, 2008; Panis, 2010; Leuser, 2009).<br />
However, despite recognition of its importance, implementing a successful<br />
traceability in practice is challenging (Cleland-Huang et al, 2002).<br />
The task of finding relationships between the elements and establishing<br />
traces between them is a “mind numbing” (Hayes et al, 2003), error prone<br />
and time consuming activity. Moreover, maintaining a traceability scheme<br />
is difficult because the artifacts being traced continue to change and evolve<br />
as the system is developed and extended (Zowghi and Offen, 1997; Strens<br />
and Sugden, 1996). Furthermore, as pointed out by Leuser (2009), current<br />
traceability approaches used in practice are cumbersome and very time<br />
consuming, mainly because they are almost completely manual. The size<br />
of requirements specifications in large industrial projects may reach thousands<br />
of requirements (Leuser, 2009; Konrad and Gall, 2008). To tackle<br />
these issues, several researchers proposed using Information Retrieval (IR)<br />
methods such as the Vector Space Model (VSM), also used in this experiment,<br />
(Antoniol et al, 2002; Cleland-Huang et al, 2007; Natt och Dag et al,<br />
2004), the Probabilistic Network Model (Cleland-Huang et al, 2005, 2010),<br />
and Latent Semantic Indexing (LSI) (De Lucia et al, 2007; Huffman Hayes<br />
et al, 2006; Lormans and van Deursen, 2006; Marcus and Maletic, 2003) for<br />
semi-automatic recovery of traceability links.<br />
124
3 Related Work<br />
3. RELATED WORK<br />
Replications play an important role in software engineering by allowing<br />
us to build knowledge about which results or observations hold under<br />
which conditions (Shull et al, 2008). Unfortunately, replications in software<br />
engineering are still rarely reported (Ivarsson and Gorschek, 2009). A<br />
recent survey of controlled experiments in software engineering revealed<br />
that replications are still neglected by empirical researchers, only 18% of<br />
the surveyed experiments are reported as replications (Sjøberg et al, 2005).<br />
Moreover only 3.9% of analyzed controlled experiments can be categorized<br />
according to the IEEE taxonomy as requirements/specification related<br />
(Sjøberg et al, 2005; IEEE, 2010).<br />
The awareness of new possibilities that Natural Language Processing<br />
(NLP) can bring to requirements engineering has been present from the<br />
beginning of the requirements engineering discipline, when Rolland et<br />
al (1992) discussed the natural language approach for requirements engineering.<br />
Shortly after, Ryan (1993) warned that although natural language<br />
processing provides a variety of sophisticated techniques in the requirements<br />
engineering field, they can only support sub-activities of requirements<br />
engineering and that the process of using natural language processing<br />
techniques has to be guided by practitioners. The possibilities mentioned<br />
by Ryan (1993) and Rolland et al (1992) have later been explored<br />
by a number of research studies and publications, where applications of<br />
various NLP techniques in supporting requirements management activities<br />
were evaluated and discussed. Among those that include some kind of<br />
empirical evaluations, the vast majority of natural language process tools<br />
are used to examine the quality of requirements specifications in terms of,<br />
for example, the number of ambiguities (Fantechi et al, 2003) by assigning<br />
ambiguity scores to sentences depending on the degree of syntactic and<br />
semantic uncertainty (Macias and Pulman, 1995), or detecting ambiguities<br />
by applying an inspection technique (Kamsties et al, 2001). Furthermore,<br />
Rupp et al (2000) produced logical forms associated with parsed sentences<br />
to detect ambiguities. Among other quality attributes of requirements artifacts<br />
that natural language processing attempts to analyze and improve,<br />
Fabbrini et al (2001) proposed a tool that assesses understandability, consistency,<br />
testability, and correctness of requirements documents. Providing<br />
measurements that can be used to assess the quality of a requirements<br />
specification document is the aim of the ARM tool proposed by Wilson et al<br />
(1997). Mich et al (2002) reported on an experiment designed to assess the<br />
extent to which an NLP tool improves the quality of conceptual models.<br />
Finally, Gervasi et al (2000) used natural language processing techniques<br />
to perform a lightweight validation (low computational and human costs)<br />
of natural language requirements.<br />
Apart from the quality evaluation and assurance tasks, NLP techniques<br />
have also been applied to the task of extracting abstractions from textual<br />
125
PAPER II: REPLICATION OF AN EXPERIMENT ON LINGUISTIC TOOL<br />
SUPPORT FOR CONSOLIDATION OF REQUIREMENTS FROM MULTIPLE<br />
SOURCES<br />
documents (Aguilera and Berry, 1991; Goldin and Berry, 1997) and helping<br />
combining crucial requirements from a range of documents that include<br />
standards, interview transcripts, and legal documents (Sawyer et al,<br />
2002). Sawyer at al (2005) have also reported how corpus-based statistical<br />
language engineering techniques are capable of providing support for<br />
early phase requirements engineering. Rayson et al (2001) reported experiences<br />
from a project where probabilistic NLP techniques were used to<br />
identify and analyze domain abstractions. Their results were further supported<br />
by a later study by Sawyer et al (2004), where ontology charts of<br />
key entities were produced using collocation analysis. The continued interest<br />
in this issue has been reported by Gacitua et al (2010) who proposed a<br />
new technique for the identification of single- and multi-word abstractions<br />
named Relevance driven Abstraction Identification (RAI). Finally, Gervasi<br />
et al (1999) used lexical features of the requirements to cluster them according<br />
to specific criteria, thus obtaining several versions of the requirements<br />
document.<br />
The ReqSimile tool evaluated in this paper uses a correlation to measure<br />
lexical similarity and thus rank candidate requirements for linking,<br />
presenting to the user the “top” subset of those requirements. The linguistic<br />
method, also called the cosine measure, uses a vector-space representation<br />
of requirements where each requirement is represented using a vector<br />
of terms with the respective number of occurrences (Natt och Dag et al,<br />
2004; Manning and Schütze, 2002). Each term can be seen as a dimension<br />
in an N-dimensional space while a whole requirement can be represented<br />
as a point in the N-dimensional space. Similar requirements will be represented<br />
in this space as m points closely clustered. From the matrix, which<br />
shows how many times a term appears in each requirement, the information<br />
may be derived about how many terms the two requirements have<br />
in common. The very similar requirements will result in closely clustered<br />
points in this vector space (Manning and Schütze, 2002). In the evaluated<br />
method (Natt och Dag, 2006a) a frequency of terms has been used, instead<br />
of counting the occurrences. The cosine correlation measure is often chosen<br />
in text retrieval applications for the purpose of finding similar requirements,<br />
as it does not depend on the relative size of the input (Manning and<br />
Schütze, 2002).<br />
σ( f , g) =<br />
∑ w f (t) ∗ wg(t)<br />
t<br />
<br />
∑ w f (t)<br />
t<br />
2 ∗ ∑ wg(t)<br />
t<br />
2<br />
(2.1)<br />
The measure in equation 2.1 is used for calculating the degree of similarity,<br />
where f and g are two requirements, t ranges over terms, and w(t) denotes<br />
the weight of term t. The term weight is typically a function of the<br />
term frequency, since while the number of times a word occurs is relevant,<br />
its relevance decreases as the number gets larger (Manning and Schütze,<br />
126
3. RELATED WORK<br />
2002). However, there is a challenge in the way stemming rules are used<br />
in this method. For example, the stemming rules do not reduce the verb<br />
containerization and the noun container to the same stem. From a semantic<br />
point of view this is perfectly correct, but as the two terms concern the<br />
same domain concept their association should be utilized to increase the<br />
similarity measure. The realization of the Vector Space Model used in this<br />
paper does not support this association. Another potential problem has<br />
to do with synonyms as they are not considered in the model. Finally, as<br />
mentioned in (Natt och Dag, 2006a), there is no guarantee that two requirements<br />
that are similar according to the σ(.) measure are indeed related. The<br />
method evaluated does not consider hypernyms and hyponyms (Jackson<br />
and Moulinier, 2002).<br />
The ReqSimile tool evaluated in this paper is not the only research tool<br />
that provides support for requirements traceability. Hayes et al (2007)<br />
proposed a REquirements TRacing On-target (RETRO) tool that uses the<br />
LSI technique to find similarities between analyzed elements and help the<br />
analyst with making traceability links. Lin et al (2006) proposed a Webbased<br />
tool called POIROT that supports traceability across distributed heterogeneous<br />
software artifacts. A probabilistic network model is used by<br />
POIROT to generate traces between requirements, design elements, code<br />
and other artifacts stored in distributed third party case tools.<br />
The second method evaluated in this study uses searching and filtering<br />
functionalities provided by Telelogic DOORS tool (IBM, 2010b). According<br />
to the product documentation, the "finding text in a module" function can<br />
search for all the objects that contain a specific search string. The tool displays<br />
the options of the search that have already been set in the search window.<br />
The possible options are: (1) highlight matches, (2) match case and<br />
(3) use regular expressions. To change the search options, the Advanced tab<br />
in the same window has to be used. Additionally, it is possible to select the<br />
attributes included in the search, for example object heading or object text.<br />
The tool provides UNIX-style regular expressions support when searching<br />
for text. For example, using c.t will search for all three letter words<br />
that start with c and end with t. Using 200[123] will search for either 2001,<br />
2002, or 2003. Subjects during the experiment can also use filters to control<br />
what data is displayed on the screen. The tool provides two types of filters:<br />
simple and advanced. Simple filters can be used to filter: (1) the contents<br />
of every attribute of type text or string, (2) object heading number, (3) the<br />
content of any column or the value of a single attribute of any type. Additionally,<br />
it is possible to filter on the basis of whether the object has links or<br />
is either the current object or a leaf object. Using advanced filters gives the<br />
possibility to combine simple filters to create complex filters, specify filter<br />
options that control what is displayed.<br />
Using filters requires more steps than using the searching functionality.<br />
First, the filter has to be defined and its attributes have to be set. After<br />
this step, the user has to define if the filter should match case option or<br />
127
PAPER II: REPLICATION OF AN EXPERIMENT ON LINGUISTIC TOOL<br />
SUPPORT FOR CONSOLIDATION OF REQUIREMENTS FROM MULTIPLE<br />
SOURCES<br />
regular expressions. Finally, it is possible to filter only objects that have<br />
certain types of links, such as in-links, objects that are leafs and filter the<br />
content of columns. While using advanced filters, it is possible to combine<br />
previously defined simple filters by using And, Or and Not to combine<br />
them into logical expressions. It is also possible to control the output of<br />
applying a filter. The possible options are: (1) show ancestors or (2) show<br />
descendants of the object that match the filter criteria and (3) display all<br />
table cells and their contents regardless of whether they match the filter<br />
criteria. According to the product documentation, the Telelogic DOORS<br />
tool does not provide any auto-completion, stemming or proximity search<br />
options. Exclusion searches are possible by combining two simple filters<br />
where one is negated by using the “NOT” logical expression. 2<br />
The requirements consolidation task can, in a broad perspective, be<br />
considered as the more general task of negotiating the scope of the future<br />
project with multiple stakeholders. Assuming this broad definition of the<br />
task, we discuss alternative approaches of supporting this negotiation process.<br />
Fricker et al (2010) propose a negotiation process, called handshaking<br />
with implementation proposals. The process has been used to communicate<br />
requirements effectively, even in situations where almost no written<br />
requirements exist and where distance separates the customer from the<br />
developers. The architectural options are used in this case to understand<br />
requirements and make implementation decisions that will create value.<br />
Sommerville and Sayer (1997) proposed a viewpoint-based approach to requirements<br />
engineering which may be used to structure the requirements<br />
description and expose conflicts between different requirements. As systems<br />
usage is heterogeneous, viewpoints can organize different types of<br />
information needed to specify the system and by that help to structure the<br />
process of requirements elicitation. Breaux (2009) uses grounded theory to<br />
analyze regulations and legal documents for the purpose of ensuring that<br />
the software system to be built is demonstrably compliant with relevant<br />
laws and policies.<br />
4 Experimental Design<br />
The two main objectives of this study, presented in Section 1, can be further<br />
refined to the following research questions:<br />
Q1: Can significant differences between the assisted and the manual methods<br />
that were achieved in the original experiment be confirmed in a replicated<br />
experiment where the original manual method is replaced with a key-<br />
2 The information about searching and filtering functionalities has been based on the manual<br />
for DOORS version 8.3. The instruction of how to use Telelogic Doors for linking used in<br />
this experiment is available at <br />
<br />
128
word searching and filtering tool?<br />
4. EXPERIMENTAL DESIGN<br />
Q1a: Is the assisted method more efficient in consolidating two requirements<br />
sets than the manual method (where efficiency is calculated as the<br />
number of analyzed requirements)?<br />
Q1b: Is the assisted method more correct in consolidating two requirements<br />
sets by assigning more correct links than the manual method (correctness<br />
is calculated as a number of correctly linked requirements)?<br />
Q1c: Does the assisted method help to miss fewer requirements links<br />
than the manual method?<br />
Q2: Is there any difference between the original and replicated experiment<br />
sessions for the same method?<br />
Q2a: Is there any difference in the results for the assisted method between<br />
the original and the replicated experiments?<br />
Q2b: Is there any difference in the results for the manual methods between<br />
the original and the replicated experiments?<br />
The aim of Q1 is to assess if the results obtained in the original experiment<br />
holds even if one of the tools is changed. The research question Q1 is<br />
divided into three sub-questions, where each of them is explicitly addressing<br />
various quality aspects of the consolidation process. Question Q2 aims<br />
to assess the difference between the two experiments. The possible differences<br />
provide valuable input regarding the nature of the consolidation task<br />
and the subjects used in both experiments.<br />
The central part of the requirements consolidation task is finding similarities<br />
between the two sets of requirements as described in detail in Section<br />
3. The methods evaluated in the experiment were implemented in two<br />
tools: (1) ReqSimile (Natt och Dag et al, 2006) and (2) Telelogic Doors (IBM,<br />
2010a). As mentioned in Section 1, the goal of the study is not to evaluate<br />
the tools in general, but to compare the methods that they provide. The<br />
planning phase was based on the original experiment (Natt och Dag et al,<br />
2006) and, when possible, the original material is reused and extended according<br />
to the guidelines of designing experiments presented by Wohlin<br />
et al (2000). In order to draw more general conclusions, the authors put<br />
additional effort into minimizing the difference between this experiment<br />
design and the original experiment design.<br />
Since most of the design has been reused from the original experiment,<br />
the evaluation of the experiment design for the replication sake was limited<br />
to checking additional changes. The changes concern questionnaire improvements<br />
and new instructions regarding the use of the Telelogic Doors<br />
tool (IBM, 2010a). The experiment design was evaluated by an additional<br />
researcher, experienced in conducting empirical research in software engineering,<br />
before executing the experiment. The same researcher partici-<br />
129
PAPER II: REPLICATION OF AN EXPERIMENT ON LINGUISTIC TOOL<br />
SUPPORT FOR CONSOLIDATION OF REQUIREMENTS FROM MULTIPLE<br />
SOURCES<br />
AssistedorManual<br />
method<br />
Figure 2.1: The process of using the support tool for requirements consolidation.<br />
pated in the pilot study where both tools were used to find similar requirements<br />
and create links between them. Comments and suggestions regarding<br />
readability and understandability of the laboratory instructions were<br />
given and later implemented. Finally, since the requirements sets used in<br />
this experiment were the same as in the original experiment, the correct<br />
answer to the consolidation task remained unchanged 3 .<br />
Similarly to the original experiment, this replication study was also<br />
conducted in the form of a laboratory experiment, since it captures the consolidation<br />
problem in an untainted way. Fig. 2.1 depicts the conceptual solution<br />
of the consolidation activity. To the left in Fig. 2.1, two requirement<br />
sets A and B are shown. They represent two consecutive submissions of<br />
requirements specifications from the same key customer. We can also assume<br />
that the earlier specification is set A in this case, and that it would<br />
have already been analyzed and the result from the analysis is available in<br />
the central requirements database. The subjects use one of the tools, either<br />
Telelogic Doors for the manual method (IBM, 2010a) or ReqSimile for the<br />
assisted method (Natt och Dag et al, 2006), to find requirements in the set B<br />
that were already analyzed in the set A and to mark them by assigning a<br />
link between them. The output of the process is shown to the right of Fig.<br />
3 The experiment pack can be accessed at <br />
<br />
130
4. EXPERIMENTAL DESIGN<br />
2.1. The subset A’ comprises all requirements that are not linked to any requirement<br />
in the set A. The subset B’ represents all new requirements that<br />
have not previously been analyzed. Finally, there is the subset C, which<br />
comprises all requirements in the new specification that previously have<br />
been analyzed. The analyst would then send the requirements in set B’ to<br />
the experts for analysis. The experts are thus relieved from the burden of<br />
re-analyzing the requirements in subsets A’ and C.<br />
4.1 Goals, Hypothesis, Parameters and Variables<br />
The variables in this experiment were kept unchanged from the original<br />
study (Natt och Dag et al, 2006). They can be grouped into independent,<br />
controlled and dependent:<br />
• The independent variable is the method used in the experiment. The<br />
two methods compared are manual and assisted.<br />
• The controlled variable is the experience of the participants. In order<br />
to analyze the individual experience of the subjects, a questionnaire<br />
was used.<br />
The dependent variables are:<br />
T - time used for the consolidation<br />
N - the number of analyzed requirements<br />
N cl - number of correct links<br />
N il - number of incorrect links<br />
Ncu - number of correctly not linked<br />
N iu - number of missed links (incorrectly not linked)<br />
These dependent variables are used to analyze the hypotheses. The<br />
number of analyzed requirements is used in case the subjects are not able<br />
to analyze all requirements, which will affect N iu and Ncu. The hypotheses<br />
for comparing the manual and the assisted method remain unchanged from<br />
the original experiment design. The rationale of the proposed hypotheses<br />
is based on the following theory regarding using the assisted method.<br />
The assisted method provides a list of candidate requirements ranked by<br />
their similarity degree to a currently analyzed requirement. As a result the<br />
requirements analysts has to review only a subset of all possible combinations,<br />
for example the top ten candidate links. Thus we state a hypothesis<br />
that the assisted method can help to analyze requirements faster. Moreover,<br />
since the most similar requirements are placed next to each other on the<br />
list of candidates it is easier to read all potential candidates that exhibit<br />
high degree of lexical similarity. The result is expected to be an increased<br />
number of correct links, better precision and accuracy. Finally, the sorting<br />
according to lexical similarity should, in our opinion, help to miss fewer<br />
correct requirement links, since there is a high probability that all possible<br />
131
PAPER II: REPLICATION OF AN EXPERIMENT ON LINGUISTIC TOOL<br />
SUPPORT FOR CONSOLIDATION OF REQUIREMENTS FROM MULTIPLE<br />
SOURCES<br />
links to analyze will be show in the top 10 or 20 candidate requirements.<br />
Presented below are six null hypotheses:<br />
(H1 0 ) The assisted method results in the same number of requirements analyzed<br />
per minute, N/T, as the manual method.<br />
(H2 0 ) The assisted method results in the same share of correctly linked requirements,<br />
Ncl/(Ncl +Niu), as the manual method.<br />
(H3 0 ) The assisted method results in the same share of missed requirements<br />
links, Niu/(Ncl + Niu), as the manual method.<br />
(H4 0 ) The assisted method results in the same share of incorrectly linked<br />
requirements, Nil/N, as the manual method.<br />
(H 5 0 ) The assisted method is as precise, N cl/(N cl + N il), as the manual method.<br />
(H 6 0 ) The assisted method is as accurate, (N cl + Ncu)/(N cl + N il + Ncu +<br />
N iu), as the manual method.<br />
Since the subjects may not use exactly the same time for the task, the performance<br />
is normalized as the number of analyzed requirements divided<br />
by the total time spent on the consolidation task (in minutes).<br />
4.2 Subjects<br />
In this study, a different set of subjects compared to the original experiment,<br />
although from the same kind of population was used. The sample<br />
includes participants of the course in Requirements Engineering at (Lund<br />
University, 2011a). The course is an optional master-level course offered<br />
for students at several engineering programs including computer science<br />
and electrical engineering. It gives 7.5 ETCS points (ECTS, 2010) which<br />
corresponds to five weeks full time study. Although the experiment was a<br />
mandatory part of the course, the results achieved by the subjects had no<br />
influence on their final grade from the course. The students were between<br />
24 and 41 years old with an average of 27 years. There were 4 female and<br />
41 male students. Before conducting the experiment, the subjects had been<br />
taught requirements engineering terminology and had gained practical experiences<br />
through their course project. The result from the pre-test questionnaire<br />
revealed that the difference in English reading and writing were<br />
small, varying from "very good knowledge" for the majority of subjects to<br />
"fluent knowledge" for some of them. When it comes to the industrial experience<br />
in software development of the subjects, most of them reported no<br />
experience at all (28 out of 45 students). Among the subjects that reported<br />
any degree of industrial experience, the length of the experience varied be-<br />
132
4. EXPERIMENTAL DESIGN<br />
Table 2.1: The number of years of industrial experience in software development<br />
for pairs of the subjects that participated in this replication. The<br />
remaining pairs of subjects exhibited no industrial experience for both pair<br />
members. The letter A indicates that a pair of subjects used the assisted<br />
method while the letter M indicates that a pair of subjects used the manual<br />
method. The IDs (Mx and Ay) are consistent with Table 2.5. The rows highlighted<br />
bold text indicate data points that were removed from the analysis<br />
(outliers).<br />
Pair of subjects Experience of the first<br />
subject in the pair (in<br />
years)<br />
A1 0.5 1.5<br />
A3 1 1<br />
A7 1 2<br />
A10 0 1<br />
A11 0.5 1<br />
M4 1 2<br />
M5 0.5 0<br />
M6 0.25 0<br />
M7 0.5 1<br />
M8 0.25 1.5<br />
Experience of the second<br />
subject in the pair (in<br />
years)<br />
tween three months and two years with an average value of 11 months.<br />
The analysis of industrial experience in pairs of subjects revealed that ten<br />
pairs had varying degrees of industrial experience which was not always<br />
equal. The analysis of the experience of both pair members is presented in<br />
Table 2.1. The difference in experience varied between three months and<br />
15 months with an average value of nine months. The impact of the industrial<br />
experience on the results achieved by these subjects is outlined and<br />
discussed in detail in Section 7.1 and Table 2.7.<br />
We have also performed an analysis of the experience of subjects from<br />
the project course that the requirements used in this experiment were developed<br />
here (Lund University, 2011b). The results of the analysis are presented<br />
in Table 2.2. The results revealed that 22 out of the 45 subjects have<br />
not taken the course that the requirements originate from, while the rest<br />
had taken the course and acted in various roles during the project phase of<br />
the course.<br />
Next, the roles taken in the course that the requirements originate from<br />
in the pairs formed by subjects were analyzed. For 9 pairs, outlined in<br />
Table 2.2, the pairs are formed by an inexperienced person and an expe-<br />
133
PAPER II: REPLICATION OF AN EXPERIMENT ON LINGUISTIC TOOL<br />
SUPPORT FOR CONSOLIDATION OF REQUIREMENTS FROM MULTIPLE<br />
SOURCES<br />
M2 Has not taken the course Tester<br />
M3 Has not taken the course System group member<br />
M4 Development Manager and Developer Test Manager and Tester<br />
M5 Tester Has not taken the course<br />
M6 System Group Member Project Manager<br />
M7 Has not taken the course Developer<br />
M9 System Group Member Developer<br />
M10 Development Manager Project Manager<br />
M11 Has not taken the course System Group Member<br />
A1 Project Manager Has not taken the course<br />
A2 Project Manager Tester<br />
A3 Test Manager and Tester Has not taken the course<br />
A4 Developer Developer<br />
A5 Has not taken the course Tester<br />
A6 Project Manager Has not taken the course<br />
A7 Developer Has not taken the course<br />
A12 Developer<br />
134<br />
Pair of subjects Role of the first subject in the pair Role of the second subject in the pair<br />
Table 2.2: The experience and the roles of the subjects that participated in the replication from the course that the requirements<br />
originate from. The letter A indicates that a pair of subjects used the assisted method while the letter M indicates that<br />
a pair of subjects used the manual method (the numbers are consistent with Table 5). The rows highlighted with bold text<br />
indicate data points that were removed from the analysis (outliers).
4. EXPERIMENTAL DESIGN<br />
rienced person from the course. This may have a positive impact on the<br />
task, since the more experienced person can help the inexperienced person<br />
to understand the nature and origin of the requirements set. However,<br />
the more experienced person can bias the consolidation task by bringing<br />
knowledge about the requirements sets and possible similar requirements<br />
from the course. The remaining seven pairs represented experience from<br />
various roles including: developer, development manager system group<br />
manager, project manager and tester. Only one pair had the same experience<br />
from being a developer, in other cases the roles taken in the course<br />
project did not overlap.<br />
When it comes to the experience in analyzing and reviewing requirements,<br />
80% of the subjects declared to have experience only from courses.<br />
Among the remaining 20% of the subjects, one pair (M5) had experience<br />
from both courses and industry (less than one year). In this case, the second<br />
pair member had only experience from courses. Furthermore, in cases<br />
(A1,A3 and A11), one pair member reported both experience from courses<br />
and less than a year of industrial experience in analyzing and reviewing requirements.<br />
In all three cases, these participants were paired with subject<br />
reporting only experience from the courses. Finally, in the case of pair M8,<br />
one member reported more than one year of industrial experience, while<br />
the other pair member reported no experience at all. The analysis of the results<br />
achieved by these subjects in relation to their experience is discussed<br />
in Section 7.1.<br />
A further question concerned the subject’s experience with the tool that<br />
implements the manual method, that is Telelogic Doors. The analysis indicated<br />
that 91% of subjects reported no experience with Telelogic Doors and<br />
that they had never heard about the tool. Although four persons have<br />
heard about the tool, they have never used it. We can conclude that the<br />
subjects are homogenous in this matter and that we can exclude this threat<br />
from aspects influencing the results.<br />
4.3 Treatments<br />
The treatments of the experiment are the methods used in supporting the<br />
requirements consolidation task. The assisted method is implemented in<br />
the ReqSimile tool using linguistic engineering to calculate the degree of<br />
similarity between requirements by lexical similarity as a way of approximating<br />
semantic similarity (Natt och Dag et al, 2004) (for more details see<br />
Section 3).<br />
The other treatment is the manual method which comprises searching<br />
and filtering functionalities provided by the Telelogic Doors tool (IBM,<br />
2010a). The goal of the experiment is not to compare the two tools in general,<br />
but the functionality that they provide to support the requirements<br />
consolidation task. The objects used in the original and the replicated<br />
experiment are listed in Table 2.3. Compared to the original experiment,<br />
135
PAPER II: REPLICATION OF AN EXPERIMENT ON LINGUISTIC TOOL<br />
SUPPORT FOR CONSOLIDATION OF REQUIREMENTS FROM MULTIPLE<br />
SOURCES<br />
Table 2.3: The treatments and tools used in the original and the replicated<br />
experiments.<br />
Original experiment Replicated experiment<br />
Treatment Assisted Manual Assisted Manual<br />
method method method method<br />
Tool ReqSimile ReqSimileM ReqSimile Telelogic<br />
Doors<br />
one of the tools was kept unchanged while the second one was changed.<br />
The change comprises substituting ReqSimileM from the original design<br />
(Natt och Dag et al, 2006) by Telelogic Doors (IBM, 2010a) for the manual<br />
method. More information regarding tools used in the replication can be<br />
found in Section 4.5.<br />
4.4 Requirements<br />
Two requirements sets were reused from the original experiment. The requirements<br />
specifications were produced as a part of a course "Software<br />
Development of Large Systems" (Lund University, 2011b). The course comprises<br />
a full development project, including: requirements specification,<br />
test specification, high-level design, implementation, test, informal and<br />
formal reviews and acceptance testing. At the end of the course, the students<br />
deliver a first release of the controller software for a commercial<br />
telecommunication switch board. Two requirements specifications were<br />
randomly selected from the course given in years 2002 and 2003. The requirements<br />
have been specified in use case style or features style (Lauesen,<br />
2002), and all are written using natural language. Two requirements<br />
sets containing 30 and 160 requirements respectively, were imported to ReqSimlieA<br />
and Telelogic Doors. An example of requirements from the specification<br />
comprising 30 requirements is depicted in Table 2.4. However, the<br />
requirements were neither written by a native English language writer, nor<br />
given to a native English language speaking, experienced requirements analyst<br />
for editing and rephrasing.<br />
4.5 Tools<br />
In this experiment, one tool remained unchanged from the original experiment<br />
while the other tool was changed. The tool that implements the<br />
assisted method, that is ReqSimile (Natt och Dag, 2006b), was kept unchanged.<br />
The user interface of ReqSimile is presented in Fig. 2.2. The<br />
left side of the top pane of the window presents a list of requirements. The<br />
136
Table 2.4: Example requirements from the specification comprising 139 requirements.<br />
Key Id Type Selection Description<br />
Regular call-busy Actors: A:Calling subscriber, B:Called<br />
subscriber, S:System Prerequisites: Both A and B are connected<br />
to the system and are not unhooked. Step 13.1. A<br />
unhooks. Step 13.2. S starts giving dial tone to A Step 13.3.<br />
A dials the first digit in B_s subscriber number Step 13.4. S<br />
stops giving dial tone to A. Step 13.5. A dials the remaining<br />
three digits in B_s subscriber number Step 13.8. S starts giving<br />
busy tone to A Step 13.9. A hangs up Step 13.10. S stops<br />
3 Scenario13 Functional Service:<br />
Regular call<br />
137<br />
4. EXPERIMENTAL DESIGN<br />
giving busy tone to A<br />
Activation of call forwarding to a subscriber that has activated<br />
call forwarding shall be ignored by the system. This<br />
is regarded as an erroneous activation, and an error tone is<br />
given to the subscriber. (Motivation: Together with SR41607,<br />
avoids call forwarding in closed loops)<br />
The service call forwarding shall be deactivated if a customer<br />
removes either the subscriber from which calls are forwarded<br />
or the subscriber to which calls are forwarded.<br />
80 SRS41606 Functional Service:<br />
Call forwarding<br />
111 SRS41804 Functional Service<br />
interaction
PAPER II: REPLICATION OF AN EXPERIMENT ON LINGUISTIC TOOL<br />
SUPPORT FOR CONSOLIDATION OF REQUIREMENTS FROM MULTIPLE<br />
SOURCES<br />
data has already been pre-processed by the tool so the user can start analyzing<br />
requirements for similarities. Selecting a requirement (1) makes<br />
the requirement’s details display on the right (2) and a list of similar requirements<br />
in the other set appear in the bottom pane (7), sorted on the<br />
similarity value (3). Requirements that have already been linked in the set<br />
of analyzed requirements are highlighted using another (gray) color (6).<br />
Requirements that have been linked to the currently selected requirements<br />
(1) are highlighted using another (green) color (5). Unlinked requirements<br />
are not highlighted (8). Links can be made between the selected requirement<br />
(2) and the requirement with the associated link button (4). Once a<br />
requirement has been selected (1), the user has to perform two operations,<br />
click on the requirement that is supposed to be linked and click the button<br />
“link” to make the link. The second tool, described by Natt och Dag et al<br />
Figure 2.2: The user interface of the ReqSmiliA tool used in<br />
the experiment. The full-size color figure can be found at<br />
http://fileadmin.cs.lth.se/serg/ExperimentPackages/ReplicationReqSimile/<br />
ReqSimiliA.bmp<br />
(2006) as ReqSimileM was changed in this experiment to Telelogic Doors<br />
138
4. EXPERIMENTAL DESIGN<br />
Figure 2.3: The user interface of Telelogic Doors used in<br />
the experiment. The full-size color figure can be found at<br />
http://fileadmin.cs.lth.se/serg/ExperimentPackages/ReplicationReqSimile/<br />
DOORS.png<br />
139
PAPER II: REPLICATION OF AN EXPERIMENT ON LINGUISTIC TOOL<br />
SUPPORT FOR CONSOLIDATION OF REQUIREMENTS FROM MULTIPLE<br />
SOURCES<br />
(IBM, 2010a). The user interface of Telelogic Doors is shown in Fig. 2.3.<br />
The two sets of requirements were opened in Doors from separated modules<br />
and placed next to each other on the screen. Fig. 2.3 illustrates one of<br />
the requirements sets opened in a module. This orientation is similar to ReqSimile’s<br />
view and enables easy visual comparing between the two sets of<br />
requirements. The finding and filtering capabilities were used in Telelogic<br />
Doors to perform the consolidation task. These capabilities can be accessed<br />
respectively from the Edit menu and the Find command or the Tools menu<br />
and the Filters command. The subjects were given detailed instructions<br />
with screen-shots of each step and each dialog window that was related to<br />
finding and filtering capabilities. After finding similar requirements, links<br />
were established using the tool’s built in traceability solution. During the<br />
planning activities, it was discovered that making links in Telelogic Doors<br />
is not as straightforward as in ReqSimile, where only one mouse click is<br />
required. In this case, the user has to perform two operations in order<br />
to search for or filter out desired requirements. To make a link, the user<br />
must perform two operations: initiate the link on the source side and terminate<br />
the link on the destination side. 4 The subjects received no training<br />
in using the tools other than the instruction given at the beginning of the<br />
experiment and some practice time, to get familiar with the tool.<br />
4.6 Correct Consolidation<br />
To enable measurement of the subjects’ accuracy of linking requirements<br />
that are semantically similar, the original key for assigning correct links<br />
has been reused. This original key was created by the first author of the<br />
original experiment article (Natt och Dag et al, 2006), having many years<br />
of experience from this course in various roles. It is therefore justifiable to<br />
consider this key as one provided by an expert in the domain. The key was<br />
created a priori to any analysis of the subjects’ assigned links in order to<br />
reduce any related validity threats. More information regarding the correct<br />
consolidation key, together with the distribution of the position at which<br />
the correctly similar requirements are placed by the tool in the ranked lists,<br />
is available in the original experiment article (Natt och Dag et al, 2006).<br />
4.7 Instrumentation<br />
In this experiment, most of the original experiment’s guidelines were kept<br />
unchanged. In particular, the instructions for how to use the assisted method<br />
(ReqSimile tool) was reused. A new set of instructions describing how to<br />
use the manual method (Telelogic Doors) to find similar requirements and<br />
assign links between them, was developed and evaluated by an independent<br />
researcher. Since Telelogic Doors has a more complex user interface,<br />
4 The instructions for linking requirements in Telelogic Doors is available at<br />
http://fileadmin.cs.lth.se/serg/ExperimentPackages/ReplicationReqSimile/HelpSheetDoors.pdf.<br />
140
4. EXPERIMENTAL DESIGN<br />
the instructions were significantly longer than those for ReqSimile, consisting<br />
of eight pages of text and figures. Due to its length (8 pages), it was<br />
decided that subjects using Telelogic Doors should get more time to read<br />
through the instructions for that application. The pre- and post-test questionnaires<br />
were updated according to the changes made from the original<br />
study. In the pre-test questionnaire, the authors added one question about<br />
the experience using Telelogic Doors to be able to measure the impact of<br />
this phenomenon on the results. Furthermore, two questions related to<br />
English skills that were separated in the original design were merged into<br />
one. The rationale for this decision was that the subjects of the experiment<br />
will only read requirements so their skills in writing are not relevant.<br />
A pre-test questionnaire including five questions about the subjects’ industrial<br />
experience in software development, experience with analyzing<br />
and revising requirements and possible knowledge and skills in Telelogic<br />
Doors was prepared. Before collecting the data, an additional experienced<br />
researcher evaluated the questionnaire to check the understandability of<br />
questions and their relevance for this study.<br />
Due to a limited number of available computers in the laboratory room,<br />
the subjects were asked to work in pairs for the experiment. This deviates<br />
from the original experiment design, where subjects were performing the<br />
task individually and demands additional analysis to ensure that groups<br />
were formed equally. Some changes were also made to the post-test questionnaire.<br />
The original questions regarding (1) the time spent on the consolidation<br />
task, (2) the number of finished requirements, (3) the number<br />
of found duplicates, similar and new requirements and (4) the usefulness<br />
of used methods were kept unchanged. Moreover, two questions about<br />
the scalability of used methods and possible improvements were kept unchanged<br />
comparing to the original experiment design. 5 .<br />
4.8 Data Collection Procedure<br />
The data collection procedure was kept as similar as possible to the original<br />
experiment design. The subjects were given the introduction and problem<br />
description by the moderator. After the introduction, subjects were given<br />
some time to read through the assigned tool’s instruction and make themselves<br />
familiar with its user interface. At this stage, the groups assigned<br />
to work with Telelogic Doors were given some extra time (approximately<br />
5-10 minutes) since the tool interface was more complex and the instruction<br />
was longer. One of the important changes here is that the subjects answered<br />
pre-study test right before starting the task. The results of the prestudy<br />
survey were analyzed afterward and are presented in Section 4.2.<br />
Next, the subjects were asked to work for 45 minutes on the consolidation<br />
5 Both questionnaires are available at <br />
and<br />
http://fileadmin.cs.lth.se/serg/ExperimentPackages/ReplicationReqSimile/PostTest.pdf<br />
141
PAPER II: REPLICATION OF AN EXPERIMENT ON LINGUISTIC TOOL<br />
SUPPORT FOR CONSOLIDATION OF REQUIREMENTS FROM MULTIPLE<br />
SOURCES<br />
task. The results from the actual experiment were collected by analyzing<br />
the information recorded in the tools about the number of links made and<br />
requirements analyzed by the subjects. The experimental results were also<br />
checked against the results of the post-questionnaire to ensure consistency.<br />
The post-questionnaire was asked after performing the task.<br />
4.9 Validity Evaluation<br />
As for every experiment, questions about the validity of the results must be<br />
addressed. Threats to validity are presented and discussed using the classification<br />
of threats to conclusion, internal, construct and external validity<br />
as proposed by Wohlin et al (2000).<br />
Conclusion validity. In order to not have too low power of the statistical<br />
tests, parametric tests (t-test) were used after having investigated the<br />
normality of the data.<br />
Subjects were selected from the same education program to limit their<br />
heterogeneity. Moreover, the questionnaire about the experience of subjects<br />
from industry, experience from the course where requirements originate<br />
from and experience in reviewing requirements was used to assess<br />
the heterogeneity of the subjects in these aspects. However, the threat related<br />
to the fact that subjects were asked to work in pairs may impact the<br />
conclusion validity. It affects in particular the random heterogeneity of<br />
subjects, since created pairs may manifest differences in industrial experience<br />
or experience from the previous courses. We discuss this threat in<br />
the analysis of the pre-study questionnaire results in Section 4.2 and the<br />
results achieved by the subject in relation to their experience in Section 7.1.<br />
The way how the subjects took seats in the laboratory room and thus the<br />
way how they were assigned to the methods can also be questioned here.<br />
As pointed out by Wilkinson et al (1999), random assignment is sometimes<br />
not feasible in terms of the control or measure of the confounding factors<br />
and other source of bias. Elements outside the experimental setting that<br />
may disturb the results were minimized. Students were not interrupted<br />
during the experiment sessions and no significant noise was present. In<br />
order to minimize random irrelevance in experimental setting, the experiment<br />
moderators ensured that any discussions in pairs of subjects should<br />
be made as quietly as possible.<br />
Although all subjects have taken the same education program for 2.5<br />
years, the individual differences in industrial experience, experience in the<br />
course from which the requirements originate, and knowledge of English<br />
may affect the results. The searching for a specific result threat was addressed<br />
by not notifying the subjects which method is supposed to perform<br />
better than the other. The threat to the reliability of measurements is<br />
addressed by reusing the original measurements for the replication case.<br />
Moreover, all subjects received the same instruction for using the treatments<br />
which helps to standardize the application of treatments to subjects.<br />
142
4. EXPERIMENTAL DESIGN<br />
Finally, the error rate of the significance level and the use of Bonferroni<br />
correction (Arcuri and Briand, 2011) are among the threats to conclusion<br />
validity. The possibility of using the Bonferroni correction to adjust the<br />
level of significance is discussed in Section 7.<br />
Internal validity. In this case, threats related to the history, maturation<br />
etc. have to be mentioned. The history threat to internal validity is minimized<br />
by applying one treatment to one object. Both days when the experiment<br />
sessions were held where normal working days not followed by any<br />
holidays (the first session took place on Tuesday and the second session<br />
on Friday). The maturation threat was minimized by dedicating only 45<br />
minutes for the consolidation task (we assume that the subjects won’t get<br />
bored by the task in 45 minutes). The instrumentation threat is addressed<br />
in two ways: (1) by reusing the original experimentation instrumentation,<br />
if no changes were needed, and (2) reviewing the instrumentation documentation<br />
by an independent researcher. However, since subjects were not<br />
divided into groups according to the results of the pre-study questionnaire<br />
(the questionnaire has been filled in right before the experiment’s execution),<br />
the statistical regression threat can not be as easily addressed as in<br />
the original experiment. The analysis related to this threat is presented in<br />
Sections 4.2 and 7.<br />
The incentives of participants are, next to their experience, an important<br />
factor that may influence the results of this study. According to the<br />
classification presented by Höst et al (2005), both the original experiment<br />
and replication can be classified as I2 E1 where I2 means that the project<br />
is artificial (in terms of incentive). The subjects typically have no prior<br />
knowledge of the artifacts that they are working with and the requirements<br />
sets used in the experiment were developed by the researcher or<br />
borrowed from an industrial organization. The E1 level on the experience<br />
scale means that the subjects are undergraduate students with less than<br />
three months recent industrial experience, where recent means less than<br />
two years ago. Although the identical comparison of two I2E1 cases is not<br />
present in Höst et al (2005), the example of two experiments classified as<br />
E1 I1 (where I1 means an isolated artifact) shows no significant difference<br />
in their outcomes. Moreover, three other pairs of experiments, classified in<br />
the same category, also shows the same outcomes (Höst et al, 2005).<br />
The selection threat, as in the original design, may influence the results<br />
since the subjects are not volunteers and the laboratory session where the<br />
experiment was performed is a mandatory part of the course. The social<br />
threat to internal validity is addressed since the subject had nothing to gain<br />
from the actual outcome of the experiment; the grading in the course is not<br />
based on results of, or preparation for, the experiment. Unlike the original<br />
experiment design, the experiment groups were not separated, however<br />
no information about which method is expected to perform better was revealed<br />
to the subjects. The possibility of looking at other subjects’ results<br />
during the experiment execution was minimized by placing the subject in<br />
143
PAPER II: REPLICATION OF AN EXPERIMENT ON LINGUISTIC TOOL<br />
SUPPORT FOR CONSOLIDATION OF REQUIREMENTS FROM MULTIPLE<br />
SOURCES<br />
a way that separated each of the two treatments by the other treatment.<br />
Compensatory rivalry may be a problem in this case, since the group that<br />
will use the open-source solution (ReqSimile) or the commercial solution<br />
(Telelogic DOORS) may try to perform better to make their favor type of<br />
software win. This threat was addressed by explicitly stating in the beginning<br />
of the experiment that there is no favorite or assumingly better<br />
method. The potentially more problematic threat is that the subjects had<br />
to analyze and link requirements written in English when they had themselves<br />
used only Swedish to specify their own requirements in the domain.<br />
Further, the participants ability to objectively evaluate their skill in English<br />
language is a subject to question. In further work it would be interesting<br />
to execute the experiment on a set of native English subjects, also handling<br />
the original set of requirement to a native speaker experienced requirements<br />
analyst who will edit and rephrase them.<br />
Construct validity. In this case, the theory is that the assisted method<br />
implemented in the ReqSimile tool provides better assistance for a particular<br />
task than the method implemented in Telelogic Doors. We base this<br />
theory on the fact that the assisted method provides a list of candidate requirements<br />
augmented with the degree of lexical similarity. As a result,<br />
the analyst can only look at a subset of possible candidate requirements<br />
(the most similar requirements, up to a certain threshold) thus saving time<br />
required to do the task. Moreover, we believe that the list of possible candidates<br />
helps the analyst to miss fewer requirements links and increase the<br />
precision of making the links. In contrast to the original experiment design,<br />
none of the authors have developed any of the tools. However, the originally<br />
mentioned threat related to the awareness of subjects about their own<br />
errors is still present in this experiment. This threat may have influenced<br />
the number of correct and faulty links. Also, as pointed out by Natt och<br />
Dag et al (2006), when subjects know that the time is measured, it is possible<br />
that they become more aware of the time spent and the performance<br />
results may be affected.<br />
The level of experience of the subjects, especially in reviewing requirements,<br />
may influence the outcome of the experiment. This threat to construct<br />
validity is addressed by the analysis and discussion of the results<br />
achieved by the subjects having experience in reviewing requirements in<br />
Section 7. Because the same 30 and 160 requirements were used by all<br />
subjects in both treatments and experimental sessions, this may result in<br />
a situation where the cause construct is under-represented. This threat is<br />
discussed in Section 7 where alternative designs for this experiment are<br />
outlined. Moreover, keeping the requirements sets unchanged opens up<br />
the possibility of discussing other factors as well as differences between<br />
the original and replicated experiment to assess their influence on the results.<br />
The interaction of different treatments threat to construct validity<br />
is minimized by involving the subjects in only one study. The differences<br />
in the user interfaces and their usability may have influenced the results<br />
144
5. EXPERIMENT EXECUTION<br />
achieved by the subject. In particular, this threat could influence the numbers<br />
of requirements analyzed and links assigned by the subjects. This<br />
threat has been addressed in two ways: (1) by providing detailed instructions<br />
on how to make links in the tools and by giving the subjects as much<br />
time as they requested to get familiar and comfortable with the user interface,<br />
(2) by making the user interfaces look as similar as possible by placing<br />
the two requirements sets next to each other in Telelogic DOORS. Finally<br />
the evaluation apprehension threat is minimized by: (1) clearly stating that<br />
the performance of the subject has no effect on their grade in the course and<br />
(2) by using requirements that were not written by the subjects.<br />
External validity. The largest threat in this category is the number of<br />
analyzed requirements. Since only a relatively small number of requirements<br />
was analyzed during the experiment, it is hard to generalize the<br />
results to large sets of requirements, which often is the case in industry<br />
projects (Berenbach et al, 2009; Leuser, 2009). Using students as subjects is<br />
another large threat. Even though the subjects were on their last year of<br />
studies, they can be considered as rather similar to an ordinary employee.<br />
However, as mentioned by Kitchenham et al (2002) students are the next<br />
generation of software professionals and they are relatively close to the<br />
population of interest. Since they participated in the requirements engineering<br />
course, they are familiar with the application domain. Finally, the<br />
diversity of experience of subject from industry and from analyzing and<br />
reviewing requirements, although hindering the conclusion validity, has a<br />
positive influence on the heterogeneity of the population sample used in<br />
this experiment.<br />
The time spent on the task is also among potential threats to external<br />
validity. To analyze 30 requirements in 45 minutes subject should spend<br />
on average 90 seconds on each requirement. It remains an open question<br />
whether or not this is enough time for the subjects to perform both lexical<br />
and semantic analysis. However, this threat was partly addressed by<br />
stating at the beginning of the experiment that the subjects don’t have to<br />
analyze all 30 requirements in 45 minutes (the subjects had to record how<br />
many requirements were analyzed and how they browsed the list of candidate<br />
requirements).<br />
5 Experiment execution<br />
The replication was run in two two-hour laboratory sessions in January<br />
2008. The first 15 minutes of each session were dedicated to the presentation<br />
of the problem. During this presentation, the importance of the industrial<br />
applicability of the results and the goal of the experiment were<br />
stressed. All students were given the same presentation. The general<br />
overview and differences between the included methods and tools were<br />
presented without favoring one method over the other. To avoid bias-<br />
145
PAPER II: REPLICATION OF AN EXPERIMENT ON LINGUISTIC TOOL<br />
SUPPORT FOR CONSOLIDATION OF REQUIREMENTS FROM MULTIPLE<br />
SOURCES<br />
ing, no hypotheses were revealed and it was made very clear that it is not<br />
known which approach will perform better. After the presentation of the<br />
problem, students were given time to get familiar with the instructions<br />
of how to use the tools and report that they are ready to start working<br />
on the task. The starting time was recorded in the questionnaire as students<br />
required varying times to get familiar with the instructions. After<br />
the 45 minutes time assigned for the task, subjects were asked to stop,<br />
record the number of analyzed requirements, the time, and to fill in the<br />
post-questionnaire. The remaining time was used for exchanging experiences<br />
and discussion the about tools used. This approach is similar to the<br />
original experiment execution described by Natt och Dag (2006). The difference<br />
from the original experiment is that subjects used both methods in<br />
both experimental sessions. Half of the subject pairs in each session (there<br />
were two sessions in total) were assigned to the assisted method while the<br />
other half to the manual method. The subjects were to use only one method<br />
during the experiment and participate in only one of the two sessions. The<br />
difference from the original experiment here is that the methods were not<br />
separated in different sessions. That is, in each session the pairs using the<br />
assisted and the manual methods were mixed.<br />
After the presentation, the subjects were assigned to the methods. Because<br />
only one laboratory room could be used for each session and this<br />
room did not have enough computers for all subjects (which was not known<br />
while planning the experiment), the subjects were asked to work in pairs.<br />
Each pair was randomly assigned to the method later used for the consolidation<br />
task. There were no name tags or other indicators of the method<br />
on the laboratory desks when subjects took their seats in the laboratory<br />
room. Therefore, subjects could not take a preferable method seat or be<br />
attracted by the name on the desk. Subjects were asked to discuss the solutions<br />
only within their own pair. Since the nearest group was not using<br />
the same method, the possibility of comparing or discussing results was<br />
avoided. The subjects were allowed to ask questions of the moderator, if<br />
they experiences any problems. Only answers related to the difficulties of<br />
using tools were given in a straightforward manner. No answers related to<br />
assessing similarity between requirements were given. The material used<br />
in the experiments comprised:<br />
• The ReqSimile application with automated support of similarity calculations<br />
and a database containing: (1) 30 randomly selected requirements<br />
from the first set, (2) all 160 requirements from the second<br />
set. These requirements should be browsed through by the subjects.<br />
• The Telelogic Doors application with the same two sets of requirements<br />
imported into two separated modules. The application’s graphical<br />
user interface was set as presented in Fig. 2.3 in order to make it<br />
as similar to the ReqSimile user interface as possible.<br />
146
6. EXPERIMENT RESULTS ANALYSIS<br />
• The documentation comprising: (1) An industrial scenario describing<br />
the actual challenge (one page). (2) A general task description<br />
(one page). (3) Detailed tasks with space for noting down start and<br />
end times (one page). (4) A short FAQ with general questions and answers<br />
about the requirements (one page). (5) A screen shot of the tool<br />
user interface with the description of the different interface elements<br />
in the ReqSimile case (one page) or a 8 pages instruction with screen<br />
shots from the steps needed to analyze requirements and make links<br />
using Telelogic Doors.<br />
• The instruction to the students was as follows: (1) Review as many of<br />
the requirements as possible from the list of 30 requirements shown<br />
in the tool. For each reviewed requirement, decide if there are any<br />
requirements in the other set that can be considered identical or very<br />
similar (or only a little different) with respect to intention. (2) Assign<br />
links between requirements that you believe are identical or very<br />
similar. (3) Note down the start and finish time. (4) When finished,<br />
notify the moderator.<br />
Given the experience from the original study, it was decided to dedicate<br />
45 minutes to the consolidation task. The subjects were notified about<br />
the time left for the task both 15 and five minutes before the end of the<br />
lab session. After approximately 45 minutes, subjects were asked to stop<br />
working on the task unless they, for any reason, spent less than 40 minutes<br />
on the task. All students were asked to fill in a the post-test questionnaire<br />
described in Section 4.7. Apart from noting the finishing time and the number<br />
of analyzed requirements, subjects were also asked to assess the usefulness<br />
of used methods in terms of the given task and, if applicable, propose<br />
improvements. Right after executing the experiment, it was known which<br />
data points had to be removed due to tool problems or subjects’ attitude.<br />
Three groups had problems with the tools used which resulted in loss of<br />
data and one group performed unacceptably analyzing only three requirements<br />
during 45 minutes and making only two links. These four groups<br />
were treated as outliers and removed from the analysis.<br />
6 Experiment results analysis<br />
In this section, methods of analyzing the results are described. In order to<br />
keep the procedures as similar to the original experiment design as similar<br />
as possible, the same statistical methods were used to test if any of the<br />
null hypotheses can be rejected. Additional analysis was also performed in<br />
order to assess if working in pairs influences the performance of subjects.<br />
Hypotheses were analyzed separately, while any relations and accumulated<br />
results are presented in Section 7. The standard t-test has been used,<br />
as the data was confirmed to have a normal distribution. Just as in the orig-<br />
147
PAPER II: REPLICATION OF AN EXPERIMENT ON LINGUISTIC TOOL<br />
SUPPORT FOR CONSOLIDATION OF REQUIREMENTS FROM MULTIPLE<br />
SOURCES<br />
inal experiment from which requirements were reused, in this experiment<br />
one analyzed requirement can be linked to several others. The results from<br />
measuring dependent variables can be found in Table 2.5. Subjects that<br />
used ReqSimile are marked with the letter A (as an abbreviation of the assisted<br />
method), and subjects that used Telelogic Doors with the letter M<br />
(as an abbreviation of the manual method). The dependent variables are<br />
described in Section 4.1. Table 2.5 presents the results from both experimental<br />
sessions (Tuesday and Friday sessions).<br />
Rows M10, M11, A7 and A8 in Table 2.5 represent data points that were<br />
removed from the analysis. The pair M10 was removed from the results<br />
due to the inconsistency between the results stated in the post-task questionnaire<br />
and the results saved in the tool. The pair M11 was removed due<br />
to loss of data. Similar problems caused the authors to remove group A8<br />
from the analysis since the links were not saved in the tool. Finally, group<br />
A7 was removed due to their lack of their commitment to the task.<br />
The time spent on the task is presented in column 2 of Table 2.5. The<br />
results for the number of finished requirements, derived from the post<br />
questionnaire and confirmed with the results recorded in the tool used, are<br />
listed in column 3. Next, other dependent variables values are presented<br />
in the remaining columns. The values were calculated based on the results<br />
saved in the tools and from the answers to the questionnaires questions.<br />
Figure 2.4: The results for the number of analyzed requirements.<br />
The results for the number of analyzed requirements per minute are<br />
depicted as a box plot in Fig. 2.4. It can be seen that there is no statistically<br />
significant difference in the number of analyzed requirements be-<br />
148
6. EXPERIMENT RESULTS ANALYSIS<br />
Table 2.5: The results from measuring dependent variables. The rows highlighted<br />
bold text indicate data points that were removed from the analysis<br />
(outliers).<br />
Pair of<br />
subjects<br />
T N Links<br />
(min) assigned<br />
Correctly<br />
linked<br />
(N cl)<br />
Correctly<br />
not<br />
linked<br />
(Ncu)<br />
IncorrectlyMissed<br />
linked (Niu) (Nil) M1 38 12 6 1 4 5 6<br />
M2 41 13 10 5 4 5 3<br />
M3 46 30 15 11 10 4 9<br />
M4 44 13 10 5 4 5 3<br />
M5 45 18 16 8 11 8 12<br />
M6 48 20 5 2 6 3 9<br />
M7 45 22 21 6 6 15 8<br />
M8 44 19 9 4 7 5 8<br />
M9 46 19 15 7 5 8 5<br />
M10 45 16 9 4 4 5 5<br />
M11 45 18 ? ? ? ? ?<br />
A1 41 14 13 5 5 8 5<br />
A2 45 20 25 9 4 16 3<br />
A3 49 18 19 5 3 14 6<br />
A4 45 13 25 5 0 20 3<br />
A5 50 20 15 8 4 7 4<br />
A6 50 21 19 6 3 13 6<br />
A7 29 3 11 1 0 12 0<br />
A8 44 30 ? ? ? ? ?<br />
A9 34 30 23 13 7 10 7<br />
A10 41 30 16 12 8 4 8<br />
A11 50 23 19 7 7 12 7<br />
A12 35 30 20 13 8 7 7<br />
149
PAPER II: REPLICATION OF AN EXPERIMENT ON LINGUISTIC TOOL<br />
SUPPORT FOR CONSOLIDATION OF REQUIREMENTS FROM MULTIPLE<br />
SOURCES<br />
tween the manual and the assisted method. The group that used the manual<br />
method analyzed on average 0.41 requirements per minute while the<br />
group that used the assisted method analyzed on average 0.51 requirements<br />
per minute. In this case, we observe that the medians are most likely equal,<br />
while the lower and upper quartiles values differ significantly. The t-test<br />
gave a p-value of 0.20 which gives no basis to reject the null hypothesis H 1 0 .<br />
The notches of the box plot overlap. To summarize, the assisted method<br />
turned out not to be more efficient in consolidating two requirements sets<br />
than the manual method (research question Q1a).<br />
Figure 2.5: The results for the share of correctly assigned links.<br />
The results for the number of correct links assigned by subjects are<br />
depicted in Fig. 2.5. The group that used the assisted method correctly<br />
assigned on average 58% of the links that the expert assigned, while the<br />
group that used the manual method correctly assigned on average 43% of<br />
the correct links. The medians differ significantly from 61% for the assisted<br />
method to around 42% for the manual method. The t-test gave in this case<br />
the p-value 0.013 which makes it possible to reject hypothesis H2 0 . Thus, we<br />
can state a positive answer to research question Q1b, the assisted method is<br />
superior to the manual method when consolidating two requirements sets<br />
when measured by which method delivers more correct links.<br />
To address hypothesis H3 0 , requirements analyzed by each pair of subjects<br />
were reviewed, and the number of links that should have been assigned<br />
but were not, was calculated. In the case when subjects did not<br />
analyze all requirements, only requirements that had been analyzed were<br />
taken into consideration. Each pair of subjects stated in their post-test<br />
150
6. EXPERIMENT RESULTS ANALYSIS<br />
Figure 2.6: The results for the percentage of missed links.<br />
questionnaire how many requirements were analyzed and how they had<br />
worked through the list of requirements. This information was used to<br />
correctly count the number of missed links. The results are depicted in Fig.<br />
2.5. The group that used the assisted method missed on average 41% of<br />
the links, while the group that used the manual method missed on average<br />
57% of the links. The medians in this case are 38% for the assisted method<br />
and 57% for the manual method. The t-test gives a p-value of 0.0207 which<br />
means that we can reject H3 0 and confirm the original experiment’s conclusions<br />
by making the conjecture that the assisted method helps the subjects<br />
to miss significantly fewer requirements links than the manual method (research<br />
question Q1c).<br />
For the number of incorrectly assigned links (Nil) (related to research<br />
question Q1), the t-test resulted in a p-value of 0.14, so the hypothesis H4 0<br />
cannot be rejected. Furthermore, for the hypothesis H5 0 (related to research<br />
question Q1) the t-test gave the p-value 0.62 and for the hypothesis H6 0 (related<br />
to research question Q1) the t-test resulted in the p-value 0.72. To<br />
summarize, research question Q1 can be answered as “yes”, for some aspects.<br />
Our results confirm the results from the original experiment for correctness<br />
and number of missed links but we can’t confirm the result for the<br />
efficiency. As in the original experiment the hypotheses H4 0 , H5 0 , H6 0 could<br />
not be rejected here. Compared to the original experiment, this experiment<br />
confirms no statistical difference in the number of incorrect links, precision<br />
and accuracy between the two analyzed treatments. The question regarding<br />
different results for H1 0 is discussed in Section 7. The summary of the<br />
151
PAPER II: REPLICATION OF AN EXPERIMENT ON LINGUISTIC TOOL<br />
SUPPORT FOR CONSOLIDATION OF REQUIREMENTS FROM MULTIPLE<br />
SOURCES<br />
Table 2.6: The results of the t-tests for original and replicated experiments.<br />
Hypotheses The p-values in the<br />
original study (Natt<br />
och Dag et al, 2006)<br />
H1 0<br />
H2 0<br />
H3 0<br />
H4 0<br />
H5 0<br />
H6 0<br />
Efficiency 0.0034 0.20<br />
Correct links 0.0047 0.013<br />
Missed links 0.0047 0.02<br />
Incorrect links 0.39 0.14<br />
Precision 0.39 0.62<br />
Accuracy 0.15 0.72<br />
The p-values in this<br />
replication<br />
original and the replicated experiments is depicted in Table 2.6.<br />
7 Experiment results interpretation and discussion<br />
This section presents an interpretation of the results presented in Section 6.<br />
Since this experiment was conducted on a set of students, it is important to<br />
emphasize here that the results from this study are interpreted in the light<br />
of the population where the experiment was held (Kitchenham et al, 2002).<br />
The section discusses the results of this experiment in isolation as well as<br />
in relation to the results of the original experiment.<br />
7.1 Interpretation of this experiment<br />
The results achieved in this replicated experiment allow for the rejection<br />
of two out of six stated null hypotheses (see Table 2.6). As already mentioned,<br />
four data points were removed from the analysis for various reasons,<br />
as described in Section 6. The results achieved by group A7 show that<br />
the subjects were not motivated to do the task or misunderstood the task<br />
(they analyze only 3 requirements in 29 minutes). It is surprising since both<br />
subjects in this pair had one or more years of industrial experience (pairs<br />
with similar experience (A3 and M4) performed significantly better on this<br />
task), but no experience in reviewing requirements. It is an open question<br />
how they could influence the results if properly motivated. Similarly, due<br />
to unexpected tool issues (the results were not saved in the tool) we can<br />
only assume that the results achieved by groups A8 and M11 could positively<br />
influence the results for both assisted and manual method (group A8<br />
achieved efficiency of 0.68 requirement per minute, group M11 0.4 require-<br />
152
7. EXPERIMENT RESULTS INTERPRETATION AND DISCUSSION<br />
ment per minute and group M10 0.35 requirements per minute). Adding<br />
these three incomplete data points (A8, M10 and M11) to the analysis of<br />
the performance will not change the result of the hypothesis H1 0 testing<br />
(although it can minimize the p-value to 0.0890).<br />
As for the H 1 0<br />
(performance) hypothesis (research question Q1a), the<br />
lack of a statistically significant difference can be interpreted in the following<br />
way: we have not found this property (namely lower efficiency<br />
of the manual method comparing to the assisted method) on a different<br />
requirements management tool, namely Telelogic DOORS. The lack of statistical<br />
significance can be explained by a rather large variation in the assisted<br />
method (the minimum value for the performance is 0.29 requirement<br />
per minute while the maximum value is 0.89 requirement per minute).<br />
Furthermore, albeit the medians are almost identical for both the assisted<br />
and the manual method with respect to the performance, the range of the<br />
third quartile is much larger in the assisted method. This fact can be interpreted<br />
in favor of practical significance (Kitchenham et al, 2002) in the<br />
following way: if we assume that both groups assigned to the methods<br />
are rather homogeneous, we can also assume that in both groups there are<br />
similar numbers of more and less motivated subjects. In the light of the<br />
fact that motivation has been reported to be an important determinant of<br />
productivity and quality of work in many industries (Baddoo et al, 2006),<br />
the practical significance of the results is that the assisted method gives the<br />
possibility to achieve higher values of the performance than the manual<br />
method. As more motivated subjects usually achieve better results with a<br />
given task, we can assume that the top scores for both methods correspond<br />
to the most motivated pairs of subjects. The evidence reported by Badoo et<br />
al(2006), albeit studied on developers rather than requirements engineers,<br />
confirms that the traditional motivators of software developers, e.g. intrinsic<br />
factors, but also opportunity for achievement, technically challenging<br />
work and recognition have a strong influence on the developer’s performance.<br />
Thus, when comparing the top score of both methods, we could<br />
conclude that the assisted method may boost the performance of the motivated<br />
subjects more than less motivated subjects.<br />
The analysis of the results for efficiency versus the experience of the<br />
subjects revealed that the subjects with experience reviewing requirements<br />
(pairs A1, A3 and A11) were not the fastest (the values were lower or<br />
around the median value). We can postulate here that the industrial experience<br />
led these pairs to be more cautious when analyzing requirements.<br />
On the other hand, the top score in this group (A9) was achieved by a<br />
pair of subjects that reported no industrial experience and no experience<br />
from the course from which the requirements originated. Surprisingly, the<br />
two lowest values of performance were achieved by the pairs having either<br />
one year of industrial experience, including experience with reviewing<br />
requirements (pair A3), or experience from the course from which the<br />
requirements originated (pair A4). In the light of these facts, we can not<br />
153
PAPER II: REPLICATION OF AN EXPERIMENT ON LINGUISTIC TOOL<br />
SUPPORT FOR CONSOLIDATION OF REQUIREMENTS FROM MULTIPLE<br />
SOURCES<br />
draw any strong conclusions about the effect of both industrial experience<br />
and experience with reviewing requirements on the performance of subjects.<br />
However, our results show indications of negative impact of experience<br />
on the performance of the subjects. The full analysis of results of<br />
experienced versus inexperienced subjects is presented later in this section<br />
and in Tables 2.7 and 2.8.<br />
The results concerning the number of correct links (research question<br />
Q1b) can be interpreted as follows. The group that used the assisted method<br />
assigned on average 58% of the correct links, while the group that used the<br />
manual method assigned on average 43% of the correct links. The results of<br />
the t-test allows us to reject H2 0 . This fact may be interpreted in the following<br />
way in favor of the assisted method: even if the assisted method is put<br />
next to a rather sophisticated requirements management tool, it can still<br />
provide better support for assessing more correct links between requirements.<br />
The fact that both in the original and the replicated studies the<br />
assisted method provided a better support in linking similar requirements<br />
may lead to the following two interpretations: (1) the method is better in<br />
this matter, and (2) working in pairs has a minimum or equal impact on<br />
the two methods when it comes to the number of correctly linked requirements.<br />
The results for the number of missed requirements links (research question<br />
Q1c) confirm the results of the original experiment. The t-test confirms<br />
that the assisted method can help to miss fewer requirements links than the<br />
manual method. Missing fewer links may be important when large sets of<br />
requirements have to be analyzed, which is a reasonable practical interpretation<br />
of this result. This result also confirms the interpretation that in the<br />
case of the assisted method, showing a list of similar requirements candidates<br />
limits the solution space for the analyst which results in a smaller<br />
number of missed requirements links.<br />
Similarly to the original experiment, the results from the experiment<br />
can also not reject hypotheses H4 0 , H5 0 and H6 0 (research question Q1). The<br />
lack of statistically significant differences in these cases may be interpreted<br />
as the possible existence of additional factors that affect the consolidation<br />
of requirements process which were not controlled in the experiment. For<br />
example, since it is much easier to make a link in ReqSimile than in Telelogic<br />
DOORS this may affect the number of incorrect links, precision and<br />
accuracy. This threat to construct validity is described in Section 4.9 and is<br />
considered as one of the topics for further work.<br />
The fact that subjects worked in pairs may also influence the results.<br />
Even though working in pairs has generally been considered having a<br />
positive impact on the task, for example in pair programming (Begel and<br />
Nachiappan, 2008), the results among researchers are inconsistent (Hulkko<br />
and Abrahamsson, 2005; Parrish et al, 2004). Therefore, assessing the impact<br />
of working in pairs in more decision-oriented software engineering<br />
tasks is even more difficult. Thus, it can be assumed that working in pairs<br />
154
7. EXPERIMENT RESULTS INTERPRETATION AND DISCUSSION<br />
may sometimes influence the performance of these types of tasks positively,<br />
and sometimes negatively. In this case, we assume that subjects<br />
were similarly affected by this phenomenon both in the assisted and in the<br />
manual method.<br />
The influence on the results of fluency in reading and reviewing requirements<br />
in the English language can be interpreted in the following<br />
way. Since subjects reported either “very good knowledge” or “’fluent<br />
knowledge’ in reading and writing English our interpretation of this fact is<br />
that this aspect equally influenced all subjects. Moreover, the subjects were<br />
allowed to ask questions for clarification, including understanding the requirements<br />
during the experiment. However, it remains an open question<br />
what can be the results of the experiment when performed on native English<br />
language speaking subjects.<br />
The analysis of the influence of the industrial experience of the subjects<br />
of the results achieved is depicted in Table 2.7. The data has been analyzed<br />
for all pairs of subjects, as well as for subjects using the same method.<br />
Four out of the total 11 pairs of subjects using the assisted method reported<br />
having some industrial experience. For the manual method, 5 out of 9 pairs<br />
of subjects included in the data analysis reported having some industrial<br />
experience. Subjects were paired in a way that minimizes the difference in<br />
the experience of pair members. Moreover, only in two cases (pairs M5 and<br />
M6) were pairs formed of one experienced and one inexperienced subject<br />
(see section 4.2 for more detail about the subjects).<br />
The analysis of the relationship of industrial experience to the results is<br />
based on the arithmetic average values of the results achieved. Table 2.7<br />
shows that in most cases industrial experience negatively influenced the<br />
results (and tested hypotheses). The cells colored gray in Table 2.7 indicate<br />
cases where industrial experience has a positive effect on the analyzed<br />
aspect. For all hypotheses for subjects using the manual method, the industrial<br />
experience had a negative impact on the results achieved. In the<br />
case of the assisted method, the experienced subjects made fewer incorrect<br />
links and had better precision and accuracy. The results from comparing all<br />
subjects show the same pattern as the results for the assisted method. While<br />
the results are implausible, they may be an indicator that general software<br />
engineering industrial experience may not be useful in the task of analyzing<br />
requirements, at least when the experience is minimal to small. Thus,<br />
we state a hypothesis that experience in reviewing requirements and the<br />
domain knowledge should significantly help in achieving better results by<br />
our subject. Keeping in mind the scarceness of the data, we provide some<br />
examples that we used to support the hypothesis in the text that follows.<br />
Six pairs of subjects reported having experience analyzing and reviewing<br />
requirements outside of the courses taken in their education. In one<br />
case (M8), a person with more than one year of industrial experience was<br />
paired with a person with no experience. Although it may be expected that<br />
an experienced pair member can significantly influence the results of this<br />
155
PAPER II: REPLICATION OF AN EXPERIMENT ON LINGUISTIC TOOL<br />
SUPPORT FOR CONSOLIDATION OF REQUIREMENTS FROM MULTIPLE<br />
SOURCES<br />
Table 2.7: The analysis of the industrial experience of the subjects in relation<br />
to their results. The values in bold text indicate cases where industrial<br />
experience had positive effect on the analyzed aspect.<br />
All data Assisted method Manual method<br />
Exp. Unexp. Exp. Unexp. Exp. Unexp.<br />
Efficiency H1 0 [N/T]<br />
Correct H<br />
0.44 0.48 0.51 0.52 0.40 0.42<br />
2 0 [%]<br />
Missed H<br />
44 55 53 61 39 47<br />
3 0 [%]<br />
Incorrect H<br />
55 44 46 38 60 52<br />
4 0 [%]<br />
Precision H<br />
39 54 40 66 38 33<br />
5 0 [%]<br />
Accuracy H<br />
45 43 50 41 42 46<br />
6 0 [%] 46 43 49 40 44 48<br />
pair, the efficiency of this pair was only 0.02 higher than the median value<br />
of the efficiency for the subjects using the manual method. The number<br />
of correct links is 10% lower, the number of incorrect links is 10% higher<br />
while precision and accuracy are very close to the average values for the<br />
entire group using the manual method. In the case of pair M7, a person<br />
with experience only from courses was paired with a person with less than<br />
a year of industrial experience in analyzing and reviewing requirements.<br />
The results achieved by this pair are higher than the average in terms of efficiency<br />
(7% higher), close to the average for the share of correct links, and<br />
below the average for the remaining attributes (30% more incorrect links<br />
than the average, 16% lower than the average for the precision and 12%<br />
lower than the average for the accuracy). The remaining 3 pairs of subjects<br />
(A1 and M5) were composed of a person with only academic experience<br />
with a person with less than a year of industrial experience. Pair M5 analyzed<br />
0.4 requirement per minute which is close to the average value (0.41),<br />
achieved 40% of correct links (the average value is 43% for this group) and<br />
44% of incorrect links. The precision achieved by pair M5 is 50% which<br />
is 4% higher than the average. When it comes to the accuracy, pair M5<br />
achieved 46% accuracy (the average value was 46%). The results for efficiency<br />
for pairs (A1, A3 and A11) were below or about the average values,<br />
and these data points could have been partly responsible for the fact that<br />
hypothesis H 1 0<br />
could not be rejected. The results for these pairs for the<br />
number of correct links and the share of missed links were also below the<br />
average and the median values. The results for the number of incorrect<br />
links were around the mean value and above the median value. Finally,<br />
the results for the precision and accuracy were below the median values.<br />
To summarize, the influence of experience in analyzing and reviewing requirements<br />
can’t be clearly defined and statistically confirmed, as subjects<br />
report both results above and below the average values.<br />
As the last step of the analysis, we investigate whether prior experience<br />
in the course that originated the requirements in some manner influences<br />
156
7. EXPERIMENT RESULTS INTERPRETATION AND DISCUSSION<br />
the results achieved by the subjects. We can assume that this experience<br />
can somehow be compared to specific domain knowledge. In the course<br />
model, all team members are actively involved in analyzing and reviewing<br />
requirements. Thus, we only distinguish between subjects that took<br />
and did not take the course. For six pairs of subjects, both subjects have experience<br />
from the course, for seven other pairs only one pair member had<br />
experience from the course. Finally for six pairs, both subjects reported no<br />
experience from the course. The pairs where both members had experience<br />
and where both members had no experience were equally distributed<br />
between the methods (three pairs for each method). The assisted method<br />
had four pairs with experience and lack of experience. The analysis is depicted<br />
in Table 2.8. Pairs where both pair members had experience from<br />
the course are abbreviated with the letter “E”, where only one pair member<br />
had experience are abbreviated with “E and U” and where none of<br />
the two pair members had any experienced from the course is abbreviated<br />
with the letter “U”.<br />
Analyzing the differences between the average results for all three subgroups<br />
for both methods we can see that the expected behavior can only<br />
be confirmed for the number of correct links. Pairs with experience in the<br />
course achieved better correctness than inexperienced pairs, independent<br />
of whether one or both members had the experience. Another interesting<br />
observation here is that inexperienced subjects missed on average only 34%<br />
of requirements links, while experienced subjects respectively missed 50%<br />
(both pair members experienced) and 57% (when one of the pair members<br />
had some experience). The lowest average precision and accuracy levels<br />
were recorded for pairs where one pair member had experience from the<br />
course from which the requirements were taken. The analysis of the pairs<br />
working with the same method confirms the analysis of all data points.<br />
For the manual method experienced pairs turned out to be more correct<br />
than the inexperienced pairs. For the assisted method, pairs where both<br />
members where experienced were more correct, but pairs where only one<br />
member had experience where not as correct as the inexperienced pairs.<br />
Finally, the pairs where only one person was experienced performed worse<br />
in all aspects for both methods analyzed than the pairs where both persons<br />
were experienced.<br />
7.2 Interpretation of the results from both experiments<br />
In this section, we provide the analysis and discussion of the results achieved<br />
in both the original and the replicated experiments. We have used standard<br />
t-tests to test if there are any significant differences between the two experiments.<br />
From the results of the t-tests between the same methods depicted<br />
in Table 2.9, we can see no significant difference for any of the cases (research<br />
question Q2). However, some interesting differences between the<br />
two experiments for the efficiency of the subjects using the assisted method<br />
157
PAPER II: REPLICATION OF AN EXPERIMENT ON LINGUISTIC TOOL<br />
SUPPORT FOR CONSOLIDATION OF REQUIREMENTS FROM MULTIPLE<br />
SOURCES<br />
Table 2.8: The analysis of the experience from the course where requirements<br />
originate from. E denoted that both pair members are experienced, E<br />
&Udenoted one experienced and inexperienced person working together<br />
and U denoted that both pair members were inexperienced.<br />
All data Assisted method Manual method<br />
E E&U U E E&U U E E&U U<br />
Efficiency H1 0 [N/T]<br />
Correct H<br />
0.45 0.39 0.57 0.53 0.38 0.69 0.37 0.40 0.46<br />
2 0 [%]<br />
Missed H<br />
56 51 46 68 53 58 46 48 34<br />
3 0 [%]<br />
Incorrect H<br />
50 57 34 56 59 31 44 55 37<br />
4 0 [%]<br />
Precision H<br />
58 54 30 85 58 56 31 50 27<br />
5 0 [%]<br />
Accuracy H<br />
42 39 50 40 37 56 45 42 44<br />
6 0 [%] 43 41 49 39 39 53 47 45 46<br />
can be seen from the box-plot visualization in Fig. 2.7. As can be seen in<br />
Fig. 2.7, the results for the efficiency of the assisted method in this experiment<br />
have a much larger range of values, which may be the reason why the<br />
hypothesis H1 0 could not be rejected (research question Q2a). As described<br />
in Section 7.1 the two lowest values of performance were achieved by the<br />
pairs having either one year of industrial experience, including experience<br />
from reviewing requirements (pair A3), or experience from the course from<br />
which the requirements originate (pair A4).<br />
However, one of the possible explanations for the difference between<br />
the performance in this experiment and in the original experiment differs<br />
may be that more advanced searching and filtering functionalities have<br />
been used in the current manual method. Contrary to the original experiment,<br />
the manual method in this experiment uses advanced searching and<br />
filtering functionalities which may (to some extent) be comparable to the<br />
lexical similarity analysis because they also present only a subset of analyzed<br />
requirements to the analyst. The analyst using the filtering and<br />
searching functionality has to provide a meaningful search string to filter<br />
out similar requirements, while in the lexical similarity case the analysis<br />
is done automatically. Our interpretation is supported by Fig. 2.8 which<br />
depicts the results of the performance for the manual method between the<br />
original and the replicated experiments. The median value for this replication<br />
study is 0.41 and is 0.05 higher than in the original experiment (0.36).<br />
However, the second quartile has more diverse values than in the original<br />
experiment. Moreover, we can assume that the filtering method has a<br />
higher degree of uncertainty which is shown by the results for the accuracy.<br />
7.3 Discussion<br />
In this section, we discuss alternative designs for this experiment as well<br />
as the differences between the two experiment sessions (the replication has<br />
158
7. EXPERIMENT RESULTS INTERPRETATION AND DISCUSSION<br />
Table 2.9: The results of the t-tests for the original and the replicated experiments<br />
for the same methods.<br />
Hypotheses Assisted old/new (pvalue)<br />
(research question<br />
Q2a)<br />
H1 0<br />
H2 0<br />
H3 0<br />
H4 0<br />
H5 0<br />
H6 0<br />
Efficiency 0.48 0.27<br />
Correct links 0.93 0.30<br />
Missed links 0.37 0.20<br />
Incorrect links 0.21 0.73<br />
Precision 0.81 0.45<br />
Accuracy 0.90 0.41<br />
Manual old/new (pvalue)<br />
(research question<br />
Q2b)<br />
been run in two sessions). Using alternative design could be beneficial<br />
for the comparative analysis of the original and the replicated experiment<br />
(RQ2). For example the paired t-test could have been used to support comparison<br />
between this replication study and the original study (Kachigan,<br />
1991). However, the it remains an open question if paired units are similar<br />
with respect to "noise factors" for both the assisted and the manual methods<br />
used. It could also have been beneficial to the validity if the subjects answered<br />
the pre-questionnaire before running the study and were then assigned<br />
to treatments based on the result of this questionnaire. The manual<br />
analysis of the two experiment sessions did not reveal any significant differences<br />
between the Tuesday and the Friday sessions. However, to fully<br />
address this threat to validity, additional statistical tests should be used.<br />
Finally, changing the design of the study to use random samples of 30 and<br />
160 requirements for each subject, generated from a much large dataset of<br />
requirements is one of the options for further work.<br />
During this experiment six hypotheses were tested using the same data<br />
set, and more tests were performed comparing the data from the original<br />
and replicated experiments. The result of performing multiple comparisons<br />
on the same data is increased probability of Type I error, which in<br />
case of only one comparison is equal to the obtained p-value (Arcuri and<br />
Briand, 2011). Thus, the Bonferroni correction should be discussed here. In<br />
this case, we performed 18 tests, 6 tests comparing the assisted and manual<br />
method (to answer the research question Q1), 6 tests comparing the<br />
old/new experiments with regard the assisted method (to answer the research<br />
question Q2a) and 6 tests comparing the old/new experiments with<br />
regard to the manual method (to answer the research question Q2b). This<br />
yields a significance level of 0.05/18 = 0.0027 according to Bonferroni. In<br />
this case it is no longer possible to reject hypotheses H2 0 and H3 0 . The correction<br />
has no impact on the results of the tests between the original and<br />
159
PAPER II: REPLICATION OF AN EXPERIMENT ON LINGUISTIC TOOL<br />
SUPPORT FOR CONSOLIDATION OF REQUIREMENTS FROM MULTIPLE<br />
SOURCES<br />
Figure 2.7: The result of comparing the efficiency of the assisted method in<br />
two experiment sessions.<br />
the replicated experiments. However, the correction has not been used in<br />
the original experiment and has been criticized by a number of authors<br />
(Arcuri and Briand, 2011; Perneger, 1998; Nakagawa, 2004) where some<br />
of them do not recommend using the Bonferroni adjustment (Arcuri and<br />
Briand, 2011). In the light of this criticism, it is an open question for this<br />
work as to whether or not this correction should be used. Therefore, we report<br />
the obtained p-values for all performed tests in case the readers want<br />
to evaluate the results using the Bonferroni correction or other adjustment<br />
techniques (Arcuri and Briand, 2011).<br />
The relationship between the efficiency and the practical experience of<br />
the subjects may have been investigated using multivariate analysis. For<br />
example, understanding if the efficiency of the subjects was related to their<br />
accuracy could have been investigated by recording the efficiency of linking<br />
requirements at random as a reference point. Since this has not been<br />
done, we consider this analysis as possible future work and thus outside<br />
the scope of this article.<br />
8 Conclusions<br />
Large market-driven software companies face new challenges that emerge<br />
due to their extensive growth. Among those challenges, a need for efficient<br />
methods to analyze large numbers of requirements, issued by various customers<br />
and other stakeholders, has emerged (Regnell and Brinkkemper,<br />
160
8. CONCLUSIONS<br />
Figure 2.8: The results of the efficiency achieved by the manual method in<br />
the original and the replicated experiments.<br />
2005). The result is an increasing effort dedicated to analyzing incoming<br />
requirements against those requirements already analyzed or implemented.<br />
This task is also called requirements consolidation. The core of<br />
the requirements consolidation process is finding the similarities between<br />
requirements and recording them by making links between them (Natt<br />
och Dag et al, 2006).<br />
In this paper, we present a replicated experiment that aims to assess<br />
whether a linguistic method supports the requirements consolidation task<br />
better than a searching and filtering method. In this experiment, two methods<br />
implemented in two different tools were compared for the requirements<br />
consolidation task. The assisted method, which utilizes natural language<br />
processing algorithms to provide a similarity list for each analyzed<br />
requirements, was compared with the manual method, which utilizes searching<br />
and filtering algorithms to find similar requirements. After deciding<br />
which requirements were similar, the subjects assigned links between the<br />
requirements. The conclusions of this paper are as follows:<br />
• Subjects using the assisted method were statistically not more efficient<br />
in consolidating requirements than the subjects using the manual<br />
method (research question Q1a), which is a different result compared<br />
to the original study<br />
• The assisted method was confirmed as significantly more correct in<br />
consolidating requirements than the manual method (the manual method<br />
161
PAPER II: REPLICATION OF AN EXPERIMENT ON LINGUISTIC TOOL<br />
SUPPORT FOR CONSOLIDATION OF REQUIREMENTS FROM MULTIPLE<br />
SOURCES<br />
was changed from the original experiment) (research question Q1b),<br />
which is inline with the original study.<br />
• The assisted method helps to miss fewer requirements links than the<br />
manual method (research question Q1c), which is the same result as<br />
in the original study.<br />
• The hypotheses that could not be rejected in the original study (in<br />
terms of the number of incorrect links, precision and accuracy related<br />
to research question Q1) could also not be rejected in this experiment.<br />
Further investigation is required to understand the reasons for these<br />
results.<br />
• The analysis of the results achieved for the same method (assisted<br />
or manual) between the original and the replicated study (research<br />
question Q2) shows no significant difference in any of the cases. However,<br />
some differences in favor of the searching and filtering method<br />
have been observed between the results of the performance of the<br />
subjects using the manual methods.<br />
To summarize, for two of our hypotheses the results reported in this<br />
replication study confirm the results achieved in the original experiment.<br />
The first confirmed hypothesis (H2 0 ) is that the assisted method helps to<br />
make more correct links than the manual method. The second confirmed<br />
hypothesis (H3 0 ) indicates that the assisted method helps to miss fewer requirements<br />
links than the manual method. The statistical significance in<br />
performance of the assisted method achieved over the manual method (hypothesis<br />
H1 0 ) is not confirmed in this study. The remaining three hypotheses<br />
regarding the number of incorrect links (hypothesis H4 0 ), precision (hypothesis<br />
H5 0 ) and accuracy (hypothesis H6 0 ) could not be rejected, which is<br />
the same situation as reported in the original experiment (Natt och Dag<br />
et al, 2006). In order to investigate the possible reasons for the difference<br />
in the remaining case, this paper provides a cross-case analysis of the same<br />
methods across the two experiment sessions as well as detailed analysis of<br />
the relations between the experience of the subjects and their results.<br />
The analysis revealed that the pairs of subjects with experience in the<br />
course that originated the requirements achieved better correctness than<br />
inexperienced pairs, independent of whether one of both members had<br />
the experience. At the same time, the pairs of subjects without any experience<br />
missed on average fewer requirements links than the experienced<br />
pairs of subjects. Furthermore, the pairs where only one person had experience<br />
performed worse in all aspects than the pairs where both persons<br />
162
8. CONCLUSIONS<br />
were experienced. The analysis revealed no statistical difference for any<br />
of the cases (which refers to the research question RQ2). However, the<br />
analysis of the efficiency of the subjects using the assisted method in the<br />
two experiments, depicted in Fig. 2.7, revealed that the values for the efficiency<br />
achieved in this replication have a much higher range. The results<br />
for the efficiency of the manual methods in the two experiments, depicted<br />
in Fig. 2.8, shows similar range of values, but different medians. It should<br />
be noted that there are validity threats to the study as described in Section<br />
4.9, e. g. experience of the subjects and their incentives, the number of<br />
subjects participating, requirements used in the experiment, and the multiple<br />
comparison threats.<br />
Performing a third experiment with experienced practitioners and requirements<br />
sets from industry is left for future work. Moreover, it would<br />
be interesting to further investigate the influence of working in pairs on<br />
the requirements consolidation task as well as to analyze the influence of<br />
the construction of the user interfaces on the efficiency of correctness of the<br />
subjects.<br />
Acknowledgments<br />
This work is supported by VINNOVA (Swedish Agency for Innovation<br />
Systems) within the UPITER project. Special acknowledgments to Richard<br />
Berntsson-Svensson for participating in the pilot study and reviewing the<br />
paper. We are also thankful to Lars Nilsson and David Callele for reviewing<br />
the paper and excellent language comments.<br />
163
PAPER II: REPLICATION OF AN EXPERIMENT ON LINGUISTIC TOOL<br />
SUPPORT FOR CONSOLIDATION OF REQUIREMENTS FROM MULTIPLE<br />
SOURCES<br />
164
Bibliography<br />
REFERENCES<br />
Aguilera C, Berry D (1991) The use of a repeated phrase finder in requirements<br />
extraction. J Syst Softw 13:209–230<br />
Antoniol G, Canfora G, Casazza G, De Lucia A, Merlo E (2002) Recovering<br />
traceability links between code and documentation. Software Engineering,<br />
IEEE Transactions on 28(10):970 – 983<br />
Arcuri A, Briand L (2011) A practical guide for using statistical tests to<br />
assess randomized algorithms in software engineering. In: Proceeding of<br />
the 33rd international conference on Software engineering, ACM, New<br />
York, NY, USA, ICSE ’11, pp 1–10<br />
Baddoo N, Hall T, Jagielska D (2006) Software developer motivation in a<br />
high maturity company: a case study. Software Process: Improvement<br />
and Practice" pp 219–228<br />
Basili V, Shull F, Lanubile F (1999) Building knowledge through families of<br />
experiments. IEEE Transactions on Software Engineering 25(4):456 –473<br />
Begel A, Nachiappan N (2008) Pair programming: what’s in it for me? In:<br />
Proceedings of the Second ACM-IEEE international symposium on Empirical<br />
software engineering and measurement: ESEM ’08, ACM, New<br />
York, USA, pp 120–128<br />
Berenbach B, Paulish DJ, Kazmeier J, Rudorfer A (2009) Software & Systems<br />
Requirements Engineering: In Practice. Pearson Education Inc.<br />
Breaux T (2009) Exercising due diligence in legal requirements acquisition:<br />
A tool-supported, frame-based approach. Atlanta, GA, United states, pp<br />
225 – 230<br />
Cleland-Huang J, Chang CK, Ge Y (2002) Supporting event based traceability<br />
through high-level recognition of change events. In: COMPSAC ’02:<br />
Proceedings of the 26th International Computer Software and Applications<br />
Conference on Prolonging Software Life: Development and Redevelopment,<br />
IEEE Computer Society, Washington, DC, USA, pp 595–602<br />
Cleland-Huang J, Settimi R, Duan C, Zou X (2005) Utilizing supporting<br />
evidence to improve dynamic requirements traceability. In: Proceedings<br />
of the 13th IEEE International Conference on Requirements Engineer (RE<br />
2005), pp 135–144<br />
Cleland-Huang J, Berenbach B, Clark S, Settimi R, Romanova E (2007) Best<br />
practices for automated traceability. Computer 40(6):27–35<br />
165
REFERENCES<br />
Cleland-Huang J, Czauderna A, Gibiec M, Emenecker J (2010) A machine<br />
learning approach for tracing regulatory codes to product specific requirements.<br />
In: Proceedings of the 32nd ACM/IEEE International Conference<br />
on Software Engineering,ICSE ’10, ACM, New York, NY, USA,<br />
pp 155–164<br />
De Lucia A, Fasano F, Oliveto R, Tortora G (2007) Recovering traceability<br />
links in software artifact management systems using information retrieval<br />
methods. ACM Trans Softw Eng Methodol 16(4):13<br />
ECTS (2010) The ECTS grading systems defined by European Commission.<br />
, accessed<br />
07/09/2011<br />
Fabbrini F, Fusani M, Gnesi S, Lami G (2001) An automatic quality evaluation<br />
for natural language requirements. In: Proceedings of the 7th<br />
International Workshop on Requirements Engineering Foundation for<br />
Software Quality (REFSQ 2001), pp 4–5<br />
Fantechi A, Gnesi S, Lami G, Maccari A (2003) Applications of linguistic<br />
techniques for use case analysis. Requir Eng 8(3):161–170<br />
Fricker S, Gorschek T, Byman C, Schmidle A (2010) Handshaking with implementation<br />
proposals: Negotiating requirements understanding. IEEE<br />
Software 27:72–80<br />
Gacitua R, Sawyer P, Gervasi V (2010) On the effectiveness of abstraction<br />
identification in requirements engineering. In: Requirements Engineering<br />
Conference (RE), 2010 18th IEEE International, pp 5 –14<br />
Gervasi V (1999) Environment support for requirements writing and analysis.<br />
PhD thesis, University of Pisa<br />
Gervasi V, Nuseibeh B (2000) Lightweight validation of natural language<br />
requirements: A case study. In: Proceedings Fourth International Conference<br />
on Requirements Engineering. ICRE 2000, IEEE Comput. Soc, pp<br />
113–133<br />
Goldin L, Berry D (1997) Abstfinder, a prototype natural language text abstraction<br />
finder for use in requirements elicitation. Autom Softw Eng<br />
4:375–412<br />
Gorschek T, Garre P, Larsson S, Wohlin C (2007) Industry evaluation of the<br />
requirements traction model. Requirements Engineering 12(3):163–190<br />
Gotel O, Finkelstein A (1994) An analysis of the requirements traceability<br />
problem. In: Proceedings of the First International Conference on Requirements<br />
Engineering, RE’94, pp 94 –101<br />
166
REFERENCES<br />
Hayes J, Dekhtyar A, Osborne J (2003) Improving requirements tracing via<br />
information retrieval. In: Proceedings of the 11th IEEE International Requirements<br />
Engineering Conference (RE’03), pp 138 – 147<br />
Higgins S, Laat M, Gieles P, Geurts E (2003) Managing requirements for<br />
medical it products. IEEE Software 20(1):26-33<br />
Höst M, Wohlin C, Thelin T (2005) Experimental context classification: Incentives<br />
and experience of subjects. In: Proceedings of the 27:th International<br />
Conference on Software Engineering (ICSE), pp 470–478<br />
Huffman Hayes J, Dekhtyar A, Sundaram S (2006) Advancing candidate<br />
link generation for requirements tracing: The study of methods. IEEE<br />
Trans Softw Eng 32(1):4–19<br />
Huffman Hayes J, Dekhtyar A, Sundaram S, Holbrook E, Vadlamudi S,<br />
April A (2007) Requirements tracing on target (retro): improving software<br />
maintenance through traceability recovery. Innovations in Systems<br />
and Software Engineering 3:193–202<br />
Hulkko H, Abrahamsson P (2005) A multiple case study on the impact<br />
of pair programming on product quality. In: Proceedings of the 27:th<br />
International Conference on Software Engineering ICSE ’05, ACM, New<br />
York, NY, USA, pp 495–504<br />
IBM (2010a) Rational doors (former telelogic doors) product description.<br />
,<br />
accessed 07/09/2011<br />
IBM (2010b) Rational doors product description (former telelogic doors),<br />
accessed 15/04/2010. <br />
, accessed 07/09/2011<br />
IEEE (2010) The ieee keyword taxonomy webpage. <br />
, accessed 07/09/2011<br />
Ivarsson M, Gorschek T (2009) Technology transfer decision support in requirements<br />
engineering research: a systematic review of REj. Requir Eng<br />
14(3):155–175<br />
Jackson P, Moulinier I (2002) Natural language processing for online applications.<br />
Text retrieval, extraction and categorization, Natural Language<br />
Processing, vol 5. Benjamins, Amsterdam, Philadelphia<br />
Jarke M (1998) Requirements tracing. Commun ACM 41:32–36<br />
Kachigan S (1991) Multivariate statistical analysis: A conceptual introduction.<br />
Radius Press<br />
167
REFERENCES<br />
Kamsties E, Berry D, Paech B (2001) Detecting ambiguities in requirements<br />
documents using inspections. In: Proceedings of the First Workshop on<br />
Inspection in Software Engineering (WISE 2001), pp 68–80<br />
Karlsson L, sa G Dahlstedt A, Natt Och Dag J, Regnell B, Persson A (2002)<br />
Challenges in market-driven requirements engineering - an industrial<br />
interview study. In: Proceedings of the Eighth International Workshop<br />
on Requirements Engineering: Foundation for Software Quality (REFSQ<br />
2002)<br />
Kitchenham B, Pfleeger S, Pickard L, Jones P, Hoaglin D, Emam E, Rosenberg<br />
J (2002) Preliminary guidelines for empirical research in software<br />
engineering. IEEE Trans Softw Eng 28(8):721–734<br />
Konrad S, Gall M (2008) Requirements engineering in the development of<br />
large-scale systems. In: Proceedings of the 16th International Requirements<br />
Engineering Conference (RE 2008), pp 217–222<br />
Kotonya G, Sommerville I (1998) Requirements Engineering. John Wiley &<br />
Sons<br />
Lauesen S (2002) Software Requirements – Styles and Techniques.<br />
Addison–Wesley<br />
Leuser J (2009) Challenges for semi-automatic trace recovery in the automotive<br />
domain. In: Proceedings of the 2009 ICSE Workshop on Traceability<br />
in Emerging Forms of Software Engineering TEFSE’09, IEEE<br />
Computer Society, Washington, DC, USA, pp 31–35<br />
Lin J, Chou Lin C, Cleland-Huang J, Settimi R, Amaya J, Bedford G, Berenbach<br />
B, Khadra O, Duan C, Zou X (2006) Poirot: A distributed tool supporting<br />
enterprise-wide automated traceability. In: Requirements Engineering,<br />
14th IEEE International Conference, pp 363 –364<br />
Lormans M, van Deursen A (2006) Can lsi help reconstructing requirements<br />
traceability in design and test? In: Proceedings of the Conference<br />
on Software Maintenance and Reengineering CSMR’06, IEEE Computer<br />
Society, Washington, DC, USA, pp 47–56<br />
Lund University (2011a) The requirements engineering course (ets170)<br />
at the lund university. , accessed<br />
07.09.2011<br />
Lund University (2011b) The software development of large systems<br />
course page at lund university. , accessed<br />
07.09.2011<br />
Macias B, Pulman S (1995) A method for controlling the production of specifications<br />
in natural language. Comput J 48(4):310–318<br />
168
REFERENCES<br />
Manning C, Schütze H (2002) Foundations of Statistical Natural Language<br />
Processing. MIT Press<br />
Marcus A, Maletic J (2003) Recovering documentation-to-source-code<br />
traceability links using latent semantic indexing. In: Proceedings of the<br />
25th International Conference on Software Engineering ICSE’03, IEEE<br />
Computer Society, Washington, DC, USA, pp 125–135<br />
Mich L, Mylopoulos J, Nicola Z (2002) Improving the quality of conceptual<br />
models with nlp tools: An experiment. Tech. rep., University of Trento<br />
Nakagawa S (2004) A farewell to bonferroni: the problems of low statistical<br />
power and publication bias. Behavioral Ecology 15(6):1044–1045<br />
Natt och Dag J (2006a) Managing natural language requirements in largescale<br />
software development. PhD thesis, Lund University, Sweden<br />
Natt och Dag J (2006b) The reqsimile tool website. <br />
, accessed 07/09/2011<br />
Natt och Dag J, Gervasi V, Brinkkemper S, Regnell B (2004) Speeding up<br />
requirements management in a product software company: Linking<br />
customer wishes to product requirements through linguistic engineering.<br />
In: Proceedings of the 12th International Requirements Engineering<br />
Conference (RE 2004), pp 283–294<br />
Natt och Dag J, Thelin T, Regnell B (2006) An experiment on linguistic<br />
tool support for consolidation of requirements from multiple sources<br />
in market-driven product development. Empirical Software Engineering<br />
11(2):303–329<br />
Panis M (2010) Sucessful deployment of requirements traceability in a commercial<br />
engineering organization ... really. In: Proceedings of the 18th<br />
IEEE International Requirements Engineering Conference, pp 303–307<br />
Parrish A, Smith R, Hale D, Hale J (2004) A field study of developer pairs:<br />
Productivity impacts and implications. IEEE Softw 21(5):76–79<br />
Perneger T (1998) What’s wrong with Bonferroni adjustments, vol 316<br />
Pohl K, Bockle G, van der Linden F (2005) Software Product Line Engineering:<br />
Foundations, Principles and Techniques. Springer<br />
Ramesh B, Jarke M (2001) Toward reference models for requirements traceability.<br />
IEEE Trans Softw Eng 27(1):58–93<br />
Ramesh B, Powers T, Stubbs C, Edwards M (1995) Implementing requirements<br />
traceability: a case study. In: Proceedings of the Second IEEE International<br />
Symposium on Requirements Engineering RE’95, IEEE Computer<br />
Society, Washington, DC, USA, p 89<br />
169
REFERENCES<br />
Rayson P, Emmet L, Garside R, Sawyer P (2001) The revere project: Experiments<br />
with the application of probabilistic NLP to systems engineering.<br />
In: Natural Language Processing and Information Systems, Springer,<br />
Lecture Notes in Computer Science, vol 1959, pp 288–300<br />
Regnell B, Brinkkemper S (2005) Engineering and Managing Software Requirements,<br />
Springer, chap Market–Driven Requirements Engineering<br />
for Software Products, pp 287–308<br />
Regnell B, Beremark P, Eklundh O (1998) A market-driven requirements<br />
engineering process: Results from an industrial process improvement<br />
programme. Requirements Engineering 3(2):121–129<br />
Rolland C, Proix C (1992) A natural language approach for requirements<br />
engineering. In: Advanced Information Systems Engineering, Springer<br />
Berlin / Heidelberg, Lecture Notes in Computer Science, vol 593, pp<br />
257–277<br />
Rupp C (2000) Linguistic methods of requirements engineering (NLP). In:<br />
Proceedings of the EuroSPI 2000, pp 68–80<br />
Ryan K (1993) The role of natural language in requirements engineering. In:<br />
Proceedings of the IEEE International Symposium on Requirements Engineering,<br />
San Diego California, IEEE Computer Society Press, pp 240–<br />
242<br />
Samarasinghe R, Nishantha G, Shutto N (2009) Total traceability system:<br />
A sustainable approach for food traceability in smes. In: Industrial and<br />
Information Systems (ICIIS), 2009 International Conference on, pp 74 –79<br />
Sawyer P, Cosh K (2004) Supporting measur-driven analysis using nlp<br />
tools. In: Proceedings of the 10th International Workshop on Requirements<br />
Engineering: Foundations of Software Quality (REFSQ 2004), pp<br />
137–142<br />
Sawyer P, Rayson P, Garside R (2002) REVERE: Support for requirements<br />
synthesis from documents. Inf Syst Front 4(3):343–353<br />
Sawyer P, Rayson P, Cosh K (2005) Shallow knowledge as an aid to deep<br />
understanding in early phase requirements engineering. IEEE Trans<br />
Softw Eng 31(11):969–981<br />
Shull F, Carver J, Vegas S, Juristo N (2008) The role of replications in empirical<br />
software engineering. Empir Software Eng 13(2):211–218<br />
Sjøberg D, Hannay J, Hansen O, Karahasanovic V, Liborg A, Rekdal N<br />
(2005) The survey of controlled experiments in software engineering.<br />
IEEE Trans Softw Eng 31(9):733–753<br />
170
REFERENCES<br />
Sommerville I, Sawyer P, Sawyer P (1997) Viewpoints: principles, problems<br />
and a practical approach to requirements engineering. Ann Softw Eng<br />
3:101–130<br />
Strens M, Sugden R (1996) Change analysis: a step towards meeting the<br />
challenge of changing requirements. In: Engineering of Computer-Based<br />
Systems,1996. Proceedings., IEEE Symposium and Workshop on, pp 278<br />
–283<br />
Wiegers K (2003) Microsoft Press<br />
Wilkinson L (1999) Statistical methods in psychology journals: Guidelines<br />
and explanations. American Psychologist 54(8):594–604<br />
Wilson W, Rosenberg L, Hyatt L (1997) In: Proceedings of the 19th international<br />
conference on Software engineering ICSE’97, ACM, New York,<br />
NY, USA, pp 161–171<br />
Wohlin C, Runeson P, Höst M, Ohlsson MC, Regnell B, Wesslen A (2000)<br />
Experimentation in Software Engineering An Introduction. Kluwer Academic<br />
Publishers<br />
Zowghi D, Offen R (1997) A logical framework for modeling and reasoning<br />
about the evolution of requirements. In: Proceedings of the Third IEEE<br />
International Symposium on Requirements Engineering, pp 247 –257<br />
171
REFERENCES<br />
172
Paper III<br />
Obsolete Software Requirements<br />
<strong>Krzysztof</strong> <strong>Wnuk</strong> 1 , Tony Gorschek 2 , Showayb Zahda 2<br />
1 Department of Computer Science,<br />
Lund University, Sweden<br />
<br />
2 School of Computing Software Engineering Research Lab,<br />
Blekinge Institute of Technology,<br />
SE-371 79 Karlskrona, Sweden<br />
, <br />
under revision for<br />
Information and Software Technology 2012<br />
ABSTRACT<br />
[Context] Coping with rapid requirements change is crucial<br />
for staying competitive in the software business. Frequently<br />
changing customer needs and fierce competition are typical drivers<br />
of rapid requirements evolution resulting in requirements obsolescence<br />
even before project completion. [Objective] Although<br />
the obsolete requirements phenomenon and the implications<br />
of not addressing them are known, there is a lack of empirical<br />
research dedicated to understanding the nature of obsolete<br />
software requirements and their role in requirements management.<br />
[Method] In this paper, we report results from an<br />
empirical investigation with 219 respondents aimed at investigating<br />
the phenomenon of obsolete software requirements.<br />
[Results] Our results contain, but are not limited to, defining<br />
the phenomenon of obsolete software requirements, investigating<br />
how they are handled in industry today and their potential<br />
impact. [Conclusion] We conclude that obsolete software<br />
requirements constitute a significant challenge for companies<br />
developing software intensive products, in particular in large<br />
projects, and that companies rarely have processes for handling<br />
obsolete software requirements. Further, our results call for future<br />
research in creating automated methods for obsolete software<br />
requirements identification and management, methods<br />
that could enable efficient obsolete software requirements management<br />
in large projects.
1 Introduction<br />
1. INTRODUCTION<br />
Software, as a business, is a demanding environment where a growing<br />
number of users, rapid introduction of new technologies, and fierce competition<br />
are inevitable (DeBellis and Haapala, 1995; Regnell and Brinkkemper,<br />
2005; Gorschek et al, 2010). This rapidly changing business environment<br />
is challenging traditional Requirements Engineering (RE) approaches<br />
(Ramesh et al, 2010; Gorschek et al, 2007a,b). The major challenges in this<br />
environment are high volatility and quick evolution of requirements, requirements<br />
that often tend to become obsolete even before project completion<br />
(DeBellis and Haapala, 1995; Cao and Ramesh, 2008; <strong>Wnuk</strong> et al,<br />
2009; Hood et al, 2008b). At the same time the product release time is crucial<br />
(Chen et al, 2005; Wohlin et al, 1995; Sawyer, 2000) for the success of<br />
the software products, especially in emerging or rapidly changing markets<br />
(Chen et al, 2005).<br />
Coping with rapid requirements change is crucial as time-to-market<br />
pressures often make early pre-defined requirements specifications inappropriate<br />
almost immediately after their creation (Cao and Ramesh, 2008).<br />
In Market-Driven Requirements Engineering (MDRE), the pace of incoming<br />
requirements (Regnell and Brinkkemper, 2005) and requirements change<br />
is high. Software companies have to identify which requirements are obsolete<br />
or outdated. The rapid identification and handling of potentially<br />
obsolete requirements is important as large volumes of degrading requirements<br />
threatens effective requirements management. In extreme cases, obsolete<br />
requirements could dramatically extend project timelines, increase<br />
the total cost of the project or even cause project failure; and even the successful<br />
identification of the obsolete requirements without handling adds<br />
little or no product value (Murphy and Rooney, 2006; Stephen et al, 2011;<br />
Merola, 2006). Thus, the identification, handling, and removal of obsolete<br />
requirements is crucial.<br />
The phenomenon of obsolete requirements and the implications of not<br />
handling them are known (Hood et al, 2008c; Murphy and Rooney, 2006;<br />
Stephen et al, 2011; Savolainen et al, 2005; Loesch and Ploederoeder, 2007;<br />
Mannion et al, 2000; Herald et al, 2009). At the same time, several researchers<br />
focused on topics related to the phenomenon of obsolete requirements,<br />
e.g. requirements volatility and scope creep (Robertson and Robertson,<br />
1999; Iacovou and Dexter, 2004; DeMarco and Lister, 2003; Houston<br />
et al, 2001; Gulk and Verhoef, 2008; Zowghi and Nurmuliani, 2002; Loconsole<br />
and Borstler, 2005). However, very little research has been performed<br />
into obsolete requirements management or guidelines, see e.g. (Wiegers,<br />
2003; Lauesen, 2002; Kotonya and Sommerville, 1998; Sommerville and<br />
Sawyer, 1997; Lamsweerde, 2009; Aurum and Wohlin, 2005a). Standards (IEEE,<br />
1997; Institute, 2011) do not explicitly mention the phenomenon of Obsolete<br />
Software Requirements (OSRs). The term itself is only partly defined<br />
and empirically anchored (Savolainen et al, 2005).<br />
175
PAPER III: OBSOLETE SOFTWARE REQUIREMENTS<br />
In this paper, we present the results from an empirical study, based on a<br />
survey with 219 respondents from different companies. The survey investigated<br />
the phenomenon of obsolete requirements and included, an effort<br />
to define the phenomenon based on the perceptions of industry practitioners.<br />
The study also aimed to collect data on how obsolete requirements are<br />
perceived, how they impact industry, and how they are handled in industry<br />
today.<br />
This paper is structured as follows: section 2 provides the background<br />
and related work, section 3 describes the research methodology, section 4<br />
describes and discusses the results of the study, and section 5 concludes<br />
the paper.<br />
2 Background and Related Work<br />
Requirements management, as an integral part of requirements engineering<br />
(Hood et al, 2008b; Sommerville and Sawyer, 1997), manages the data<br />
created in the requirements elicitation and development phases of the project.<br />
Requirements management integrates this data into the overall project flow<br />
(Hood et al, 2008b) and supports the later lifecycle modification of the requirements<br />
(Hood et al, 2008b). As changes occur during the entire software<br />
project lifetime (Hood et al, 2008a), managing changes to the requirements<br />
is a major concern of requirements management (Lauesen, 2002;<br />
Kotonya and Sommerville, 1998) for large software systems. Moreover, in<br />
contexts like MDRE, a constant stream of new requirements and change requests<br />
is inevitable (Regnell and Brinkkemper, 2005). Uncontrolled changes<br />
to software may cause the cost of the regression testing to exceed 100 000<br />
dollars (Hood et al, 2008b). Further, the absence of requirements management<br />
may sooner or later cause outdated requirements specifications as<br />
the information about changes to original requirements is not fed back to<br />
the requirements engineers (Hood et al, 2008b). Finally, the requirements<br />
management process descriptions in literature seldom consider managing<br />
obsolete requirements (Lauesen, 2002; Wiegers, 2003).<br />
Scope creep, requirements creep and requirements leakage (also referred<br />
to as uncontrolled requirements creep) (Robertson and Robertson,<br />
1999; Iacovou and Dexter, 2004) are related to OSRs. DeMarco and Lister<br />
(2003) identified scope creep as one of the five core risks during the<br />
requirements phase and state that the risk is a direct indictment of how<br />
requirements were gathered in the first place. Scope creep has also been<br />
mentioned as having a significant impact on risk and risk management in<br />
enterprise data warehouse projects (Legodi and Barry, 2010). Houston et<br />
al (2001) studied software development risk factors and 60% of 458 respondents<br />
perceived that requirements creep was a problem in their projects.<br />
Anthes (1994) reported that the top reason for requirements creep in 44%<br />
of the cases is a poor definition of initial requirements. Scope creep can<br />
176
2. BACKGROUND AND RELATED WORK<br />
lead to significant scope reductions as overcommitment challenges are addressed.<br />
This, in turn, postpones the implementation of the planned functionality<br />
and can cause requirements to become obsolete (<strong>Wnuk</strong> et al, 2009)<br />
or project failure (Iacovou and Dexter, 2004).<br />
Despite its importance as a concept, in relation to managing requirements<br />
for software products, the phenomenon of OSRs seems to be underrepresented<br />
in literature. To the best of our knowledge, only a handful<br />
of articles and books mention the terms obsolete requirements or/and obsolete<br />
features. Among the existing evidence, Loesch and Ploederoeder<br />
(2007) claim that the explosion of the number of variable features and variants<br />
in a software product line context is partially caused by the fact that<br />
obsolete variable features are not removed. Murphy and Rooney (2006)<br />
stress that requirements have ’a shelf life’ and suggest that the longer it<br />
takes from defining requirements to implementation, the higher the risk of<br />
change (this inflexibility is also mentioned by Rue et al (2010)). Moreover,<br />
they state that change makes requirements obsolete, and that obsolete requirements<br />
can dramatically extend project timelines and increase the total<br />
cost of the project. Similarly, Stephen et al (2011) list obsolete requirements<br />
as one of the symptoms of failure of IT project for the UK government.<br />
While the report does not define obsolete requirements per se, the symptom<br />
of failure is ascribed to obsolete requirements caused by the inability<br />
to unlock the potential of new technologies by timely adoption.<br />
The phenomenon of OSRs has not yet been mentioned by standardization<br />
bodies in software engineering. Neither the IEEE 830 standard (IEEE,<br />
1997) nor CMMI (v.1.3) (Institute, 2011) mention obsolete software requirements<br />
as a phenomenon. Actions, processes and techniques are also not<br />
suggested in relation to handling the complexity. On the other hand, Savolainen<br />
et al (2005) propose a classification of atomic product line requirements<br />
into these categories: non-reusable, mandatory, variable and obsolete. Moreover<br />
they propose a short definition of obsolete requirements and the process<br />
of managing these requirements for software product lines “by marking<br />
them obsolete and hence not available for selection into subsequent<br />
systems”. Mannion et al (2000) propose a category of variable requirements<br />
called obsolete and suggest dealing with them as described by Savolainen<br />
et al (2005).<br />
OSRs are related to the concept of requirements volatility. SWEBOOK<br />
classifies requirements into a number of dimensions and one of the them<br />
is volatility and stability. SWEBOK mentions that some volatile requirements<br />
may become obsolete (IEEE Computer Society, 2004). Kulk and<br />
Verhoef (2008) reported that the maximum requirements volatility rates<br />
depend on size and duration of a project. They proposed a model that<br />
calculates the “maximum healthy volatility ratios” for projects. Loconsole<br />
and Börstler (2005) analyzed requirements volatility by looking at the<br />
changes to use case models while Takahashi and Kamayachi (1989) investigated<br />
the relationship between requirements volatility and defect den-<br />
177
PAPER III: OBSOLETE SOFTWARE REQUIREMENTS<br />
sity. On the other hand, Zowghi and Nurmuliani (2002) proposed a taxonomy<br />
of requirement changes where one of the reasons for requirements<br />
changes is obsolete functionality, defined as “functionality that is no longer<br />
required for the current release or has no value for the potential users”.<br />
For this paper, we understand requirements volatility as a factor that influences<br />
requirements change but different from requirements obsolescence.<br />
OSRs are, according to our understanding, any type of requirement (stable,<br />
small, large, changing) that is not realized or dismissed, but which<br />
accumulates in the companies’ databases and repositories. Requirements<br />
obsolescence is defined as a situation where volatility becomes outdated<br />
and remains in the requirements databases (Harker et al, 1993; McGee and<br />
Greer, 2009).<br />
Looking at previous work, software artifact obsolescence has been mentioned<br />
in the context of obsolete hardware and electronics in, for example,<br />
military, avionics or other industries. Among others, Herald et al proposed<br />
an obsolescence management framework for system components (in this<br />
case hardware, software, and constraints) that is mainly concerned with<br />
system design and evolution phases (Herald et al, 2009). While, the framework<br />
contains a technology roadmapping component, it does not explicitly<br />
mention OSRs. Merola (Merola, 2006) described the software obsolescence<br />
problem in today’s defense systems of systems (the COTS software<br />
components level). He stressed that even though the issue has been recognized<br />
as being of equal gravity to the hardware obsolescence issue, it<br />
has not reached the same visibility level. Merola outlines some options<br />
for managing software obsolescence, such as negotiating with the vendor<br />
to downgrade the software license, using wrappers and software application<br />
programming interfaces, or performing market analysis and surveys<br />
of software vendors.<br />
Due to the limited number of studies in the literature dedicated to the<br />
OSR phenomenon, we decided to investigate the concept utilizing a survey<br />
research strategy. We investigated the extent to which obsolete software requirements<br />
are perceived as a real phenomenon and as a real problem in<br />
industry. Moreover, we investigated how OSRs are identified and managed<br />
in practice, and what contextual factors influence OSRs.<br />
3 Research methodology<br />
This section covers the research questions, the research methodology, and<br />
the data collection methods used in the study.<br />
3.1 Research questions<br />
Due to the limited number of related empirical studies identified in relation<br />
to OSRs, we decided to focus on understanding the OSR phenomenon<br />
178
3. RESEARCH METHODOLOGY<br />
and its place in the requirements engineering landscape. Thus, most of the<br />
research questions outlined in Table 3.1 are existence, descriptive, as well<br />
as classification questions (Easterbrook et al, 2008). Throughout the research<br />
questions, we have used the following definition of OSRs, based on<br />
the literature study and the survey:<br />
“An obsolete software requirement is a software requirement, implemented or not,<br />
that is no longer required for the current release or future releases, and which has<br />
no value or business goals for the potential customers or users of a software artifact<br />
for various reasons. 1 ”<br />
3.2 Research design<br />
A survey was chosen as the main tool to collect empirical data, enabling<br />
us to reach a larger number of respondents from geographically diverse<br />
locations (Singer et al, 2008). Automation of data collection and analysis<br />
ensured flexibility and convenience to both researchers and participants,<br />
(Easterbrook et al, 2008; Dawson, 2005; L. M. Rea, 1005).<br />
The goal of the survey was to elicit as much information from industry<br />
practitioners as possible in relation to OSRs. Therefore, we opted for an<br />
inclusive approach to catch as many answers as possible. This prompted<br />
the use of convenience sampling (L. M. Rea, 1005). The details in relation<br />
to survey design and data collection are outlined below.<br />
3.2.1 Survey design<br />
The questionnaire was created based on a literature review of relevant topics,<br />
such as requirements management, volatility, and requirements traceability<br />
(see Section 2). The questions were iteratively developed. Each version<br />
of the questionnaire was discussed among the authors and evaluated<br />
in relation to how well the questions reflected the research questions and<br />
the research goals.<br />
The questionnaire contained 15 open and close-ended questions of different<br />
formats, e.g. single choice questions and multiple choice questions.<br />
In open-ended questions, respondents could provide their own answers as<br />
well as select a pre-defined answer from the list. The answers were analyzed<br />
using the open coding method Strauss and Corbin (1990). The data<br />
analysis was started without a preconceived theory in mind. We read all<br />
the answers and coded interesting answers by assigning them to a category<br />
with similar meaning. For close-ended questions, we used a Likert scale<br />
from 1 to 5, where 1 corresponds to Not likely and 5 to Very likely (Wikipedia,<br />
2011).<br />
1 For reader convenience we present the definition in this section, rather than after presentation<br />
of the results. The description of how the definition was derived is available in Section<br />
4.<br />
179
PAPER III: OBSOLETE SOFTWARE REQUIREMENTS<br />
RQ7: Where in the requirements life cycle<br />
should OSRs be handled?<br />
To position requirements obsolescence in the requirements<br />
engineering life cycle.<br />
“They should be a part of the requirements<br />
traceability task”<br />
RQ6: What context factors, such as<br />
project size or domain, influence OSRs?<br />
As a step in understanding and devising solutions<br />
for handling OSRs, it is important to identify<br />
contextual factors that have an influence on<br />
the obsolete requirements phenomenon.<br />
“OSRs are more common in large<br />
projects and for products that are sold to<br />
an open market (MDRE context)”<br />
RQ5: When OSRs are identified, how are<br />
they typically handled in industry?<br />
In order to identify possible alternatives for OSR<br />
handling, we first need to understand how they<br />
are handled today.<br />
“We should mark found obsolete requirements<br />
as obsolete but keep them in<br />
the requirements database”<br />
RQ4: What methods exist, in industry<br />
practice, that help to identify obsolete<br />
software requirements?<br />
To enact a process to detect, identify or find<br />
obsolete software requirements or nominate requirements<br />
that risk becoming obsolete.<br />
“To read the requirements specification<br />
carefully and check if any requirements<br />
are obsolete”<br />
RQ3: Does requirement type affect the<br />
likelihood of a software requirement becoming<br />
obsolete?<br />
Are there certain types of requirements that become<br />
obsolete more often than others? Can<br />
these types be identified?<br />
“A market requirement will become obsolete<br />
much faster than a legal requirement.”<br />
180<br />
RQ2: What is the impact of the phenomenon<br />
of obsolete software requirements<br />
on the industry practice?<br />
To investigate to what degree is OSR a serious<br />
concern.<br />
“Yes it is somehow serious”<br />
RQ1: Based on empirical data, what<br />
would be an appropriate definition of<br />
Obsolete Software Requirements (OSR)?<br />
Instead of defining the phenomenon ourselves<br />
we base the definition on how the phenomenon<br />
is perceived in industry.<br />
“An obsolete software requirements is a<br />
requirement that has not been included<br />
into the scope of the project for the last 5<br />
projects”<br />
Research question Aim Example answer<br />
Table 3.1: Research questions
3. RESEARCH METHODOLOGY<br />
The questionnaire was divided into two parts: one related to OSRs (9<br />
questions), and one related to demographics (6 questions). Table 3.2 shows<br />
the survey questions, with a short description of their purpose (2nd column),<br />
the list of relevant references (3rd column), and a link to the addressed<br />
research question (4th column). It should be observed that an<br />
OSR is defined in this work in the context of the current release in order<br />
to keep the question fairly simple and avoid introducing other complicating<br />
aspects. For reasons of brevity, we do not present the entire survey in<br />
the paper. However, the complete questionnaire, including the references<br />
that were used to construct the categories for the answers is available online<br />
(<strong>Wnuk</strong>, 2011e).<br />
3.2.2 Operation (execution of the survey)<br />
The survey was conducted using a web-survey support website called SurveyMonkey<br />
(Monkey, 2011). Invitations to participate in the questionnaire<br />
were sent to the potential audience via:<br />
• Personal emails — utilizing the contact networks of the authors<br />
• Social network websites (Linkedin, 2011) — placing the link to the<br />
questionnaire on the board of SE and RE groups and contacting individuals<br />
from the groups based on their designated titles such as<br />
senior software engineer, requirements engineer, system analyst, and<br />
project manager to name a few<br />
• Mailing lists — requirements engineering and software engineering<br />
discussion groups (<strong>Wnuk</strong>, 2011c)<br />
• Software companies and requirements management tool vendors (<strong>Wnuk</strong>,<br />
2011d)<br />
Masters and undergraduate students were excluded as potential respondents<br />
because their experience was judged insufficient to answer the questionnaire.<br />
The questionnaire was published online on the 3rd of April,<br />
2011 and the data collection phase ended on the 3rd of May, 2011. In total,<br />
approximately 1700 individual invitations were sent out with 219 completed<br />
responses collected. The response rate, around 8%, is an expected<br />
level (Easterbrook et al, 2008; Singer et al, 2008). The results of the survey<br />
are presented in Section 4.<br />
3.3 Validity<br />
In this section, we discuss the threats to validity in relation to the research<br />
design and data collection phases. The four perspectives of validity discussed<br />
in this section are based on the classification proposed by Wohlin et<br />
al (Wohlin et al, 2000).<br />
181
PAPER III: OBSOLETE SOFTWARE REQUIREMENTS<br />
Q9 To investigate if industry has processes for managing<br />
OSR<br />
quirements.<br />
(Loesch and Ploederoeder, 2007;<br />
Savolainen et al, 2005)<br />
RQ5<br />
Q7 To investigate if OSRs are related to the software<br />
context<br />
Q8 To understand where in the requirements life<br />
cycle OSRs should be handled<br />
Current standards for requirements engineering<br />
and process models (IEEE, 1997; Institute,<br />
2011) do not consider obsolete re-<br />
RQ5, partly<br />
RQ7<br />
Regnell et al (Regnell et al, 2008)<br />
(Stephen et al, 2011) RQ6<br />
Q4 To investigate the possible ways of identifying<br />
OSR in the requirements documents<br />
Q5 To investigate the possible actions to be taken<br />
against obsolete requirements after they are discovered<br />
Q6 To investigate whether there is a correlation between<br />
project size and the effects of OSRs<br />
The classification of different sizes of requirements<br />
engineering was adopted from<br />
RQ6<br />
Q2 To investigate the impact of the OSRs on industry<br />
practice<br />
Q3 To investigate how likely the various types of<br />
requirements would become obsolete<br />
2006)<br />
(Murphy and Rooney, 2006; Stephen et al,<br />
2011)<br />
The list of requirements types was derived<br />
from analyzing several requirements classifications<br />
(Harker et al, 1993; McGee and<br />
Greer, 2009)<br />
(Loesch and Ploederoeder, 2007; Herald<br />
et al, 2009)<br />
(Loesch and Ploederoeder, 2007; Herald<br />
et al, 2009)<br />
RQ5<br />
182<br />
RQ4<br />
RQ3<br />
RQ2<br />
Q1 To derive the definition of Obsolete Software<br />
Requirements<br />
(Savolainen et al, 2005; Herald et al, 2009;<br />
Zowghi and Nurmuliani, 2002; Merola,<br />
RQ1<br />
Question Purpose Relevant references RQ<br />
Table 3.2: Mapping between the questionnaire questions and the research questions
3. RESEARCH METHODOLOGY<br />
Construct validity. Construct validity concerns the relationship between<br />
the observations from the study and the theories behind the research. The<br />
phrasing of questions is a threat to construct validity. The authors of this<br />
paper and an independent native English speaker and writer-reviewer revised<br />
the questionnaire to alleviate this threat. To minimize the risk of<br />
misunderstanding or misinterpreting the survey questions, a pilot study<br />
was conducted on master students in software engineering. No participant<br />
in the pilot study indicated that the requirements categories in question<br />
3 (<strong>Wnuk</strong>, 2011e) were hard to understand or vague. Still, the reader<br />
should keep in mind that the data given by respondents is not based on<br />
any objective measurements and thus its subjectivity affects the interpretation<br />
of the results. The mono-operational bias (Wohlin et al, 2000) threat to<br />
construct validity is addressed by collecting data from more than 200 respondents<br />
from 45 countries. Finally, the mono-method bias (Wohlin et al,<br />
2000) threat to construct validity was partly addressed by analyzing related<br />
publications. While several related publications have been identified<br />
(see Section 2), this threat is not fully alleviated and requires further studies.<br />
Finally, considering social threats to construct validity it is important<br />
to mention the evaluation apprehension threat (Wohlin et al, 2000). The<br />
respondents’ anonymity was guaranteed.<br />
Some may argue that using the same questionnaire to define the term<br />
and to investigate it threatens construct validity. However, the fact that<br />
the presented OSR definition is based on over 50% of the answers and<br />
that the definition turned out to be independent of the respondents’ roles,<br />
the size of the organizations, the length of the typical project, the domain<br />
and the development methodologies used gives us the basis to state that<br />
the understanding of the measured phenomenon was rather homogeneous<br />
among the respondents (Section 4.2). In addition, we do gain one aspect by<br />
combining the two, namely the subject’s interpretation/understanding of<br />
what an obsolete requirement is. We are able to identify if respondents disagree,<br />
a fact which is essential for combining results (several respondents<br />
answers) for analysis.<br />
Conclusion validity. Conclusion validity is concerned with the ability to<br />
draw correct conclusions from the study. To address the measures reliability<br />
threat, the questions used in the study were reviewed by the authors of<br />
this paper and one external reviewer, a native English speaker. The low statistical<br />
power threat (Wohlin et al, 2000) was addressed by using as suitable<br />
statistical tests as was possible on the given type of data. Before running<br />
the tests, we tested if assumptions of the statistical tests were not violated.<br />
However, since multiple tests were conducted on the same data, the risk<br />
of type-I error increases and using, for example, the Bonferroni correction<br />
should be discussed here. Since the correction was criticized by a number<br />
of authors (Arcuri and Briand, 2011; Nakagawa, 2004) it remains an<br />
open question if it should be used. Therefore, we report the p-values of all<br />
performed tests in case the readers want to evaluate the results using the<br />
183
PAPER III: OBSOLETE SOFTWARE REQUIREMENTS<br />
Bonferroni correction or other adjustment techniques (Arcuri and Briand,<br />
2011). Finally, the random heterogeneity of subjects (Wohlin et al, 2000)<br />
threat should be mentioned here as this aspect was only partly controlled.<br />
However, low heterogeneity of subjects allows us to state conclusions of a<br />
greater external validity.<br />
Internal validity. Internal validity threats are related to factors that affect<br />
the causal relationship between the treatment and the outcome. Reviews<br />
of the questionnaire and the pilot study addressed the instrumentation<br />
threat (Wohlin et al, 2000) to internal validity. The maturation threat<br />
to internal validity was alleviated by measuring the time needed to participate<br />
in the survey in the pilot study (15 minutes). The selection bias threat<br />
to internal validity is relevant as non-random sampling was used. Since<br />
the respondents were volunteers, their performance may vary from the<br />
performance of the whole population (Wohlin et al, 2000). However, the<br />
fact that 219 participants from 45 countries with different experience and<br />
industrial roles answered the survey minimizes the effect of this threat. Finally,<br />
the level of education in development processes and methodologies<br />
may have impacted the results from the survey. It remains future work to<br />
investigate whether this factor impacts the results. However, as the survey<br />
participants are professionals (many of whom work in large successful<br />
companies) their education might not be the main issue for discussion.<br />
What is interesting, however, is that we are investigating the state of current<br />
industry practice and not how it might be. Education is a powerful<br />
tool, but not the focus of this paper.<br />
External validity. External validity threats concern the ability to generalize<br />
the result of research efforts to industrial practice (Wohlin et al, 2000).<br />
The survey research method was selected to assure as many responses as<br />
possible, generating more general results (Easterbrook et al, 2008; Lethbridge<br />
et al, 2005; L. M. Rea, 1005) than a qualitative interview study. Moreover,<br />
the large number of respondents from various countries, contexts,<br />
and professions contributes to the generalization of results.<br />
4 Results and Analysis<br />
The survey was answered by 219 respondents. When questions allowed<br />
multiple answers, we calculated the results over the total number of answers,<br />
not respondents. For questions that used a Likert scale, we present<br />
the results using average rating and the percentage received by each answer<br />
on the scale. All results are presented in percentage form and complemented<br />
by the number of answers or respondents when relevant. The<br />
answers given to the open questions were analyzed using the open coding<br />
method Strauss and Corbin (1990) (Section 3.2.1). Statistical analysis, when<br />
relevant, was performed using the chi-square test (Siegel and Castellan,<br />
1998), and the complete results from the analysis, including contingency<br />
184
4. RESULTS AND ANALYSIS<br />
tables for some of the answers (<strong>Wnuk</strong>, 2011a), are listed online.<br />
4.1 Demographics<br />
%ofrespondents<br />
20%<br />
18%<br />
16%<br />
14%<br />
12%<br />
10%<br />
8%<br />
6%<br />
4%<br />
2%<br />
0%<br />
18%[40]<br />
13%[28]<br />
11%[25]<br />
8%[18]<br />
5%[12]<br />
5% [11]<br />
4%[8]<br />
3%[7]<br />
Figure 3.1: Top 10 countries among respondents<br />
Figure 3.1 depicts the top 10 respondent countries (out of 45) 2 . The<br />
full list of the countries is available in (<strong>Wnuk</strong>, 2011b). The US and the UK<br />
constitute about 30% of the total respondents and 54% of the respondents<br />
came from Europe.<br />
Figure 3.2 depicts the main roles of the respondents in their organizations.<br />
About one quarter of the respondents (24.9% or 54 respondents)<br />
described their role as requirements engineers, analysts or coordinators.<br />
The second largest category, Other (with 30 answers), include roles such as<br />
System Engineers, Software Quality Assurance, Process Engineers, and Business<br />
Analysts. The third largest category was Researchers or Academics (11.5% of<br />
all answers). Software Project Managers and Software Architect or Designer<br />
roles had the same number of respondents (22 each). Twelve respondents<br />
declared their main role as Software Product Manager, a relatively high number<br />
since product managers are generally few in an organization. This<br />
2 The actual category names have been changed for readability purposes. The original<br />
names are mentioned using italics in the paper and are available in the survey questionnaire<br />
(<strong>Wnuk</strong>, 2011e)<br />
185<br />
2%[5]<br />
2%[4]
PAPER III: OBSOLETE SOFTWARE REQUIREMENTS<br />
%ofrespondents<br />
30%<br />
25%<br />
20%<br />
15%<br />
10%<br />
5%<br />
0%<br />
24,9%[54]<br />
13,8%[30]<br />
11,5%[25]<br />
10,1%[22] 10,1%[22]<br />
8,3%[18]<br />
7,8%[17]<br />
5,5%[12] 5,5%[12]<br />
Figure 3.2: Main role of respondents<br />
1,4%[3]<br />
0,9%[2]<br />
would seem to indicate that middle and senior managers overall represented<br />
a substantial part of the respondents.<br />
Figure 3.3 gives an overview of the business domain of the respondents.<br />
A total of 32.8% stated the IT or Computer and Software Services. The second<br />
largest group (12.5%) is Engineering (automotive, aerospace and energy).<br />
These were followed by Telecommunication (10.7%) and Consultancy (9.3%).<br />
Figure 3.4 depicts the sizes of the respondents’ organizations. We can<br />
see that more than half of the respondents work in large companies (>501<br />
employees).<br />
Figure 3.5 looks at the average duration of a typical project in the respondents’<br />
organizations. About half of the respondents (∼45%) were involved<br />
in projects that lasted for less than a year, one quarter in projects<br />
that lasted between one and two years and one quarter in projects typically<br />
lasting more than two years.<br />
Figure 3.6 investigates the development methodologies and processes<br />
used by the respondents. Since this question allowed for the possibility<br />
of providing multiple answers, the results are based on the number of responses.<br />
Agile development tops the list of answers with approximately<br />
a quarter (23.6%). Incremental and evolutionary methodology (18.8%) is<br />
in second place. Surprisingly, waterfall is still common and widely used<br />
(17.7%). In the Other category, the respondents reported that they mixed<br />
several methodologies “combination of agile and incremental” or “it is a<br />
186
%ofresponses<br />
35%<br />
30%<br />
25%<br />
20%<br />
15%<br />
10%<br />
5%<br />
0%<br />
32,8%<br />
[123]<br />
12,5%<br />
[47]<br />
10,7%<br />
[40]<br />
9,3%<br />
[35] 7,3%<br />
[29] 6,1%<br />
[23]<br />
5%<br />
[19]<br />
5%<br />
[19]<br />
4. RESULTS AND ANALYSIS<br />
2,7%<br />
[10]<br />
3%<br />
[11]<br />
Figure 3.3: Types of business domains of respondents<br />
%ofrespondents<br />
60%<br />
50%<br />
40%<br />
30%<br />
20%<br />
10%<br />
0%<br />
12,5%[27]<br />
Lessthan10<br />
employees<br />
5,1%[11]<br />
11–20<br />
employees<br />
7,4%[16]<br />
21–50<br />
employees<br />
6%[13]<br />
51–100<br />
employees<br />
6,9%[15]<br />
101– 200<br />
employees<br />
1,9%<br />
[7]<br />
8,3%[18]<br />
201– 500<br />
employees<br />
Figure 3.4: Size of respondents’ organization<br />
1,6%<br />
[6]<br />
1,6%<br />
[6]<br />
53,7%[116]<br />
over501<br />
employees<br />
mix of incremental, agile and others”. Other respondents used “V-Model”,<br />
“SLIM”, “CMMI Level 3”, “CMMI Level 5” or had their own tailored methodology<br />
“created for each company by blending methods/processes”.<br />
187
PAPER III: OBSOLETE SOFTWARE REQUIREMENTS<br />
%ofrespondents<br />
30%<br />
25%<br />
20%<br />
15%<br />
10%<br />
5%<br />
0%<br />
6,8%[14]<br />
03<br />
months<br />
23,7%[49]<br />
4–6<br />
months<br />
20,8%[43]<br />
24,6%[51]<br />
9,2%[19]<br />
15%[31]<br />
7–12months 13–24months 25–36months Over37months<br />
Figure 3.5: Average duration of typical projects from our respondents<br />
%ofanswers<br />
25%<br />
20%<br />
15%<br />
10%<br />
5%<br />
0%<br />
23,6%<br />
[99]<br />
18,8%<br />
[79]<br />
17,1%<br />
[72]<br />
9,1%<br />
[38]<br />
7,6%<br />
[32]<br />
5,7%<br />
[24]<br />
5%<br />
[21]<br />
4,3%<br />
[18]<br />
3,8%<br />
[16]<br />
2,6%<br />
[11]<br />
2,4%<br />
[10]<br />
Figure 3.6: Development processes and methodologies<br />
Figure 3.7 investigates the type of requirements engineering the respondents<br />
are involved in. Since this question also allowed multiple answers,<br />
the results are calculated based on the total number of responses. Bespoke<br />
188
%ofanswers<br />
50%<br />
45%<br />
40%<br />
35%<br />
30%<br />
25%<br />
20%<br />
15%<br />
10%<br />
5%<br />
0%<br />
44,2%[164]<br />
29,3%[109]<br />
19,9%[74]<br />
4. RESULTS AND ANALYSIS<br />
5,1%[19]<br />
1,4%[5]<br />
Bespokeorcontract MDRE Outsourcedprojects OpenSource Other<br />
Figure 3.7: Types of Requirements Engineering<br />
or Contract driven requirements engineering received 44.2% of all the answers.<br />
Market-driven requirements engineering received 29.5%, while Open source<br />
only 5.1%. Outsourced projects appeared in 19.9% of the answers. Six answers<br />
were given to the Other category. Two respondents suggested none<br />
of the following. One was working with “normal flow, requirements from<br />
product owner or developers”, one with “builds” one mainly with infrastructure<br />
projects, and one with “large SAP implementation projects in a<br />
client organization”.<br />
4.2 Defining obsolete requirements (RQ1)<br />
Defining the term Obsolete Software Requirement (OSR) is central to the<br />
understanding of the phenomenon. The categories used in this question<br />
were inspired by the definitions of OSR found in literature (Section 2),<br />
and are defined in the context of the current release (Section 3.2.1). Figure<br />
3.8 depicts the answers from all respondents. Since the question allows<br />
multiple answers, the results are calculated for all the answers, not<br />
the respondents. The primary answer selected (29.9%) defines OSR as “no<br />
longer required for the current release for various reasons”. This result is in line<br />
with the definition of obsolete functionality provided by Zowghi and Nurmuliani<br />
(Zowghi and Nurmuliani, 2002). The definition of an OSR as a<br />
requirement that: “has no value for the potential users in the current release”<br />
received 21% if the responses. This category is similar to the definition of<br />
obsolete software applications provided by Merola (Merola, 2006), as ap-<br />
189
PAPER III: OBSOLETE SOFTWARE REQUIREMENTS<br />
Other(pleasespecify)<br />
isrejected/refusedtobeincluded<br />
isduplicated/redundant<br />
wasneverusedorimpl.intheproduct<br />
hasnovalueforthepotentialusers<br />
isnolongerrequired<br />
HowdoYoudefineanobsoletesoftwarerequirement<br />
7,7%[33]<br />
10%[70]<br />
14,5%[46]<br />
16%[62]<br />
21%[90]<br />
29,9%[128]<br />
0% 5% 10% 15% 20% 25% 30% 35%<br />
Figure 3.8: Respondents’ definition of an OSR<br />
plications are taken off the market due to decrease in product popularity<br />
or other market factors.<br />
A total of 33 responses (7.7%) were in the Other category. Of these, 8<br />
respondents (∼ 25%) suggested that an OSR is not necessarily confined to<br />
the current release, but it also goes to future releases. Respondents stressed<br />
that an OSR is a requirement that has lost its business goal or value. Other<br />
interesting definitions included: “an OSR is a requirement that evolved in<br />
concept but not in documentation”, “an OSR will be implemented but will<br />
not be tested”, and “carved by the IT to showcase technical capabilities to<br />
the end user”.<br />
As a result, the following definition of an OSR was formulated:<br />
“An obsolete software requirement is a software requirement (implemented<br />
or not) that is no longer required for the current release or future<br />
releases and, for various reasons, has little or no business value for the<br />
potential customers or users of a software product.”<br />
We performed statistical analyses to investigate whether there were relationships<br />
between the selected definition of OSRs and the respondents’<br />
roles, the size of organizations and the development methodologies used.<br />
Overall, the relationships were statistically insignificant due to violations<br />
of the chi-square test assumptions (some alternative answers had too few<br />
respondents, see Table A.2 in (<strong>Wnuk</strong>, 2011a)). However, significant results<br />
could be observed (using the chi-square test) between the top 5 methodologies<br />
( Figure 3.6) and the results for choice of OSR definition (p-value 0.011,<br />
Table A.2a in (<strong>Wnuk</strong>, 2011a)). Respondents that reported using a Rational<br />
Unified Process (RUP) methodology less frequently selected the definition<br />
of OSRs as no longer required for the current release (31.3% of all answers<br />
190
4. RESULTS AND ANALYSIS<br />
compared to over 50%) or never implemented in the product (34.4% of all<br />
answers compared to over 40%) than respondents that reported utilizing<br />
any of the remaining four methodologies. Moreover, the RUP respondents<br />
provided more answers in the Other category and indicated that OSRs can<br />
be “a requirement that evolved in concept but not in documentation” or<br />
“an abstract requirement to showcase the technical capability to the end<br />
user”. Finally, only three RUP respondents defined OSR as a requirement<br />
that is rejected for inclusiong in the current release, while about 20% of the<br />
respondents that selected the other top four methodologies selected this<br />
answer. This would seem to indicate that the perceived definition of an<br />
OSR for respondents using the RUP methodology is more stable than that<br />
for respondents using other methodologies.<br />
Since the RUP methodology considers iterative development with continuous<br />
risk analysis as a core component of the method (IBM, 2011), we<br />
can assume that the risk of keeping never used or implemented requirements<br />
in the projects is lower. Moreover, the majority of the RUP respondents<br />
also reported working on bespoke or contract-driven projects, where<br />
the number of changes after the contract is signed is limited and usually<br />
extensively negotiated. Thus it appears to be possible that the RUP respondents<br />
could avoid rejected or refused requirements and could manage<br />
to achieve more precise and stable agreements with their customers (IBM,<br />
2011) which in turn could result in fewer OSRs.<br />
Reviewing the top five methodologies, the most popular answer was<br />
no longer required for the current release. Interestingly, among the respondents<br />
working with agile, incremental or evolutionary methodologies, the<br />
fourth most popular answer was never used or implemented in the product.<br />
In contrast, respondents who worked with waterfall, prototyping or<br />
RUP methodologies have the same order of popularity of answers. The<br />
definition of an OSR as a was never used or implemented in the product requirement<br />
was the second most popular answer while the option is duplicated/redundant<br />
in the current release was the third most popular answer. The possible<br />
interpretation of these results is that agile and incremental methodologies<br />
less frequently experience OSRs as never used or implemented but<br />
experience more OSRs as duplicated requirements and requirements with<br />
no value for the potential users.<br />
Further analysis reveals that the definition of OSRs is not significantly<br />
related to the size of the companies, the length of the typical project, or<br />
the domain (p-values in all cases greater than 0.05). Domain and project<br />
length could be seen as qualifiers of OSRs. For example, projects running<br />
over long periods could suffer increased requirements creep (<strong>Wnuk</strong> et al,<br />
2009). However, this would most probably not be visible in the definition<br />
of OSRs, but rather in the impact of OSRs, which is investigated in the next<br />
section.<br />
191
PAPER III: OBSOLETE SOFTWARE REQUIREMENTS<br />
4.3 The potential impact of OSRs (RQ2)<br />
Serious<br />
39%<br />
Very<br />
serious<br />
6%<br />
Trivial<br />
10%<br />
Somehow<br />
serious<br />
45%<br />
Figure 3.9: Impact of OSRs on industry practice<br />
When queried about the potential impact of OSRs on their product development<br />
efforts a total of 84.3% of all respondents considered OSR to<br />
be Serious or Somehow serious (Figure 3.9). This indicates that among the<br />
majority of our respondents OSRs seems to have a substantial impact on<br />
product development. Our result confirms previous experiences. (See, e.g.,<br />
Murphy and Rooney (Murphy and Rooney, 2006), Stephen et al (Stephen<br />
et al, 2011) and Loesch and Ploederoeder (Loesch and Ploederoeder, 2007)).<br />
For 6% of the respondents OSRs are a Very serious issue, while 10% (21 respondents)<br />
deemed OSR a Trivial matter.<br />
To further decompose and test context variables, e.g., company size,<br />
respondents’ roles and development methodologies, we performed chisquare<br />
tests (Table A.1 in (<strong>Wnuk</strong>, 2011a)) between the context variables<br />
and the degree to which OSRs were considered having a substantial impact.<br />
The tests resulted in p-values greater than 0.05, which indicates that<br />
no statistically significant relationships between the analyzed factors could<br />
be seen. We can, however, ascertain that a clear majority of the respondents<br />
deemed the phenomenon of OSRs a relevant factor to be taken into consideration<br />
in development efforts.<br />
192
4. RESULTS AND ANALYSIS<br />
Of the 21 (10%) respondents who considered OSRs to be Trivial, approximately<br />
58% worked with requirements or in project management roles.<br />
This would seem to indicate that those respondents, contrary to those in<br />
software development roles, have less difficulty in managing OSRs. An<br />
analysis of the answers to questionnaire question 9 ( (<strong>Wnuk</strong>, 2011a) and<br />
Section 4.9) revealed that 10 respondents who considered OSRs to be Trivial<br />
also confirmed having a process for managing OSRs. Thus, it appears to be<br />
a logical conclusion that the negative influence of OSRs on product development<br />
could be alleviated by designing and introducing an appropriate<br />
process of managing OSRs. More about the current processes discovered<br />
among our respondents can be found in Section 4.9.<br />
Further analysis of the respondents who considered OSRs as Trivial indicated<br />
that more than 80% of them worked for large companies with ><br />
101 employees. Since large companies often use more complex process<br />
models (Berenbach et al, 2009), in contrast to small companies which might<br />
have budget constraints to prevent hiring highly quality professionals and<br />
whose processes are typically informal and rather immature (Quispe et al,<br />
2010), we could assume that the issue of managing OSRs could have been<br />
already addressed in these cases.<br />
Further analysis of the Trivial group indicated that almost half of them<br />
(47.6%) worked in the IT or computer and software services domain, In the<br />
service domain, the main focus of requirements engineering is to identify<br />
the services that match system requirements (Bano and Ikram, 2010). In<br />
the case of insufficient alignment of new requirements with the current<br />
system, product development may simply select a new, more suitable, service.<br />
This, in turn, might imply that the OSRs are discarded by replacing<br />
the old service with the new one. Further, the typical product lifetime for<br />
IT systems is usually shorter than for engineering-focused long-lead time<br />
products (Kossmann et al, 2009) (such as those in the aerospace industry),<br />
which in turn could minimize the number of old and legacy requirements<br />
that have to be managed. The possible interpretation of our analysis is that<br />
OSRs are less critical in IT and service oriented domains. Although this<br />
is a possible and plausible explanation, further investigation is needed to<br />
reach a conclusion.<br />
Among the respondents who considered OSRs Very serious (13 respondents),<br />
the majority (53.8%) worked in large companies and used agile,<br />
ad-hoc, or incremental methodologies (61.6%). This result seems to indicate<br />
that OSRs are also relevant for agile development and not reserved<br />
for only more traditional approaches like waterfall. Ramesh et al (Ramesh<br />
et al, 2010) pointed out after Boehm (Boehm, 2000) that quickly evolving requirements<br />
that often become obsolete even before project completion significantly<br />
challenge traditional (waterfall) requirements engineering processes.<br />
Murphy and Rooney (Murphy and Rooney, 2006) stressed that<br />
the traditional requirements process seriously contributes to the creation<br />
of obsolete requirements by creating a “latency between the time the re-<br />
193
PAPER III: OBSOLETE SOFTWARE REQUIREMENTS<br />
quirements are captured and implemented”. This latency should be lower<br />
in agile projects, characterized by shorter iterations and greater delivery<br />
frequency. This might indicate that either the latency is present in agile<br />
projects as well, or that latency is not the primary determinant of OSRs. It<br />
should be observed that 69.2% of the respondents who considered OSRs<br />
as Very serious reported having no process for handling OSRs. This could<br />
indicate why OSRs were considered a Very serious problem.<br />
The cumulative cross tabulation analysis of the respondents who considered<br />
OSRs Somehow serious, Serious or Very serious (total 196 respondents,<br />
89%) confirmed the severe impact of OSRs on large market-driven and outsourced<br />
projects (Section 4.7.2). Moreover, 76.8% of those respondents reported<br />
that they had no process, method, or tool for handling OSRs. In<br />
addition, 72.3% of respondents who considered OSRs Somehow serious, Serious<br />
or Very serious used manual methods to identify OSRs. It is also interesting<br />
to observe that the were only small differences between answers<br />
fron respondents who declared the following: Agile software development<br />
or Incremental or evolutionary development methodologies, and Waterfall development.<br />
Respondents using Waterfall development (and considered OSRs<br />
Serious or Somehow serious or Very serious) were somewhat more prone to<br />
dismiss the impact of OSRs compared to respondents using Agile software<br />
development or Incremental or evolutionary development methodologies. This<br />
would seem to indicate that, because waterfall-like processes usually restrict<br />
late or unanticipated changes and focus on extensive documentation<br />
(Sommerville, 2007; Cao and Ramesh, 2008; Curtis et al, 1987), the<br />
impact of OSRs in those processes could be minimized. However, it says<br />
nothing about the extent that the realized features were useful or usable<br />
for the customers. Some waterfall projects may not have perceived OSRs<br />
to be a major issue for the project, but they might be for the product per<br />
se. That is, implementing an outdated feature might not be a perceived as<br />
a problem in a project. At the product level, where the overall value of<br />
the product for the customer should be maximized through the selection<br />
of the right features to implement and best alternative investment should<br />
be considered, another feature could be implemented instead of the outdated<br />
one. This is a classical case of perspective being a part of the value<br />
consideration as described by Gorschek and Davis (2008).<br />
The type of requirements engineering context factor (Figure 3.7) only<br />
minimally influenced the overall results for this questionnaire question.<br />
Respondents who reported to work with Bespoke or contract driven requirements<br />
engineering graded OSRs slightly less serious than respondents who<br />
reported working with MDRE. This seems to indicate that OSRs are a problem<br />
in both contract driven (where renegotiation is possible (Regnell and<br />
Brinkkemper, 2005)) and market-driven (where time to market is dominant<br />
(Regnell and Brinkkemper, 2005)) projects. However, the difference<br />
could also indicate that there is a somewhat alleviating factor in contractbased<br />
development. That is, contract based development aims at deliver-<br />
194
4. RESULTS AND ANALYSIS<br />
ing features and quality in relation to stated contract, thus getting paid for<br />
a requirement even if it is out of date at delivery time. In an MDRE context,<br />
however, the product might fail to sell if the requirements are not fulfilled<br />
and the features out of date (Regnell and Brinkkemper, 2005).<br />
4.4 Requirements types and OSRs (RQ3)<br />
The respondents were asked to choose what types of requirements were<br />
most likely to become obsolete (Likert scale, 1 = Not likely, and5=Very<br />
likely). The classification was based on a review of several classification<br />
schemes Aurum and Wohlin (2005b); Shan et al (2010); Bourque and Dupuis<br />
(2004); Nurmuliani et al (2004). We chose to use the pre-defined “types” derived<br />
from classifications proposed by Harker et al (Harker et al, 1993) and<br />
McGee and Greer (McGee and Greer, 2009) because Harker et al (Harker<br />
et al, 1993) categorized software requirements based on their changing nature<br />
and McGee and Greer (McGee and Greer, 2009) developed a taxonomy<br />
of software requirements change sources based on knowledge and experience<br />
of project managers.<br />
Figure 3.10: Types of OSRs likely to become obsolete<br />
According to the results depicted in Figure 3.10, OSRs seem to belong<br />
to the categories of Incorrect or misunderstood requirements (mean 3.88), Inconsistent<br />
requirements (mean 3.74), or Ambiguous requirements (mean 3.72).<br />
While several studies focused on the problem of inconsistencies between<br />
requirements, e.g., by proposing techniques to identify and remove inconsistencies<br />
(Robinson and Pawlowski, 1999), decomposing a requirements<br />
specification into a structure of “viewpoints” (Russo et al, 1998), or distributing<br />
development of specifications from multiple views (Finkelstein<br />
et al, 1994) , they didn’t study inconsistent requirements as a potential<br />
195
PAPER III: OBSOLETE SOFTWARE REQUIREMENTS<br />
source of OSRs. From a becoming obsolete standpoint, the level and quality<br />
of specification should not matter per se. However, if the lack of quality<br />
of a requirement’s specification is seen as an indicator of a lack of investment<br />
in the analysis and specification of the requirement, several possible<br />
scenarios could emerge. For example, practitioners in industry might have<br />
a gut feeling that certain requirements will become OSRs and thus, are not<br />
worth the effort. Another possibility is that OSRs are harder (require more<br />
effort and knowledge) to specify than other requirements types, although,<br />
it could just as well indicate that most requirements are specified badly<br />
and thus are also OSRs. Further investigation is needed to investigate the<br />
potential reasons for the results achieved. The only thing we can say for<br />
certain is that requirements becoming obsolete seem to suffer from inadequacies<br />
in terms of correctness, consistency, and ambiguous specification.<br />
Interestingly, requirements from domain experts were considered less<br />
likely to become obsolete than requirements from customers, end users,<br />
and developers respectively. One explanation could be that domain experts<br />
possess the knowledge and experience of the domain, and thus their<br />
requirements may be less likely to change (Easterbrook, 2004). On the<br />
other hand, since the customers are the main source of software requirements<br />
and the main source of economic benefits to the company, their requirements<br />
are crucial to the success of any software project (Gorschek and<br />
Wohlin, 2005). This implies that this category must be kept up to date and<br />
thus be less likely to become obsolete. Another possible explanation could<br />
be that customer requirements are not as well or unambiguously specified<br />
as internal requirements (Gorschek and Wohlin, 2005; Lauesen, 2002), resulting<br />
in a tendency of those requirements to become obsolete faster or<br />
more frequently.<br />
Obsolescence of customer requirements, rather than internal requirements<br />
from domain experts, is confirmed by <strong>Wnuk</strong> et al (<strong>Wnuk</strong> et al, 2009).<br />
They reported that stakeholder priority dictates removal and postponement<br />
of the requirements realization, and domain experts are often part<br />
of the prioritization of all requirements. On the other hand, Kabbedijk et<br />
al (Kabbedijk et al, 2010) reported that change requests from external customers<br />
are more likely to be accepted than change requests from internal<br />
customers. This might imply that some customer requirements are handled<br />
as change requests instead of as requirements input to development<br />
projects. In both cases, the authors reported high requirements volatility,<br />
which is in line with the study by Zowghi and Nurmuliani (Zowghi and<br />
Nurmuliani, 2002) who related obsolete requirements related to requirements<br />
volatility.<br />
According to our respondents, requirements related to standards, laws<br />
and regulations are the least likely to become obsolete, which seems logical,<br />
as the lifetime of legislation and standards is often long in comparison<br />
to customer requirements. Furthermore, the low average score for the Requirements<br />
related to third party components e.g. COTS (even lower than for<br />
196
4. RESULTS AND ANALYSIS<br />
the requirements related to the company’s organization and policies) also<br />
seems to be logical, especially in relation to the results for RQ2 (Section 4.3)<br />
where almost half of the respondents who considered OSRs to be Trivial<br />
worked with IT or Computer and software services domain. We assume, after<br />
Bano and Ikram (Bano and Ikram, 2010), that COTS are used in the software<br />
service domain. The results for the respondents who worked with<br />
Outsourced projects (question 15 in (<strong>Wnuk</strong>, 2011e)) are in accordance with<br />
the overall results.<br />
The differences between the respondents who worked with Outsourced,<br />
MDRE and Bespoke or contract driven requirements engineering projects in relation<br />
to the degree of obsolescence of COTS requirements are subtle. This<br />
may suggest that other aspects not investigated in this study could influence<br />
the results. Although OSRs do not appear to be related to the main<br />
challenges of COTS systems, i.e., the mismatch between the set of capabilities<br />
offered by COTS products and the system requirements (Kohl, 2001),<br />
the nature of the COTS selection process, ( e.g. many possible systems to<br />
consider and possible frequent changes of the entire COTS solution ), may<br />
help to avoid OSRs.<br />
Further analysis of the influence of the context factors indicates that<br />
the respondents’ domains, company size, and methodologies have minimal<br />
impact on the results. Not surprising, more respondents who worked<br />
with projects running over longer time spans graded Functional requirements<br />
originated from end users as Very likely to become obsolete than respondents<br />
who worked with short projects (8.7% of respondents who worked<br />
with projects 1 year). One explanation could be that long projects, if deprived of<br />
direct and frequent communication with their customers and exposed to<br />
rapidly changing market situations, can face the risk of working on requirements<br />
that are obsolete from the users’ point of view. This interpretation<br />
is to some extent supported by the results from RQ7 ( Table 3.4)<br />
where the respondents graded MDRE contexts (characterized by limited<br />
possibilities to directly contact the end users and continuously arriving requirements<br />
(Regnell and Brinkkemper, 2005)) or Outsourced projects (where<br />
communication is often done across time zones and large distances (Holmstrom<br />
et al, 2006)) as more affected by OSRs than bespoke contexts. The<br />
success of Market-driven projects primarly depends on the market response<br />
to the proposed products (Regnell and Brinkkemper, 2005), which if released<br />
with obsolete functionality, may simply be required by customers.<br />
Thus, we believe that it is important to further investigate additional factors<br />
that could render Functional requirements originated from end users obsolete.<br />
197
PAPER III: OBSOLETE SOFTWARE REQUIREMENTS<br />
HowdoyoudiscoverOSRinareqdocumentordatabase<br />
Automatic<br />
Ineverfoundthem<br />
Other<br />
Ihaveapredefinedstatuscalledobsolete<br />
Manuallybyreview<br />
11%[24]<br />
15%[32]<br />
17%[38]<br />
17% [38]<br />
71%[154]<br />
0% 20% 40% 60% 80%<br />
Figure 3.11: Methods used to identify OSRs<br />
4.5 Methods to identify OSRs (RQ4)<br />
More than 50% of the answers pointed out that manual ways of discovering<br />
OSRs are currently the primary method ( Figure 3.11). At the same<br />
time, the context factors such as the different methodologies, types of RE,<br />
length of the projects, roles of respondents and the domain that respondents<br />
worked in did not significantly affect the top answer for this question.<br />
A total of 13.29% of all answers indicated the presence of a predefined<br />
“obsolete” status. Furthermore, 11.19% of all answers (32 answers) were<br />
given to the category I never found them or I never thought of finding them.<br />
Finally, less than 10% of all answers (24 answers) indicated the existence of<br />
any sort of automation to identify OSRs.<br />
In the Other category, seven respondents mentioned that OSRs could<br />
be identified “by execution of test cases based on requirements” or “during<br />
regression testing cycles”. Further, three answers suggested “using requirements<br />
traceability matrix while testing the software” while three answers<br />
suggested improved communication “by discussion of user stories<br />
with stakeholders”. Finally, one respondent suggested that goal-oriented<br />
requirements engineering makes “finding OSRs trivial”.<br />
The answers from respondents who indicated using automated ways<br />
of discovering OSRs provided some names for the automated techniques,<br />
e.g., “customized system based on JIRA that takes OSRs into account by using<br />
special view filters”, “traceability using DOORs to analyze for orphan<br />
and to track and status obsolete requirements”, or “a tool called Aligned<br />
Elements to detect any inconsistencies including not implemented requirements”.<br />
This would indicate that some tool support is present. However,<br />
198
4. RESULTS AND ANALYSIS<br />
tool efficiency and effectiveness was not part of this study.<br />
Further analysis indicated that the majority of respondents using tools<br />
of some sort worked with companies with > 501 employees (62%). This<br />
seems reasonable as large companies usually have more money for tool<br />
support (Quispe et al, 2010), and can even request especially tailored software<br />
from the requirements management tool vendors. The fact that automated<br />
methods to identify OSRs are rare among the smaller companies<br />
calls for further research into lightweight and inexpensive methods of OSR<br />
identification that can more easily be adapted in those companies. Furthermore,<br />
as both smaller and larger companies fall short in automation and<br />
assuming that larger companies can invest more money into education,<br />
this is probably not due to education either.<br />
More than half (15) of the respondents from the automated group also<br />
indicated that they identify OSRs manually. One explanation could be that<br />
automated methods are used together with manual methods, e.g., after<br />
the respondents manually mark requirements as obsolete or perform other<br />
preliminary analysis that enables automated sorting. Searching, tagging<br />
or filtering capabilities in their requirements management tools are most<br />
likely dominant and seen as automated in relation to OSRs, but this task<br />
is done in an ad-hoc manner and not integrated with their requirements<br />
management process. Thus the “level of automation” needs further investigation.<br />
The reasonably high number of answers given to the category I never<br />
found them or I never thought of finding them is intriguing and needs further<br />
investigation. Thirty respondents from this group (93.8%) also indicated<br />
having no process for managing OSRs. This seems logical as the inability<br />
to find OSRs could be related to the lack of processes for managing OSRs.<br />
Further, the majority of the respondents that indicated never finding OSRs<br />
worked with projects shorter than 12 months, and one fourth of them indicated<br />
having an ad-hoc process for managing requirements. The relatively<br />
short project times were not an indication of OSRs not being an issue as<br />
>80% of these same respondents indicated OSRs as being a Serious or Very<br />
serious issue. The absence of a defined and repeatable process might be a<br />
better indicator for not identifying OSRs in this case. In addition, waterfall<br />
was represented in more than 11% of the cases, while only about 6%<br />
worked in an agile manner.<br />
Neither organizational size nor development methodology were statistically<br />
significant factors in terms of how OSRs were discovered or identified<br />
(Table A.5 in (<strong>Wnuk</strong>, 2011a)). However, a statistically significant<br />
relationship was identified in relation to the top five methodologies and<br />
how OSRs were identified (chi-square test p
PAPER III: OBSOLETE SOFTWARE REQUIREMENTS<br />
(34%) selected the option I have a predefined status called obsolete than respondents<br />
who worked with agile methodology (10%). Looking further,<br />
we could also see that the majority of the respondents who worked with<br />
RUP or Prototyping methodologies also worked with companies with >201<br />
employees. This would seem to indicate that within the two mentioned<br />
methodologies it is possible to implement tool support for identification<br />
of OSRs. It is worth mentioning that a statistically significant relationship<br />
was also achieved between the top 5 methodologies and the results for<br />
choice of OSR definition (p-value 0.011, Table A.2a in (<strong>Wnuk</strong>, 2011a)) and<br />
Section 4.3. The results suggest that the respondents who worked with<br />
the RUP methodology may have a different opinion about the definition of<br />
OSRs and more frequently use a predefined status called obsolete to identify<br />
OSRs.<br />
Looking at the types of requirements engineering used, the results showed<br />
that the respondents who work with Bespoke or contract driven requirements<br />
engineering didn’t use predefined categories for OSRs; it was not part of<br />
their standard procedure to sort out OSRs. This seems to be logical as the<br />
majority of the respondent who admitted to never finding OSRs worked<br />
with bespoke or contract-driven projects. Finally, only one respondent<br />
mentioned automatic methods of finding OSRs.<br />
For the context factor of project length, longer projects have more automated<br />
ways of identifying OSRs (the difference is about 5%) than shorter<br />
projects. This seems reasonable as longer projects usually invest more into<br />
project infrastructure and project management tools and processes. However,<br />
a large part of the longer projects respondents also indicated manual<br />
methods of identifying OSRs (about 60% for projects >1year). In comparison,<br />
subjects typically working in shorter projects used more tool supported<br />
automated methods (about 52% for projects
Other<br />
Delete/removethemfromthedatabase/document<br />
Keepthem,butassignthemastatuscalled<br />
“obsolete”<br />
Movethemintoaseparatedsectiontitledobsolete<br />
requirementsorthelike<br />
Keepthem,butassignthemastatuscalled<br />
“obsolete”andwritethereasonwhytheybecome<br />
obsoleteforfuturereference<br />
6,6%[20]<br />
8,6%[26]<br />
8,9%[27]<br />
4. RESULTS AND ANALYSIS<br />
21,9%[66]<br />
54%[163]<br />
0% 10% 20% 30% 40% 50% 60%<br />
Figure 3.12: Methods used to manage identified OSRs<br />
the OSRs but assigned them a status called “obsolete” (see Figure 3.12).<br />
This might indicate that OSRs are a useful source of information about the<br />
history of the software product for both requirements analyst and software<br />
development roles. Moreover, 21.9% of all answers (66) suggested moving<br />
OSRs into a separated section in requirements documents. These views<br />
were the most popular among the respondents regardless of their role,<br />
methodology, domain, size, project length and context. One could interpret<br />
this response as indicating that the most suitable way to manage identified<br />
OSRs is to classify them as obsolete, supplying rationale, and move<br />
them into a separated section or document or SRS. However, maintaining<br />
traceability links between OSRs and other requirements could prove work<br />
intensive, especially if end-to-end traceability is required (Berenbach et al,<br />
2009). Regnell et al (Regnell et al, 2008) discuss scalable methods for managing<br />
requirements information where effective grouping of requirements<br />
e.g., placing semantically similar requirements in the same module, could<br />
enable more efficient maintenance of large structures of requirements (although<br />
OSRs were not mentioned specifically).<br />
Looking at the answers given the Other category, two answers suggested<br />
informing the stakeholders about assigning a requirement an obsolete<br />
status. Furthermore, two respondents suggested to “hide and tag<br />
requirements that are obsolete using requirements management tools”. Interestingly,<br />
one respondent questioned “why would you spend time in on<br />
201
PAPER III: OBSOLETE SOFTWARE REQUIREMENTS<br />
dealing with not needed things”. Since this person worked with a very<br />
small company with about 20 employees, we assume that the problem of<br />
overloaded database with legacy requirements is not known to this person.<br />
Finally, the other answers in this category mostly suggested keeping OSRs<br />
and optionally writing the justification.<br />
Most of the answers in the Other category (∼6%, 20 answers) suggested<br />
either removing OSRs, or keeping them, but moving them to a separated<br />
section or module in the database. Only ∼9% of answers (26) suggested<br />
deleting the OSRs from the requirements database or document. This suggests<br />
that most respondents think OSRs should be stored for reference and<br />
traceability reasons. However, keeping OSRs appears to be inconsistent<br />
with recommended practice for reducing the complexity of large and very<br />
large projects (Regnell et al, 2008; Buhne et al, 2004), and handling information<br />
overload as highlighted by Regnell et al (Regnell et al, 2008). The<br />
desired behavior in large and very large projects would seem to indicate<br />
the removal of unnecessary requirements to decrease the complexity of the<br />
requirements structure and traceability links. One possible avenue for further<br />
investigation is to evaluate the value of keeping OSRs.<br />
Of the group who opted for OSRs deletion upon identification, the<br />
majority of the answers came from respondents who worked with large<br />
companies (>501 employees, 77%) and long projects (>12 months, 53.9%).<br />
Moreover, a majority of these respondents considered OSRs to be Serious<br />
or Somehow serious ( Section 4.3). On the contrary, respondents that worked<br />
in smaller companies opted to keep OSRs.<br />
Analysis revealed a lack of statistically significant relationships between<br />
the answers for this question ( Figure 3.12) and the respondents’ roles, domains,<br />
organizational size and, methodologies used (Table A.6 in (<strong>Wnuk</strong>,<br />
2011a)). However, some indications could be observed. Respondents working<br />
in the engineering domain seemed to prefer the deletion of OSRs compared<br />
to respondents from other domains. One possible explanation could<br />
be that since the projects in the engineering domain are highly regulated,<br />
and often require end-to-end traceability (Berenbach et al, 2009), keeping<br />
OSRs in the scope could clutter the focus threatening to impede requirements<br />
and project management activities.<br />
Type of requirements engineering factor turned out to have a minimal<br />
impact on the results regarding this question. However, one observation<br />
worth mentioning is that more support was given to the option of<br />
removing OSRs among the respondents who worked with Bespoke or contract<br />
driven requirements engineering (12.3%) than respondents who worked<br />
in MDRE (9.2% of answers). This appears to be logical as, in bespoke<br />
projects, obsolete requirements could be discarded after the contract is fulfilled.<br />
In market-driven projects they could be kept and later used during<br />
the requirements consolidation task, where new incoming requirements<br />
could be examined against already implemented or analyzed requirements<br />
which include OSRs (Natt och Dag et al, 2006) .<br />
202
4. RESULTS AND ANALYSIS<br />
Table 3.3: OSRs effect on project size (215/219 respondents)<br />
Small-scale (∼10<br />
of req.)<br />
Medium-scale<br />
(∼100 of req.)<br />
Large-scale<br />
(∼1000 of req.)<br />
Very large-scale<br />
(>10000 of req.)<br />
(1) Not<br />
likely<br />
(2)<br />
Somewhat<br />
likely<br />
35.3% 35.8%<br />
(76) (77)<br />
9% (19) 31.6%<br />
(67)<br />
3.8% 17.1%<br />
(8) (36)<br />
8.1% 12.8%<br />
(17) (27)<br />
(3)<br />
Likely<br />
13.5%<br />
(29)<br />
41.5%<br />
(88)<br />
31.3%<br />
(66)<br />
16.6%<br />
(35)<br />
(4)<br />
More<br />
than<br />
likely<br />
7.0%<br />
(15)<br />
16.0%<br />
(34)<br />
32.7%<br />
(69)<br />
23.7%<br />
(50)<br />
(5)<br />
Very<br />
likely<br />
8.4%<br />
(18)<br />
1.9%<br />
(4)<br />
15.2%<br />
(32)<br />
38.9%<br />
(82)<br />
Rating<br />
Average<br />
4.7 Context factors and obsolete software requirements (RQ6<br />
and RQ7)<br />
4.7.1 Obsolete software requirements and project size<br />
The respondents were asked to indicate to what extent the phenomenon of<br />
OSRs would potentially (negatively) impact a project, and whether project<br />
size had anything to do with the likelihood of negative impact. The respondents<br />
used a Likert scale from 1 (Not likely impact) to 5 (a Very likely<br />
impact). The results are presented in Tables 3.3 and 3.4 below. The size<br />
classification is graded in relation to number of requirements and interdependencies,<br />
inspired by Regnell et al (Regnell et al, 2008).<br />
Column 7 in Table 3.3 presents the average rating for each project size.<br />
We see that the larger the project, the more likely there will be a negative<br />
effect from OSRs. Looking at Table 3.3 for Small-scale requirements projects,<br />
most respondents deemed OSR impact as Not likely (35.3%) or Somewhat<br />
likely (35.8%). However, moving up just one category to Medium-scale requirements<br />
projects with hundreds of requirements, the respondents indicated<br />
the impact as being Likely (41.5%). The trend continues with More<br />
than likely (32.7) for Large-scale requirements projects, and Very likely for Very<br />
large-scale requirements projects (38.9%). The results confirm the viewpoint<br />
of Herald et al (Herald et al, 2009) who listed OSRs as one of the risks in<br />
large integrated systems.<br />
One interesting observation is that the results could be seen as potentially<br />
contradictory to the results from questionnaire question 2 ( Section<br />
4.3) where the respondents who worked in larger companies (over<br />
100 employees) graded the overall impact of OSRs slightly lower than re-<br />
203<br />
2.17<br />
2.70<br />
3.38<br />
3.73
PAPER III: OBSOLETE SOFTWARE REQUIREMENTS<br />
Table 3.4: How likely OSRs affect various project types (215/219 respondents)<br />
Bespoke<br />
projects<br />
Market-driven<br />
projects<br />
Outsourced<br />
projects<br />
(1) Not<br />
likely<br />
14.4%<br />
(31)<br />
6.5%<br />
(14)<br />
2.3%<br />
(5)<br />
(2)<br />
Somewhat<br />
likely<br />
32.1%<br />
(69)<br />
20%<br />
(43)<br />
16.4%<br />
(35)<br />
(3)<br />
Likely<br />
26%<br />
(56)<br />
35.8%<br />
(77)<br />
35.7%<br />
(76)<br />
(4)<br />
More<br />
than<br />
likely<br />
16.3%<br />
(35)<br />
23.3%<br />
(50)<br />
27.2%<br />
(58)<br />
(5)<br />
Very<br />
likely<br />
11.2%<br />
(24)<br />
14.4%<br />
(31)<br />
18.3%<br />
(39)<br />
Rating<br />
Average<br />
spondents from smaller companies. However, since large companies often<br />
have large databases of requirements (Regnell et al, 2008) and often run<br />
projects with several thousands of requirements Konrad and Gall (2008),<br />
this would suggest that there are other factors that influence the impact of<br />
OSRs.<br />
When it comes to the influence of methodology used by our respondents,<br />
we report that the respondents who used Agile software development<br />
methodology primarily graded OSRs as only Likely to affect Large-scale requirements<br />
projects, while respondents who used Waterfall methodology<br />
primarily graded the impact of OSRs as More likely. Interestingly, this result<br />
seems to contradict the results for RQ2 (Section 4.3), where the majority of<br />
respondents who considered OSRs Very serious worked in large companies<br />
and used agile or incremental methodologies. This might indicate that the<br />
size of the project is not more dominant than the size of the company, and<br />
the methodology used. This requires further investigation.<br />
The respondents who worked with bespoke or contract driven requirements<br />
engineering primarily graded the effect of OSRs on Large-scale requirements<br />
projects as Likely. On the contrary, the respondents who worked<br />
with Market-driven projects primarily graded the impact of OSRs on Largescale<br />
requirements projects as Very Likely. This result confirms the results<br />
for RQ2 (Section 4.3) where OSRs were also graded less serious by respondents<br />
who worked in bespoke contexts. Finally, for the Very large-scale requirements<br />
projects our respondents primarily graded the impact of OSRs<br />
as Very likely regardless of context factors.<br />
204<br />
2.78<br />
3.19<br />
3.43
4.7.2 Obsolete software requirements and project types<br />
4. RESULTS AND ANALYSIS<br />
The respondents were also asked to rate how likely it was that OSRs affected<br />
various project types (on a scale from 1 to 5, where 1 is Not likely,<br />
and 5 is Very likely). The results for the average rating (column 7 in Table<br />
3.4) indicate that Outsourced projects are the most likely to be affected<br />
by OSRs (average rating 3.43). One possible explanation for this result<br />
could be the inherited difficulties of frequent and direct communication<br />
with customers and end users in Outsourced projects. Moreover, as communication<br />
in Outsourced projects often needs to be done across time zones<br />
and large distances (Holmstrom et al, 2006; Šmite et al, 2010), the risk of requirements<br />
misunderstanding increases, and as we have seen (Section 4.4),<br />
inadequately specified requirements run a higher risk of becoming OSRs.<br />
The high average rating for the Market-driven projects (average scope<br />
3.19) can be explained by the inherited characteristics of the MDRE context<br />
where it is crucial to follow the market and customer needs and the direct<br />
communication with the customer may be limited (Regnell and Brinkkemper,<br />
2005). This in turn can result in frequent scope changes (<strong>Wnuk</strong> et al,<br />
2009) that may render requirements obsolete. Finally, it is worth mentioning<br />
that the gap between the Market-driven projects and Bespoke projects (average<br />
score 2.78) is wider than between Outsourced (average scope 3.43) and<br />
Market-driven projects (average score 3.19). One possible explanation could<br />
be that both Market-driven projects and Outsourced projects suffer similar difficulties<br />
in directly interacting with the end users or customers (Regnell<br />
and Brinkkemper, 2005; Holmstrom et al, 2006) and thus the risk of requirements<br />
becoming obsolete could be higher.<br />
The results for all the categories and scales are presented in columns 2<br />
to 6 in Table 3.4. Our respondents primarily graded the impact of OSRs<br />
on Market-driven projects and Outsourced projects as Likely and only Somehow<br />
likely for Bespoke projects. Interestingly, the answer Very likely did not<br />
receive top scores for any of the three types of projects. This would seem to<br />
indicate that the “project type” factor is less dominant in relation to OSRs<br />
than the “size” of the project discussed earlier in this section.<br />
Since the statistical analysis between the results from the question and<br />
the context variables revealed no significant relationships, we performed<br />
descriptive analysis of the results. The respondents who indicated having<br />
a managerial role (32.7%) primarily graded the impact of OSRs on the<br />
Market-driven projects as More than likely, while the requirements analysts<br />
primarily graded this impact as only Likely. Similar to this result are the results<br />
for RQ2 (Section 4.3) where the managers primarily considered OSRs<br />
as Serious while requirements analysts predominantly considered it Somehow<br />
serious. The comparison is, however, not straight forward as in case of<br />
RQ2 where respondents were grading all types of requirements projects,<br />
not only Bespoke projects. Finally, the opinions of software development<br />
and management roles are aligned when grading the impact of OSRs on<br />
205
PAPER III: OBSOLETE SOFTWARE REQUIREMENTS<br />
bespoke projects (the majority of the respondents from both roles graded<br />
the impact as Somehow likely).<br />
In relation to project duration, interestingly, respondents who worked<br />
with smaller companies ( 201 employees selected the Somehow likely answer<br />
for the Bespoke projects and Market-driven projects. This result confirms the<br />
previous analysis (Section 4.7.1) by indicating that size is not the only factor<br />
that impacts the seriousness of OSRs. It can also be speculated that the<br />
phenomenon of OSRs might be clearer in smaller organizations where less<br />
specialization makes outdated requirements more “everybody’s concern”,<br />
while in larger organizations, with high specialization, the view of “not my<br />
job” might play a factor (Berenbach et al, 2009).<br />
4.8 Where in the requirements life cycle should OSRs be<br />
handled (RQ7)<br />
Other<br />
Requirementsvolatility<br />
Requirementselicitation<br />
Requirementstracking<br />
Requirementsprioritization<br />
Requirementsstatus.<br />
Requirementstraceability<br />
Requirementsspecification<br />
Requirementsanalysis<br />
Requirementsvalidation<br />
Requirementschanges<br />
3,6%[26]<br />
4,7%[34]<br />
6,4%[46]<br />
7,3%[52]<br />
7,7%[55]<br />
8,1%[58]<br />
9,1%[65]<br />
9,2%[66]<br />
15%[104]<br />
14,6%[105]<br />
14,8%[106]<br />
0% 2% 4% 6% 8% 10% 12% 14% 16%<br />
Figure 3.13: Requirements lifecycle stages for addressing OSRs<br />
The results for this question are presented in Figure 13 as percentages<br />
of the total number of answers (717) since the question allowed multiple<br />
answers. The list of phases (or processes) in the requirements engineering<br />
lifecycle was inspired by Nurmuliani and Zowghi (Zowghi and Nur-<br />
206
4. RESULTS AND ANALYSIS<br />
muliani, 2002). According to our respondents OSRs should first be handled<br />
during Requirements analysis, Requirements validation and Requirements<br />
changes phases (each with about 14% of the answers). This result is, to<br />
some extent in line with the study by Murphy and Rooney (2006), SWE-<br />
BOK (IEEE Computer Society, 2004), and Nurmuliani and Zowghi (Zowghi<br />
and Nurmuliani, 2002) who report that change leads to volatility, and volatility<br />
in its turn leads to obsolescence. However, less than 5% of the survey<br />
respondents indicate that OSRs should be managed as a part of chandling<br />
requirements volatility seems to support a distinction between volatility<br />
and the phenomenon of OSRs as such. That is, volatility may be related to<br />
OSRs; however, it needs to be handled continuously during analysis and<br />
validation as a part of change management in general.<br />
The high numbers of answers given to Requirements analysis (14.5%) and<br />
Requirements specification (9.2%) phases confirm the suggestions made by<br />
Savolainen et al (Savolainen et al, 2005) to manage OSRs in the requirements<br />
analysis phases. The low score in the Requirements elicitation phase<br />
answer (6.42% of all answers) contradicts the viewpoint of Merola (Merola,<br />
2006) who suggested managing obsolete software by continuous and timely<br />
market tracking and market trend change identification. This might seem<br />
to indicate that our respondents have difficulties understanding how OSRs<br />
could be managed, for example by finding and dismissing OSRs faster due<br />
to continuous elicitation depending on the accepted definition of OSRs.<br />
Respondents working with Agile software development methodologies<br />
preferred to handle OSRs as a part of the Requirements changes phase, while<br />
respondents working in a Waterfall manner preferred the Requirements validation<br />
phase. This seems logical, as a part of agile methodology is to embrace<br />
change (Ramesh et al, 2010), while waterfall philosophy sees OSRs<br />
as something to be “handled” more formally in a development step (focusing<br />
on the specification and validation phases) (Kotonya and Sommerville,<br />
1998).<br />
Type of requirements engineering context (Figure 3.7) did not seem to<br />
significantly influence answers for this question. Requirements analysis,<br />
validation, and changes phases seemed to be dominant for MDRE and Bespoke<br />
or contract driven requirements engineering alike. However, looking at<br />
company size and project duration, respondents from larger companies<br />
with longer projects focused on handling OSRs in specific phases, i.e., analysis<br />
and validation. This result seems reasonable as large projects usually<br />
require more extensive requirements analysis due to, e.g., the larger number<br />
of stakeholders involved and possible higher complexity of the system<br />
to be developed (Regnell et al, 2008; Berenbach et al, 2009; Buhne et al,<br />
2004).<br />
Looking at the answers given in the Other category, four answers suggested<br />
that OSRs should be managed in all phases of software lifecycle:<br />
one answer suggested all requirements management phases and one suggested<br />
quality assurance. Further investigation is needed.<br />
207
PAPER III: OBSOLETE SOFTWARE REQUIREMENTS<br />
4.9 Existing processes and practices regarding managing OSRs<br />
(RQ5)<br />
When queried about the existing processes and practices for managing<br />
OSRs, 73.6% of all respondents (159) indicated that their requirements engineering<br />
process does not take OSRs into consideration. This result can<br />
be interpreted as clear evidence of a lack of methods regarding OSRs in industry<br />
and confirms the need for developing methods for managing OSRs.<br />
At the same time, some processes for managing OSRs do exist, as indicated<br />
by 26.4% (57) of our respondents. The list of processes and methods used<br />
by our respondents include:<br />
• Reviews of requirements and requirements specifications (19 respondents)<br />
• Using tools and “marking requirements as obsolete” (6 respondents)<br />
• Requirements traceability (6 respondents)<br />
• Discussing and prioritizing requirements with customers in an agile<br />
context (4 respondents)<br />
• “Mark obsolete requirements as obsolete” (4 respondents) — these<br />
respondents did not indicate if using a tool or not.<br />
• During the requirements management process by identifying OSRs<br />
(3 respondents)<br />
• Moving OSRs into a separated section in the SRS (3 respondents)<br />
• Through a change management process (2 respondents)<br />
• During the requirements analysis process (1 respondent)<br />
• Having a proprietary process (1 respondent)<br />
The identified “categories” of processes and methods above provide<br />
further support for previous results from the survey. For example, the process<br />
of managing OSRs by requirements reviews overlaps the most popular<br />
way to identify OSRs ( Figure 3.11, Section 4.5), as indicated by our respondents.<br />
This would seem to indicate that manually reviewing requirements<br />
is dominant. Whether or not this is sufficient is another question<br />
which needs to be investigated further. The results confirm what was reported<br />
in Section 4.5, that automated methods for identification and management<br />
of OSRs are rare. Therefore, further research on scalable automatic<br />
methods for identification and management of OSRs is needed.<br />
Some respondents provided names or descriptions of processes and<br />
methods used for managing OSRs. Those reported include:<br />
208
4. RESULTS AND ANALYSIS<br />
• Projective analysis through modeling — Considered as a promising approach<br />
to study the complexity pertaining to systems of systems (Anderson<br />
et al, 2008), it requires a skilled “process modeler” to seamlessly<br />
use the modeling paradigm. If and how the method could be<br />
applied for smaller projects, and particularly for identification and<br />
management of OSRs remains an open question. Also, the technique<br />
is used during the requirements analysis phase which has been considered<br />
a good phase for management of OSRs by our respondents<br />
(Figure 3.13).<br />
• Hierarchical requirements’ tables — Specifying requirements on different<br />
abstraction levels is one of the fundamental techniques of requirements<br />
engineering that helps various stakeholders to understand requirements<br />
better (Lauesen, 2002). Considered as one of the requirements<br />
specification techniques, this could be promising according to<br />
our respondents (Figure 3.13). This method could be used to control<br />
OSRs to a certain degree as an overview of the requirements can be<br />
achieved, to some extent, through abstraction (Gorschek and Wohlin,<br />
2005). However, given large numbers of requirements, scalability of<br />
the method could be a problem.<br />
• Project governance — Support project control activities considering<br />
the environment in which project management is performed (Bekker<br />
and Steyn, 2008). By having greater time scope than ordinary project<br />
management, project governance could, according to our interpretation,<br />
be supportive in the task of continuous identification and management<br />
of OSRs.<br />
• Requirements tracking with risk management — Although we consider<br />
tracking and risk management (Lauesen, 2002) as separated activities,<br />
combining them for the purpose of managing OSRs is an interesting<br />
alternative potential. In particular, the role of risk management<br />
in identification and management of OSRs should be further<br />
investigated, as the software risk management literature does not appear<br />
to mention OSRs as one of the software risks (Boehm, 1991).<br />
• Requirements-based test plans — Aligning requirements with verification,<br />
although challenging, could be considered critical in assuring<br />
that the developed software fulfills customers’ needs. Creating test<br />
plans based on requirements that are up-to-date and properly reflect<br />
changing customer needs is considered a best practice in software<br />
projects (Pohl, 2010). OSRs may create mismatches and problems<br />
with alignment between requirements and test cases. The discovery<br />
of a test result that was correct, however presently wrong, can<br />
indicate that a requirement has become obsolete. We are, however,<br />
uncertain to what degree the practice of writing test plans based on<br />
209
PAPER III: OBSOLETE SOFTWARE REQUIREMENTS<br />
requirements could help in identification and management of OSRs.<br />
The fact that test plans are based on requirements is, to us, independent<br />
of the fact that these requirements may simply be obsolete.<br />
• Commenting out obsolete code and updating requirements documents accordingly<br />
— This technique of managing OSRs could be considered<br />
promising and should help to keep the requirements aligned with<br />
the newest version of the code. However, the technique seems to only<br />
consider implemented requirements that could be directly traced to<br />
the code level. Given the fact that many requirements (especially<br />
quality requirements) are cross-cutting and require implementation<br />
in several places (Lauesen, 2002) in the source code, an OSR may become<br />
even more cross cutting than before. In our opinion, it could<br />
be challenging to correctly map changes in the code to changes in requirements.<br />
Thus, mapping change in the code to changes in requirements<br />
could be part of a solution; however, it lacks the possibility to<br />
identify and remove OSRs prior to implementation.<br />
• Using requirements validation techniques to identify if requirements are no<br />
longer needed — Validating requirements is fundamental for assuring<br />
that the customer needs were properly and correctly understood<br />
by the development organization (Lauesen, 2002). In our opinion,<br />
this technique should be used together with customers who can confirm<br />
if the requirements are relevant. Our respondents also would<br />
like OSRs to be managed during requirements validation phase (Figure<br />
3.13). However, if requirements reviews are conducted in isolation<br />
from “customers” by e.g., requirements analysts, they could<br />
have difficulties in identifying which requirements are, or are about<br />
to become, obsolete. This is further aggravated if the development<br />
organization operates in a MDRE context.<br />
Looking at the context factors of organizational size, development methodology,<br />
and respondent role, although no statistically significant correlations<br />
could be observed, some interesting points warrant mentioning. Respondents<br />
from smaller companies (
4. RESULTS AND ANALYSIS<br />
flux in MDRE contexts (Regnell and Brinkkemper, 2005; Regnell et al, 2008),<br />
combined with frequent changes to requirements dictated by rapidly changing<br />
market situations. This in turn is resulting in more requirements becoming<br />
obsolete, forcing the use of methods to manage OSRs.<br />
Further statistical tests (Table A.8 in (<strong>Wnuk</strong>, 2011a)) indicated a statistical<br />
significance between the roles of respondents and the existence of processes<br />
to manage OSRs (p = 0.0012). There was also a moderate association<br />
(Cramer’s V = 0.345) between the respondents’ roles and the existence of<br />
requirements engineering processes that take OSRs into account. From the<br />
cross-tabulation table between the respondents’ roles and the existence of<br />
OSRs handling process (Table A.9 in (<strong>Wnuk</strong>, 2011a)) we can see that the<br />
respondents who worked in management positions (project and product<br />
managers) were more likely to utilize OSRs handling method compared to<br />
respondents who worked in software development roles, as developers.<br />
Further, the presence of a method or process that considers OSRs seems<br />
to decrease the negative impact of OSRs among our respondents, as 50% of<br />
the respondents who deemed OSRs Trivial confirmed having a process of<br />
managing OSRs (Section 4.3). Moreover, as requirements engineers as well<br />
as product and project managers usually work more with requirements<br />
engineering related tasks than software development roles, it appears to<br />
be logical that more methods of managing OSRs are reported among the<br />
management roles.<br />
4.10 Summary of results<br />
The results from the study are summarized in the following points:<br />
• Our respondents defined an OSR (RQ1) as: “a software requirement<br />
(implemented or not) that is no longer required for the current release<br />
or future releases, and it has no or little business value for the potential<br />
customers or users of a software artifact.” This definition seems<br />
to be homogeneous among our respondents (with a small exception<br />
for the respondents who used RUP methodologies).<br />
• OSRs constitute a significant challenge for companies developing software<br />
intensive products, with the possible exception of companies<br />
involved in the service domain. The phenomenon of OSRs is considered<br />
serious by 84.3% of our respondents (RQ2). At the same time<br />
73.6% of our respondents reported having no process for handling<br />
obsolete software requirements (RQ5).<br />
• Requirements related to standards and laws are the least likely to become<br />
obsolete, while inconsistent and ambiguous requirements are<br />
the most likely to become obsolete (RQ3). Moreover, requirements<br />
originating from domain experts were less likely to become obsolete<br />
211
PAPER III: OBSOLETE SOFTWARE REQUIREMENTS<br />
than requirements originating from customers or (internal) developers.<br />
• OSRs identification is predominantly a manual activity, and less than<br />
10% of the respondents reported having any automated functionality.<br />
They also confirmed that automatic identification of OSR is difficult<br />
which suggests research opportunities in creating automated methods<br />
for OSR identification and management (RQ4).<br />
• The identified OSRs should, according to more than 60% of the survey<br />
answers, be kept in the requirements document or the database,<br />
but tagged as obsolete. Deleting OSRs is not a desired behavior (RQ5).<br />
Most respondents opted for keeping the OSRs for purposes of reference<br />
and traceability, which seems to indicate that the identification<br />
of OSRs is not the only action, but a wish to potentially use the OSRs<br />
to minimize repeated work (e.g. specifying new requirements that<br />
are the same or similar to already identified OSRs). This is especially<br />
relevant in the MDRE context where “good ideas” can resurface as<br />
proposed by, for example internal developers.<br />
• Although there exist some methods and tool support for the identification<br />
and handling of OSRs, a clear majority of the respondents<br />
indicated no use of methods or tools to support them. Rather, adhoc<br />
and manual process seemed to dominate (RQ5). Moreover, even<br />
when the identification of OSRs was deemed central (e.g., for respondents<br />
working in longer duration projects), only some tool support<br />
and automation was present (mostly for bespoke projects), but even<br />
here manual processes and routines dominated (Section 4.5).<br />
• Project managers and product managers indicate that they always<br />
find OSRs in their work (Section 4.5), even if many of the respondents<br />
don’t actively look for them.<br />
• OSRs are more likely to affect Large-scale requirements and Very largescale<br />
requirements projects (RQ6). Larger projects (hundreds of requirements)<br />
tend to have larger issues related to the presence of OSRs,<br />
and there seems to be a correlation between impact severity and project<br />
size (amount of requirements). OSRs seem to have a somewhat larger<br />
impact on projects in a MDRE context as compared to bespoke or<br />
contract driven development (Section 4.7.2). However, for very-large<br />
projects (over 10 000 requirements) all respondents, independent of<br />
context factors, agree that the potential impact of OSRs was substantial.<br />
• According to the respondents, OSRs should first of all be handled<br />
during the Requirements analysis and Requirements validation phases<br />
(RQ7). At the same time, less than 5% of the answers indicate that<br />
212
5. CONCLUSIONS AND FURTHER WORK<br />
OSRs should be managed as a part of requirements volatility handling<br />
which supports the distinction between volatility and the phenomenon<br />
of OSRs as such. Finally, our respondents suggested that<br />
Requirements elicitation is not the best phase to manage OSRs.<br />
• Latency may not be the main determinant of OSRs becoming a problem.<br />
Rather, the results point to the lack of methods and routines for<br />
actively handling OSRs as a central determinant. This would imply<br />
that claimed low latency development models, like agile, has and can<br />
have problems with OSRs.<br />
5 Conclusions and Further Work<br />
Although the phenomenon of obsolete software requirements and its negative<br />
effects on project timelines and the outcomes have been reported in<br />
a number of publications (Hood et al, 2008b; Murphy and Rooney, 2006;<br />
Stephen et al, 2011; Merola, 2006; Cao and Ramesh, 2008), little empirical<br />
evidence exists that explicitly and exhaustively investigates the phenomenon<br />
of OSRs.<br />
In this paper, we report results from a survey conducted among 219<br />
respondents from 45 countries exploring the phenomenon of OSRs by: (1)<br />
eliciting a definition of OSRs as seen by practitioners in industry, (2) exploring<br />
ways to identify and manage OSRs in requirements documents<br />
and databases, (3) investigating the potential impact of OSRs, (4) exploring<br />
effects of project context factors on OSRs, and (5) defining what types<br />
of requirements are most likely to become obsolete.<br />
Our results clearly indicate that OSRs are a significant challenge for<br />
companies developing software systems — OSRs were considered serious<br />
by 84.3% of our respondents. Moreover, a clear majority of the respondents<br />
indicated no use of methods or tools to support identification and handling<br />
OSRs, and only 10% of our respondents reported having automated support.<br />
This indicates that there is a need for developing automated methods<br />
or tools to support practitioners in the identification and management<br />
of OSRs. These proposed methods need to have effective mechanisms for<br />
storing requirements tagged as OSRs, enabling the use of the body of OSRs<br />
as decision support for future requirements and their analysis. This could<br />
potentially enable automated regression analysis of active requirements,<br />
continuously identifying candidates for OSRs, and flagging them for analysis.<br />
Although manually managing OSRs is currently the dominant procedure,<br />
which could be sufficient in small projects, research effort should<br />
be directed towards developing scalable methods for managing OSRs —<br />
methods that scale to a reality that is often characterized by large numbers<br />
of requirements and a continuous and substantial influx of new requirements.<br />
The reality facing many product development organizations devel-<br />
213
PAPER III: OBSOLETE SOFTWARE REQUIREMENTS<br />
oping software intensive systems today is that OSRs are a problem, and<br />
as the amount and complexity of software increases so will the impact of<br />
OSRs.<br />
214
Bibliography<br />
REFERENCES<br />
Anderson W, Boxer PJ, Brownsword L (2008) An examination of a structural<br />
modeling risk probe technique. Tech. Rep. CMU/SEI-2006-SR-017,<br />
Software Engineering Institute, Carnegie Mellon University<br />
Anthes G (1994) No more creeps! are you a victim of creeping user requirements?<br />
Computerworld 28(18):107 – 110<br />
Arcuri A, Briand L (2011) A practical guide for using statistical tests to<br />
assess randomized algorithms in software engineering. In: Proceeding of<br />
the 33rd International Conference on Software Engineering, ACM, New<br />
York, NY, USA, ICSE ’11, pp 1–10<br />
Aurum A, Wohlin C (2005a) Engineering and Managing Software Requirements.<br />
Springer-Verlag New York, Inc., Secaucus, NJ, USA<br />
Aurum A, Wohlin C (2005b) Requirements engineering: Setting the context.<br />
In: Aurum A, Wohlin C (eds) Engineering and Managing Software<br />
Requirements, Springer Berlin Heidelberg, pp 1–15<br />
Bano M, Ikram N (2010) Issues and challenges of requirement engineering<br />
in service oriented software development. In: Proceedings of the Fifth<br />
International Conference on Software Engineering Advances (ICSEA),<br />
2010, pp 64 –69<br />
Bekker M, Steyn H (2008) The impact of project governance principles<br />
on project performance. In: Proceedings of the Portland International<br />
Conference on Management of Engineering Technology, 2008. PICMET<br />
2008., pp 1324 –1330<br />
Berenbach B, Paulish DJ, Kazmeier J, Rudorfer A (2009) Software & Systems<br />
Requirements Engineering: In Practice. Pearson Education Inc.<br />
Boehm B (1991) Software risk management: principles and practices. Software,<br />
IEEE 8(1):32 –41<br />
Boehm B (2000) Requirements that handle ikiwisi, cots, and rapid change.<br />
Computer 33(7):99–102<br />
Bourque P, Dupuis R (2004) Guide to the software engineering body of<br />
knowledge 2004 version. SWEBOK<br />
Buhne S, Halmans G, Pohl K, Weber M, Kleinwechter H, Wierczoch T<br />
(2004) Defining requirements at different levels of abstraction. In: Proceedings<br />
of the 12th IEEE International Requirements Engineering Conference,<br />
pp 346 – 347<br />
Cao L, Ramesh B (2008) Agile requirements engineering practices: An empirical<br />
study. Software, IEEE 25(1):60 –67<br />
215
REFERENCES<br />
Chen J, Reilly R, Lynn G (2005) The impacts of speed-to-market on new<br />
product success: the moderating effects of uncertainty. IEEE Transactions<br />
on Engineering Management 52(2):199 – 212<br />
Curtis W, Krasner H, Shen V, Iscoe N (1987) On building software process<br />
models under the lamppost. In: Proceedings of the 9th international conference<br />
on Software Engineering (ICSE 1987), pp 96–103<br />
Dawson C (2005) Projects in Computing and Information Systems: A Student’s<br />
Guide. Addison Wesley<br />
DeBellis M, Haapala C (1995) User-centric software engineering. IEEE Expert<br />
10(1):34 –41<br />
DeMarco T, Lister T (2003) Risk management during requirements. IEEE<br />
Software 20(5):99–101<br />
Easterbrook S (2004) What is requirements engineering? <br />
<br />
Easterbrook S, Singer J, Storey MA, Damian D (2008) Selecting empirical<br />
methods for software engineering research. In: Shull F, Singer J, Sjøberg<br />
D (eds) Guide to Advanced Empirical Software Engineering, Springer<br />
London, pp 285–311<br />
Finkelstein A, Gabbay D, Hunter A, Kramer J, Nuseibeh B (1994) Inconsistency<br />
handling in multiperspective specifications. IEEE Trans Softw Eng<br />
20(8):569–578<br />
Gorschek T, Davis A (2008) Requirements engineering: In search of the<br />
dependent variables. Inf Softw Technol 50:67–75<br />
Gorschek T, Wohlin C (2005) Requirements abstraction model. Requir Eng<br />
11:79–101<br />
Gorschek T, Garre P, Larsson S, Wohlin C (2007a) Industry evaluation of<br />
the requirements abstraction model. Requir Eng 12:163–190<br />
Gorschek T, Svahnberg M, Borg A, Loconsole A, Börstler J, Sandahl K,<br />
Eriksson M (2007b) A controlled empirical evaluation of a requirements<br />
abstraction model. Inf Softw Technol 49:790–805<br />
Gorschek T, Fricker S, Palm K, Kunsman S (2010) A lightweight innovation<br />
process for software-intensive product development. Software,<br />
IEEE 27(1):37 –45<br />
Gulk G, Verhoef C (2008) Quantifying requirements volatility effects. Sci<br />
Comput Program 72(3):136–175<br />
216
REFERENCES<br />
Harker S, Eason K, Dobson J (1993) The change and evolution of requirements<br />
as a challenge to the practice of software engineering. In: Proceedings<br />
of IEEE International Symposium on Requirements Engineering, pp<br />
266 –272<br />
Herald T, Verma D, Lubert C, Cloutier R (2009) An obsolescence management<br />
framework for system baseline evolution perspectives through the<br />
system life cycle. Syst Eng 12:1–20<br />
Holmstrom H, Conchuir E, Agerfalk PJ, Fitzgerald B (2006) Global software<br />
development challenges: A case study on temporal, geographical<br />
and socio-cultural distance. In: Proceedings of the International Conference<br />
on Global Software Engineering, ICGSE ’06., pp 3 –11<br />
Hood C, Wiedemann S, Fichtinger S, Pautz U (2008a) Change management<br />
interface. In: Requirements Management, Springer Berlin Heidelberg,<br />
pp 175–191<br />
Hood C, Wiedemann S, Fichtinger S, Pautz U (2008b) Requirements Management<br />
The Interface Between Requirements Development and All<br />
Other Systems Engineering Processes. Springer, Berlin<br />
Hood C, Wiedemann S, Fichtinger S, Pautz U (2008c) Requirements Management:<br />
The Interface Between Requirements Development and All<br />
Other Systems Engineering Processes. Springer-Verlag Berin<br />
Houston DX, Mackulak GT, Collofello JS (2001) Stochastic simulation of<br />
risk factor potential effects for software development risk management.<br />
Journal of Systems and Software 59(3):247 – 257<br />
Iacovou C, Dexter A (2004) Turning around runaway information technology<br />
projects. Engineering Management Review, IEEE 32(4):97 –112<br />
IBM (2011) The description of the method can be found at. <br />
<br />
IEEE (1997) IEEE recommended practice for software requirements specifications,<br />
830-1998. <br />
<br />
IEEE Computer Society (2004) Software Engineering Body of Knowledge<br />
(SWEBOK). Angela Burgess, EUA, URL <br />
Institute SE (2011) Capability maturity model integration (cmmi), version<br />
1.3. <br />
Kabbedijk J, K <strong>Wnuk</strong> BR, Brinkkemper S (2010) What decision characteristics<br />
influence decision making in market-driven large-scale software<br />
product line development? In: Proceedings of the Product Line Requirements<br />
Engineering and Quality workshop 2010, pp 42 –53<br />
217
REFERENCES<br />
Kohl R (2001) Changes in the requirements engineering processes for cotsbased<br />
systems. IEEE Computer Society, Los Alamitos, CA, USA, vol 0, p<br />
0271<br />
Konrad S, Gall M (2008) Requirements engineering in the development of<br />
large-scale systems. In: Proceedings of the 2008 16th IEEE International<br />
Requirements Engineering Conference, IEEE Computer Society, Washington,<br />
DC, USA, RE ’08, pp 217–222<br />
Kossmann M, Gillies A, Odeh M, Watts S (2009) Ontology-driven requirements<br />
engineering with reference to the aerospace industry. In: Proceedings<br />
of the Second International Conference on the Applications of Digital<br />
Information and Web Technologies, ICADIWT ’09, pp 95 –103<br />
Kotonya G, Sommerville I (1998) Requirements Engineering. John Wiley &<br />
Sons<br />
L M Rea RP (1005) Designing and Conducting Survey Research: A Comprehensive<br />
Guide. Jossey-Bass, San Francisco, CA, 94103-1741<br />
Lamsweerde A (2009) Requirements Engineering: From System Goals to<br />
UML Models to Software Specifications. John Wiley<br />
Lauesen S (2002) Software Requirements – Styles and Techniques.<br />
Addison–Wesley<br />
Legodi I, Barry M (2010) The current challenges and status of risk management<br />
in enterprise data warehouse projects in south africa. In: Proceedings<br />
of the Technology Management for Global Economic Growth<br />
(PICMET), pp 1 –5<br />
Lethbridge T, Sim E, Janice J (2005) Studying software engineers: Data collection<br />
techniques for software field studies. Empirical Software Engineering<br />
10:311–341<br />
Linkedin (2011) The linkedin website. <br />
Loconsole A, Borstler J (2005) An industrial case study on requirements<br />
volatility measures. In: Asia-Pacific Software Engineering Conference,<br />
pp 1–8<br />
Loesch F, Ploederoeder E (2007) Restructuring variability in software product<br />
lines using concept analysis of product configurations. In: Proceedings<br />
of the 11th European Conference on Software Maintenance and<br />
Reengineering, CSMR ’07., pp 159 –170<br />
Mannion M, Lewis O, Kaindl H, Montroni G, Wheadon J (2000) Representing<br />
requirements on generic software in an application family model. In:<br />
218
REFERENCES<br />
Proceedings of the 6th International Conerence on Software Reuse: Advances<br />
in Software Reusability, Springer-Verlag, London, UK, pp 153–<br />
169<br />
McGee S, Greer D (2009) A software requirements change source taxonomy.<br />
In: Proceedings of the Fourth International Conference on Software<br />
Engineering Advances, ICSEA ’09., pp 51 –58<br />
Merola L (2006) The cots software obsolescence threat. In: Proceedings of<br />
the Fifth International Conference on Commercial-off-the-Shelf (COTS)-<br />
Based Software Systems,p7pp.<br />
Monkey S (2011) Survey monkey webpage. <br />
<br />
Murphy D, Rooney D (2006) Investing in agile: Aligning agile initiatives<br />
with enterprise goals. Cutter IT Journal 19(2):6 –13<br />
Nakagawa S (2004) A farewell to Bonferroni: the problems of low statistical<br />
power and publication bias. Behavioral Ecology 15(6):1044–1045<br />
Natt och Dag J, Thelin T, Regnell B (2006) An experiment on linguistic<br />
tool support for consolidation of requirements from multiple sources in<br />
market-driven product development. Empirical Softw Engg 11:303–329<br />
Nurmuliani N, Zowghi D, Powell S (2004) Analysis of requirements volatility<br />
during software development life cycle. In: Proceedings of the 2004<br />
Australian Software Engineering Conference, pp 28 – 37<br />
Pohl K (2010) Requirements Engineering: Fundamentals, Principles, and<br />
Techniques, 1st edn. Springer Publishing Company, Incorporated<br />
Quispe A, Marques M, Silvestre L, Ochoa S, Robbes R (2010) Requirements<br />
engineering practices in very small software enterprises: A diagnostic<br />
study. In: XXIX International Conference of the Chilean Computer Science<br />
Society (SCCC), 2010, pp 81 –87<br />
Ramesh B, Cao L, Baskerville R (2010) Agile requirements engineering<br />
practices and challenges: an empirical study. Inf Syst J 20(5):449–480<br />
Regnell B, Brinkkemper S (2005) Market-driven requirements engineering<br />
for software products. In: Aurum A, Wohlin C (eds) Engineering and<br />
Managing Software Requirements, Springer Berlin Heidelberg, pp 287–<br />
308<br />
Regnell B, Svensson RB, <strong>Wnuk</strong> K (2008) Can we beat the complexity of very<br />
large-scale requirements engineering? In: Proceedings of the 14th international<br />
conference on Requirements Engineering: Foundation for Software<br />
Quality, Springer-Verlag, Berlin, Heidelberg, REFSQ ’08, pp 123–<br />
128<br />
219
REFERENCES<br />
Robertson S, Robertson J (1999) Mastering the requirements process. ACM<br />
Press/Addison-Wesley Publishing Co., New York, NY, USA<br />
Robinson W, Pawlowski D (1999) Managing requirements inconsistency<br />
with development goal monitors. IEEE Transactions on Software Engineering<br />
25(6):816–835<br />
Ruel H, Bondarouk T, Smink S (2010) The waterfall approach and requirement<br />
uncertainty: An in-depth case study of an enterprise systems implementation<br />
at a major airline company. Int J Technol Proj Manage<br />
(USA) 1(2):43 – 60<br />
Russo A, Nuseibeh B, Kramer J (1998) Restructuring requirements specifications<br />
for inconsistency analysis: A case study. In: Third IEEE International<br />
Conference on Requirements Engineering, IEEE Computer Society<br />
Press, pp 51–60<br />
Savolainen J, Oliver I, Mannion M, Zuo H (2005) Transitioning from product<br />
line requirements to product line architecture. In: Proceedings of the<br />
29th Annual International Computer Software and Applications Conference,<br />
COMPSAC 2005., vol 1, pp 186 – 195 Vol. 2<br />
Sawyer P (2000) Packaged software: Challenges for re. In: Proceedings of<br />
the Sixth International Workshop on Requirements Engineering: Foundations<br />
of Software Quality (REFSQ 2000), pp 137–142<br />
Shan X, Jiang G, Huang T (2010) The study on knowledge transfer of software<br />
project requirements. In: 2010 International Conference on Biomedical<br />
Engineering and Computer Science (ICBECS), pp 1 –4<br />
Siegel S, Castellan N (1998) Nonparametric statistics for the behavioral sciences,<br />
2nd edn. McGraw-Hill<br />
Singer J, Sim SE, Lethbridge TC (2008) Software engineering data collection<br />
for field studies. In: Shull F, Singer J, Sjøberg DIK (eds) Guide to<br />
Advanced Empirical Software Engineering, Springer London, pp 9–34<br />
Sommerville I (2007) Software Engineering. Addison–Wesley<br />
Sommerville I, Sawyer P (1997) Requirements Engineering: A Good Practice<br />
Guide. John Wiley & Sons<br />
Stephen J, Page J, Myers J, Brown A, Watson D, Magee I (2011) System<br />
error fixing the flaws in government it. Tech. Rep. 6480524, Institute for<br />
Government, London<br />
Strauss A, Corbin J (1990) Basics of Qualitative Research: Grounded Theory<br />
Procedures and Techniques. Sage Publications, Newbury Park, California<br />
220
REFERENCES<br />
Takahashi M, Kamayachi Y (1989) An empirical study of a model for<br />
program error prediction. IEEE Transactions on Software Engineering<br />
15:82–86<br />
Šmite D, Wohlin C, Gorschek T, Feldt R (2010) Empirical evidence in global<br />
software engineering: a systematic review. Empirical Softw Eng 15:91–<br />
118<br />
Wiegers KE (2003) Software Requirements, Second Edition. Microsoft<br />
Press, Redmond, WA, USA<br />
Wikipedia (2011) Likert scale. <br />
<br />
<strong>Wnuk</strong> K (2011a) The appendix with analysis can be accessed at.<br />
<br />
<br />
<strong>Wnuk</strong> K (2011b) The full list of countries can be obtained at.<br />
<br />
<br />
<strong>Wnuk</strong> K (2011c) The full list of mailing lists can be accessed at.<br />
<br />
<br />
<strong>Wnuk</strong> K (2011d) The full list of tool vendors can be accessed at.<br />
<br />
<br />
<strong>Wnuk</strong> K (2011e) The survey questionnaire. <br />
<br />
<br />
<strong>Wnuk</strong> K, Regnell B, Karlsson L (2009) What happened to our features?<br />
visualization and understanding of scope change dynamics in a largescale<br />
industrial setting. In: Proceedings of the 17th IEEE International<br />
Requirements Engineering Conference, RE ’09, pp 89 –98<br />
Wohlin C, Xie M, Ahlgren M (1995) Reducing time to market through<br />
optimization with respect to soft factors. In: Proceedings of the 1995<br />
IEEE Annual Engineering Management Conference, ’Global Engineering<br />
Management: Emerging Trends in the Asia Pacific’., International,<br />
pp 116 –121<br />
Wohlin C, Runeson P, Höst M, Ohlsson MC, Regnell B, Wesslén A (2000)<br />
Experimentation in software engineering: an introduction. Kluwer Academic<br />
Publishers, Norwell, MA, USA<br />
221
REFERENCES<br />
Zowghi D, Nurmuliani N (2002) A study of the impact of requirements<br />
volatility on software project performance. Asia-Pacific Software Engineering<br />
Conference 0:3<br />
222
Paper IV<br />
Are You Biting Off More Than You Can Chew? A<br />
Case Study on Causes and Effects of Overscoping<br />
in Large–Scale Software Engineering<br />
<strong>Krzysztof</strong> <strong>Wnuk</strong>, Elizabeth Bjarnason, ,Björn Regnell<br />
Department of Computer Science,<br />
Lund University, Sweden<br />
<br />
Information and Software Technology,<br />
Volume 54 Issue 10, October, 2012, Pages 1107-1124<br />
ABSTRACT<br />
Context: Scope management is a core part of software release<br />
management and often a key factor in releasing successful<br />
software products to the market. In a market-driven case, when<br />
only a few requirements are known a priori, the risk of overscoping<br />
may increase. Objective: This paper reports on findings<br />
from a case study aimed at understanding overscoping in<br />
large-scale, market-driven software development projects, and<br />
how agile requirements engineering practices may affect this<br />
situation. Method: Based on a hypothesis of which factors that<br />
may be involved in an overscoping situation, semi-structured<br />
interviews were performed with nine practitioners at a large,<br />
market-driven software company. The results from the interviews<br />
were validated by six (other) practitioners at the case<br />
company via a questionnaire. Results: The results provide a<br />
detailed picture of overscoping as a phenomenon including a<br />
number of causes, root causes and effects, and indicate that<br />
overscoping is mainly caused by operating in a fast-moving<br />
market-driven domain and how this ever-changing inflow of<br />
requirements is managed. Weak awareness of overall goals,<br />
in combination with low development involvement in early<br />
phases, may contribute to ’biting off’ more than a project can<br />
’chew’. Furthermore, overscoping may lead to a number of potentially<br />
serious and expensive consequences, including quality<br />
issues, delays and failure to meet customer expectations.<br />
Finally, the study indicates that overscoping occurs also when
PAPER IV: ARE YOU BITING OFF MORE THAN YOU CAN CHEW? ACASE<br />
STUDY ON CAUSES AND EFFECTS OF OVERSCOPING IN LARGE–SCALE<br />
SOFTWARE ENGINEERING<br />
applying agile requirements engineering practices, though the<br />
overload is more manageable and perceived to result in less<br />
wasted effort when applying a continuous scope prioritization,<br />
in combination with gradual requirements detailing and a close<br />
cooperation within cross-functional teams. Conclusion: The results<br />
provide an increased understanding of scoping as a complex<br />
and continuous activity, including an analysis of the causes,<br />
effects, and a discussion on possible impact of agile requirements<br />
engineering practices to the issue of overscoping. The<br />
results presented in this paper can be used to identify potential<br />
factors to address in order to achieve a more realistic project<br />
scope<br />
224
PAPER IV: ARE YOU BITING OFF MORE THAN YOU CAN CHEW? ACASE<br />
STUDY ON CAUSES AND EFFECTS OF OVERSCOPING IN LARGE–SCALE<br />
SOFTWARE ENGINEERING<br />
1 Introduction<br />
Maximizing the business value for a product and a set of available resources<br />
may sound like a simple task of selecting features according to the<br />
highest return of investment. However, in market-driven requirements engineering<br />
(MDRE) (Karlsson et al, 2007a; Regnell and Brinkkemper, 2005)<br />
software product managers face the challenge of managing continuously<br />
shifting market needs (Abramovici and Sieg, 2002) with a large number of<br />
new and changing requirements (Gorschek and Wohlin, 2006) caused both<br />
by a capricious market situation (DeBaud and Schmid, 1999) and by evolving<br />
technologies. In this situation, selecting which requirements to include<br />
into the next release of a software product, also called scoping (Schmid,<br />
2002) or project scoping (Project Management Institute, 2000), is a complex<br />
and continuous task of assessing and re-assessing how these scoping<br />
changes impact the common code base of the software product line (Pohl<br />
et al, 2005) on which those products are built (<strong>Wnuk</strong> et al, 2009). This domain<br />
scoping is considered part of the product line scoping (Schmid, 2002),<br />
which derives value from the opportunities to reuse functionality of the<br />
product line. These factors, combined with increased market com- petition<br />
and unpredictable market response to new products, force decision makers<br />
to continuously face the task of making and re-evaluating decisions in<br />
an ever evolving world (Aurum and Wohlin, 2003).<br />
Defining the scope of a product to fit a required schedule is a known<br />
risk in project management (Boehm, 1989) and in our previous work (<strong>Wnuk</strong><br />
et al, 2009) we found that the project scope at a large software company<br />
changed significantly throughout the entire project life cycle. These changes<br />
were partly due to overscoping, i.e. setting a scope that re- quires more<br />
resources than are available. Several researchers have focused on scope<br />
creep where the scope is increased by the developers, and highlighted<br />
this as a serious project risk (Carter et al, 2001; Crockford, 1980; Iacovou<br />
and Dexter, 2004). Others have investigated scoping as a part of release<br />
planning (Schmid, 2002; Svahnberg et al, 2010; <strong>Wnuk</strong> et al, 2009). However,<br />
no study has yet attempted to investigate the causes and effects of<br />
overscoping even though requirements engineering (RE) decision making<br />
is an acknowledged challenge (Alenljung and Persson, 2008; Aurum and<br />
Wohlin, 2003; Ngo-The and Ruhe, 2005). In this study, we have investigated<br />
this phenomenon of overscoping a project, or biting off more that<br />
you can chew, in particular in a market-driven and very-large scale RE<br />
(VLSRE) context (Regnell et al, 2008).<br />
Agile development processes claim to address several of the challenges<br />
involved in scoping frequently changing requirements. For example, in<br />
eXtreme programming (XP) (Beck, 1999) and Scrum (Schwaber and Beedle,<br />
2002) the balance between scope and available resources is managed by extreme<br />
prioritization and constant (re)planning of the scope in combination<br />
with time boxing of the individual development iterations. However, ag-<br />
226
1. INTRODUCTION<br />
ile requirements engineering (RE) practices have also been found to pose<br />
new challenges, e.g., in achieving con- sensus on priorities among multiple<br />
stakeholders and in creating accurate project plans (cost and timeline) for<br />
an entire project (Ramesh et al, 2010).<br />
The main goal of the case study reported on in this paper was to increase<br />
the understanding of factors involved in overscoping and thereby<br />
highlight this risk and take a step towards addressing and avoiding overscoping<br />
of projects. To achieve this, the study was designed to answer the<br />
following questions:<br />
• (RQ1) What causes over- scoping?<br />
• (RQ2) What are the resulting effects of overscoping?<br />
• (RQ3) How may agile RE practices impact the causes and effects of<br />
overscoping?<br />
The case study has been conducted at a large market- driven software development<br />
company that has started to shift to- wards a more agile way of<br />
working. The study includes interviews with nine practitioners working<br />
with requirements engineering, software development and product testing.<br />
The interview results were then validated via a questionnaire with<br />
another six practitioners from the case company. The contribution of the<br />
presented work includes eight main causes of overscoping complemented<br />
by a number of root causes, and nine main effects of overscoping. In addition,<br />
the results indicate that three of the agile RE practices adopted by the<br />
case company may impact some of these causes and root causes and, thus,<br />
may also reduce the effects of overscoping.<br />
Partial results from this study have previously been published as workshop<br />
publications in (Bjarnason et al, 2010) where overscoping was preliminarily<br />
investigated and in (Bjarnason et al, 2011a) where preliminary results<br />
on the benefits and side effects of agile RE practices were published.<br />
For this article, the results are extended with (1) additional causes, root<br />
causes and effects of overscoping; (2) additional empirical results on overscoping<br />
from 6 (other) practitioners; and (3) details on the impact of agile<br />
RE practices specifically on overscoping. These extensions were achieved<br />
by further analysis of the full interview material and further validation of<br />
the results through a questionnaire.<br />
The remainder of this paper is structured as follows: Section 2 describes<br />
related work. Section 3 describes the case company, while the research<br />
method is outlined in Section 4. The results are reported in Section 5 for<br />
the interviews and in Section 6 for the validation questionnaire. In Section<br />
7, the results are interpreted and related to other work, and limitations and<br />
validity threats are discussed. Finally, Section 8 contains conclusions and<br />
further work.<br />
227
PAPER IV: ARE YOU BITING OFF MORE THAN YOU CAN CHEW? ACASE<br />
STUDY ON CAUSES AND EFFECTS OF OVERSCOPING IN LARGE–SCALE<br />
SOFTWARE ENGINEERING<br />
2 Related work<br />
Unrealistic schedules and budgets are among the top ten risks in software<br />
engineering (Boehm, 1989) and some reasons for overloading projects with<br />
scope have been suggested. For example, DeMarco and Lister (2003) mentioned<br />
that a failure among stakeholders to concur on project goals (also<br />
one of the challenges of agile RE (Ramesh et al, 2010)) can result in an excessive<br />
scope burden on a project. Project overload may also result from<br />
sales staff agreeing to deliver unrealistically large features without considering<br />
scheduling implications (Hall et al, 2002). Furthermore, scope that<br />
is extended beyond the formal requirements by the developers, i.e. scope<br />
creep, is stated by Iaconou and Dexter (Iacovou and Dexter, 2004) as a factors<br />
leading to project failures. Scope creep is also mentioned as having<br />
a big impact on risk and risk management in enterprise data warehouse<br />
projects (Legodi and Barry, 2010). In addition, it is listed as one of five<br />
core risks during the requirements phase, and is a direct consequence of<br />
how requirements are gathered (DeMarco and Lister, 2003). On the other<br />
hand,Gemmer (1997) argues that people’s perceptions of risk and their subsequent<br />
behavior is overlooked within risk management and that an increased<br />
awareness of causes and effects of risks may lead to an improved<br />
discussion and management of these risks (Gemmer, 1997). Some methods<br />
and tools to mitigate and manage risks related to scoping have been presented<br />
(Crockford, 1980). For example, Carter et al (2001) suggested combining<br />
evolutionary prototyping and risk-mitigation strategy to mitigate<br />
the negative effects of scope creep. However, the full issue of overscoping<br />
is not explicitly named as a risk in the related work, nor empirically<br />
investigated for their causes and consequences.<br />
Requirements engineering (RE) is a decision intense part of the software<br />
engineering process (Aurum and Wohlin, 2003), which can support<br />
and increase the probability of success in the development process (Aurum<br />
and Wohlin, 2005a). However, the efficiency and effectiveness of RE decision<br />
making has cognitive limitations (Aurum and Wohlin, 2003), due to<br />
being a knowledge intensive activity. Furthermore, research into the field<br />
of RE decision making is still in its infancy (Alenljung and Persson, 2008;<br />
Ngo-The and Ruhe, 2005). A major challenge in this research (according<br />
to Alenljung and Persson) lies in understanding the nature of RE decision<br />
making and identifying its obstacles (Alenljung and Persson, 2008) and<br />
several authors (Alenljung and Persson, 2008; Aurum and Wohlin, 2003,<br />
2005a; Ngo-The and Ruhe, 2005) mention the need to: (1) identify decision<br />
problems in the RE process; (2) perform empirical studies of RE decision<br />
making; and (3) examine how non-technical issues affect or influence decision<br />
making. Communication gaps are an example of such non-technical<br />
issues which have been reported to negatively affect the decision making<br />
and contribute to defining an unrealistic scope (Bjarnason et al, 2011b).<br />
There are two characteristics of MDRE (Regnell and Brinkkemper, 2005)<br />
228
2. RELATED WORK<br />
which further aggravates RE decision making, namely a lack of actual customers<br />
with which to negotiate requirements (Karlsson and Ryan, 1997;<br />
Potts, 1995) and a continuous inflow of requirements from multiple channels<br />
(Karlsson et al, 2007a; Gorschek and Wohlin, 2006). As a result, rather<br />
than negotiate with specific customers, the demands and requirements of<br />
an anonymous consumer market have to be ’invented’ (Potts, 1995) through<br />
market research. Moreover, the success of the final product is primarily<br />
validated by the market with the uncertainty (Regnell and Brinkkemper,<br />
2005) of how well the ’invented’ requirements compare to the market<br />
needs. Commonly, market research continuously issues more requirements<br />
(Regnell and Brinkkemper, 2005) than can be handled with available<br />
resources. A state of congestion then occurs in the MDRE process (Karlsson<br />
et al, 2007a) and the set of requirements to implement in the next project<br />
has to be selected using prioritization techniques based on market predictions<br />
and effort estimates (Carlshamre, 2002; Karlsson and Ryan, 1997; Jørgensen<br />
and Shepperd, 2007).<br />
Scope management is considered as one of the core functions of software<br />
release planning and a key activity for achieving economic benefits<br />
in product line development (Schmid, 2002). Accurate release planning is<br />
vital for launching products within the optimal market window. And, this<br />
is a critical success factor for products in the MDRE domain (Sawyer, 2000).<br />
Missing this window might cause both losses in sales and, additional cost<br />
for prolonged development and delayed promotion campaigns. However,<br />
making reliable release plans based on uncertain estimates (Karlsson et al,<br />
2007a) and frequently with features with dependencies to other features<br />
(Carlshamre et al, 2001) is a challenge in itself. In addition, a rapidly changing<br />
market situation may force a project to consider new market requirements<br />
at a late project stage. Release planning is then a compromise where<br />
already committed features may need to be sacrificed at the expense of<br />
wasted effort (<strong>Wnuk</strong> et al, 2009) of work already performed. The area of<br />
release planning is well researched and Svahnberg et al reported on 24<br />
strategic release planning models presented in academic papers intended<br />
for market-driven software development (Svahnberg et al, 2010). Furthermore,<br />
Wohlin and Aurum investigated what is important when deciding<br />
to include a software requirement in a project or release (Wohlin and Aurum,<br />
2005). Despite this, the understanding of the challenges related to<br />
scope management and their causes and effects is still low.<br />
Scoping in agile development projects mainly involves three of the agile<br />
RE practices identified by Ramesh et al (2010), namely extreme prioritization,<br />
constant planning and iterative RE. High-level requirements are prioritized<br />
and the features with the highest market value are developed first. This<br />
approach ensures that if the project is delayed launch may still be possible<br />
since the most business-critical requirements will already be developed.<br />
Ramesh et al (2010) identified a number of benefits for companies applying<br />
these agile RE practices, but also challenges and varying impact on project<br />
229
PAPER IV: ARE YOU BITING OFF MORE THAN YOU CAN CHEW? ACASE<br />
STUDY ON CAUSES AND EFFECTS OF OVERSCOPING IN LARGE–SCALE<br />
SOFTWARE ENGINEERING<br />
risks. The identified benefits include an ability to adapt to changing prioritization<br />
of requirements, as well as, a clearer understanding of what the<br />
customers want, thus reducing the need for major changes. On the other<br />
hand, agile RE practices were found to include challenges in (1) correctly<br />
estimating and scheduling for the full project scope (which continuously<br />
changes), (2) a tendency to omit quality requirements and architectural issues<br />
(with the risk of serious and costly problems over time), and (3) constant<br />
re-prioritization of the requirements (with subsequent instability and<br />
waste) (Ramesh et al, 2010).<br />
3 The case company<br />
The case company has around 5000 employees and develops embedded<br />
systems for a global market using a product line approach (Pohl et al, 2005).<br />
The projects in focus for this case study are technology investments into an<br />
evolving common code base of a product line (a.k.a. platform) on which<br />
multiple products are based. There are several consecutive releases of this<br />
platform where each release is the basis for one or more products. The<br />
products mainly reuse the platform’s functionality and qualities, and contain<br />
very little product-specific software. A major platform release has a<br />
lead time of approximately 2 years from start to launch, and is focused<br />
on functionality growth and quality enhancements for a product portfolio.<br />
For such projects typically around 60-80 new features are added, for which<br />
approximately 700-1000 system requirements are produced. These requirements<br />
are then implemented by 20-25 different development teams with,<br />
in total, around 40-80 developers per team assigned to different projects.<br />
The requirements legacy database amounts to a very complex and large<br />
set of requirements, at various abstraction levels, in the order of magnitude<br />
of 20,000 entities. This makes it an example of the VLSRE (very-large<br />
scale RE) context (Regnell et al, 2008). Both the flow of new requirements<br />
(added to and removed from the scope of platform projects) and the scoping<br />
decisions associated with this ?ow may change frequently and rapidly.<br />
This exposes the project management to a series of unplanned, and often<br />
difficult, decisions where previous commitments have to be changed or<br />
canceled.<br />
3.1 Organisational set-up<br />
Several organizational units within the company are involved in the development.<br />
For this case study, the relevant units are: the requirements unit<br />
that manages the scope and the requirements; the software unit that develops<br />
the software for the platform; and the product unit that develops products<br />
based on the platform releases. In addition, there is a usability design<br />
unit responsible for designing the user interface. Within each unit there are<br />
230
3. THE CASE COMPANY<br />
several groups of specialists divided by technical area. These specialists are<br />
responsible for the work in various stages of the development process. For<br />
this study, the most essential groups are the requirements teams (RTs) (part<br />
of the requirements unit) that, for a specific technical area, define the scope,<br />
and elicit and specify system requirements, and the development teams<br />
(DTs) (part of the software unit) that design, develop and maintain software<br />
for the (previously) defined requirements. Each RT has a team leader<br />
who manages the team. Another role belonging to the requirements unit<br />
is the requirements architect who is responsible for managing the overall<br />
scope, which includes coordinating the RTs. In the DTs there are several<br />
roles, namely<br />
• Development team leader who leads and plans the team’s work for<br />
the implementation and maintenance phases;<br />
• Development team requirements coordinator who leads the team’s<br />
work during the requirements management and design phase, and<br />
coordinates the requirements with the RTs;<br />
• Developer who designs, develops and maintains the software;<br />
• Tester who verifies the software.<br />
The software unit also has a project management team consisting of<br />
(among others): quality managers who set the target quality levels and follow<br />
up on these, and software project managers who monitor and coordinate<br />
the DTs and interact with the requirements architects. For the product<br />
development unit in this study, we focus on the system testing task from<br />
the viewpoint of the functionality and quality of the platform produced by<br />
the software unit.<br />
3.2 Phase-based process<br />
The company used a stage-gate model. There were milestones (MS) for<br />
controlling and monitoring the project progress. In particular, there were<br />
four milestones for the requirements management and design (MS1-MS4)<br />
and three milestones for the implementation and maintenance (MS5-MS7).<br />
For each of these milestones, the project scope was updated and baselined.<br />
The milestone criteria were as follows:<br />
• MS1: At the beginning of each project, RT roadmap documents were<br />
extracted to formulate a set of features for an upcoming platform<br />
project. A feature in this case is a concept of grouping requirements<br />
that constitute a new functional enhancement to the platform. At<br />
this stage, features contained a description sufficient for enabling estimation<br />
of its market value and implementation effort, both of which<br />
were obtained using a cost-value approach (Karlsson and Ryan, 1997).<br />
231
PAPER IV: ARE YOU BITING OFF MORE THAN YOU CAN CHEW? ACASE<br />
STUDY ON CAUSES AND EFFECTS OF OVERSCOPING IN LARGE–SCALE<br />
SOFTWARE ENGINEERING<br />
These values were the basis for initial scoping inclusion for each technical<br />
area when the features were reviewed, prioritized and approved.<br />
The initial scope was decided and baselined per RT, guided by a<br />
project directive and based on initial resource estimates given by the<br />
primary receiving (main) DT. The scope was then maintained in a<br />
document called feature list that was updated each week after a meeting<br />
of the change control board (CCB). The role of the CCB was to<br />
decide upon adding or removing features according to changes that<br />
occur.<br />
• MS2: The features were refined to requirements and specified by the<br />
RTs, and assigned to their main DTs, responsible for designing and<br />
implementing the feature. The requirements were reviewed with the<br />
main DTs and were then approved. Other (secondary) DTs that were<br />
also affected by the features were identified. The DTs make an effort<br />
estimate per feature for both main and secondary DT.<br />
• MS3: The DTs had refined the system requirements and started designing<br />
the system. The set of secondary DTs were refined along with<br />
the effort estimates, and the scope was updated and baselined.<br />
• MS4: The requirements refinement work and the system design were<br />
finished, and implementation plans were produced. The final scope<br />
was decided and agreed with the development resources, i.e. the<br />
software unit.<br />
• MS5: All requirements had been developed and delivered to the platform.<br />
• MS6: The software in the platform had been stabilized and prepared<br />
for customer testing.<br />
• MS7: Customer-reported issues had been handled and the software<br />
updated. The software was ready to be released.<br />
According to the company’s process guidelines, the majority of the scoping<br />
work should have been done by MS2. The requirements were expressed<br />
using a domain-specific, natural language, and contained many<br />
special terms that required contextual knowledge to be understood. In<br />
the early phases, requirements contained a customer-oriented description<br />
while later being refined to detailed implementation requirements.<br />
3.3 Agile development process<br />
In order to meet the challenges of managing high requirements volatility,<br />
the case company was introducing a new development process at the time<br />
of this study. The size and complexity of the soft- ware development, including<br />
the usage of product lines, remained the same irrespective of the<br />
232
3. THE CASE COMPANY<br />
process used. The new process has been influenced by ideas and principles<br />
from the agile development processes eXtreme programming (XP) (Beck,<br />
1999) and Scrum (Schwaber and Beedle, 2002). The phase-based process<br />
was replaced by a continuous development model with a toll-gate structure<br />
for the software releases of the software product line (to allow for<br />
coordination with hardware and product projects, see P1 below). The responsibility<br />
for requirements management was transferred from the (previous)<br />
requirements unit, partly into the business unit and partly into the<br />
software unit. The following agile RE practices were being introduced:<br />
• One continuous scope and release-planning flow (P1). The scope for all<br />
software releases is continuously planned and managed via one prioritybased<br />
list (comparable to a product backlog). The business unit gathers<br />
and prioritizes features from a business perspective. All new<br />
high-level requirements are continuously placed into this list and prioritized<br />
by the business unit. The software unit estimates the effort<br />
and potential delivery date for each feature based on priority and<br />
available software resource capacity. Development is planned and<br />
executed according to priority order. Planning and resource allocation<br />
is handled via one overall plan which contains all the resources<br />
of the software unit. The scope of the platform releases are synchronized<br />
with the product releases by gradual commitment to different<br />
parts of the scope. Critical scope is requested to be committed for<br />
specific product releases, while non-critical features are assigned to<br />
product releases when they are implemented and ready to be integrated<br />
into the platform.<br />
• Cross-functional development teams (P2) that include a customer representative<br />
assigned by the business unit (comparable to the agile<br />
practice of customer proxy) have the full responsibility for defining<br />
detailed requirements, implementing and testing a feature (from<br />
the common priority-based list). Each new feature is developed by<br />
one cross-functional team specifically composed for that feature. The<br />
different software engineering disciplines and phases (e.g. requirements,<br />
design and test) are performed in an integrated fashion and<br />
within the same team. The team has the mandate to decide on changes<br />
within the value, effort and time frames assigned for the feature.<br />
• Gradual and iterative detailing of requirements (P3). The requirements<br />
are first defined at the high level (as features in the priority-based<br />
list) and then iteratively refined in the development teams into more<br />
detailed requirements as the design and implementation work progresses.<br />
• Integrated requirements engineering (P4). The requirements engineering<br />
tasks are integrated with the other development activities. The requirements<br />
are detailed, agreed and documented during design and<br />
233
PAPER IV: ARE YOU BITING OFF MORE THAN YOU CAN CHEW? ACASE<br />
STUDY ON CAUSES AND EFFECTS OF OVERSCOPING IN LARGE–SCALE<br />
SOFTWARE ENGINEERING<br />
development within the same cross-functional development team through<br />
close interaction between the customer representative and other team<br />
members, e.g. designers, developers and testers.<br />
• User stories and acceptance criteria (P5) are used to formally document<br />
the requirements agreed for development. User stories define user<br />
goals and the acceptance criteria define detailed requirements to fulfill<br />
for a user story to be accepted as fully implemented. The acceptance<br />
criteria are to be covered by test cases.<br />
This study mainly focuses on the situation prior to introducing the new<br />
agile way of working, i.e. for projects working as described in Section 3.2.<br />
The agile RE practices covered in this paper were defined in the company’s<br />
internal development process at the time of the study. Practices P1 and P2<br />
were being used in the projects, while P3 was partly implemented, and<br />
P4 and P5 were in the process of being implemented. Thus, it was not<br />
possible to investigate the full impact of the new agile RE practices at the<br />
time of this study. Nevertheless, the study investigates how these (new)<br />
practices are believed to affect the overscoping situation, i.e. which causes<br />
and root causes may be impacted by the agile RE practices and, thus, lead<br />
to reducing overscoping and its effects.<br />
4 Research method<br />
The study was initiated due to a larger transition taking place within the<br />
case company and with the aim of understanding the differences between<br />
the scoping processes of the phase-based process and the new agile development<br />
process. Our previous research into scoping (<strong>Wnuk</strong> et al, 2009)<br />
served as the basis for identifying research questions aimed at seeking a<br />
deeper understanding of overscoping as a phenomenon. In order to obtain<br />
detailed insight, an explanatory approach (Robson, 2002) was taken and<br />
the study design was based on the specific company context and the authors’<br />
pre-understanding. These investigations can then be broadened in<br />
future studies. Existing knowledge from literature was taken into account<br />
in interpretation and validation of the results.<br />
A single-company explanatory case study (Robson, 2002) was performed<br />
using mainly a qualitative research approach complemented by a quantitative<br />
method for some of the data gathering. Qualitative research is suitable<br />
for investigating a complex phenomenon (such as overscoping) in a<br />
real-life context where it exists (Myers and Avison, 2002) (such as our case<br />
company). In this study, practitioners’ perceptions of overscoping were<br />
studied through interviews where the verbalized thoughts of individuals<br />
with a range of different roles at the case company were captured(Myers<br />
and Avison, 2002; Robson, 2002). An overview of the research method is<br />
shown in Figure 4.1.<br />
234
Previous research<br />
For phase-based process<br />
RQ1: What causes overscoping?<br />
RQ2: What are the effects?<br />
Work experience at case company 9 practitioners with roles and<br />
experiences throughout life cycle<br />
Pre-study and<br />
hypothesis formulation<br />
• 5 assumed causes (Section 4.1.1)<br />
• 5 agile RE practices (Section 3.3, [10])<br />
• interview instrument ([69])<br />
RESEARCHQUESTIONSonOVERSCOPING<br />
Phase-based context<br />
causes effects<br />
case company context<br />
CASESTUDY<br />
Agile context<br />
causes’ effects’<br />
PHASE 1 PHASE 2 PHASE 3<br />
Interview study<br />
• 6 main causes (Section 5.1, [11])<br />
• root causes (Section 5.2, [11])<br />
• 6 effects (Section 5.3, [11])<br />
• 3 agile RE practices (Section 5.4)<br />
4. RESEARCH METHOD<br />
For agile development process<br />
RQ3: How may agile RE practices<br />
impact the causes & effects?<br />
6 (other) practitioners<br />
Validation<br />
questionnaire<br />
INPUT<br />
+ 2 main causes, root<br />
causes (Section 6.1)<br />
+ 3 effects (Section 6.2)<br />
+ 3 practices (Section 6.3)<br />
Figure 4.1: Overview of research method for case study.<br />
OUTPUT<br />
The case study was performed in three phases, see Figure 4.1. In the<br />
first phase, the industrial experience of one of the authors was used to formulate<br />
a hypothesis concerning possible (assumed) causes of overscoping<br />
and (assumed) effects which may result from overscoping. This hypothesis<br />
was used as a starting point in creating the interview instrument (Bjarnason,<br />
2012) for the interviews, which took place in the second phase of the<br />
study. In the third phase, the interview results were presented to (another)<br />
six practitioners from the same company and validated by using a questionnaire<br />
(see Section 6 for more details and (Bjarnason, 2012) for the validation<br />
questionnaire). This was done to reduce the risk of inappropriate<br />
(false) certainty of the correctness of the results (Robson, 2002).<br />
4.1 Phase one: pre-study and hypothesis generation<br />
The purpose of the first phase of the study was to formulate a hypothesis<br />
on overscoping and prepare for the interviews. The experience of one of<br />
the authors (who has worked at the case company, with experience in several<br />
areas including coding, design, requirements engineering and process<br />
development) was used to identify possible (assumed) causes and effect of<br />
overscoping. In addition to these assumptions for the phase-based way of<br />
working, this author also identified the agile RE practices being introduced<br />
at the case company. These practices were assumed to impact one or more<br />
235
PAPER IV: ARE YOU BITING OFF MORE THAN YOU CAN CHEW? ACASE<br />
STUDY ON CAUSES AND EFFECTS OF OVERSCOPING IN LARGE–SCALE<br />
SOFTWARE ENGINEERING<br />
of the issues believed to cause overscoping in the phase-based process. If<br />
these assumptions were correct, applying the new practices should then result<br />
in reducing (or eliminating) the effects connected to those causes, and<br />
thus reduce (or eliminate) overscoping. In order to avoid selecting a set of<br />
assumptions biased by only one person, a series of brainstorming sessions<br />
around the hypothesis were conducted within the group of researchers involved<br />
in this study (i.e. the authors). The resulting (updated) hypothesis<br />
was then used as the main input in creating an interview study instrument<br />
(accessible online (Bjarnason, 2012)).<br />
4.1.1 Formulated hypothesis<br />
The hypothesis formulated for this study is that overscoping is caused by<br />
a number of factors, and that by addressing one or more of these factors,<br />
e.g. through agile RE practices, the phenomenon of overscoping may be<br />
alleviated, or even eliminated. The following five factors were identified<br />
as assumed causes for overscoping in phase one:<br />
• continuous requirements inflow via multiple channels (C1) was assumed<br />
to cause overscoping by the many inflows increasing the difficulty<br />
of defining a realistic scope for multiple parallel projects. Requirements<br />
continuously arrive from the market, as well as, from internal<br />
stakeholders. This inflow was managed by batching those requests<br />
into one or two projects per year. It was a challenge to manage the<br />
execution of multiple parallel projects, while handling requests for<br />
new features and requirements, as well as, requests for changes to<br />
the agreed project scope.<br />
• no overview of software resource availability (C2) was assumed to cause<br />
overscoping due to the challenge of balancing the size of the total<br />
scope for several (parallel) development projects against the (same)<br />
set of development resources. The resource allocation for the software<br />
development unit was handled at the DT level, i.e. there was<br />
no total overview of the load and available capacity of all the development<br />
resources of the software unit.<br />
• low DT involvement in early phases (C3) was assumed to contribute to<br />
defining unrealistic and unclear requirements in the early phases,<br />
that are later deemed too costly or even impossible to implement,<br />
thus causing overscoping. The development teams were not very<br />
involved in the early project phases (MS1-MS4) with providing cost<br />
estimates and feedback during requirements writing.<br />
• requirements not agreed with DT (C4) was assumed to cause overscoping<br />
due to not ensuring that the suggested scope was feasible and understandable.<br />
The requirements specification was not always agreed<br />
with the development teams at the handover point (MS2). Even if<br />
236
4. RESEARCH METHOD<br />
there was a formal review by DTs, we assumed that there was a low<br />
level of commitment from DTs. Furthermore, this low level of agreement<br />
was assumed to lead to low DT motivation to fulfil the requirements<br />
defined by the RTs.<br />
• detailed requirements specification is produced upfront (C5) by the requirements<br />
teams by MS2 before the design starts was assumed to cause<br />
overscoping by limiting the room for negotiating requirements that<br />
could enable a more efficient design and realistic development plan.<br />
Furthermore, time and cost overhead for managing such changes<br />
was also assumed to contribute to overscoping.<br />
4.2 Phase two: an interview study at the case company<br />
In phase two, semi-structured interviews with a high degree of open discussion<br />
between the interviewer and the interviewee were held. The hypothesis<br />
provided a framework that helped to discuss, explore and enrich<br />
the understanding of this complex phenomenon. To avoid imposing this<br />
hypothesis on the interviewees, the discussion both on overscoping in general<br />
and on the detailed causes and effect was always started with an open<br />
ended question. In addition, the interviewees were asked to talk freely<br />
about the roles and phases she had experience from at the beginning of<br />
the interviews. In order to separate between the situation with the phasebased<br />
process and with the new agile RE practices, the impact of the new<br />
practices was discussed specifically in a (separate) section at the end of the<br />
interviews.<br />
Our aim was to cover the whole process from requirements definition<br />
through development (design, implementation and testing) to the resulting<br />
end product (quality assurance, product projects), mainly for the<br />
phase-based process. This was achieved by selecting people with experience<br />
from all the relevant organizational units (see Section 3) to be interviewed<br />
and thereby catch a range of different perspectives on the phenomenon<br />
of overscoping. Nine people in total were selected to be interviewed.<br />
Two of the interviewees with identical roles requested to have<br />
their interviews together. The roles, organizational belongings, and relevant<br />
experience of the interviewed persons within the case company for<br />
the phase-based process can be found in Table 4.1. We have used a coding<br />
for the interviewees that also includes their organizational belonging.<br />
For example, interviewees belonging to the requirements unit are tagged<br />
with a letter R, belonging to product unit with a letter P and belonging to<br />
software unit with a letter S.<br />
The interviews were scheduled for 90 min each with the possibility to<br />
reduce time or prolong it. All interviews were recorded and transcribed,<br />
and the transcripts sent back to the interviewees for validation. For each interview,<br />
the transcript was 7-10 pages long and contained in average 3900<br />
237
PAPER IV: ARE YOU BITING OFF MORE THAN YOU CAN CHEW? ACASE<br />
STUDY ON CAUSES AND EFFECTS OF OVERSCOPING IN LARGE–SCALE<br />
SOFTWARE ENGINEERING<br />
Table 4.1: Interviewees roles (for phase-based process), organizational belonging<br />
and length of experience for each role within the company, see<br />
Section 3.1.<br />
Code Organizational Role (s) within company Years within<br />
unit<br />
role<br />
Ra Requirements RT leader 5<br />
Rb Requirements RT leader 2<br />
Rc Requirements Requirements architect 3<br />
Pd Product System test manager 7<br />
Se Software Tester 3<br />
Sf Software Software project manager 2<br />
DT leader 2<br />
Developer 2<br />
Sg Software Quality manager 3<br />
Sh Software DT requirements coordinator 1<br />
Developer 2<br />
DT leader 1<br />
Si Software DT requirements coordinator 7<br />
words. Transcription speed varied from 3 to 7 times of recorded interview<br />
time. The coding and analysis was done in MS Excel. The underlying<br />
section structure of interview instrument, i.e. causes, effects and agile RE<br />
practices, were numbered and used to categorize the views of the interviewees.<br />
For each interview, the transcribed chunks of text were placed within<br />
the relevant sections and, if so needed, copied to multiple sections. Relationships<br />
between different categories, as well as, the level of agreement on<br />
causes, effects and agile RE practices were noted in specific columns. The<br />
viewpoints of the two practitioners interviewed together (interviewees Ra<br />
and Rb) were separated into different columns in order to allow reporting<br />
their individual responses.<br />
4.3 Phase three: validation of results via questionnaire<br />
To further strengthen the validity of the results from the interviews a set<br />
of six (additional) practitioners at the case company was selected in phase<br />
three, see Table 4.2. To ensure that these six practitioners understood the results<br />
correctly and in a uniform way, the interview results were presented<br />
to them. During the meeting the participants could ask for clarifications<br />
and comment on the results, especially when they disagreed or had other<br />
different or additional viewpoints. In order to gather their views on the<br />
results in a uniform and non-public way, the participants were asked to fill<br />
out a questionnaire (available online at (Bjarnason, 2012)) stating to which<br />
238
5. INTERVIEW RESULTS<br />
Table 4.2: Questionnaire respondents: roles and organizational belonging<br />
(for phase-based process), and length of experience within company (see<br />
Section 3.1) for descriptions of organizational units and roles).<br />
Organizational Role(s) Years within<br />
unit<br />
company<br />
Software Software project manager, DT<br />
leader<br />
4<br />
Software Tester 7<br />
Software DT requirements coordinator,<br />
DT leader<br />
5<br />
Requirements Requirements architect 5<br />
Requirements RT leader 13<br />
Product System test manager 15<br />
degree they agreed to the results and if additional relevant items had been<br />
missed. Due to limited availability of the participants a total of three such<br />
sessions were held. Each session was scheduled for 90 min with the possibility<br />
to extend or decrease the time as needed. The results from the questionnaire<br />
can be found in Section 6.<br />
5 Interview results<br />
The causes and effects of overscoping derived from the interviews performed<br />
in phase two of the study, see Figure 4.1, are outlined in Figure 4.2<br />
and described in the following sections. Section 5.1 covers the main causes<br />
for overscoping, while the root causes are reported in Section 5.2 and the<br />
effects in Section 5.3. The findings from the interviews concerning how the<br />
agile RE practices may address overscoping are described in Section 5.4.<br />
The outcome of the validation questionnaire (phase 3) on these results is<br />
reported in Section 6.<br />
5.1 Causes of overscoping (RQ1)<br />
The viewpoint of each interviewee concerning the causes of overscoping<br />
was categorized and matched against the hypothesis regarding the assumed<br />
causes of overscoping (C1-C5, see Section 4.1.1). In addition, five of the<br />
eight interviewees were found to describe a sixth main cause for overscoping,<br />
namely C6 unclear vision of overall goal. A lack of (clearly communicated)<br />
strategy and overall goals and business directions for software development<br />
led to unclarities concerning the intended direction of both software<br />
roadmaps and product strategies, as well as, unclear business prior-<br />
239
PAPER IV: ARE YOU BITING OFF MORE THAN YOU CAN CHEW? ACASE<br />
STUDY ON CAUSES AND EFFECTS OF OVERSCOPING IN LARGE–SCALE<br />
SOFTWARE ENGINEERING<br />
ity of project scope. The interviewees described how this cause (C6) led to<br />
scope being proposed primarily from a technology aspect, rather than from<br />
a business perspective, and without an (agreed) unified priority. Instead,<br />
most of the scope of a project was claimed to be critical and non-negotiable.<br />
The interviewee results around the main causes of overscoping are shown<br />
in Table 4.3. The opinions of the interviewees have been classified in the<br />
following way:<br />
• Experienced: the cause (both its occurrence and its impact on overscoping)<br />
is experienced<br />
• Agreed: either the cause (occurrence and impact) was not directly<br />
mentioned, but derived or agreed after direct question, or when interviewee<br />
has no direct experience, but had observed it or heard<br />
about it from others.<br />
• Partly agreed: Experienced or partly Agreed.<br />
• Disagreed: does not agree to the cause, either its occurrence, or that it<br />
caused overscoping.<br />
• Not mentioned: even though within expected experience for role.<br />
• NA: not within the expected experience for the role (according to the<br />
process).<br />
All interviewees had Experienced or Agreed to overscoping as a challenge,<br />
and a majority had Experienced or Agreed to causes 1-3. No interviewees<br />
Disagreed to any of the causes, though causes 4 and 5 both had less<br />
than a majority of Experienced or Agreed interviewees. Causes 4-5 were Not<br />
mentioned by all, while cause 6, which was derived from 5 of the interviewees,<br />
was Not mentioned by the others.<br />
The entries marked NA (Not Applicable) indicate that the interviewee<br />
in her role was not expected to have experience of that cause. The system<br />
test manager (Pd) and the quality assurance manager (Sg) were classified<br />
as NA for C2, C3 and C4 since they merely observed the requirements flow<br />
from their management-level positions and were not directly involved in<br />
the early phases of the projects. In addition, Sg was also classified as NA<br />
for C5 due to lack of contact with the SRS. Furthermore, the software tester<br />
(Se), who had no insight into project planning, was categorized as NA for<br />
the causes C1 and C2. For all assumed causes there were some counts of<br />
Partly agreed, namely:<br />
• continuous requirements inflow via multiple channels (C1). The quality<br />
manager (Sg) mentioned the continuous infloow of requirement<br />
changes after setting the scope as causing overscoping, but no root<br />
causes prior to this milestone, and is therefore classified as Partly<br />
agreed.<br />
240
C6 Unclear<br />
vision of<br />
overall goal<br />
C5 Detailed<br />
reqs.<br />
specification<br />
produced<br />
upfront<br />
C4 Reqs. not<br />
agreed with<br />
DTs<br />
C3 Low DT<br />
Involvm. in<br />
early phases<br />
C2 No<br />
overview of<br />
softw.<br />
resources<br />
C1<br />
Continuous<br />
req. inflow<br />
Overscoping<br />
as a<br />
challenge<br />
Product<br />
Software<br />
Requirements<br />
Product<br />
Software<br />
Requirements<br />
Product<br />
Software<br />
Requirements<br />
Product<br />
Software<br />
Requirements<br />
Product<br />
Software<br />
Requirements<br />
Product<br />
Software<br />
Requirements<br />
Product<br />
Software<br />
Requirements<br />
Experienced 2 5 1 1 3 1 1 2 3 1 1 1 2 3 2<br />
Agreed 1 2 2 1 1 1 1<br />
Partly<br />
1 1 2 2 1<br />
agreed<br />
Disagreed<br />
Not men-<br />
2 1 2 3 1<br />
tioned<br />
NA 1 2 1 1 1 1 1 1<br />
241<br />
5. INTERVIEW RESULTS<br />
Table 4.3: For each identified main causes of overscoping, the number of interviewees per response category (see Section 5.1)<br />
and organizational unit (Reqs, etc, see Section 3.1).
PAPER IV: ARE YOU BITING OFF MORE THAN YOU CAN CHEW? ACASE<br />
STUDY ON CAUSES AND EFFECTS OF OVERSCOPING IN LARGE–SCALE<br />
SOFTWARE ENGINEERING<br />
• no overview of software resource availability (C2). One of the DT requirements<br />
coordinators (Si) is noted as Partly agreed to this cause, due to<br />
believing that a better overview of available resources would not alleviate<br />
the overscoping to any greater extent. In contrast, another interviewee<br />
(Sf) saw this as a strong cause for overscoping; ’There was<br />
no control of what people were working with. There were different<br />
DT leaders who just sent out [tasks]’.<br />
• low DT involvement in early phases (C3). Both DT requirements coordinators<br />
(Sh, Si) were categorized as Partly agree since the involvement<br />
from the rest of the DT including producing cost estimates was low,<br />
even though they personally had experienced good cooperation with<br />
the RT leaders during MS1-MS2. This lack of involvement was seen<br />
by the DT tester (Se) as leading to an unrealistically large scope being<br />
specified, "‘The full view of requirements would be improved by<br />
including input from more roles, and a more realistic scope could be<br />
identified earlier on."’<br />
• requirements not agreed with DT (C4). The DT requirements coordinators<br />
(Sh, Si) believed that the requirements were understood and<br />
agreed with the DT at MS2, though the DT did not commit to implementing<br />
them at that point. One of them (Sh) mentioned that the<br />
system requirements specification was primarily agreed with the DT<br />
requirements coordinators and not with developers and testers in the<br />
DT.<br />
• detailed requirements specification produced upfront (C5). One of the RT<br />
leaders (Rb) had an agile way of working and did not produce a detailed<br />
requirements specification upfront, but instead regularly and<br />
directly interacted with the DT. This increased insight into the DT enabled<br />
a more flexible discussion around scope and detailed requirements,<br />
led to overscoping being experienced as a more manageable<br />
challenge by Rb. The other RT leader (Ra, interviewed together with<br />
Rb) did not mention C5 as causing overscoping, but agreed to Rb’s<br />
conclusions and was noted as Partly agreed. Ra had the opposite experience,<br />
i.e. of producing and relying on a requirements specification,<br />
and then not staying in touch with the DT during the later phases of<br />
development (after MS2) who then developed software that was usually<br />
different from what was specified in the SRS. One of the DT interviewees<br />
(Sf) believed that the (wasted) effort of producing and agreeing<br />
to detailed requirements upfront (for features that were later descoped)<br />
increased the overscoping since it hindered those resources<br />
from working on viable features. Another interviewee (Sh) said: ’At<br />
this point [MS2] we [DT] approved a lot of things, because we liked<br />
what they [RT] wrote here and we really wanted that functionality<br />
then we [DT] started to over commit.’<br />
242
5.2 Root cause analysis (RQ1)<br />
5. INTERVIEW RESULTS<br />
To provide a deeper understanding the interviewees were asked to describe<br />
what may be triggering overscoping, i.e. the root causes of overscoping.<br />
These root causes have been grouped according to the main cause<br />
(C1-C6, outlined in Sections 4.1 and 5.1) that they affect. A full picture<br />
of the cause-effects relationships for overscoping identified through this<br />
study is depicted in Figure 4.2. The results around root causes from both<br />
the interviews and from the questionnaire are also summarized in Table<br />
4.4.<br />
• root causes of C1 (continuous requirements inflow via multiple channels). A<br />
number of requirement sources besides the regular requirement flow<br />
(defined by the RTs) were mentioned as contributing to the continuous<br />
inflow. These include: requirements produced by defining many<br />
different product variants in the product line (RC1a); and, many late<br />
new market requirements and changes incurred by the long project<br />
lead times (RC1b) compared to rate of requirements change. Furthermore,<br />
communication gaps (RC1c) were mentioned as causing additional<br />
requirements inflow through-out the project life cycle. These<br />
consist of communication gaps between the requirements unit and<br />
the software unit (RC1ci) which resulted in the software unit preferring<br />
to work according to their own software-internal roadmap<br />
containing a large amount of requirements not agreed with the requirements<br />
unit. Communication gaps between technical areas, both<br />
for RTs and for DTs, (RC1cii) led to indirect requirements between<br />
DTs being discovered after the initial scope selection at MS2, which<br />
greatly increased the amount of implementation required. The impact<br />
of these indirect requirements was especially large for DTs responsible<br />
for service-layer functionality like display frameworks and<br />
communication protocols. Furthermore, communication gaps between<br />
usability design and the RTs (RC1ciii) resulted in additional functional<br />
requirements appearing in usability design specification, sometimes<br />
in conflict with RT requirements. And, finally, due to lack of<br />
communication between the software quality managers and the requirements<br />
unit (RC1civ), requirements on quality aspects were not<br />
defined and prioritized together with the RT requirements, but managed<br />
separately in a later phase.<br />
• root causes of C2 (no overview of software resource availability). The<br />
lack of overview of available software development resources was<br />
believed to be a consequence of communication gaps within the software<br />
unit and between the DTs (RC2a). The organizational structures<br />
and the high scope pressure were seen to result in each DT focusing<br />
on their own areas rather than striving for cooperation and good<br />
communication with other DTs. One interviewee described that en-<br />
243
PAPER IV: ARE YOU BITING OFF MORE THAN YOU CAN CHEW? ACASE<br />
STUDY ON CAUSES AND EFFECTS OF OVERSCOPING IN LARGE–SCALE<br />
SOFTWARE ENGINEERING<br />
Figure 4.2: Overview of all found causes (C), root causes (RC) and effects (E) of overscoping. Items derived from questionnaire<br />
noted with + and dashed lines. Interviewee code (see Section 4.2) noted within brackets.<br />
+RC3g Multi-tasking<br />
of scope selection<br />
+RC3e Weak management<br />
+RC3f People turnover<br />
+RC4c Unclear, ambiguous<br />
requirements<br />
+RC4d Low understanding<br />
+C8: Scope & deadline<br />
dictated<br />
+C7: Weak process<br />
adherance<br />
RC3d Communication gaps<br />
i) Late reqs info [Si]<br />
ii) Lack of respect for dev<br />
costs [Se, Sf]<br />
RC4b Comm gaps<br />
i) Reqs – softw units<br />
[Rc, Si]<br />
ii) RT – DT [Rc, Se]<br />
iii) Dev – testers [Se]<br />
RC3c Low dev<br />
capacity [Ra, Rb]<br />
C5: Detailed<br />
req spec<br />
produced<br />
upfront<br />
[Se, Sh, Si]<br />
+E7 Overtime<br />
+E8 Product plans<br />
changed/cancelled<br />
+E9 Low prio on<br />
admin tasks<br />
E6 Challenge<br />
to keep SRS<br />
updated<br />
[Ra, Rb, Pd,<br />
Sg, Si]<br />
RC3b Low competence<br />
in estimating<br />
cost [Rb, Sh]<br />
C3: Low DT<br />
involvement in<br />
early phases<br />
RC4a<br />
C4: Reqs not<br />
agreed with DTs<br />
E5 Communication<br />
gaps [Rc, Sf, Sg, Si]<br />
244<br />
always met [Sf]<br />
Overscoping<br />
RC3a Lack of<br />
DT resources [Rc]<br />
E4 Customer<br />
expectations not<br />
C6: Unclear vision<br />
of overall goal<br />
RC1b Long lead<br />
times [Rc]<br />
RC1a Large no of<br />
product variants<br />
[Rc, Sf]<br />
C1: Continuous<br />
req inflow<br />
C2: No overview of<br />
software resource<br />
availability<br />
+RC1d Customer<br />
reqs changes<br />
RC2a Comm gaps<br />
within softw<br />
unit[Sf, Sh]<br />
RC6c Weak<br />
prio of scope<br />
[Rc, Si]<br />
E1a Wasted effort<br />
[Ra, Rb, Rc,<br />
Se, Sf, Sh, Si]<br />
E2 Quality issues<br />
[Rc, Pd, Se,<br />
Sf, Sg, Sh]<br />
E1 Many req<br />
E3 Delays<br />
changes [all]<br />
[Se, Sf, Sg, Si]<br />
[Sf, Sh]<br />
iii) RTs - usability [Si]<br />
+RC1e Portfolio<br />
iv) RTs – software quality<br />
replanning<br />
management [Sg]<br />
RC6b Technology<br />
focus [Ra, Rb, Sh]<br />
[Ra, Rb]<br />
RC1c Communication gaps<br />
i) Reqs unit – softw unit<br />
[Ra, Rb, Sf]<br />
ii) DT - DT, RT – RT<br />
RC6a Unclear business<br />
strategy f SW<br />
RC6d Communication gaps<br />
i) between RTs [Sh]<br />
ii) between DTs [Sh]<br />
iii) Reqs – software units [Ra, Rb, Sf]<br />
E1b Decreased<br />
motivation [Ra, Rb,<br />
Rc, Se, Sf]
5. INTERVIEW RESULTS<br />
abling DTs to coordinate their plans had the effect of improving the<br />
scoping situation by increasing the delivery rate and efficiency, ’We<br />
tried to solve the overscoping by enabling the DTs to co-plan and deliver<br />
incrementally. This resulted in more deliveries and increased<br />
efficiency.’ (Sf)<br />
• root causes of C3 (Low DT involvement in early phases). Several interviewees<br />
described that software resources were rarely available in<br />
early project phases (RC3a) due to development and maintenance<br />
work for previous projects. Rc said: ’by MS2, but it was hard to get<br />
[DT] resources. That probably was the problem.’ In addition, weak<br />
and incorrect cost estimations (RC3b) were mentioned as leading to<br />
including too much into the project scope. In contrast, low development<br />
capacity of the software unit (RC3c) caused by bad architecture<br />
was believed by the two RT leaders to be the main reason for<br />
over-scoping. Furthermore, gaps in the communication (RC3d) between<br />
the requirements unit and the software unit were mentioned<br />
as causing low DT involvement. For example, interviewees mentioned<br />
that early DT involvement was often postponed due to a lack<br />
of understanding within the software unit for the importance of this<br />
work. However, the opposite was also mentioned, namely that the<br />
DTs received requirements information too late (RC3di) which then<br />
resulted in extending the project scope without realistic plans. Similarly,<br />
the cost estimates for both development and testing were not<br />
always respected (RC3dii). In contrast, close cooperation between<br />
the RTs and the DTs were experienced (by Rc) to lead to an early<br />
uncovering of problems, thereby enabling definition of more stable<br />
requirements that were then successfully implemented.<br />
• root causes of C4 (requirements not agreed with DTs). Low DT involvement<br />
in the early phases (C3, RC4a) was seen as leading to weak<br />
agreement and commitment to the requirements, by all three interviewees<br />
with experience from planning DT work (Se, Sh, Si). The<br />
interviewees connected the level of requirements agreement with the<br />
level of communication around requirements (RC4b), i.e. RTs and<br />
DTs that communicated well also tended to have a mutual understanding<br />
and agreement of the requirements. Due to variations in<br />
communication between teams, the view on C4 varied between interviewees<br />
(see Section 5.1). Even so, one interviewee (Sh) who had<br />
experienced good cooperation with the RT mentioned that the different<br />
organizational belongings (RC4bi) caused timing issues due to<br />
different priorities for different units. In addition, communication<br />
gaps between RTs and DTs (RC4bii) including no contact between<br />
testers and RT leaders were caused by physical and organizational<br />
distances and resulted in weak DT agreement on the requirements.<br />
Weak communication on requirements and design between develop-<br />
245
PAPER IV: ARE YOU BITING OFF MORE THAN YOU CAN CHEW? ACASE<br />
STUDY ON CAUSES AND EFFECTS OF OVERSCOPING IN LARGE–SCALE<br />
SOFTWARE ENGINEERING<br />
ers and testers (RC4biii) was also mentioned (by Se) as causing weak<br />
requirements agreement.<br />
• root causes of C5 (detailed requirements specification produced upfront).<br />
The phase-based process defined that a requirements specification<br />
should be produced by MS2, therefore no further root causes have<br />
been identified for this cause.<br />
• root causes of C6 (unclear vision of overall goal). The RT leaders (Ra and<br />
Rb) described that the lack of clear business strategy (RC6a) and vision<br />
that could guide them in defining a roadmap resulted in proposing<br />
a project scope from a pure technology standpoint (RC6b). A<br />
weak and unified business priority (RC6c) of the proposed scope (almost<br />
everything was ’critical’) was described (by Si) as pushing the<br />
DTs to commit to unrealistic project plans. In addition, Rc mentioned<br />
that the lack of unified priority hindered the project management<br />
from effectively addressing the overscoping. Furthermore, several<br />
communication gaps (RC6d) were seen to contribute to this cause.<br />
Weak communication both between RTs (RC6di) and between DTs<br />
(RC6dii) were described by Rc as resulting in weak scope coordination<br />
between functional areas, as well as, conflicts and lack of clarity<br />
concerning the overall goal. Finally, both RT leaders described that<br />
communication gaps and low common understanding between the<br />
requirements unit and the software unit (RC6diii) of the overall goal<br />
resulted in the project scope being decided to a large extent by the<br />
DTs, and not (as the process stated) by the RTs.<br />
5.3 Effects of overscoping (RQ2)<br />
The interviews uncovered the following six main effects of over-scoping<br />
(marked as E1 to E6, see Figure 4.2):<br />
• many requirement changes after the project scope is set (E1). All interviewees<br />
had experienced that overscoping caused requirement changes<br />
to take place after the project scope was set (at MS2). As the projects<br />
proceeded and the overload was uncovered large amounts of features<br />
were removed from scope (descoped). The phenomena was<br />
so common that the phrases ’overscoping’ and ’descoping’ have become<br />
part of company vocabulary. This descoping of already started<br />
features was a waste (E1a) of both RT and DT effort and led to frustration<br />
and decreased motivation (E1b) to work with new requirements.<br />
As interviewee Sh said: ’There are many things that you as a tester or<br />
developer have spent time on that never resulted in anything. And<br />
that isn’t very fun. There is a lot of overtime that has been wasted.’<br />
However, the many requirement changes were experienced by Pd as<br />
246
Mentioned as<br />
causes or root<br />
causes by nbr. of<br />
interviewees (9 in<br />
total)<br />
5. INTERVIEW RESULTS<br />
Experienced<br />
Number of questionnaireresponses<br />
(6 in<br />
total)<br />
Overscoping (as a challenge) 9 6<br />
C1: Continuous reqs. inflow via multiple channels 8 4 2<br />
(a) Large number of product variants 2 3 1 2<br />
(b) Long lead times 1 4 2<br />
(c) Communication gaps 6 3 1 1 1<br />
(i) Between reqs and software unit 3 3 2 1<br />
(ii) Between RT-RT and DT-DT 2 3 2 1<br />
(iii) Between RT and usability design 1 2 1 1 2<br />
(iv) Between RT and software quality managers 1 2 4<br />
(+d) Customer requirements changes (many and late) 3<br />
(+e) Product portfolio re-planning 1<br />
C2: No overview of software resource availability 6 2 3 1<br />
(a) Communication gaps within software unit 2 1 2 1 1 1<br />
C3: Low development team involvement in early<br />
phases<br />
7 1 2 2 1<br />
(a) Lack of DT resources for pre-development work 1 2 2 2<br />
(b) Low competence in estimating cost 2 2 1 3<br />
(c) Low development capacity 2 1 1 2 1 1<br />
(d) Communication gaps 3<br />
(i) Late requirements information to DT 1 2 2 1 1<br />
(ii) Lack of respect or understanding of development<br />
cost<br />
(+e) Weak leadership including ineffective communication<br />
(+f) Change of people during the project<br />
2 2<br />
1<br />
1<br />
3 1<br />
(+g) Multi-tasking 1<br />
C4: Requirements not agreed with development teams 5 2 2 2<br />
(a) Low DT involvement in early phases (C3) 3 2 2 1 1<br />
(b) Communication gaps 3 1 2 2 1<br />
(i) Between requirements and software units 2 1 2 1 2<br />
(ii) Between RT and DT 2 1 1 2 1 1<br />
(iii) Between developers and testers 1 1 1 1 2 1<br />
(+c) Unclear and ambiguous requirements 3<br />
(+d) Low understanding of why particular scope is selected<br />
C5: Detailed reqs specification produced upfront 5<br />
1<br />
1 3 1 1<br />
C6: Unclear vision of overall goal 5 4 1 1<br />
(a) Unclear business strategy for software development 2 3 2 1<br />
(b) Technology focus when scope set 3 3 2 1<br />
(c) Weak priority of scope 2 3 2 1<br />
(d) Communication gaps 2 3 1<br />
(i) Between RTs 1 1 3 2<br />
(ii) Between DTs 1 2 2 2<br />
(iii) Between requirements and software units 3 1 3 1 1<br />
+C7 Weak process adherence 1<br />
+C8 Overall scope and deadline dictated from management<br />
1<br />
Table 4.4: Summary of all identified causes and root causes of overscoping:<br />
Number of responses for interviewees (see Section 5 for details) and for<br />
Questionnaire responses per level of agreement (see Section 6 for details).<br />
Additional items from questionnaire responses are marked with +.<br />
247<br />
Agree<br />
Party agree<br />
Disagree<br />
Do not know
PAPER IV: ARE YOU BITING OFF MORE THAN YOU CAN CHEW? ACASE<br />
STUDY ON CAUSES AND EFFECTS OF OVERSCOPING IN LARGE–SCALE<br />
SOFTWARE ENGINEERING<br />
having only minor impact on the system testing. They merely adjusted<br />
the test plans, and rarely wasted any effort due to this effect.<br />
• quality issues (E2). All interviewed practitioners involved after MS4<br />
(when development started, Rc, Pd, Se, Sf, Sg, Sh) mentioned that<br />
software quality was negatively affected by over-scoping both due to<br />
the high workload and due to the many requirement changes. The<br />
software quality manager Sg expressed, ’If you get too much scope,<br />
you get quality problems later on and you haven’t got the energy to<br />
deal with them.’ Similarly, interviewee Pd said: ’When you have a<br />
lot going on at the same time, everything isn’t finished at the same<br />
time and you get a product with lower quality.’ Furthermore, the<br />
lack of respect for development costs (C3dii) in the earlier phases<br />
was mentioned by the software tester (Se) to contribute to insufficient<br />
testing and subsequent quality issues.<br />
• delays (E3). The overscoping and subsequent overloading of the DTs<br />
was described by several practitioners as resulting in delayed deliveries<br />
being the norm rather than the exception. In addition, overscoped<br />
DTs were often forced to commit to customer-critical requests<br />
and changes which in turn resulted in even more delays and quality<br />
issues (E2). One DT interviewee (Sf) stated that ’our team was always<br />
loaded to 100% at MS4, which was too much since there were always<br />
customer requests later on that we had to handle. That meant that we<br />
were forced to deliver functionality with lower quality or late.’ The<br />
same situation was described by the quality manager (Sg) who said:<br />
’Even if we decided on a scope for MS4, there were extremely many<br />
changes underway, so we were never ready by MS5, as we had said,<br />
but were delayed.’<br />
• customer expectations are not always met (E4). Overscoping was mentioned<br />
by a few interviewees as resulting in sometimes failing to<br />
meet customer expectations. For example, customers sometimes file<br />
change requests for features that had previously been removed due<br />
to overscoping. In addition, overscoping caused by requiring a large<br />
number of products (RC1a) with different display sizes and formats<br />
was experienced by interviewee Sf as resulting in releasing products<br />
with faulty software, e.g. misplaced icons.<br />
• communication gaps (E5). Overscoping and overloading an organization<br />
was described as leading to several communication gaps; between<br />
the requirements and software units; within the software unit<br />
itself, between DTs (Sg, Si) and between DTs and software project<br />
managers (Sf); and between the software and the product unit. For<br />
example, the many descoped features (E1) and wasted effort (E1a)<br />
resulted in distrust between the requirements unit and the software<br />
248
5. INTERVIEW RESULTS<br />
unit, so much so that the software unit defined their own internal<br />
roadmap without coordinating this with the requirements unit. Furthermore,<br />
invalid error reports filed by the system testers based on<br />
an unreliable SRS (caused by E1-E6) caused an increase both in work<br />
load and in frustration at the software unit and, consequently friction<br />
and widened communication gaps between these units.<br />
• challenge to keep the SRS updated (E6): The situation caused by overscoping,<br />
with a high workload and many late requirement changes<br />
(E1), increased the challenge of keeping the SRS updated. The practitioners<br />
mentioned that in an overscoping situation the task of updating<br />
the SRS was given low priority (partly caused by E1b). Furthermore,<br />
the amount of required updates both for changed and descoped<br />
requirements was increased (Ra, Rb, Pd, Sg, Si) by producing<br />
the requirements upfront (C5) with a low level of DT agreement (C4).<br />
The RT leaders (Ra, Rb) had also experienced that many requirementrelated<br />
changes were made during development without informing<br />
the RTs (or the system testers), many of which might have been a<br />
result of insufficient DT involvement in the early phases (C3).<br />
5.4 Impact of agile RE practices (RQ3)<br />
The general opinion of the interviewees on the situation after introducing<br />
the agile RE practices (see Section 3.3) is that even though some overscoping<br />
is still experienced, it is a more manageable challenge than with the<br />
previous phase-based process. For example, there is less descoping and<br />
most of the features worked on by the software unit now continue until<br />
completion (Si). Interviewee Sg said: "‘We still have overscoping in all<br />
projects. But, it is more controlled now and easier to remove things without<br />
having done too much work."’ Many of the interviewees stated that in<br />
theory the agile RE practices address overscoping, but that these practices<br />
also incur a number of new challenges. The following practices were mentioned<br />
by the interviewees as impacting some of the causes and/or root<br />
causes of overscoping:<br />
• one continuous scope and release-planning flow (P1). This practice (which<br />
was implemented at the time of the interviews) was seen to address<br />
the root cause weak prioritization of scope (RC6c, mentioned by Rc,<br />
Pd, Sg, Sh) and the causes continuous requirements inflow via multiple<br />
channels (C1, mentioned by Se, Sf) and no overview of software<br />
resource availability (C2, mentioned by Sf, Sg), by enforcing that all<br />
scope and development resources are managed through a uniformly<br />
prioritised list.<br />
• cross-functional development teams (P2). This practice (which was implemented<br />
at the time of the interviews) was seen to address sev-<br />
249
PAPER IV: ARE YOU BITING OFF MORE THAN YOU CAN CHEW? ACASE<br />
STUDY ON CAUSES AND EFFECTS OF OVERSCOPING IN LARGE–SCALE<br />
SOFTWARE ENGINEERING<br />
eral communication gaps, and, thus, impact causes C1-C4 by closing<br />
the gaps (identified as root causes) between RTs and DTs and<br />
between different functional areas. This practice was also believed<br />
to impact C5 (detailed requirements specification produced upfront)<br />
since detailing of requirements is now handled within the development<br />
teams together with the customer representative. Interviewee<br />
Sf said: ’It is an advan- tage that they [the team] sit together and can<br />
work undisturbed, and there is no us-and-them, but it is us. And<br />
when they work with requirements the whole group is involved and<br />
handshakes them.’<br />
• gradual and iterative detailing of requirements (P3). This practice (which<br />
was partly implemented at the time of the interviews) was mentioned<br />
as directly impacting the cause C5 (detailed SRS produced upfront).<br />
Furthermore, this practice was also seen by Sf and Sg to reduce both<br />
the lead time for each high-level requirement (RC1b) and the amount<br />
of changes after project scope is set (E1) and, thus also reduce the<br />
amount of wasted effort (E1a, also mentioned by Ra, Rb).<br />
6 Validation questionnaire on interview results<br />
Overscoping was further investigated through the validation questionnaires<br />
(Bjarnason, 2012), see Table 4.4. Each of the six respondents noted her level<br />
of agreement by using the following notation:<br />
• Experienced: I have experienced this (item and connection) to be valid.<br />
• Agree: I agree to this, but have not experienced it personally.<br />
• Partly agree: I agree to part, but not all, of this.<br />
• Disagree: I do not agree.<br />
• Do not know: I have no knowledge of this item or its impact.<br />
6.1 Causes and root causes (RQ1)<br />
A majority of the questionnaire respondents confirmed (i.e. Experienced<br />
or Agreed to) all main causes as contributing to overscoping, except C3<br />
(low DT involvement) for which there was also one Disagree response.<br />
Causes C2, C3, C5 and C6 each had one count of Disagree from respondents<br />
with experience from the requirements unit. Two additional main<br />
causes were given by two respondents, namely weak processes adherence<br />
(+C7) and dictation of scope and deadlines from management (+C9). Furthermore,<br />
some additional root causes were given for C1, C3 and C4. For<br />
C3, two alternative root causes were given, namely turn-over of DT members<br />
as the project progressed (RC3f) and assigning the same resources to<br />
250
C1: Continuous reqs inflow<br />
via multiple channels<br />
C2: No overview of software<br />
resource availability<br />
C3: Low DT involvement<br />
in early phases<br />
C4: Requirements not<br />
agreed with DTs<br />
C5: Detailed reqs specification<br />
produced upfront<br />
C6: Unclear vision of<br />
overall goal<br />
+C7: Weak process adherence<br />
+C8: Overall scope and<br />
deadline dictated from top<br />
6. VALIDATION QUESTIONNAIRE ON INTERVIEW RESULTS<br />
Total<br />
impact<br />
Softw Softw Softw Reqs Reqs Product<br />
275 20 20 15 50 100 70<br />
60 10 20 20 10<br />
80 10 50 20<br />
10 5 5<br />
15 5 5 5<br />
140 60 40 30 10<br />
20 20<br />
Table 4.5: The total number of points reflecting the impact of each cause<br />
on overscoping. Each questionnaire respondent distributed 100 points. Effects<br />
of overscoping (RQ2). The columns show the number of points per<br />
responder (organisational belonging given in header, see Section 3.1.<br />
multiple parallel projects (RC3g). For C4 (requirements not agreed with<br />
DT) three respondents stated that this was caused by unclear and ambiguous<br />
requirements (RC4c), while one respondents suggested that DTs often<br />
lacked insight into why certain features and requirements were important,<br />
which is related to C6 (unclear vision of overall goal). All responses from<br />
the validation questionnaire on causes and root causes can be found in Table<br />
4.4.<br />
The impact of each main cause on overscoping was gauged by asking<br />
the questionnaire respondents to distribute 100 points over all causes according<br />
to the extent of their impact (see Table 4.5) C1 got the highest score<br />
in total and all six respondents, thereby indicating that the continuous requirements<br />
inflow was a main cause of overscoping. The second highest<br />
total score was given to C6 (unclear vision of overall goal), which all the<br />
participants from the software unit graded with 30-60, while the other participants<br />
graded this with 0 or 30. Causes C4, C5, +C6 and +C7 were seen<br />
as having a minor or no impact on the overscoping situation.<br />
6.2 Effect of overscoping (RQ2)<br />
In large, the questionnaire respondents had experienced or agreed to all the<br />
effects of overscoping identified from the interviews. The respondent from<br />
251
PAPER IV: ARE YOU BITING OFF MORE THAN YOU CAN CHEW? ACASE<br />
STUDY ON CAUSES AND EFFECTS OF OVERSCOPING IN LARGE–SCALE<br />
SOFTWARE ENGINEERING<br />
the product unit had no view on E5 or E6, while the requirements architect<br />
partly agreed E5. In addition, the respondents mentioned the following<br />
effects of overscoping: overtime (+E7); changed and sometimes canceled<br />
product plans (+E8); low prioritization of administrative tasks (+E9). The<br />
full questionnaire response on effects is shown in Table 4.6.<br />
In addition to stating the level of agreement to the identified effects<br />
of overscoping, the respondents were asked to grade their impact. The<br />
following notation was used:<br />
• Critical: Company or customer level.<br />
• Major: Project or unit level.<br />
• Medium: Team level.<br />
• Minor: Individual level.<br />
• None: No impact.<br />
All the effects identified from the interviews were seen as having an impact.<br />
All effects except E5 (communication gaps) were seen as having major<br />
or critical impact by a majority of the participants. There were two<br />
counts of minor impact: one for E6 (keeping SRS updated) and one for +E7<br />
(overtime).<br />
6.3 Impact of agile RE practices (RQ3)<br />
The questionnaire respondents mostly agreed to the three identified agile<br />
RE practices as impacting the challenge of overscoping, either through<br />
their own experience or by believing the practice should work in theory.<br />
Furthermore, some additional practices were mentioned as impacting overscoping:<br />
(+P4) clearer company vision (i.e. directly addressing C6), (+P5)<br />
open source development (limiting C1 by restricting what the customer<br />
can reasonably expect when large parts of the software are outside of company<br />
control) and (+P6) incremental deliveries (shorter cycles facilitate scope<br />
size control for each cycle). Table 4.7 contains the questionnaire responses<br />
on the impact of the agile RE practices on overscoping.<br />
Finally, the respondents had all experienced, agreed or partly agreed<br />
that overscoping was still a challenge for the case company. The new agile<br />
process and practices are seen to, at least partly, address the situation and<br />
provided ways to better manage and control the extent of overscoping and<br />
its effects. The practitioners’ responses concerning the current situation are<br />
shown in Table 4.8.<br />
252
Questionnaire responses (6 in total)<br />
Mentioned by nbr. of<br />
interviewees (9 in total)<br />
Agreement Impact<br />
6. VALIDATION QUESTIONNAIRE ON INTERVIEW RESULTS<br />
None<br />
Minor<br />
Medium<br />
Major<br />
Critical<br />
Don’t know<br />
Disagree<br />
Partly agree<br />
Agree<br />
Experienced<br />
E1: Many req. changes after scope is set 9 5 1 4 2<br />
(a) Wasted effort 7 5 1 3 3<br />
(b) Decreased motivation 5 4 2 3 2 1<br />
E2: Quality issues 6 6 5 1<br />
E3: Delays 4 6 5 1<br />
E4: Customer expectations not always met 1 4 2 5 1<br />
E5: Communication gaps 4 2 1 1 1 2 1 3<br />
E6: Keep SRS updated 5 1 4 1 5 1<br />
+E7: Overtime 3 1 1 1<br />
+E8: Changed and canceled product plans 1 1<br />
+E9: Administrative tasks not always performed 1 1<br />
253<br />
Table 4.6: Number of questionnaire responses on the effects of overscoping per level of agreement (notation described in<br />
Section 6) and per impact category (notation described i Section 6.2). Additional items derived from questionnaire marked<br />
with +.
PAPER IV: ARE YOU BITING OFF MORE THAN YOU CAN CHEW? ACASE<br />
STUDY ON CAUSES AND EFFECTS OF OVERSCOPING IN LARGE–SCALE<br />
SOFTWARE ENGINEERING<br />
Experienced<br />
P1: One continuous scope and<br />
release-planning flow<br />
2 4<br />
P2: Cross-functional development<br />
teams<br />
3 2 1<br />
P3: Gradual and iterative detailing<br />
of requirements<br />
2 2 2<br />
+P4: Company vision 1<br />
+P5:<br />
ment<br />
Open source develop- 1<br />
+P6: Incremental deliveries 1<br />
Table 4.7: Number of questionnaire responses on the impact of agile RE<br />
practices on overscoping per level of agreement notation described in Section<br />
6). Additional practices identified through questionnaire responses<br />
are marked with +.<br />
Experienced<br />
Overscoping is still a challenge<br />
3 1 2<br />
There is less overscoping now 1 1 3 1<br />
Overscoping is more manageable<br />
now<br />
1 3 1 1<br />
Table 4.8: Number of questionnaire responses per agreement category (described<br />
in Section 6) on the current situation at the case company with agile<br />
RE practices, as compared to when using phase-based process.<br />
254<br />
Agree (in theory)<br />
Agree (in theory)<br />
Partly agree<br />
Partly agree<br />
Disagree<br />
Disagree<br />
Do not know<br />
Do not know
7 Interpretation and discussion<br />
7. INTERPRETATION AND DISCUSSION<br />
The results of this study corroborate that overscoping is a complex and serious<br />
risk for software project management (Boehm, 1989; DeMarco and<br />
Lister, 2003; Legodi and Barry, 2010) both for phase-based and for agile<br />
development processes. In addition, the results show that communication<br />
issues have a major impact on overscoping. This complements the work by<br />
Sangwan et al and Konrad et al (Konrad and Gall, 2008) who mentioned<br />
that weak communication can cause project failures in large-scale development<br />
and global software engineering (Sangwan et al, 2006). Moreover,<br />
our results extend the lists of effects of weak coordination proposed by<br />
Sangwan et al (Sangwan et al, 2006) (long delays, leave teams idle and<br />
cause quality issues) by adding overscoping. Further research is needed to<br />
fully identify and address the factors involved. The results are discussed<br />
and related to other research in further detail, per research question, in<br />
Sections 7.1 (RQ1), 7.2 (RQ2) and 7.3 (RQ3). Finally, the limitations of this<br />
study and threats to validity of the results are discussed in Section 7.4.<br />
7.1 Causes of overscoping (RQ1)<br />
Our results indicate that overscoping is caused by a number of causes and<br />
root causes. These causes mainly originate from the nature of the MDRE<br />
context in which the company operates, but are also due to issues concerning<br />
organizational culture and structures, and communication. This<br />
was further highlighted by interviewees describing the additional cause C6<br />
(unclear vision of overall goal) and two questionnaire respondents mentioning<br />
additional causes connected to lack of respect for the decision- and<br />
development process, i.e. C7 and C8. In contrast, practitioners with experience<br />
of good cooperation and well-communicating teams described<br />
overscoping as a less serious and more manageable challenge. This may<br />
explain all the Disagree questionnaire responses but one (i.e. C5).<br />
We interpret the results around the six causes of overscoping identified<br />
through the interviews (see Section 5.1 and Figure 4.2) as follows:<br />
• continuous requirements inflow from multiple channels (C1). We interpret<br />
the homogeneity of the interview and questionnaire results (see Tables<br />
4.3, 4.4 and 4.5) to mean that a large and uncontrollable inflow of<br />
requirements has the potential to cause over-scoping when not managed<br />
and balanced against the amount of available capacity. This<br />
cause was also been identified by Regnell and Brinkkemper (Regnell<br />
and Brinkkemper, 2005) and Karlsson at el. (Karlsson et al, 2007a)<br />
as one of the challenges of MDRE. In addition to corroborating this<br />
challenge, our work also identifies that this continuous inflow of requirements<br />
can cause overscoping. The importance and seriousness<br />
of this factor are indicated by this cause scoring the highest total im-<br />
255
PAPER IV: ARE YOU BITING OFF MORE THAN YOU CAN CHEW? ACASE<br />
STUDY ON CAUSES AND EFFECTS OF OVERSCOPING IN LARGE–SCALE<br />
SOFTWARE ENGINEERING<br />
pact factor in the questionnaire, see Table 4.5. The extent to which this<br />
cause affects companies that operate in the bespoke requirements engineering<br />
context (Regnell and Brinkkemper, 2005) requires further<br />
research.<br />
Our study also reveals that the inlow of requirements can be further<br />
increased by scope creep at the software management level through<br />
a software-internal roadmap (RC1ci, see Section 5.2). In effect, this<br />
hindered resources from being available for managing new customer<br />
requirements. Similar results have been reported by Konrad et al<br />
who found that scope creep can result in problems with meeting customer<br />
expectations (Konrad and Gall, 2008), i.e. effect E4 (see Section<br />
5.3). Konrad et al (Konrad and Gall, 2008) propose addressing<br />
scope creep by increased understanding and traceability of customer<br />
requirements, and by creating an effective hierarchical CCB structure.<br />
The impact of these methods on overscoping remains to be evaluated.<br />
• no overview of software resource availability (C2). The majority of our<br />
responders (six of nine interviewees and five of six questionnaire<br />
respondents) had experienced or agreed to the lack of overview of<br />
available resources being a cause of overscoping. However, the questionnaire<br />
results suggest that the impact of this cause is not as critical<br />
as cause C1. This result is surprising, when considering the importance<br />
of management of the daily workload including coordination<br />
of tasks and activities reported by, e.g. Philips et al (Phillips et al,<br />
2012). The contrasting opinions of low development capacity (RC3c,<br />
held by RT leaders) and low respect for development costs (RCdii,<br />
held by DT roles) is interesting. This difference can be interpreted as<br />
a low understanding of each other’s viewpoint around cost and an<br />
indication that this view-point is dependent on role (related to Jorgensen<br />
and Shepperd (Jørgensen and Shepperd, 2007)). If the development<br />
capacity really is low is a different issue. Finally, this cause<br />
specifically includes the lack of over-view, or awareness of the total<br />
load on the resources. To the best of our knowledge, this issue has<br />
not been empirically investigated. Rather software cost estimation<br />
research (Jørgensen and Shepperd, 2007) mainly focuses on effort estimation<br />
and on optimizing resource assignment (Lixin, 2008).<br />
• low development team involvement in early phases (C3). The results indicate<br />
that low development involvement in the requirements phase<br />
can cause overscoping (mentioned by 6 out of 9 interviewees and 5<br />
out of 6 questionnaire respondents did not disagree to this). This<br />
confirms previous work that points out the need of early development<br />
involvement in requirements engineering, e.g. required by interdependencies<br />
between product management and software development<br />
(Nuseibeh, 2001). Glinz et al also mentioned that lack of<br />
256
7. INTERPRETATION AND DISCUSSION<br />
communication between project management and development at<br />
requirements hand-off may lead to unsatisfactory results (Glinz et al,<br />
2002). Similarly, Karlsson et al reported that communication gaps between<br />
marketing (Karlsson et al, 2007a) (requirements unit for our<br />
case company) and development, can result in insufficient effort estimates<br />
(i.e. RC3b) and in committing to unrealistically large features<br />
without considering the technical and scheduling implications (Karlsson<br />
et al, 2007a).<br />
Our results corroborate these results in that low involvement and<br />
weak communication in early phases may lead to problems later on,<br />
including overscoping. These communication issues may also exacerbate<br />
the problem of getting accurate and reliable effort estimates<br />
(RC3b). Furthermore, the fact that one questionnaire respondent expressed<br />
experiencing good communication and cooperation between<br />
requirements and development teams may also explain the one Disagree<br />
response for this cause. On the other hand, a surprising result<br />
from the validation questionnaire is that this cause (C3) was seen to<br />
influence overscoping less than cause C6 (unclear vision of overall<br />
goal) both in total (among all respondents) and by 2 of the 3 software<br />
respondents. These results indicate that there may be additional (uncovered)<br />
factors that influence the impact this cause has on overscoping.<br />
Finally, several methods have been proposed for addressing cause<br />
C3, e.g. negotiation of implementation proposals (Fricker et al, 2007),<br />
model connectors for transforming requirements to architecture (Medvidovic<br />
et al, 2003), cooperative requirements capturing (Macaulay,<br />
1993) and involving customers in the requirements management process<br />
(Kabbedijk et al, 2009). Goal-oriented reasoning can also provide<br />
constructive guidelines for architects in their design tasks (van Lamsweerde,<br />
2003). If and to which degree the mentioned methods can<br />
alleviate overscoping by impacting this cause remains a topic for further<br />
research.<br />
• requirements not agreed with development team (C4). The results provide<br />
empirical evidence that weak agreement on requirements between<br />
requirements and software units can cause overscoping (all 6<br />
questionnaire responders agreed to cause C4 and five interviewees<br />
mentioned C4 as a cause of overscoping). A significant root cause for<br />
this cause was found to be communication gaps, mainly between the<br />
requirements-related roles and the development and testing roles.<br />
This confirms the viewpoint of Hall et al (2002) that most requirement<br />
problems are actually organizational issues. In addition, this confirms<br />
the importance of seamless integration of different processes in<br />
collaborative work (Ebert and De Man, 2002). The impact of insufficient<br />
communication on software engineering has been reported as<br />
257
PAPER IV: ARE YOU BITING OFF MORE THAN YOU CAN CHEW? ACASE<br />
STUDY ON CAUSES AND EFFECTS OF OVERSCOPING IN LARGE–SCALE<br />
SOFTWARE ENGINEERING<br />
a general issue within requirements engineering and product management<br />
(Bjarnason et al, 2011b; Fricker et al, 2007; Hall et al, 2002;<br />
Kabbedijk et al, 2009; Karlsson et al, 2007a). Surprisingly, C4 scored<br />
the lowest impact among all the causes and only two questionnaire<br />
responders (both from the software unit) rated this cause as having<br />
any (low) impact factor on overscoping. In contrast, cause C6 (weak<br />
vision of overall goal) was rated as having the largest impact on overscoping.<br />
• detailed requirements specification produced upfront (C5). Our results indicate<br />
that too much detailed documentation produced upfront may<br />
cause overscoping (mentioned by five interviewees and experienced,<br />
agreed or partly agreed to by five questionnaire respondents, see section<br />
5.1). This complements other studies into documentation in software<br />
engineering projects. For example, Emam and Madhavji mentioned<br />
that in organizations which require more control the pressure<br />
to produce much detail is also greater (El Emam and Madhavji, 1995).<br />
Lethbridge reported that, for software engineers, there is often too<br />
much documentation for software systems, frequently poorly written<br />
and out of date (Lethbridge et al, 2003). Furthermore, Sawyer et<br />
al (1999) mention that premature freezing of requirements may cause<br />
scope creep and communication problems (both of which are identified<br />
as root causes of overscoping in our study) and suggest evolutionary<br />
prototyping as a remedy. Other remedies suggested for<br />
addressing excessive documentation include reuse of requirements<br />
specifications (Faulk, 2001), as well as, simply creating less documentation<br />
(Aurum and Martin, 1999). The effectiveness of these methods<br />
for the risk of overscoping remains to be investigated.<br />
The differing views on this cause between respondents may be explained<br />
by their roles and relationship to RE. All the disagreeing<br />
questionnaire respondents for this cause worked with requirements<br />
related roles. These roles are more likely to consider detailed requirements<br />
specifications as positive and good, rather than an issue. However,<br />
these roles have less insight into the later phases when development<br />
takes place and the effects of overscoping are experienced.<br />
Three of the respondents with experience from later development<br />
phases had experienced C5 as causing overscoping. Furthermore,<br />
Berry et al mentioned that when time for elicitation is short, i.e. there<br />
is a lack of upfront documentation (or lack of C5), the requirements<br />
usually end up as an enhancement or become descoped since all of<br />
the client’s requests can not be delivered (Berry et al, 2010). Considering<br />
this, we conclude that both under specifying, as in Berry et<br />
al (2010), and over specifying, as in our study, can cause overscoping<br />
and later descoping, and that it remains to be investigated how to<br />
strike a good balance.<br />
258
7. INTERPRETATION AND DISCUSSION<br />
• unclear vision of overall goal (C6). Our study identifies that a lack of<br />
clearly communicated goals and strategy for software development<br />
may cause defining the project scope primarily from a technology<br />
perspective, rather than with a business focus, thereby contributing<br />
to overscoping. Overall this cause was graded as having the<br />
second largest impact on overscoping, despite one questionnaire respondent<br />
(an RT leader) disagreeing to this cause. Our results support<br />
the findings from related papers (Aurum and Wohlin, 2005a;<br />
Selby and Cusumano, 1998; DeMarco and Lister, 2003; Khurum et al,<br />
2007; Neumann-Alkier, 1997; Rosca et al, 1997) that stress the importance<br />
of selecting requirements aligned with the overall business<br />
goals and discarding others as early as possible. In addition, failure<br />
of stakeholders to concur on project goals was found by DeMarco<br />
and Lister to pose the biggest risk for a project (DeMarco and Lister,<br />
2003).<br />
A method for early requirements triage based on management strategies<br />
was proposed by Khurum et al (2007). Aurum and Wohlin have<br />
proposed a framework for aligning requirements with business objectives<br />
(Aurum and Wohlin, 2005a). Rosca et al mention that the<br />
most demanding characteristic of business is the likelihood of change<br />
which can not be fully controlled (Rosca et al, 1997). This can be<br />
managed when business objectives are clear to the software developers,<br />
thus enabling them to manage a system requiring modifications<br />
while meeting the business objectives (Selby and Cusumano, 1998).<br />
Finally, Karlsson et al (2007a) mentioned the lack of common goals<br />
and visions as a challenge in achieving good cooperation, quoting<br />
their responders: ’If everyone has the same goal and vision, then everyone<br />
works in the right direction.’<br />
• weak process adherence (+C7) and scope and deadline dictated by management<br />
(+C8). These two causes were mentioned in the questionnaires,<br />
though none of them were seen as having any major impact on overscoping.<br />
Karlsson et al (2007a) found that weak process adherence<br />
may be caused both by high process complexity, as well as, lack of<br />
time for process implementation. The latter could be a consequence<br />
of overscoping. The direction of causal relationship between overscoping<br />
and process adherence remains to be investigated.<br />
7.2 The effects of overscoping (RQ2)<br />
The results indicate that overscoping may lead to a number of effects (or<br />
consequences), many of which are judged to be serious and potentially<br />
very costly for the company. Several of the identified effects may be in line<br />
with held beliefs about what overloading a project with too much work<br />
may lead to. The aim of this study is to investigate if such beliefs can be<br />
259
PAPER IV: ARE YOU BITING OFF MORE THAN YOU CAN CHEW? ACASE<br />
STUDY ON CAUSES AND EFFECTS OF OVERSCOPING IN LARGE–SCALE<br />
SOFTWARE ENGINEERING<br />
supported by empirical evidence or not, and if more surprising phenomena<br />
arise in relation to a specific, real-world overscoping situation.<br />
• many changes after the project scope is set (E1). The results show that<br />
overscoping leads to a large number of scope changes (experienced<br />
by all responders and impact graded as critical or major by all six<br />
questionnaire responders). This confirms evidence provided by Harker<br />
et al (1993) that requirements are not static and, thus, are hard to capture<br />
or classify. In addition, requirements volatility is mentioned as<br />
one of the challenges in MDRE by Karlsson et al (2007a) and identified<br />
by Ramesh et al (2010) as one of the 14 assumptions underlying<br />
agile software development. Furthermore, origins of requirements<br />
volatility have been listed (Harker et al, 1993). Despite this awareness,<br />
causes for requirements volatility have not been empirically explored.<br />
Our results highlight overscoping as one possible cause of<br />
late requirement changes. Furthermore, our results confirm that it is<br />
challenging to manage requirement changes.<br />
• quality issues (E2). The results indicate this as an important effect of<br />
overscoping (experienced and agreed for both interviews and questionnaires,<br />
and graded as having critical or major impact). This confirms<br />
that the quality of requirements engineering determines the<br />
software quality, as reported, e.g. by Aurum and Wohlin (2005b).<br />
In addition, our results highlight overscoping as a potential reason<br />
for quality issues.<br />
• delays (E3). This study shows (with a high degree of alignment between<br />
interviewees and questionnaire responses) that delays can be<br />
an effect of overscoping. Within MDRE, delays in launching products<br />
can be very costly and result in loss of market shares (Sawyer<br />
et al, 1999; Sawyer, 2000; Regnell and Brinkkemper, 2005; Karlsson<br />
et al, 2007a). Therefore, the insight that overscoping may have this<br />
effect is important evidence that indicates that overscoping is a (potentially)<br />
serious risk.<br />
• customer expectations are not always met (E4). Our results indicate that<br />
overscoping can have the effect of failing to meet customer expectations.<br />
This could be explained by an overloaded project having no<br />
time or capacity neither to analyse or implement new requirements,<br />
nor to validate if market or customer needs could have changed. Furthermore,<br />
Karlsson et al (2007a) reported failure to meet customer<br />
needs as one of the risks of developing products based on a technology<br />
focus (root cause RC6b). Another crucial part of producing software<br />
products that will satisfy the customers, as pointed out by Aurum<br />
and Wohlin (2005b), is working with RE throughout the project<br />
life cycle (as opposed to upfront requirements detailing, C5). The<br />
260
7. INTERPRETATION AND DISCUSSION<br />
results of this study highlight the importance of selecting a feasible<br />
scope as one factor to consider when attempting to better understand<br />
and capture the customers’ needs.<br />
• communication gaps (E5). Our results indicate that overscoping may<br />
cause increased communication gaps. (Roughly half of our interviewees<br />
and questionnaire respondents mentioned and agreed to this<br />
effect.) This may be explained by the tendency to deflect by blaming<br />
others when under pressure, rather than cooperate to solve problems<br />
together. Furthermore, interviewees described that the many<br />
changes resulting from overscoping (E1) were badly communicated<br />
to the product unit and resulted in false error reports being filed on<br />
changed, but not updated requirements. This in turn, caused irritation<br />
among the development teams and further increased the communica<br />
tion gaps. Similarly, Karlsson et al (2007a) reported that constant<br />
inflow of requirements (cause C1) caused decision conflicts between<br />
marketing and development roles.<br />
• challenge to keep SRS updated (E6). The majority of the respondents<br />
confirmed that overscoping increases the challenge to keep the SRS<br />
updated. When the SRS is detailed upfront (C5), the combination<br />
of the two (overscoping) effects E1 (many scope changes) and E1b<br />
(decreased motivation) lead to an increased need, but a lower motivation<br />
to update the SRS. This complements previous work, which<br />
reports requirements volatility as a common challenge for software<br />
projects (Harker et al, 1993; Hood et al, 2008; Jönsson and Lindvall,<br />
2005; Wiegers, 2003) and that the view of RE as concerning a static set<br />
of requirements is inappropriate (Hall et al, 2002; Harker et al, 1993).<br />
In addition, Berry et al report that time and resources are never sufficient<br />
to keep the documentation updated and that scope creep occurs<br />
when programmers code while the documentation keeps changing<br />
(Berry et al, 2010). Furthermore, our study highlights that the<br />
challenge of keeping the SRS updated is increased as an effect of overscoping.<br />
Harker et al (1993) proposed to address this challenge by<br />
defining a minimum critical specification combined with incremental<br />
deliveries (i.e. +P6) and thereby gradually providing more value.<br />
Further research is needed to investigate if the methods proposed to<br />
address the challenge of updating the requirements documentation<br />
could also minimize this effect for overscoping.<br />
• overtime (+E7), changed/cancelled product plans (+E8), low priority for administrative<br />
tasks (+E9). These effects were mentioned in the validation<br />
questionnaires and each got one count of critical impact. Further<br />
investigations are needed to validate their relationship to overscoping.<br />
261
PAPER IV: ARE YOU BITING OFF MORE THAN YOU CAN CHEW? ACASE<br />
STUDY ON CAUSES AND EFFECTS OF OVERSCOPING IN LARGE–SCALE<br />
SOFTWARE ENGINEERING<br />
7.3 How agile RE practices may impact overscoping (RQ3)<br />
Our study identifies that three of the agile RE practices being introduced at<br />
the case company may impact several of the causes and root causes of overscoping.<br />
In addition, three more practices were suggested by questionnaire<br />
respondents as addressing overscoping. The details of how the identified<br />
agile RE practices may impact overscoping (mentioned root causes can be<br />
seen in Figure 4.2) are discussed below. We interpret the results as an indication<br />
that overscoping is still a challenge for the case company, though<br />
more manageable with the (partly implemented) agile RE practices. Further<br />
investigations are needed to fully understand the situation in the agile<br />
context.<br />
• one continuous scope and release planning flow (P1) is experienced by<br />
the responders to directly impact cause C2 (no overview of software<br />
resource availability) by enabling transparency and insight into the<br />
full project scope and into the current workload of the software unit.<br />
The increased visibility of the load and available resource capacity<br />
to both business and software unit may bridge several communication<br />
gaps identified as root cause of overscoping, i.e. RC1c, RC3d<br />
and RC4b. This practice covers the agile RE practices of requirements<br />
prioritization and constant re-planning for the high-level requirements<br />
(Ramesh et al, 2010). Our results confirm the findings of<br />
Dybå and Dingsøyr that managers of agile companies are more satisfied<br />
with the way they plan their projects than are plan-based companies<br />
(Dybå and Dingsøyr, 2008). Furthermore, our study also corroborates<br />
the findings that agile prioritization of the scope in combination<br />
with a stage-gate model at the feature level can avoid delaying<br />
critical features and also provides early feedback on features (Karlström<br />
and Runeson, 2005). However, achieving correct high-level<br />
cost and schedule estimation has been identified as a challenge also<br />
for agile project (Ramesh et al, 2010), which may be one reason why<br />
overscoping remains an issue for the case company.<br />
• Cross-functional development teams (P2) are indicated by our results<br />
as improving several of the communication gaps identified by our<br />
study as important root causes to overscoping (i.e. RC1c, RC2a, RC3d,<br />
RC4b, RC6d). This case company practice is equivalent to the agile<br />
RE practice of preferring face-to-face requirements communication<br />
over written documentation (Beck et al, 2012) in combination with<br />
agile prioritization and constant re-planning at the detailed requirements<br />
level (Ramesh et al, 2010). At this detailed requirements level,<br />
cost and schedule estimations in an agile fashion (by only allowing<br />
additions when simultaneously removing something less prioritized)<br />
have been found to be efficient (Ramesh et al, 2010; Karlström<br />
and Runeson, 2005) and eliminate the ’requirements cramming’ prob-<br />
262
7. INTERPRETATION AND DISCUSSION<br />
lem (Karlström and Runeson, 2005), which is equivalent to overscoping.<br />
Other studies have found that communication within development<br />
teams is improved by agile practices, but that communication<br />
towards other (dependent) teams remains a challenge (Karlström<br />
and Runeson, 2005; Pikkarainen et al, 2008). This challenge<br />
is addressed with P2 by including competence covering all the involved<br />
functional areas within the same team (thus, impacting root<br />
causes RCicii, RC2a, RC4b and RC6dii). Furthermore, the agile RE<br />
practice of including a customer representative in the development<br />
teams is summarized by Dybå and Dingsøyr (2008) as improving<br />
the communication been customer and engineers, while filling this<br />
role can be stressful and challenging (Karlström and Runeson, 2005;<br />
Ramesh et al, 2010).<br />
• Gradual and iterative requirements detailing (P3) is seen (by our interviewees)<br />
to decrease the total lead time for development of a feature<br />
(root cause RC1b) by delaying the detailing of requirements until<br />
they are actually needed for design and development. This in turn<br />
reduces the amount of requirement changes within the (shorter) time<br />
frame for the feature development, which in a market with high requirements<br />
volatility is a significant improvement. It may also reduce<br />
the communication gaps that occur due to the timing aspect<br />
of detailing requirements before design and implementation starts,<br />
i.e. root causes RC3d, RC4a, RC4b. The case company practice P3 is<br />
equivalent to the agile practice of iterative RE (Ramesh et al, 2010).<br />
7.4 Threats to validity and limitations<br />
As for every study there are limitations that should be discussed and addressed.<br />
These threats to validity and steps taken to mitigate them are<br />
reported here based on guidelines provided by Robson (2002) for flexible<br />
design studies. Another important aspect for the quality of a flexible<br />
design research is the investigator (Robson, 2002), and for this study all<br />
researchers involved have previous experience in conducting empirical research,<br />
both interview studies and surveys.<br />
7.4.1 Description validity<br />
Misinterpretation (Robson, 2002) of the interviewees poses the main threat<br />
to description validity. This threat was addressed in several ways. The<br />
interviews were recorded and transcribed. To enhance reliability of the<br />
transcriptions, the person taking notes during the interviews also transcribed<br />
them. In addition, this person has worked for the case company<br />
for several years and is well versed in company culture and language.<br />
Also, data triangulation was applied to the transcriptions by another re-<br />
263
PAPER IV: ARE YOU BITING OFF MORE THAN YOU CAN CHEW? ACASE<br />
STUDY ON CAUSES AND EFFECTS OF OVERSCOPING IN LARGE–SCALE<br />
SOFTWARE ENGINEERING<br />
searcher performing an independent transcription and coding of two randomly<br />
selected interviews. Furthermore, the interviewees checked both<br />
the transcriptions and the results of the study for errors and misinterpretations.<br />
Finally, data triangulation was applied to the interview results by<br />
collecting additional viewpoints from six (other) practitioners through a<br />
questionnaire (Robson, 2002).<br />
7.4.2 Interpretation validity<br />
For this study, the main threat to valid interpretation has been the risk of<br />
imposing the hypothesis (formulated in phase one) onto the interviewees.<br />
To address this threat, open interview questions were always posed before<br />
asking specific questions based on the hypothesis. Furthermore, spontaneous<br />
descriptions of causes (without prompting) have been reported (as<br />
Experienced) separately from responses to follow-up questions on specific<br />
causes (as Agreed), see Section 5.1 and Table 4.3.<br />
For phase three, the threat to valid description was addressed by the<br />
researchers jointly designing the questionnaire and the session held in connection<br />
to it. To ensure that all questionnaire responders correctly and<br />
uniformly understood the interview results, the results were presented<br />
to the participants. They could then ask for clarifications before filling<br />
out the questionnaire. The fact that questionnaire responders were confronted<br />
with a frame- work of results remains an open threat to interpretation<br />
validity. On the other hand, both interviewees and questionnaire respondents<br />
were explicitly encouraged to disagree and mention additional<br />
causes, effects and practices, which they also did. One of the main limitations<br />
of the study is the limited number of respondents. Although representatives<br />
from each of the covered units of the case company were involved<br />
in both interviews and validation questionnaire, the number of persons<br />
is relatively small and more factors may be identified by including<br />
additional viewpoints.<br />
7.4.3 Theory validity<br />
The main threat to theory validity for this study is the risk of missing additional<br />
or alternative factors. One source of this threat is the limited set of<br />
practitioners from which data has been gathered. Another potential source<br />
is the risk of observer biases limiting the study to the researcher’s preknowledge<br />
of the company. This was a risk mainly in phase one and was<br />
addressed by involving the other researchers in discussing and reviewing<br />
the study design and the hypothesis which shaped the interview instrument.<br />
The fact that an additional main cause (i.e. C6) was identified as<br />
a result of the interviews shows that this bias was successfully addressed.<br />
However, identification of additional results in phase 3 may indicate that<br />
saturation and the full exploration of the problem under investigation is<br />
264
8. CONCLUSIONS AND FURTHER WORK<br />
not yet reached. As the goal of this work is exploratory our aim is not to<br />
present or achieve a complete coverage of the problem under investigation.<br />
The involvement of the researcher with work experience from the case<br />
company has played a vital role in the study. This has en- sured that the investigated<br />
problem is authentic and that the re- sults are derived though an<br />
interpretation of the data based on a deep understanding of the case and its<br />
context. However, the results are limited to the case company and there is<br />
a risk that other possible causes of overscoping experienced at other companies<br />
were not identified. This also applies to the set of agile RE practices,<br />
which are limited to the ones that were currently known and partly implemented<br />
at the case company at the time of the study.<br />
Internal generalisability was addressed by sampling interviewees and<br />
questionnaire respondents from different parts of the company thereby selecting<br />
roles and responsibilities involved throughout the development life<br />
cycle. Even so, it was not possible to include representatives from sales and<br />
marketing (they were unavailable at the time of the study). However, the<br />
requirements team leaders provided some insight into these aspects based<br />
on their experience from contacts with customers and with sales and marketing<br />
roles.<br />
Considering external generalisability, the results should be interpreted<br />
with the case company context in mind. External validity is addressed by<br />
using analytical generalization which enables drawing conclusions without<br />
statistical analysis and, under certain conditions, relating them also to<br />
other cases (Robson, 2002; Runeson et al, 2012). Within the scope of this<br />
paper, analytical generalization is argued by applying the making a case<br />
strategy ( (Robson, 2002), p. 107) by analysing related work and reporting<br />
similarities, differences and disagreements to our results (see Section 7).<br />
This analysis builds a supporting argument towards external validity of<br />
our study by seeking data which is not confirming a pre-assumed theory.<br />
In addition, follow-up studies in other domains can be conducted to utilize<br />
the direct demonstration strategy to further address the threat to external<br />
validity (Robson, 2002).<br />
8 Conclusions and further work<br />
Decision making is at the heart of requirements engineering (RE) (Aurum<br />
and Wohlin, 2003) and within market-driven requirements engineering<br />
(MDRE) release planning is one of the most important and challenging<br />
tasks (Karlsson et al, 2007a,b; Regnell and Brinkkemper, 2005; Sawyer<br />
et al, 1999). Decisions concerning what to develop, and when, are inherently<br />
related to achieving customer satisfaction. Even though release planning<br />
(Karlsson and Ryan, 1997; Karlsson et al, 2007b; Regnell and Brinkkemper,<br />
2005) is well researched, RE decision making is acknowledged as challenging<br />
(Alenljung and Persson, 2008; Aurum and Wohlin, 2003; Ngo-The<br />
265
PAPER IV: ARE YOU BITING OFF MORE THAN YOU CAN CHEW? ACASE<br />
STUDY ON CAUSES AND EFFECTS OF OVERSCOPING IN LARGE–SCALE<br />
SOFTWARE ENGINEERING<br />
and Ruhe, 2005) and scope creep is ranked as a serious project risk (Carter<br />
et al, 2001; Crockford, 1980; Iacovou and Dexter, 2004), other aspects of<br />
scope management have been less explored (van de Weerd et al, 2006).<br />
Furthermore, techniques for prioritizing requirements (Karlsson and Ryan,<br />
1997; Karlsson et al, 2007b) often focus on planning the scope of a project as<br />
a discrete activity, or one in a series of releases (Ngo-The and Ruhe, 2005).<br />
Our previous work reported that scoping in an MDRE context is a continuous<br />
activity that may last throughout the entire project lifecycle (<strong>Wnuk</strong><br />
et al, 2009). If not successfully managed, and more requirements are included<br />
into the project scope than can be handled with available resources<br />
the result is overscoping, i.e. the project ’bites off more than it can chew’.<br />
Our study provides a detailed picture of factors involved in overscoping<br />
and confirms that scoping is a challenging part of requirements engineering<br />
and one of the risks in project management (Boehm, 1989; De-<br />
Marco and Lister, 2003; Legodi and Barry, 2010). Our results indicate that<br />
overscoping is mainly caused by the fast-moving market-driven domain in<br />
which the case company operates, and how this inflow of requirements is<br />
managed. In the early project phases, low involvement from the developmentnear<br />
roles in combination with weak awareness of overall goals may result<br />
in an unrealistically large project scope. Our study indicates that overscoping<br />
can lead to a number of negative effects, including quality issues,<br />
delays and failure to meet customer expectations. Delays and quality problems<br />
are expensive, not just considering the cost of fixing the quality issues,<br />
but also in loss of market shares and brand value (Regnell and Brinkkemper,<br />
2005). Furthermore, we found indications that a situation of overscoping<br />
may cause even more overscoping, i.e. an organization may end up in<br />
a vicious cycle when overscoping ties up development resources which are<br />
then not available for participating in early project phases. Furthermore,<br />
overscoping leads to increased communication gaps, which in turn are root<br />
causes of overscoping.<br />
Companies, such as our case company, that develop embedded software<br />
for a business domain with a high market pressure need an organizational<br />
set-up and process suited to efficiently managing frequent changes<br />
in a cost effective way. Development projects need to respond quickly to<br />
changes, while at the same time handling the complexity of developing<br />
software in a large-scale setting. Agile processes are claimed to be better<br />
adapted to managing change than phase-based ones. As one interviewee<br />
stated: ’The waterfall approach is good from a preparation perspective,<br />
if you can then stick to what is planned. But, since we live in a world<br />
that changes a lot it doesn’t work after all.’ Our study indicates, that despite<br />
introducing agile RE practices, overscoping is still an issue for the<br />
case company, although more manageable. We conclude that the improvements<br />
may be explained by the agile RE practices of continuous prioritization<br />
of the project scope, in combination with performing cost and schedule<br />
estimation, and gradual requirements detailing, in close collaboration<br />
266
8. CONCLUSIONS AND FURTHER WORK<br />
within cross-functional teams, thereby closing a number of communication<br />
gaps. However, agile RE practices also pose challenges (Ramesh et al,<br />
2010), e.g. communication between teams (Karlström and Runeson, 2005;<br />
Pikkarainen et al, 2008), difficulty in cost estimation (Ramesh et al, 2010).<br />
This, in combination with a fast-moving, market-driven domain may explain<br />
why overscoping remains a challenge also with the agile development<br />
process.<br />
The causes and effects unveiled through this study (summarized in Figure<br />
4.2) can be used as a basis for identifying potential issues to address<br />
in order to avoid or alleviate an overscoping situation. For example, the<br />
root cause of low competence in cost estimations may be addressed by introducing<br />
techniques for improving cost estimation, which should lead to<br />
more realistic plans. Finally, supported by our findings of potentially serious<br />
effects of overscoping, we conclude that this phenomenon can be a major<br />
risk of requirements engineering and project management, complementary<br />
to the risk of scope creep mentioned by De Marco and Lister (2003).<br />
Acknowledgments<br />
We would like to thank all anonymous interviewees and questionnaire respondents<br />
for their invaluable contribution to this project. We would also<br />
like to thank Dr. Dietmar Pfahl for reviewing an early version of this paper.<br />
The project is partly funded by the Swedish Foundation for Strategic Research<br />
and VINNOVA (The Swedish Governmental Agency for Innovation<br />
Systems) within the EASE and UPITER Projects.<br />
267
PAPER IV: ARE YOU BITING OFF MORE THAN YOU CAN CHEW? ACASE<br />
STUDY ON CAUSES AND EFFECTS OF OVERSCOPING IN LARGE–SCALE<br />
SOFTWARE ENGINEERING<br />
268
Bibliography<br />
REFERENCES<br />
Abramovici M, Sieg O (2002) Status development trends of product lifecycle<br />
management systems. In: Proceedings of International Conference<br />
Integrated Product and Process Development, pp 55–70<br />
Alenljung B, Persson A (2008) Portraying the practice of decision-making<br />
in requirements engineering: a case of large scale bespoke development.<br />
Requirements Eng 13(4):257–279<br />
Aurum A, Martin E (1999) Managing both individual and collective participation<br />
in software requirements elicitation process. In: Proceedings<br />
of the14th International Symposium on Computer and Information Sciences,<br />
Turkey, (ISCIS’99), pp 124–131<br />
Aurum A, Wohlin C (2003) The fundamental nature of requirements engineering<br />
activities as a decision-making process. Information and Software<br />
Technology 45(14):945–954<br />
Aurum A, Wohlin C (2005a) Aligning requirements with business objectives:<br />
a framework for requirements engineering decisions. In: Proceedings<br />
of the Workshop on Requirements Engineering Decision Support,<br />
REDECS’05<br />
Aurum A, Wohlin C (2005b) Requirements engineering: Setting the context.<br />
In: Aurum A, Wohlin C (eds) Engineering and Managing Software<br />
Requirements, Springer Berlin Heidelberg, pp 1–15<br />
Beck K (1999) Extreme Programming Explained. Addison-Wesley<br />
Beck K, Beedle M, Bennekum A, Cockburn A, Cunningham W, Fowler M,<br />
Grenning J, Highsmith J, Hunt A, Jeffries R, Kern J, Marick B, Martin R,<br />
Mellor S, Schwaber K, Sutherland J, Thomas D (2012) The agile manifesto.<br />
<br />
Berry D, Czarnecki K, Antkiewicz M, AbdElRazik M (2010) Requirements<br />
determination is unstoppable: An experience report. In: Proceedings<br />
of the 18th IEEE International Requirements Engineering Conference<br />
(RE’10), pp 311 –316<br />
Bjarnason E (2012) Case study material (interview instrument, questionnaire,<br />
etc) for the before and after (bna) study. <br />
<br />
Bjarnason E, <strong>Wnuk</strong> K, Regnell B (2010) Overscoping: Reasons and consequences;<br />
a case study on decision making in software product management.<br />
In: Proceedings of the Fourth International Workshop on Software<br />
Product Management (IWSPM’2010), pp 30 –39<br />
269
REFERENCES<br />
Bjarnason E, <strong>Wnuk</strong> K, Regnell B (2011a) A case study on benefits and sideeffects<br />
of agile practices in large-scale requirements engineering. In: Proceedings<br />
of the 1st Workshop on Agile Requirements Engineering, ACM,<br />
New York, NY, USA, AREW ’11, pp 3:1–3:5<br />
Bjarnason E, <strong>Wnuk</strong> K, Regnell B (2011b) Requirements are slipping<br />
through the gaps; a case study on causes amp; effects of communication<br />
gaps in large-scale software development. In: Proceedings of the 19th<br />
IEEE International Requirements Engineering Conference (RE’2011), pp<br />
37 –46<br />
Boehm B (1989) Software risk management. Tutorial notes, IEEE Computer<br />
Society Press<br />
Carlshamre P (2002) A usability perspective on requirements engineering –<br />
from methodology to product development. PhD thesis, Linköping University,<br />
Sweden<br />
Carlshamre P, Sandahl K, Lindvall M, Regnell B, Natt och Dag J (2001) An<br />
industrial survey of requirements interdependencies in software product<br />
release planning. In: Proceedings of the Fifth IEEE International<br />
Symposium on Requirements Engineering (RE 2001), pp 84–91<br />
Carter R, Antón AI, Dagnino A, Williams L (2001) Evolving beyond requirements<br />
creep: A risk-based evolutionary prototyping model. In:<br />
Proceedings of the 5th IEEE International Symposium on Requirements<br />
Engineering (RE’01, pp 94–101<br />
Crockford N (1980) An introduction to risk management. Woodhead-<br />
Faulkner<br />
DeBaud J, Schmid K (1999) A systematic approach to derive the scope of<br />
software product lines. In: Proceedings of the 21st International Conference<br />
on Software Engineering (ICSE 1999), pp 34–43<br />
DeMarco T, Lister T (2003) Risk management during requirements. Software,<br />
IEEE 20(5):99 – 101<br />
Dybå T, Dingsøyr T (2008) Empirical studies of agile software development:<br />
A systematic review. Inf Softw Technol 50(9-10):833–859<br />
Ebert C, De Man J (2002) e-r &deffectively managing process diversity.<br />
Ann Softw Eng 14(1-4):73–91<br />
El Emam K, Madhavji N (1995) A field study of requirements engineering<br />
practices in information systems development. In: Proceedings of<br />
the Second IEEE International Symposium on Requirements Engineering<br />
RE’95, pp 68 – 80<br />
270
REFERENCES<br />
Faulk S (2001) Product-line requirements specification (prs): An approach<br />
and case study. In: Proceedings of the Fifth IEEE International Symposium<br />
on Requirements Engineering, IEEE Computer Society, Washington,<br />
DC, USA, RE ’01, pp 48–<br />
Fricker S, Gorschek T, Myllyperkiö P (2007) Handshaking between software<br />
projects and stakeholders using implementation proposals. In: Proceedings<br />
of the 13th international working conference on Requirements<br />
engineering: foundation for software quality, Springer-Verlag, Berlin,<br />
Heidelberg, REFSQ’07, pp 144–159<br />
Gemmer A (1997) Risk management: moving beyond process. Computer<br />
30(5):33 –43<br />
Glinz M, Berner S, Joos S (2002) Object-oriented modeling with adora. Information<br />
Systems 27:425–444<br />
Gorschek T, Wohlin C (2006) Requirements abstraction model. Requirements<br />
Engineering Journal 11:79–101<br />
Hall T, Beecham S, Rainer A (2002) Requirements problems in twelve software<br />
companies: an empirical analysis. IEEE Software 149(5):153 – 160<br />
Harker S, Eason K, Dobson J (1993) The change and evolution of requirements<br />
as a challenge to the practice of software engineering. In: Proceedings<br />
of IEEE International Symposium on Requirements Engineering<br />
RE’93, pp 266 –272<br />
Hood C, Wiedemann S, Fichtinger S, Pautz U (2008) Change management<br />
interface. In: Requirements Management, Springer Berlin Heidelberg,<br />
pp 175–191<br />
Iacovou C, Dexter A (2004) Turning around runaway information technology<br />
projects. Engineering Management Review, IEEE 32(4):97 –112<br />
Jönsson P, Lindvall M (2005) Impact analysis. In: Aurum A, Wohlin C (eds)<br />
Engineering and Managing Software Requirements, Springer Berlin Heidelberg,<br />
pp 117–142<br />
Jørgensen M, Shepperd M (2007) A systematic review of software development<br />
cost estimation studies. IEEE Trans Softw Eng 33(1):33–53<br />
Kabbedijk J, Brinkkemper S, Jansen S, van der Veldt B (2009) Customer<br />
involvement in requirements management: Lessons from mass market<br />
software development. In: Proceedings of the 17th IEEE International<br />
Requirements Engineering Conference, (RE’09), pp 281 –286<br />
Karlsson J, Ryan K (1997) A cost-value approach for prioritizing requirements.<br />
IEEE Software 14(5):67–74<br />
271
REFERENCES<br />
Karlsson L, Dahlstedt sG, Regnell B, Natt och Dag J, Persson A (2007a)<br />
Requirements engineering challenges in market-driven software development<br />
- an interview study with practitioners. Inf Softw Technol<br />
49(6):588–604<br />
Karlsson L, Thelin T, Regnell B, Berander P, Wohlin C (2007b) Pair-wise<br />
comparisons versus planning game partitioning–experiments on requirements<br />
prioritisation techniques. Empirical Softw Engg 12(1):3–33<br />
Karlström D, Runeson P (2005) Combining agile methods with stage-gate<br />
project management. Software, IEEE 22(3):43 – 49<br />
Khurum M, Aslam K, Gorschek T (2007) A method for early requirements<br />
triage and selection utilizing product strategies. In: Proceedings of the<br />
14th Asia-Pacific Software Engineering Conference, IEEE Computer Society,<br />
Washington, DC, USA, APSEC ’07, pp 97–104<br />
Konrad S, Gall M (2008) Requirements engineering in the development of<br />
large-scale systems. In: Proceedings of the 16th International Requirements<br />
Engineering Conference (RE 2008), pp 217–222<br />
Legodi I, Barry M (2010) The current challenges and status of risk management<br />
in enterprise data warehouse projects in south africa. In: Technology<br />
Management for Global Economic Growth (PICMET), 2010 Proceedings<br />
of PICMET ’10:, pp 1 –5<br />
Lethbridge T, Singer J, Forward A (2003) How software engineers use documentation:<br />
the state of the practice. Software, IEEE 20(6):35 –39<br />
Lixin Z (2008) A project human resource allocation method based on software<br />
architecture and social network. In: Proceedings of the 4th International<br />
Conference on Wireless Communications, Networking and Mobile<br />
Computing, 2008. WiCOM ’08., pp 1 –6<br />
Macaulay L (1993) Requirements capture as a cooperative activity. In: Requirements<br />
Engineering, 1993., Proceedings of the IEEE International<br />
Symposium on, pp 174 –181<br />
Medvidovic N, Grünbacher P, Egyed A, Boehm BW (2003) Bridging models<br />
across the software lifecycle. J Syst Softw 68(3):199–215<br />
Myers M, Avison D (2002) Qualitative research in information systems<br />
Neumann-Alkier L (1997) Think globally, act locally - does it follow the<br />
rule in multinational corporations? In: ECIS’97, pp 541–552<br />
Ngo-The A, Ruhe G (2005) Engineering and Managing Software Requirements,<br />
Springer, chap Decision Support in Requirements Engineering,<br />
pp 267–286<br />
272
REFERENCES<br />
Nuseibeh B (2001) Weaving together requirements and architectures. Computer<br />
34(3):115 –119<br />
Phillips J, Bothell T, Snead G (2012) The Project Management Scorecard.<br />
Improving Human Performance Series, Taylor and Francis<br />
Pikkarainen M, Haikara J, Salo O, Abrahamsson P, Still J (2008) The impact<br />
of agile practices on communication in software development. Empirical<br />
Softw Engg 13(3):303–337<br />
Pohl K, Bockle G, van der Linden F (2005) Software Product Line Engineering:<br />
Foundations, Principles and Techniques. SpringerVerlag<br />
Potts C (1995) Invented requirements and imagined customers: requirements<br />
engineering for off-the-shelf software. In: Proceedings of the Second<br />
IEEE International Symposium on Requirements Engineering (RE<br />
95), pp 128–130<br />
Project Management Institute (2000) A Guide to the Project Management<br />
Body of Knowledge (PMBOK Guide), 2000, Project Management Institute,<br />
Four Campus Boulevard, Newtown Square, PA 19073-3299, USA,<br />
chap Chapter 5: Project Scope Management, pp 47–59<br />
Ramesh B, Cao L, Baskerville R (2010) Agile requirements engineering<br />
practices and challenges: an empirical study. Information Systems Journal<br />
20(5):449–480<br />
Regnell B, Brinkkemper S (2005) Engineering and Managing Software Requirements,<br />
Springer, chap Market–Driven Requirements Engineering<br />
for Software Products, pp 287–308<br />
Regnell B, Berntsson Svensson R, <strong>Wnuk</strong> K (2008) Can we beat the complexity<br />
of very large-scale requirements engineering? In: Lecture Notes<br />
in Computer Science, vol 5025, pp 123-128<br />
Robson C (2002) Real World Research. Blackwell Publishing<br />
Rosca D, Greenspan S, Feblowitz M, Wild C (1997) A decision making<br />
methodology in support of the business rules lifecycle. In: Proceedings<br />
of the Third IEEE International Symposium on Requirements Engineering<br />
(RE’97), pp 236 –246<br />
Runeson P, Host M, Rainer A, Regnell B (2012) Case Study Research in<br />
Software Engineering: Guidelines and Examples. John Wiley & Sons<br />
Sangwan R, Bass M, Mullick N, Paulish D, Kazmeier J (2006) Global Software<br />
Development Handbook. Auerbach series on applied software engineering,<br />
Taylor and Francis<br />
273
REFERENCES<br />
Sawyer P (2000) Packaged software: Challenges for re. In: Proceedings of<br />
the Sixth International Workshop on Requirements Engineering: Foundations<br />
of Software Quality (REFSQ 2000), pp 137–142<br />
Sawyer P, Sommerville I, Kotonya G (1999) Improving market-driven re<br />
processes. In: Proceedings of the International Conference on Product-<br />
Focused Software Process Improvement (Profes ’99)<br />
Schmid K (2002) A comprehensive product line scoping approach and its<br />
validation. In: Proceedings of the 24th International Conference on Software<br />
Engineering (ICSE 2002), pp 593–603<br />
Schwaber K, Beedle M (2002) Agile software development with scrum. Series<br />
in agile software development, Prentice Hall<br />
Selby RW, Cusumano MA (1998) Microsoft secrets. Simon and Schuster<br />
Svahnberg M, Gorschek T, Feldt R, Torkar R, Saleem SB, Shafique MU<br />
(2010) A systematic review on strategic release planning models. Inf<br />
Softw Technol 52(3):237–248<br />
van de Weerd I, Brinkkemper S, Nieuwenhuis R, Versendaal J, Bijlsma L<br />
(2006) Towards a reference framework for software product management.<br />
In: Proceedings of the 14th IEEE International Requirements Engineering<br />
Conference (RE 2006), pp 319–322<br />
van Lamsweerde A (2003) From System Goals to Software Architecture. In:<br />
Formal Methods for Software Architectures, pp 25–43<br />
Wiegers K (2003) Software Requirements: Practical Techniques for Gathering<br />
and Managing Requirements Throughout the Product Development<br />
Cycle. Addison-Wesley<br />
<strong>Wnuk</strong> K, Regnell B, Karlsson L (2009) What happened to our features?<br />
visualization and understanding of scope change dynamics in a largescale<br />
industrial setting. In: Proceedings of the 17th IEEE International<br />
Requirements Engineering Conference (RE 2009), pp 89–98<br />
Wohlin C, Aurum A (2005) What is important when deciding to include<br />
a software requirements in a project or release? In: Proceedings of<br />
the International Symposium on Empirical Software Engineering (ISESE<br />
2005), pp 246–255<br />
274
Paper V<br />
Factors Affecting Decision Outcome and Lead-time<br />
in Large-Scale Requirements Engineering<br />
<strong>Krzysztof</strong> <strong>Wnuk</strong> 1 , Jaap Kabbedijk 2 , Sjaak Brinkkemper 2 , Björn Regnell 1<br />
1 Department of Computer Science,<br />
Lund University, Sweden<br />
<br />
2 Department of Information and Computing Sciences<br />
Utrecht University<br />
<br />
under revision for<br />
Software Quality Journal 2012<br />
ABSTRACT<br />
Lead-time is crucial for decision making in market-driven<br />
requirements engineering. In order to identify what factors<br />
influence the decision lead-time and outcome, we conducted<br />
a retrospective case study at a large product software manufacturer<br />
and statistically analyzed seven possible relationships<br />
among decision characteristics. Next, we further investigated<br />
relationships among decision characteristics in a survey among<br />
industry participants. The results show that the number of<br />
products affected by a decision could increase the time needed<br />
to take a decision. Results also show that when a change request<br />
originates from an important customer, the request is faster<br />
accepted.
1 Introduction<br />
1. INTRODUCTION<br />
Requirements Engineering (RE) addresses the critical problem of designing<br />
the right software for the customer (Aurum and Wohlin, 2005). In Market–<br />
Driven Requirements Engineering (MDRE), the content of the product has<br />
to be aligned with the targeted market needs to create a profitable software<br />
product (Regnell and Brinkkemper, 2005). For large MDRE projects,<br />
with thousands of continuously arriving (Karlsson et al, 2007a) potential<br />
requirements, deciding which requirements should be implemented is far<br />
from trivial.<br />
Large companies often use the software platform concept, also known<br />
as Software Product Lines (SPL) (Pohl et al, 2005). SPL helps to decrease the<br />
cost and to increase the ability to provide an individualized software product.<br />
Moreover, SPL allow software development organizations to reuse a<br />
common technology base to meet customers’ needs. However, the cost for<br />
this greater degree of reuse and increased productivity is increased complexity<br />
of coexisting product variants and a more complex decision making<br />
process.<br />
The requirements selection process is a complex decision problem, bringing<br />
up several challenges, e.g. shifting goals, time stress (Alenljung and<br />
Persson, 2008) and uncertain estimates (Karlsson and Ryan, 1997) just to<br />
name a few. To effectively improve RE decision–making, more effort should<br />
be dedicated towards decision–making aspects identification (Alenljung<br />
and Persson, 2008; Natt och Dag et al, 2005). In particular, it is important<br />
to explore additional factors influencing both the time needed to make the<br />
decision (also called the decision lead–time) as well as the outcome of the<br />
decision process.<br />
In this paper, a retrospective analysis of the decision making process in<br />
a large–scale MDRE and SPL project is performed with the aim for identifying<br />
which characteristics of change requests, i.e. number of products,<br />
release number, type of customer, may influence the decision lead–time<br />
and the decision outcome. The decision lead–time is in this context defined<br />
as time required to analyze the impact of a decision. The decision<br />
outcome is in this context defined as a specific outcome of the decision<br />
process, namely acceptance or rejection. For brevity, we use decision outcome<br />
throughout the paper. The results from analyzing the decision–log<br />
are further investigated in a survey among 50 industry respondents.<br />
The main goals for the paper are threefold: (1) to explore possible factors<br />
that may influence decision lead–times, (2) to investigate the possible<br />
factors that may influence decision outcomes and (3) to investigate if the<br />
decision lead–time affects the decision outcome.<br />
Partial results from this study have previously been published as workshop<br />
publications in (Kabbedijk et al, 2010). This paper extends our previous<br />
work by: (1) validating the results the decision log analysis in a survey,<br />
(2) extending the analysis of the results regarding factors that affect the de-<br />
277
PAPER V: FACTORS AFFECTING DECISION OUTCOME AND LEAD-TIME IN<br />
LARGE-SCALE REQUIREMENTS ENGINEERING<br />
cision lead-time and the relationship between the decision lead-time and<br />
the decision outcome (3) extending the analysis of related work, (4) extending<br />
the interpretation of the results in the light of the related work.<br />
The paper is structured as follows. Related work is discussed in Section<br />
2, followed by a description of the case company in Section 3. Our<br />
research design and research questions are outlined in Section 4. Next, we<br />
present the results of the statistical analysis of the decision logs and the<br />
survey in Section 5. We conclude the paper and present the future work in<br />
Section 6.<br />
2 Related Work<br />
Decision making is an important aspect of requirements engineering (Alenljung<br />
and Persson, 2008; Aurum and Wohlin, 2003; Evans et al, 1997) and significantly<br />
impacts requirements management. As stated by DeGregorio (1999),<br />
requirements management is not possible without decision management.<br />
Therefore, understanding of the nature of the decisions made in the RE<br />
process is necessary for improving it (Aurum and Wohlin, 2003). Despite<br />
an increasing awareness for supporting RE decision making, research in<br />
this area is still “in its infancy” (Ngo-The and Ruhe, 2005).<br />
The requirements engineering process is a decision rich activity for<br />
which decisions can range from the organization level to the project level<br />
(Aurum and Wohlin, 2003; Ngo-The and Ruhe, 2005). Moreover, since<br />
RE decision making is a knowledge–intensive activity that is performed<br />
in natural settings, it has to deal with the difficulties such as shifting, ill–<br />
defined or competing goals and values (Klein et al, 1995). As a result, the<br />
risk of making inappropriate decisions is high and the consequences of<br />
made decisions can be serious. Furthermore, RE decisions are often semi–<br />
structured or unstructured and made only once, which make the evaluations<br />
of the decision outcomes difficult (Ngo-The and Ruhe, 2005). Moreover,<br />
Strigini (1996) stressed a lack of objective criteria for guiding making<br />
decisions, e.g. based on statistics about past experience which results in<br />
important decisions often depending on subjective judgments. Thus, empirical<br />
investigation of the factors that affect decision outcomes is important<br />
as it can contribute to more continuous, controllable and structured<br />
requirements engineering decision making.<br />
Several researchers have looked into modeling decision–making in software<br />
and requirements engineering. Ashrafi (1998) proposed a decision–<br />
making model that addresses various software quality aspects. Rolland<br />
et al (1995) proposed a decision making meta–model for requirements engineering<br />
process that captures both how and why the requirements engineering<br />
activities are performed. Wild et al (1994) modeled the software<br />
development process as a set of problem solving activities (decisions).<br />
Ruhe (2005) modeled release planning decisions by combining computa-<br />
278
2. RELATED WORK<br />
tional knowledge intelligence and experience of decision makers or by<br />
using linear programming (Ruhe, 2009). van den Akker et al used integral<br />
linear programming to find an optimal set of requirements within<br />
the given resource constraints that can maximize the revenue (van den<br />
Akker et al, 2008). Li et al focused on time schedling aspect of release<br />
planning (Li et al, 2010). Regnell and Kuchcinski used constraint programming<br />
(Regnell and Kuchcinski, 2011) to model release planning decision<br />
making while Egyed et al (2006) proposed using constraints programming<br />
for reducing the number of possible software design decisions.<br />
Karlsson (1997) promoted a cost–value approach to support requirements<br />
prioritization which was later experimentally compared to other prioritization<br />
techniques (Karlsson et al, 2007b). Ruhe (2009) covered supporting<br />
product release decisions on various levels by modeling the release planning<br />
criteria and constraints. However, the mentioned methods mainly<br />
focus on the task of reducing the number of possible decision or assigning<br />
features to releases according to given criteria, while this study focuses<br />
on understanding the factors that may affect both decision lead–times and<br />
outcomes.<br />
Among the challenges in RE decision making Alenljung et al (2008)<br />
listed: ill–structured problems, uncertain environments, shifting goals, action<br />
and feedback loops, time stress, high stakes, multiple player situations<br />
and organizational goals and norms. Ngo-The and Ruhe (2005) argued<br />
that requirements decisions are hard because of the incompleteness<br />
of the available information and any notion of strict optimality is not appropriate<br />
in this context. Karlsson et al (2007a) listed release planning<br />
based on uncertain estimates as one of the challenges in MDRE that is related<br />
to RE decision making. Another challenging aspect of decision making;<br />
mentioned by Fogelstrom et al (2009); is finding the right balance between<br />
the commercial requirements selected over internal quality requirements,<br />
also mentioned by Karlsson et al (2007a). Furthermore, requirements<br />
prioritization (Karlsson and Ryan, 1997) was recognized as challenging<br />
because of, e.g. conflicting priorities between stakeholders (Berander<br />
and Andrews, 2005) or the complex dependencies between requirements<br />
(Cleland-Huang et al, 2005). Finally, several researchers stressed the<br />
need for empirical studies in RE decision making process to create a coherent<br />
body of knowledge in RE decision making and to improve requirements<br />
engineering (Alenljung and Persson, 2008; Aurum and Wohlin, 2003;<br />
Berander and Andrews, 2005).<br />
Despite the above mentioned need for more empirical studies and several<br />
reported studies that outline challenges in requirements engineering<br />
decision making, the number of publications that empirically investigate<br />
factors affecting decision making in requirements engineering is still low.<br />
Among the reported studies, Wohlin and Aurum (2005) investigated the<br />
criteria used in the requirements selection process for a project or release<br />
and reported that business–oriented and management–oriented criteria are<br />
279
PAPER V: FACTORS AFFECTING DECISION OUTCOME AND LEAD-TIME IN<br />
LARGE-SCALE REQUIREMENTS ENGINEERING<br />
more important than technical concerns. <strong>Wnuk</strong> et al (2009) investigated the<br />
reasons for excluding features from the project’s scope reporting that the<br />
stakeholder business decision is the dominant reasons for feature exclusions.<br />
Barney et al (2008) reported that the client and market base of the<br />
software product are the dominant factors that affect the decision to implement<br />
specific requirements. Moreover, Barney et al (2008) stressed that<br />
factors such as maturity of the product, the marketplace in which it exists<br />
and the available development tools and methods also influence the decision<br />
of whether or not include requirements in a software product. To the<br />
best of our knowledge, no study had yet attempted to investigate factors<br />
that affect both decision lead–times and decision outcomes.<br />
While looking more generally at related work in decision making, Khatri<br />
(2000) discussed the intuition’s role in decision making whereas Messerschmitt<br />
and Szyperski (2004) discussed the “marketplace issues” that may<br />
affect software project planning and decision making. Hogarth (1975) proposed<br />
a relationship function between the decision time and the task complexity.<br />
Saliu and Ruhe (2005) suggested that there is a relationship between<br />
decision outcomes and release planning. A similar relationship was<br />
suggested by Bagnall (2001) but, as in Ruhe and Saliu (2005), the relationship<br />
hasn’t been named. Zur and Breznitz (1981) suggested a relationship<br />
between the time pressure, people’s experience and the risks of their choice<br />
behaviors. Hallowell (1996) suggested a relationship among customer satisfaction,<br />
loyalty and profitability. However, the mentioned relationships<br />
haven’t been empirically investigated in a large-scale MDRE context and<br />
especially in relation to decision lead–times and decision outcomes.<br />
3 Case Company Description<br />
The paper reports results from a content analysis (Lethbridge et al, 2005) of<br />
the record of decisions made in an industrial project at the large company<br />
using the SPL approach (Pohl et al, 2005). The company operates globally<br />
selling embedded systems and has more than 4000 employees. The core<br />
of the software part of embedded systems is called a platform and corresponds<br />
to the common code base of the SPL (Pohl et al, 2005). There are<br />
several consecutive releases of the platform in which each of them is a basis<br />
for one or more products that reuse the platform’s functionality and qualities.<br />
A major platform release has approximately a two year lead–time<br />
from start to launch, and is focused on functionality growth and quality<br />
enhancements for a product portfolio. Minor platform releases are usually<br />
focused on the platform’s adaptations to the different products that will<br />
be later launched. The stage–gate model with several increments (Cooper,<br />
1990) is used by the company. The scope of the core release project is constantly<br />
changing during this process, from the initial roadmap extraction<br />
which is a basics for creating high level features to the final milestone of<br />
280
3. CASE COMPANY DESCRIPTION<br />
the requirements management process after which the development phase<br />
starts.<br />
The case company utilizes the concept of a feature as an entity for making<br />
scoping decision. A feature is defined as a group of requirements that<br />
constitute new functionality enhancements to the platform upon which<br />
market value and implementation cost can be estimated. The project decision<br />
makers consider both internally issued features and features from<br />
external customers. Change requests to these features are performed constantly<br />
by stakeholders from inside and outside the company. The change<br />
control system is used in order to capture, track and assess the impact of<br />
changes (Leffingwell and Widrig, 2003; Kitchenham et al, 1999). The scope<br />
of each project is maintained in a document called the feature list, that is<br />
updated each week after a meeting of the change control board (CCB). The<br />
CCB exists of product and platform managers, complemented with other<br />
project stakeholders to a total of 20 members. The role of the CCB is to<br />
decide upon adding or removing features according to issued change requests.<br />
The decision process of the CCB is illustrated in Figure 5.1.<br />
The CCB decision process is depicted in Figure 5.1. The process is similar<br />
to the processes described in the related literature (Leffingwell and<br />
Widrig, 2003; Kitchenham et al, 1999; Jonsson and Lindvall, 2005). The<br />
change requests are high level requests on feature level. After a change request<br />
is filed, its ambiguity and completeness are analyzed. This analysis is<br />
based on the quality gateway model (Natt och Dag et al, 2001), also called<br />
the “firewall” by Leffingwell and Widrig (2003). If the request is ambiguous<br />
or incomplete, it is sent back to the submitter to ask for a clarification,<br />
otherwise the request is put on the CCB agenda for performing the impact<br />
analysis. The impact analysis is performed by the appropriate Technical<br />
Groups that elicit and specify high–level requirements for a special technical<br />
area and Focus Groups that design and develop previously defined<br />
functionality. In this way, the impact of a change on the cost and functionality<br />
of the system as well as on customers and other external stakeholders<br />
is assessed (Leffingwell and Widrig, 2003). After the impact analysis, the<br />
request is presented at the CCB meeting and the change request is decided<br />
upon. When the analysis performed by a certain group is not clear enough,<br />
extra information can be requested before the final decision is made. If the<br />
request is accepted, the change is implemented, else the submitter gets a<br />
rejection notification.<br />
All change requests and decisions made about them (including their<br />
rationale) are stored in the scope decision log of a project. In this sense, the<br />
company follows the advice of Aurum and Wohlin that the rationale and<br />
effects of RE decisions on software product should be tracked in order to<br />
support and improve RE activities (Aurum and Wohlin, 2003)<br />
An example of an entry in the decision log is shown in Table 5.1. For<br />
reasons of confidentiality, we used fictive data. This decision log comprises<br />
a number of attributes like the change submitter and justification,<br />
281
PAPER V: FACTORS AFFECTING DECISION OUTCOME AND LEAD-TIME IN<br />
LARGE-SCALE REQUIREMENTS ENGINEERING<br />
Figure 5.1: Change control board decision process<br />
282
ID 54<br />
Table 5.1: Decision log entry example<br />
Change Request HD resolution for video<br />
Decision Outcome Accepted<br />
4. RESEARCH DESIGN<br />
Comments This will enlarge our market share in this<br />
sector<br />
Description of proposed change Add HD resolution for recording<br />
Justification Requested by a large provider<br />
Proposition Area Video<br />
Main affected Technical Group Video Group<br />
Affected product All products with a camera<br />
Affected key customer Customer X<br />
Affected Functional Group HD Group<br />
Submittal Date 09-02-09<br />
RM tool ID 10F1<br />
Decision Date 18-02-09<br />
the date that the request has been submitted and decided upon, the products<br />
impacted by a change, the release of the platform project impacted by<br />
a change, and the markets impacted by a change. The release of the platform<br />
project impacted by a change attribute is used to request a certain<br />
feature in an earlier release (the release number is low) or in a later release<br />
(the release number i high). For brevity, we will call this attribute release<br />
number throughout the paper. For this paper, we were granted access to<br />
an extensive decision log. This log contained 1439 change requests for all<br />
products planned to be released in 2008.<br />
4 Research Design<br />
Since the number of papers that investigate factors influencing RE decision<br />
making is low, see Section 2, our research was mainly exploratory and<br />
conducted in order to: (1) identify the main decision characteristics and<br />
(2) analyze the relationships between the identified characteristics. After<br />
identifying the characteristics, we formulated research questions, see Section<br />
4.1 about relations within requirements engineering decision making<br />
and hypotheses based on these questions, see Section 5. We run statistical<br />
tests on empirical data to either accept or reject hypotheses and draw conclusions<br />
based on the test results. The results of the statistical analysis were<br />
further validated in a survey and interpreted in relation to related studies.<br />
283
PAPER V: FACTORS AFFECTING DECISION OUTCOME AND LEAD-TIME IN<br />
LARGE-SCALE REQUIREMENTS ENGINEERING<br />
4.1 Research questions<br />
Three research questions are investigated in this paper and are outlined in<br />
Table 5.2, complemented with aim and example answers for each question.<br />
The questions were shaped and inspired by the related literature outlined<br />
in Section 2. All three research questions are relationship questions (Easterbrook<br />
et al, 2008). The questions are further decomposed into hypotheses<br />
that were investigated using statistical tests, see Section 5.<br />
Research question<br />
RQ1: Which decisioncharacteristics<br />
affect the decision<br />
lead–time?<br />
RQ2: Which decisioncharacteristics<br />
affect the decision<br />
outcome?<br />
RQ3: Is the decision<br />
outcome related<br />
to the decision<br />
lead–time<br />
Table 5.2: Research questions<br />
Aim Example answers<br />
To understand which<br />
decision characteristics<br />
i.e, number<br />
of products, release<br />
number, type of<br />
customer have a significant<br />
impact on the<br />
decision lead–time<br />
To understand the relation<br />
between the decision<br />
characteristics<br />
and the acceptance or<br />
rejection of a decision<br />
To understand the relation<br />
between the acceptance<br />
rate and the<br />
decision lead–time<br />
The number of products<br />
involved in the decision<br />
increases the decision<br />
lead–time. Decisions that<br />
are related to the current<br />
release or consider our<br />
largest customers have<br />
shorter lead–times.<br />
The number of products<br />
involved in the decision<br />
decreases the probability<br />
of accepting this decision.<br />
Decisions that are related<br />
to the current release or<br />
issued by important customers<br />
are usually accepted.<br />
Decisions with longer<br />
lead–time are more often<br />
rejected<br />
The first research question (RQ1) is inspired by Hogarth (1975), who<br />
created a function on the relationship between the decision time and the<br />
task complexity. Hogarth stated that the amount of time needed to make a<br />
decision is an increasing function of the task complexity. After some point<br />
the costs of errors due to the task complexity becomes lower than the cost<br />
of time. This is the tilting point at which the amount of time becomes a<br />
decreasing function of the task complexity. In this paper, we empirically<br />
investigate the viewpoint of Hogart (1975) as well as we investigated fur-<br />
284
4. RESEARCH DESIGN<br />
ther factors that may influence the decision lead–time, e.g. the type of the<br />
customer and the release number.<br />
The second research question (RQ2) investigates the relationships between<br />
the decision characteristics and the decision outcome. This question<br />
is partly based on the work of Saliu and Ruhe (2005) and the work of Bagnall<br />
et al (2001) suggesting a relationship between decision outcomes and<br />
release planning. However, their work (Saliu and Ruhe, 2005; Bagnall et al,<br />
2001) didn’t suggest any explicit relationship between setting the requirements<br />
release time and the decision outcome. Therefore, RQ2 focuses on<br />
investigating if such relationships could be found.<br />
Among other related studies, the paper by Hallowell (1996), suggested<br />
a relationship among customer satisfaction, loyalty and profitability. Thus,<br />
it is reasonable to assume a possible relationship between the fact that a<br />
request is filed by an important customer and its decision outcome. Software<br />
companies should keep their customers satisfied and thus they could<br />
accept requests of these customers faster than internal requests.<br />
Research question RQ2 is also based on the work of Hogarth (1975).<br />
Since there is a tilting point in the relationship curve, there is a certain complexity<br />
level after which the decision maker decides the errors costs due to<br />
a wrong decision are lower than the costs of spending any more time on<br />
making the decision. From this point it is logical to state a hypothesis that<br />
negative decisions could be made and a relationship between the decision<br />
outcome and the number of products affected by a decision could exist.<br />
The last research question (RQ3) is based on the work of Zur (1981) and<br />
our previous work (<strong>Wnuk</strong> et al, 2009). In our previous work (<strong>Wnuk</strong> et al,<br />
2009), we reported that project management is more eager to accept features<br />
in the beginning of a large project and exclude features towards the<br />
end of the project due to time pressures and other unexpected difficulties.<br />
In a related paper, Zur (1981) claims a relationship between the time pressure<br />
people’s experience and the risks of their choice behavior. Thus, we<br />
investigated in this study if longer lead–times impact decision outcomes.<br />
4.2 Research methods<br />
Case study and survey methods were selected for conducting this study.<br />
Both methods are considered as relevant for software engineering research<br />
(Easterbrook et al, 2008; Runeson and Höst, 2009). The details of the methods<br />
are outlined in the subsections that follow.<br />
4.2.1 Case study<br />
Case studies have been recognized as an appropriate method to understand<br />
complex social phenomena (Yin, 2008) and highly recommended for<br />
software engineering research (Runeson and Höst, 2009). We have used the<br />
analysis of electronic databases of work performed technique (Lethbridge<br />
285
PAPER V: FACTORS AFFECTING DECISION OUTCOME AND LEAD-TIME IN<br />
LARGE-SCALE REQUIREMENTS ENGINEERING<br />
et al, 2005) for data collection as it is a suitable technique for analyzing<br />
large amounts of data. The researchers were granted access to an extensive<br />
decision log of all products planned to be released in 2008 containing<br />
1439 change requests. To address the risk of low control over the gathered<br />
information quality, the data was validated with one practitioner from the<br />
case company and analyzed by two authors of this paper to perform observer<br />
triangulation. Based on the decision characteristics (see Section 3),<br />
Figure 5.2: Number of decisions taking a certain lead-time<br />
five variables were created for each decision.<br />
1. Lead-Time: the duration between the moment a request was filed to the<br />
moment the decision was made by the CCB. The lead–time is measured in<br />
week days and not working days, so there could be a small difference in<br />
days between two decisions who took the same number of working days<br />
to be taken, due to weekends. Figure 5.2 gives an indication of how the<br />
lead–time is distributed. About half of the decisions are made the same<br />
day they are requested (686 decisions, 48%), but the 753 requests that are<br />
left can take up to 143 days before a decision is made.<br />
2. Number of Products Affected: a number between one and fourteen (the<br />
total number of product for this software product line) indicating the number<br />
of different products for which the requirements would change if the<br />
request was accepted. We consider this attribute as a proxy for decision<br />
286
4. RESEARCH DESIGN<br />
complexity.<br />
3. Release Number: a variable strongly related to the release method used<br />
within the case company. As described in Section 3, the product line platform<br />
of the case company is released in a heartbeat rhythm of one base<br />
release and four sequential releases. The release number variable indicates<br />
the specific number of the release affected by the change request. The<br />
higher the variable, the later the release is in the release heartbeat rhythm<br />
of the case company.<br />
4. Type of Customer: a nominal variable used to indicate whether a request<br />
is filed by an important external customer or is a request coming from inside<br />
the company. External customers in this case are large partners of the<br />
case company who also help to bring the developed products to the market.<br />
Thus, we will refer to them as important external customers.<br />
5. Decision Outcome: a variable of nominal level of measurement indicating<br />
whether or not a change request is accepted by the CCB.<br />
4.2.2 Survey<br />
We conducted a survey among 50 respondents from industry to validate<br />
the results from the case study as well as to strengthen the external validity<br />
of the study. The survey respondents were mainly working for companies<br />
producing product software using the SPL approach.<br />
The questionnaire was created based on principles described by Kitchenham<br />
and Pfleeger (2002). The questionnaire contained a part dedicated<br />
to identify the context and background of the respondents, followed by<br />
a part focusing on their experiences considering possible relations in requirements<br />
engineering decision making. The questions identifying the<br />
respondents’ context and background are based on the facets identified by<br />
Paech et al (2005).<br />
The questions concerning the possible relationships within requirements<br />
engineering decision making were structured using a three-point Likert<br />
scale for effectively measuring the experiences of the respondents (Jacoby<br />
and Matell, 1971). We asked the respondents to state whether a certain<br />
characteristic influenced the decision lead–time in a positive, neutral or<br />
negative way. All relations examined based on the decision log were also<br />
inquired in the questionnaire. For example, a question from the survey<br />
was: “Please indicate how the number of products affected by the decision<br />
influences the time needed to take the decision”. The answer categories<br />
were: “This makes the time to decide shorter”, “No influence” or “This<br />
makes the time to decide longer”. During the analysis, we rated the first<br />
answer as a score of −1, the second answer as 0 and the last answer as<br />
+1. This schema allowed to determine how strongly a certain decision<br />
characteristic influenced the decision lead–time or outcome. The survey<br />
questions can be accessed at (<strong>Wnuk</strong>, 2012) and in the Appendix.<br />
287
PAPER V: FACTORS AFFECTING DECISION OUTCOME AND LEAD-TIME IN<br />
LARGE-SCALE REQUIREMENTS ENGINEERING<br />
4.3 Validity<br />
We discuss the validity of research design and the results based on the<br />
classification proposed by Yin (2008).<br />
4.3.1 Construct Validity<br />
It is important to use the right sources for measuring the theoretical constructs<br />
(Yin, 2008). If we, for example, want to measure the time needed to<br />
take a decision, a reliable source is needed determine this amount of time.<br />
We analysed the decision log that was actively used in the decision making<br />
process at the case company. This decision log is an archival record,<br />
which could be considered as stable, exact and quantitative. Whenever<br />
decisions in the log were incomplete or ambiguous, we discussed them<br />
with the responsible product manager to avoid making wrong interpretations.<br />
These discussions can be seen as interviews we had with the responsible<br />
product manager. Both data collection methods are highly applicable<br />
to software engineering case studies (Runeson and Höst, 2009). Wohlin<br />
et al mentioned additional design threats to validity (Wohlin et al, 2000),<br />
namely the mono-operation and mono-method bias threats. These threats<br />
concern creating a bias while using respectively one case or method within<br />
the research. We ensured the validity on these levels by discussing all results<br />
with a responsible product manager and the use of several statistical<br />
and qualitative methods to analyse the data.<br />
Construct validity of the survey part of the study is mainly concerned<br />
with the way how questionnaire questions were phrased. To alleviate this<br />
threat to construct validity, an independent senior researcher experienced<br />
in the topic reviewed the questionnaire. Moreover, we conducted a pilot<br />
study to measure the time required to conduct the survey and minimize<br />
the risk of misunderstanding or misinterpreting the survey questions by<br />
respondents. Further, the anonymity of questionnaire respondents was<br />
guaranteed which minimize the evaluation apprehension threat. Finally,<br />
the mono-operational bias threat is to partly alleviated as we managed to<br />
collect 50 responses.<br />
4.3.2 Internal Validity<br />
Threats to internal validity concern the investigated causal relationship between<br />
studies factors (Yin, 2008). In this study, we have minimized threats<br />
to internal validity by investigating as many possible factors that could<br />
influence the decision lead–time and outcome as it was possible with the<br />
given dataset. The identified relationships were confronted with the results<br />
from the survey in which these relationships were further tested. Finally,<br />
the potentially impacting additional confounding factors for the studied<br />
relationships were discussed in all cases in which the results from the case<br />
study and the survey were inconsistent (see Section 5).<br />
288
5. RESULTS AND DISCUSSION<br />
To avoid stating false inferences (Yin, 2008), we have based our results<br />
on empirically derived data from a large company and confronted the results<br />
in a survey. Finally, we discuss the achieved results in Section 5,<br />
where we provide several possible explanations and possibilities, especially<br />
when the results from the case study and the survey are inconsistent.<br />
4.3.3 External Validity<br />
The external validity is considered as a main threat to validity in case studies<br />
due to difficulties to generalize from a single company study (Yin, 2008)<br />
even if the size of the data sample is large. To mitigate this threat, we have<br />
designed and conducted a survey in order to validate the findings from<br />
the case study. Since the majority of survey respondents worked in smaller<br />
companies with a typical project generating not more than 100 requests, we<br />
could further strengthen the generalizability of the results by comparing a<br />
large context with smaller contexts.<br />
4.3.4 Reliability<br />
In order to ensure the reliability of a study, it is important to have created<br />
a case study protocol and to maintained a case study database (Yin,<br />
2008). In this way, the performed research could be retraced. We also stored<br />
all artifacts from the case study, so conclusions based on the evidence can<br />
be retraced as well. Further, we have published the survey questionnaire<br />
questions on-line (<strong>Wnuk</strong>, 2012) and described the sample population in<br />
Sections 4.2.2 and 5.2.1. However, we would like to stress that the data<br />
given by respondents is not based on any objective measurements and thus<br />
its subjectivity may affect the interpretability of the results.<br />
5 Results and Discussion<br />
5.1 Test Selection<br />
Selecting the appropriate test for analyzing the relationships is critical for<br />
getting reliable and scientifically sound results to base the conclusions on (Ott<br />
and Longnecker, 2008). The choice of the right statistical test is dependent<br />
on three major factors, namely (Sheskin, 2004):<br />
• The level of measurement of the variables<br />
• The distribution of the data<br />
• The hypotheses that will be tested<br />
We analyzed five different decision characteristics, which were all translated<br />
to quantitative, analyzable variables.<br />
289
PAPER V: FACTORS AFFECTING DECISION OUTCOME AND LEAD-TIME IN<br />
LARGE-SCALE REQUIREMENTS ENGINEERING<br />
(a) lead–time (b) Log10 lead–time<br />
Figure 5.3: Lead–time Gaussian curve fit<br />
In order to perform parametric tests, all ratio level data should be distributed<br />
normally (Field, 2009). Since the variable lead–time is the only<br />
variable of ratio level of measurement, we ensured this variable complied<br />
to the condition stated before. The variable lead–time apparently described<br />
a log–normal distribution, so in order to be able to use this variable, the<br />
log10-function of the variable was used for analysis. The detail of the transformation<br />
are depicted in Figure 5.3. The D’Agostino-Pearson test (1973)<br />
was used to see whether the log10-function of the variable lead–time described<br />
a Gaussian curve, or was distributed differently. We tested the<br />
following hypotheses (H 0 ):<br />
H0 0 : The sample is derived from a normally distributed population.<br />
H0 1 : The sample is not derived from a normally distributed population.<br />
When testing the kurtosis and skewness (DeCarlo, 1997) of the distribution,<br />
we found a result of χ 2 (1, N = 753) =35.3, p < .01, which is below<br />
the critical value of 67.4 as can be found in the χ 2 distribution table. This<br />
means we can not reject H0, so we can conclude that the log10-function<br />
of the variable “lead–time” is distributed normally and we can use parametric<br />
tests on this variable. However, since the other analyzed variables<br />
are either of ordinal or nominal level of measurement, we also used nonparametric<br />
tests while analysing their influences and relationships.<br />
5.2 Survey Data Analysis<br />
The answers from the survey create variables of ordinal level of measurement.<br />
According to Stevens et al (1946) median and percentile scores should<br />
290
5. RESULTS AND DISCUSSION<br />
be used as ways of assessing these types of survey results. In our case, calculated<br />
medians are means and at least half of the sample has identified a<br />
negative relationship. When the median is positive, at least half of the sample<br />
in our study has identified a positive relationship, see Table 5.4 and a<br />
frequency table can be used to further analyze the results.<br />
5.2.1 Demographics<br />
The survey was answered by 50 respondents. 32% of the respondents came<br />
from The Netherlands, 14% from Sweden and 46% came from other countries,<br />
including US and UK. Software project (12%) and product manager<br />
(48%) roles dominated among our respondents, followed by senior management<br />
(12%), consultants (12%) and developers (6%). Our respondents<br />
reported, on average, 13 years of professional experience, with standard<br />
deviation of about 6 years. Three respondents indicated having less than 5<br />
years of experience: (1) one project manager from the US who worked with<br />
off–the–shelf solutions in a small company reported having one year of experience,<br />
(2) one requirements engineer from The Netherlands working<br />
with bespoke software with an average of 100 change requests per project<br />
reported having 2 years of experience and (3) one product manager from<br />
The Netherlands working with off–the–shelf product with an average of<br />
10 requests per project reported having 4 years of experience.<br />
The majority of the respondents (68%) worked with companies, in which<br />
up to 100 persons were involved in the software engineering process. Further,<br />
52% of the respondents created mostly off–the–shelf software, followed<br />
by bespoke software (28%). When looking at the number of change<br />
requests per project, a typical project generates not more than around 100<br />
requests for over 70% of the respondents. Finally, 64% of the respondents<br />
reported using the SPL approach (Pohl et al, 2005).<br />
5.3 Factors that affect the decision lead–time: RQ1<br />
Table 5.4 shows a list of all hypotheses together with their survey result<br />
medians (last column). Column “Level of Significance” supplies all test<br />
results, together with their critical values for the analysis of the decision<br />
log. The last column in Table 5.4 represents the median score for the survey<br />
answers.<br />
To investigate which decision characteristics have a significant impact<br />
on the decision lead–time, we have tested three hypotheses (H 1 ,H 2 and<br />
H 3 , see the subsections that follow) and confronted the results from the<br />
hypotheses testing with the results from the survey, see Table 5.3.<br />
291
PAPER V: FACTORS AFFECTING DECISION OUTCOME AND LEAD-TIME IN<br />
LARGE-SCALE REQUIREMENTS ENGINEERING<br />
Table 5.3: Survey results - the influence of decision characteristics on the<br />
decision lead-time, research question RQ1 and survey question 8 (<strong>Wnuk</strong>,<br />
2012).<br />
How a high number<br />
of product<br />
affects the decision<br />
lead–time, H1 The decision is late<br />
in the release cycle<br />
(high release number),<br />
H2 The decision is filled<br />
by an important external<br />
customer, H3 This makes<br />
the time<br />
to decide<br />
shorter<br />
No influence<br />
This makes<br />
the time<br />
to decide<br />
longer<br />
Rating<br />
average/-<br />
Median<br />
9.3% 9.3% 81.4% 0.72 / 1<br />
53.5% 30.2% 16.3% -0.37 /<br />
-1<br />
62.8% 23.3% 14.0% -0.49 /<br />
-1<br />
5.3.1 The impact of the number of products that a decision effects on<br />
the decision lead–time: H 1<br />
Based on Hogarth et al who stated that the time needed to take a decision is<br />
highly dependent on the task complexity (Hogarth, 1975), we suspect a relationship<br />
between the number of products affected by a decision, e.g. the<br />
decision complexity, and the decision lead–time. The hypothesis testing<br />
this relationship (H 1 , see Table 5.4) can be stated as:<br />
H1 0 : The correlation between the number of products affected by a<br />
decision and the lead–time needed to take the decision is 0.<br />
H1 1 : The correlation between the number of products affected by a<br />
decision and the lead–time needed to take the decision is not 0.<br />
We used the non–parametric Spearman’s Rank-Order Correlation Coefficient<br />
(Spearman, 1904) to assess the correlation size between a variable<br />
of ratio level and of ordinal level of measurement. We found ρ(752) =<br />
.222, p < .05 after performing the test, which is higher than the listed critical<br />
value of .197 at a two–tailed level of significance of .05. This means<br />
we can reject hypothesis H 1 0 and accept the hypothesis H1 1<br />
that the corre-<br />
lation between the number of affected products and the lead–time is not<br />
0. Stated more general: when the number of products affected by a decision<br />
increases, the lead–time needed to take the decision increases as well.<br />
Since the correlation coefficient is rather low, the number of products may<br />
not be the only variable influencing the lead–time.<br />
292
5. RESULTS AND DISCUSSION<br />
Table 5.4: The results of the hypotheses testing on the data from the decision<br />
log together with the median score from the answers from the survey<br />
(last column)<br />
H x Case Study Results<br />
Level of Significance Median<br />
from the<br />
survey<br />
H 1 Significant ρ = .222 > .197 1<br />
H 2 Not significant ρ = .180 < .197 -1<br />
H 3 Not significant p = .558 > .05 -1<br />
H 4 Significant Z = .545 > .440 -1<br />
H 5 Significant Z = 2.566 > .440 -1<br />
H 6 Significant χ 2 = 7.032 > 2.710 1<br />
H 7 Significant t(752) =3.940, p = 0.01 0<br />
Looking deeper, Figure 5.4 shows an increase of the average lead–time<br />
related to the number of products affecting change requests for the case<br />
company dataset. If we compare the average lead–time for 1 product with<br />
the highest lead–time (for 7 products), the lead-time becomes about five<br />
times longer. If we look at the lead–time for 1 product (least number) and<br />
13 products (highest number), we can still see an increase of 130% in average<br />
lead–time. There appears to be no clear function to predict the time<br />
needed to take a decision when the number of products is known, but there<br />
is a clear positive trend to be seen. Therefore, the rise is substantial.<br />
The results of the survey show a positive relationship between the decision<br />
lead–time and the number of products affected by the decision, see<br />
second row in Table 5.3. 81.4% of the respondents confirmed that a high<br />
number of products affected by the decision make the decision lead–time<br />
longer. This result confirms the value of the median in the second row of<br />
Table 5.4.<br />
The concordance between the results from the decision log analysis and<br />
the survey could be interpreted as an indication that more complex investigations<br />
take more time, which confirms the experiments reported by<br />
Hogarth (1975) on requirements engineering decision making. Further, our<br />
results in relation to this factor complement our previous findings (<strong>Wnuk</strong><br />
et al, 2011) that for large projects change proposals investigations take more<br />
time than for smaller projects. Finally, the possible practical conclusion<br />
from these results could be that if decisions have to be made quickly, their<br />
complexity should be reduced, e.g. by splitting one bigger errand into two<br />
or using other heuristics to reduce the complexity (Garcia-Retamero and<br />
Hoffrage, 2006).<br />
293
PAPER V: FACTORS AFFECTING DECISION OUTCOME AND LEAD-TIME IN<br />
LARGE-SCALE REQUIREMENTS ENGINEERING<br />
Figure 5.4: Mean lead–time per number of products affected<br />
5.3.2 Effect of a certain release number on the decision lead–time: H 2<br />
To study the relationship between the release number of the product line<br />
platform attribute of the change requests and the decision lead–time, we<br />
have tested the following hypothesis (H 2 , see Table 5.4):<br />
H2 0 : The correlation between the release number of the product line<br />
platform attribute of the change requests and the lead–time needed<br />
to take the decision is 0.<br />
H2 1 : The correlation between the release number of the product line<br />
platform attribute of the change requests and the lead–time needed<br />
to take the decision is not 0.<br />
We used Spearman’s Rank-Order Correlation Coefficient to test the correlation<br />
between a variable of ordinal level (release number of the product<br />
line platform) and a variable of ratio level (lead–time). The result of this<br />
test is ρ(752) =.180, p < .05, what is below the critical value of ρ = .197<br />
for an α = .05 two–tailed level of significance (see Table 5.4). This means<br />
we can’t reject H0 and we can’t state that there is a statistically significant<br />
correlation between the product line platform release number that changes<br />
impact and the lead–time needed to take a decision on our dataset.<br />
The results of the survey regarding this aspect, see the third row in Table<br />
5.3, show that 53.5% of the respondents suggested that decisions made<br />
294
5. RESULTS AND DISCUSSION<br />
late in the release cycle have a shorter lead–time. On the other hand, 30.2%<br />
of the respondents indicated that this factor has no influence on the decision<br />
lead–time and 16.3% of the respondents indicated that this factors<br />
makes the time to decide longer. To summarize, the results from the survey<br />
seems to contradict with the results from the decision log statistical<br />
analysis.<br />
One possible interpretation of the discrepancy between the results from<br />
the survey and statistical analysis of the decision log may be related to the<br />
case company context factor. The lack of statistically significant relationship<br />
should be interpreted in the light of the result regarding hypothesis<br />
H 1 . Since more complex decisions have longer decision lead-times, see hypothesis<br />
H 1 , this would suggest that decisions affecting late product line<br />
platform releases at the case company have limited complexity. The process<br />
used by the case company seems to confirm this assumption as the<br />
early (major) releases are providing the main functionality of the product<br />
line platform and thus more complex decisions should be made for these<br />
early releases, see Section 3.<br />
At the same time, the above assumption about the dominance of less<br />
complex decisions that affect late product line platform releases could also<br />
be interpreted as valid for the survey results. The demographics of the<br />
survey respondents, see Table 5.2.1, suggest that the decisions investigated<br />
by our survey respondents are less complex than decisions investigated in<br />
the case company. This, in turn, may suggest that the lead-time for later<br />
software product line releases decreases. Another possible factor affecting<br />
the survey results may be the type software projects that the majority<br />
of the survey respondents are involved in. In bespoke software projects<br />
the scope of the project is often set or implied as a contract and only minor<br />
adaptations or changes are allowed (Regnell and Brinkkemper, 2005).<br />
Thus, the decision lead-time may decrease even for later software product<br />
line releases.<br />
5.3.3 Effect of Important Customers on the decision lead–time: H 3<br />
To test the effect of the type of customer that issues a request on the decision<br />
lead–time, we categorized the decisions in the decision log into two<br />
categories. The first category are decisions that are requested from somewhere<br />
within the company (1003 decisions, 69,7%, were categorized into<br />
this category), while the second category are decisions that are requested<br />
by important extrenal customers of the case company (436 decisions, see<br />
also Section 4.2.1). The following hypothesis was formulated in this case<br />
(H 3 , see Table 5.4):<br />
H3 0 : The average lead–time needed to take a decision is not different<br />
when an important customer issues a request.<br />
H3 1 : The average lead–time to take a decision is different when an<br />
295
PAPER V: FACTORS AFFECTING DECISION OUTCOME AND LEAD-TIME IN<br />
LARGE-SCALE REQUIREMENTS ENGINEERING<br />
important customer issues a request.<br />
The t–test (Wohlin et al, 2000) results (t(752) =.586, p = .558, see the sixth<br />
row in Table 5.4) does not allow us to reject H5 0 . Therefore, we can state that<br />
based on our data there is no significant difference between the lead–time<br />
needed to take decision when the decision is requested by an important<br />
customer.<br />
One possible explanation could be the fact the all decision follow the<br />
same decision process at the case company so it doesn’t matter which customer<br />
issued a change request. Another possible explanation may be that<br />
31.3% of the analyzed requests were issued by important external customers<br />
which may have influenced the results. Finally, another possible<br />
intepretation of this result may be that the case company does not pay<br />
enough attention to the requests of important customers and thus their<br />
lead-time is not shorter. If that is the case, introducing prioritization of<br />
change requests may be a possible workaround.<br />
The result of the survey (see Table 5.3) shows a negative relationship<br />
(requests issued by important customers have shorter lead-times), in contrast<br />
to the statistical analysis indicating no relationship, see fourth row in<br />
Table 5.4. Moreover, 62.8% of the respondents reported that time to make<br />
the decision is shorter when the decision is filled in by an important customer<br />
while 23.3% of the respondents reported that this factor has no influence<br />
on decision lead–time.<br />
The discrepancy between the results from the decision log analysis and<br />
the survey needs further investigation. In related work, Taylor et al (2011)<br />
reported that the prioritization process is often favoring requirements from<br />
large customers and that this “greedy heuristic” produce good results when<br />
the customer base is small. At the same time, their preliminary results suggest<br />
no biases towards larger customers (Taylor et al, 2011), which confirms<br />
our results also conducted in a large–scale setting. However, the study<br />
by Taylor focused on the decision outcome rather than the decision lead–<br />
time. The possible summary conclusion from the results could be that,<br />
for smaller projects, the decision lead–time could be impacted by the type<br />
(size) of the customers issuing the requirements, while for larger contexts<br />
this relationship doesn’t hold.<br />
5.4 Factors that affect the decision outcome: RQ2<br />
In order to investigate which decision characteristics have a significant impact<br />
on the decision outcome, we have tested three hypotheses, H 4 ,H 5 and<br />
H 6 , see the subsections that follow, and confronted the results from the<br />
hypotheses testing with the results from the survey, see Tables 5.4 and 5.5.<br />
296
5. RESULTS AND DISCUSSION<br />
Table 5.5: Survey results - the influence of decision characteristics on the<br />
decision outcome, research question RQ2 and survey question 9 (<strong>Wnuk</strong>,<br />
2012)<br />
)<br />
There is a high number<br />
of products affected<br />
by the decision,<br />
H4 The decision is late<br />
in the release cycle,<br />
H5 The decision is filled<br />
by an important customer,<br />
H6 The decision took a<br />
long time to make,<br />
H7 This increase<br />
the<br />
probability<br />
of rejection<br />
No influence<br />
This decrease<br />
the<br />
probability<br />
of rejection<br />
Rating<br />
average<br />
/<br />
Median<br />
54.8% 33.3% 11.9% -0.43 /<br />
-1<br />
71.4% 26.2% 2.4% -0.69 /<br />
-1<br />
9.5 % 7.1% 83.3%<br />
(35%)<br />
0.74 / -<br />
1<br />
26.2% 57.1% 16.7% -0.10 /<br />
-1<br />
5.4.1 The impact of the number of products that a decision affects on<br />
the decision outcome: H 4<br />
To test the relationship between the decision outcome and the number of<br />
products affected by the decision (referred as H 4 in Table 5.4), we have<br />
formed the following hypothesis:<br />
H4 0 : The number of products affected by a decision is not different for<br />
the different decision outcomes.<br />
H4 1 : The number of products affected by a decision is different for the<br />
different decision outcomes.<br />
We used the Kolmogorov-Smirnov test for two independent samples<br />
(Smirnov, 1939) to test the relationship between an ordinal level variable<br />
and a nominal level variable. We found a result of Z = .545, p < 0.01,<br />
which is higher than the reported critical value listed for Kolmogorov-<br />
Smirnov’s Z at this level of significance. This means we can reject H 4 0<br />
and accept our alternative hypothesis. Thus, we can conclude that there<br />
is a high likelihood the two groups are derived from different populations.<br />
More precisely, we can say that the data indicates that rejected decisions<br />
have a lower number of products they affect.<br />
A significant relationship was also discovered between the number of<br />
products affected by a decision and the decision lead–time, see Section 5.3.1.<br />
297
PAPER V: FACTORS AFFECTING DECISION OUTCOME AND LEAD-TIME IN<br />
LARGE-SCALE REQUIREMENTS ENGINEERING<br />
Thus we can state with a high certainty that there is a relationship between<br />
the decision complexity, the decision outcome and time needed to take<br />
a decision in the case company, as suggested in the literature (Hogarth,<br />
1975). Our results complement related research (Saliu and Ruhe, 2005; Bagnall<br />
et al, 2001) that also suggested a possible relationship between release<br />
planning and decision quality.<br />
The survey results, see the first row in Table 5.5, disprove the statistical<br />
analysis of the decision log since 54.8% of the respondents answered that a<br />
high number of products affected by the decision increases the probability<br />
of rejection. This contradicting result could be caused by the fact that in<br />
the case study dataset more rejected than accepted decisions affected only<br />
one product. In other words, the case company seems to be more eager<br />
to reject than accept small change requests. This may have economical<br />
basis if we assume that change requests affecting only one product weakly<br />
contribute to revenue generation. In this case, it appears to be more logical<br />
to reject those change requests and focus on more complex change requests<br />
are potentialy more promissing additional revenue contributors.<br />
Another possible explanation for the conflicting results between the decision<br />
log analysis and the survey could be the fact that the majority of the<br />
survey respondents (68%) worked with companies up to 100 persons involved<br />
in a project and a typical project with not more than around 100<br />
requests. This may suggest that the complexity, understood as the number<br />
of products involved in the decision, does not influence the rejection of<br />
issued requests for larger projects, but it could for smaller projects. Also,<br />
with a low number of around 100 requests per a typical (bespoke) project,<br />
project management may need to focus on investigating and possibly accepting<br />
all change requests from the customers.<br />
Since most of the survey respondents worked with software product<br />
line approach (64%) hence some respondents admitted to work with bespoke<br />
and off–the–shelf software, this may suggest that in those contexts<br />
complex investigations are more likely to be rejected than accepted. However,<br />
this assumption needs to be further investigated for significance. In<br />
related work, <strong>Wnuk</strong> et al (2009) reported five main reasons for excluding a<br />
feature candidate from the scope of the project but not analyzed the complexity<br />
of these feature candidates. Our results suggest that the complexity<br />
is an additional factor that should be further investigated.<br />
5.4.2 Effects of a certain release number on the decision outcome: H 5<br />
As a second relationship investigated for RQ2, we tested if the product line<br />
platform release number attribute impacts the decision outcome. We stated<br />
the following hypothesis (referred as H5 in Table 5.4) and confronted the<br />
results with the results from the survey, see the third row in Table 5.5:<br />
H5 0 : The release number a decision affects is not different for the different<br />
decision outcomes.<br />
298
5. RESULTS AND DISCUSSION<br />
H5 1 : The release number a decision affects is different for the different<br />
decision outcomes.<br />
We used the Kolmogorov-Smirnov test for two independent samples,<br />
which resulted in a score of Z = 2.566, p < 0.01 (see Table 5.4). This result<br />
is above the documented critical value of Kolmogorov-Smirnov’s Z, what<br />
means we can reject H 5 0 and accept the alternative hypothesis H5 1<br />
. Thus, we<br />
can state that the changes of accepting a request are higher if that request<br />
affects a release late in the release cycle.<br />
The results from the survey show an opposite relation, see the third<br />
row in Table 5.5. 71.4% of the respondents indicated that requests affecting<br />
products with higher release numbers (planned to be released late in the release<br />
cycle) are more likely to be rejected. We suspect this contrast in results<br />
between the survey and the case study could be caused by the fact that the<br />
case company is simply getting more requests for late releases (65.5% of all<br />
requests). Another possible explanation may be that customers could use<br />
the products released in the beginning of the release cycle as a potential<br />
source of requests for future releases. This could explain the contrasting<br />
results between the decision log analysis and the survey. Moreover, since<br />
late platform releases are focusing on smaller adaptations of the platform,<br />
this may also impact the results.<br />
The fact that the respondents mainly worked with smaller projects than<br />
investigated at the case company could also be the cause of the discrepancy<br />
of the statistical analysis and survey results. To summarize, the results<br />
from the case study and from the survey suggest that the release that decisions<br />
concern could be an additional factor that influences decision outcomes<br />
and this result complements published related work (Wohlin and<br />
Aurum, 2005; <strong>Wnuk</strong> et al, 2009; Barney et al, 2008; Ruhe and Saliu, 2005).<br />
However, the discrepancy between the case study and the survey results<br />
suggest that the direction of the relationship may not always be the same.<br />
5.4.3 Effect of Important Customers on the decision outcome: H 6<br />
For the last factor that could affect decision outcome, we have tested if<br />
there was any effect on the decision outcome caused by the type of the<br />
customer that issues a change request. In order to test this relationship, we<br />
performed a χ 2 test for r ∗ c tables.<br />
Our hypothesis (H 6 in Table 5.4) is:<br />
H6 0 : The frequencies in the contingency table between the decision<br />
outcome and involvement of important customers do not differ from<br />
the normal expected frequencies.<br />
H6 1 : The frequencies in the contingency table between the decision<br />
outcome and involvement of important customers differ from the<br />
normal expected frequencies.<br />
299
PAPER V: FACTORS AFFECTING DECISION OUTCOME AND LEAD-TIME IN<br />
LARGE-SCALE REQUIREMENTS ENGINEERING<br />
The result of this test is with χ 2 (1, N = 1439) =7.032, p < .01 above the<br />
listed critical value. This means we can reject H6 0 and accept our alternative<br />
hypothesis. Since the value of χ2 is rather low, we can state that the change<br />
receives a positive decision outcome when it is requested by an important<br />
customer. Looking deeper, we identified that 11% more decisions originate<br />
from external customers than internal customers.<br />
The majority of the survey respondents (83.3%, see row 3 in Table 5.5)<br />
indicated that the importance of the customer that issues the request decreases<br />
the probability of rejection, in other words increases the probability<br />
of acceptance. Since the value of χ2 test above is rather low this may<br />
indicate that the fact that requests from important external customers were<br />
more likely accepted at the case company could be a company specific phenomenon,<br />
or related to the project size as the survey respondents most<br />
likely worked with projects with fewer than 100 requests.<br />
In a related study, Taylor et al (2011) suggested that larger customers<br />
more likely get their requirements accepted, but the paper lacks statistical<br />
analysis of the mentioned correlation. Moreover, our results from the<br />
statistical analysis regarding the influence of the importance of the customer<br />
on the decision lead–time H2 and the decision outcome H5 are not<br />
consistent, which could suggest additional uncovered factors. Ruhe and<br />
Saliu (2005) suggested that the release decisions are made by “contracting<br />
the main stakeholders and manually balancing their interests and preferences”<br />
which we interpret as accepting more features from important<br />
(main) stakeholders. Finally, our results confirm the viewpoint of Bagnall<br />
et al (2001), who suggested that requirements from “favored customers”<br />
will be viewed as more important than other requirement and thus those<br />
requirements will be more often accepted.<br />
5.5 Effect of lead–time on the decision outcome - RQ3<br />
The last relationship we examined is whether the lead–time influences the<br />
decision outcome. To test this relation, we stated the following hypothesis<br />
(stated as H 7 in Table 5.4):<br />
H7 0 : The average lead–time needed to make a decision does not differ<br />
per decision outcome.<br />
H7 1 : The average lead–time to make a decision does differ per decision<br />
outcome.<br />
After categorizing decisions to accepted and rejected decisions, we calculated<br />
their average lead–times. The average lead–time for accepted and<br />
rejected decisions is respectively μ = 1.12 and μ = .98. The t–test result<br />
(t(752) = 3.940, p < 0.01, see the last row in Table 5.4) indicated a significant<br />
differences between the average lead–time for both decision outcomes.<br />
This means we can accept H 7 1 and reject the null–hypothesis H7 0 .<br />
300
6. CONCLUSIONS<br />
Based on these results, we can state that the average lead–time needed<br />
to reject a decision is statistically significantly longer than the lead–time<br />
needed to accept a decision.<br />
When looking at the survey results presented in the last row in Table<br />
5.5, we see that 57.1% of the respondents indicated that the time to<br />
make the decision does not influence the decision outcome. The statistical<br />
analysis of the survey results for this question showed a neutral relationship<br />
(median equals to 0, see last row in Table 5.4) which prevents us from<br />
drawing stong conclusions. However, it is worth noticing that 26.2% of the<br />
respondents agreed with the statistically significant result of the decision<br />
log analysis.<br />
There could be several possible causes of the discrepancy between the<br />
decision log analysis results and the survey results in regards to this aspect.<br />
One possible explanation could be the size of the projects analyzed<br />
in the case study and by the survey respondents. Since the questionnaire<br />
respondents mainly worked with projects that generate not more than 100<br />
requests and with smaller companies, we suspect that the complexity of<br />
the issued changes in those contexts is smaller than in the case of the case<br />
company investigated. As a results, those assumingly less complex decisions<br />
could be proceeded faster by our questionnaire respondents than by<br />
the practitioners from the case company, as suggested by Hogarth (1975).<br />
Thus, the survey respondents might have not been able to experience as<br />
long decision lead–times as the case company practitioners and thus for<br />
them this factors does not influence the decision outcome.<br />
Moreover, since the case company operates in the MDRE context, the<br />
time pressure to investigate and decide upon incoming requirements is<br />
high. Excessive deposition of decisions may cause serious consequences<br />
for the success of software projects in the MDRE context as time–to–market<br />
is critical (Regnell and Brinkkemper, 2005). For long investigations, decision<br />
makers could simply be forced to reject the proposal due to a missed<br />
market–window opportunity and this could be one of the possible explanation<br />
of the statistically significant result. This interpretation could be<br />
supported by the fact that more than 1/4 of the survey respondents worked<br />
with bespoke software projects. Furthermore, as visualized by <strong>Wnuk</strong> et<br />
al (2009), accepting new features to the project scope is much easier than<br />
reducing the scope which is often performed during the entire time of the<br />
project.<br />
6 Conclusions<br />
Although RE decision making has been studies in a number of publications<br />
(Alenljung and Persson, 2008; Aurum and Wohlin, 2003; Evans et al, 1997;<br />
Ngo-The and Ruhe, 2005; Fogelstrom et al, 2009; Berander and Andrews,<br />
2005; Wohlin and Aurum, 2005; Barney et al, 2008; Rolland et al, 1995),<br />
301
PAPER V: FACTORS AFFECTING DECISION OUTCOME AND LEAD-TIME IN<br />
LARGE-SCALE REQUIREMENTS ENGINEERING<br />
little empirical evidence exists that explicitly and exhaustively investigates<br />
the relationships between the change requests attribute and the decision<br />
lead–times and outcomes.<br />
In this paper, we report on an investigation of decision making in requirements<br />
engineering. We analyzed 1439 change requests looking for<br />
statistically significant relationships between the decision making factors<br />
i.e., number of products, release number, type of customer and decision<br />
lead–times and outcomes. The results from this analysis were confronted<br />
with the results from a survey among 50 practitioners from several countries<br />
involved in decision making processes. The results from the study<br />
could be summarized in the following points:<br />
• The lead–time to make a decision increases when more products (considered<br />
as a proxy for the decision complexity) are affected by this decision<br />
- this result was confirmed both in the statistical analysis and<br />
in the survey. Since the relationship is rather clear, decision makers<br />
should be aware that too complex decisions may take a long time<br />
(hypothesis H 1 ).<br />
• The statistical analysis showed that if a request affects a lot of products,<br />
it has a higher change of being accepted (hypothesis H 4 ). The<br />
respondents of the survey stated that requests that affect a lot of products<br />
have a higher change of being rejected. This may seem counterintuitive,<br />
but this is probable caused by the fact that request that affect<br />
a lot of products are often requests related to the platform and<br />
thus are important.<br />
• There is no significant relationship between the release of the product<br />
line that a change request impacts and the decision lead–time<br />
according to the results from the statistical analysis of the decision<br />
log. At the same time, the majority of the respondents in the survey<br />
suggested that decisions made late in the release cycle have shorter<br />
lead–times (hypothesis H 2 ).<br />
• Change requests affecting late releases have a significantly higher<br />
probability of acceptance according to the statistical analysis of the<br />
decision log (hypothesis H 5 ). This result seems to be more characteristic<br />
for large contexts as the results from the survey, in which most<br />
respondents worked with projects with fewer than 100 decisions, indicate<br />
the opposite relationship with a higher probability of rejecting<br />
these requests.<br />
• The lead–time for decisions is shorter when the change requests are<br />
issued by important customers, according to the respondents (hypothesis<br />
H 3 ). The statistical analysis of the decision log disproved<br />
this suggestion. Therefore, no clear relationship was identified for<br />
this factor.<br />
302
6. CONCLUSIONS<br />
• Change requests issued by important customers are more likely to be<br />
accepted, (hypothesis H 6 ) according to the statistical analysis of the<br />
decision log. This relationship was confirmed by a clear majority of<br />
survey respondents (83.3%).<br />
• The lead–time to reject a decision is significantly longer than to accept<br />
a decision (research question RQ3), according to the statistical<br />
analysis of the decision log. At the same time, the results from the<br />
survey suggests that there is no relationship between the lead–time<br />
and the decision outcome.<br />
Our results clearly indicate that the number of products affected by a<br />
decision increases the decision lead–time (research question RQ1). This result<br />
has a practical importance for requirements engineering decision makers.<br />
As more complex decision take more time, it may be wise to decrease<br />
their complexity for faster decisions. This could be particularly useful in<br />
MDRE where time to market pressure is inevitable (Regnell and Brinkkemper,<br />
2005). Our study reports that lead–times could become up to 400%<br />
longer if a complex decision affects multiple products.<br />
Our results also confirm that the importance of the customer who issues<br />
a decision log increases the probability of acceptance (research question<br />
RQ2). These requests have an 11% higher change to be accepted than<br />
other requests. Product management processes could be adapted when<br />
being aware of the supported relationships. For example, the change process<br />
of Figure 5.1 can be refined by asking for additional details from more<br />
important customers in order to reduce the lead–time.<br />
Regarding the relationship between the decision lead–time and the decision<br />
outcome (research question RQ3), we report based on the analysis of<br />
the deicision log that the average lead–time needed to reject a decision is<br />
statistically significantly longer than the lead–time needed to accept a decision.<br />
This result couldn’t been confirmed by the survey respondents. Decision<br />
makers could use this conclusion when planning for effective pruning<br />
of possible decisions for a project. At the same time, this relationship seems<br />
to hold for larger projects, as the results from the survey suggests that there<br />
is no relationship between the lead–time and the decision outcome.<br />
Related to the differences observed between the statistical analysis results<br />
and the survey results, we report that there are premises that less complex<br />
decisions are more often rejected in large projects but not in smaller<br />
projects. Moreover, for smaller project the decisions affecting products<br />
planned to be released late in the release cycle are more likely to be rejected<br />
than for larger projects. At the same time, the majority of the survey<br />
respondent reported that time to make a decision is shorter when this decision<br />
is filled by an important customer, while for the large case company<br />
this relationship doesn’t seem to hold.<br />
Future research is planned to go more in depth on the possible relationships<br />
among requirements engineering decision making characteris-<br />
303
PAPER V: FACTORS AFFECTING DECISION OUTCOME AND LEAD-TIME IN<br />
LARGE-SCALE REQUIREMENTS ENGINEERING<br />
tics. Two relationships could be proven and quantified by us, but the other<br />
five relationships need further research in order to further explore them.<br />
Within the two relationships proven by us, more research is needed as<br />
well. For instance, it would be helpful and desirable if a function could<br />
be formulated to estimate the lead–time or the chance on a certain decision<br />
outcome.<br />
Finally, other decision characteristics, such as the number of stakeholders<br />
involved of the number of dependencies between software components,<br />
could also be of relevance for the decision lead–time or outcome.<br />
Due to lack of data, these characteristics have not yet been taken into account<br />
in this research, but could be considered in the scope for future research.<br />
Acknowledgment<br />
The authors would like to thank Thomas Olsson and Prof. Per Runeson<br />
for their suggestions in this research project. The authors would like to<br />
thank Dr. David Callele for excellent language comments. We also thank<br />
the survey respondents. This work was supported by VINNOVA within<br />
the UPITER project.<br />
304
6. CONCLUSIONS<br />
APPENDIX: QUESTIONNAIRE QUESTIONS<br />
INTRODUTION<br />
This is a short survey about decision making in requirements engineering.<br />
When managing requirements, often the decision has to be made whether<br />
or not to accept a certain requirement request. These possible requirements<br />
all have different characteristics such as the number of products they affect<br />
or the fact that they are requested by an important customer.<br />
The purpose of this survey is to asses which characteristics of submitted<br />
requirements change requests may influence the decision outcome and<br />
the decision lead-time. We already performed a quantitative analysis on<br />
the decision logs of a large software products company and we want to<br />
validate our results using experiences from other companies.<br />
After your participation in the survey we will get back to you with the<br />
analyzed results of the survey and you will also get access to the results<br />
of the quantitative analysis of decision logs. Thanks in advance for your<br />
cooperation!<br />
BACKGROUND<br />
In order to compare your answers with our quantitative analysis results,<br />
we need to know some things about you, your company and your project<br />
context.<br />
Question 1: What region are you most active in?<br />
( ) The Netherlands<br />
( ) Belgium<br />
( ) Germany<br />
( ) Sweden<br />
( ) Worldwide<br />
( ) Other (please specify)<br />
Question 2: What is your current role within the company?<br />
( ) Project Manager<br />
( ) Product Manager<br />
( ) Quality Expert<br />
( ) Developer<br />
( ) Senior Management<br />
( ) Consultant<br />
( ) Other (please specify)<br />
Question 3: How many years of professional experience do you have<br />
in software engineering?<br />
305
PAPER V: FACTORS AFFECTING DECISION OUTCOME AND LEAD-TIME IN<br />
LARGE-SCALE REQUIREMENTS ENGINEERING<br />
Question 4: How many people are involved in the software engineering<br />
process in your company? Please consider all employees, including,<br />
but not limited to developers, testers and management.<br />
()< 10<br />
()10-100<br />
( ) 101 - 500<br />
( ) 501 - 1000<br />
()> 1000<br />
Question 5: What kind of relationship does your company have with<br />
its customers?<br />
( ) We create mostly custom bespoke software<br />
( ) We create mostly off-the-shelf software<br />
( ) Other (please specify)<br />
Question 6: How many requirement requests does a project in your company<br />
have on average?<br />
( ) Around 10<br />
( ) Around 100<br />
( ) Around 1.000<br />
( ) Around 10.000<br />
( ) Other (please specify)<br />
Question 7: Does your company apply a software product line approach?<br />
(Does your company release a collection of similar software products<br />
from a shared set of software assets?)<br />
()Yes<br />
()No<br />
( ) Other (please specify)<br />
RATINGS<br />
Please answer the questions below according to your own experiences.<br />
Please indicate how the following decision characteristics influence the<br />
time needed to take the decision.<br />
Question 8. Please indicate how the following decision characteristics<br />
influence the time needed to take the decision<br />
Question 9. Please indicate how the following decision characteristics<br />
influence the decision outcome.<br />
306
6. CONCLUSIONS<br />
Table 5.6: Question 8. Please indicate how the following decision characteristics<br />
influence the time needed to take the decision.<br />
This makes the No influ- This makes the<br />
time to decide ence time to decide<br />
shorter<br />
longer<br />
There are a high<br />
number of prod-<br />
() () ()<br />
ucts affected by<br />
the decision<br />
The decision is () () ()<br />
late in the release<br />
cycle<br />
The decision is () () ()<br />
filed by an important<br />
customer<br />
Table 5.7: Question 9. Please indicate how the following decision charac-<br />
teristics influence the decision outcome.<br />
This increase the<br />
probability of re-<br />
There are a high<br />
number of products<br />
affected by<br />
the decision<br />
The decision is<br />
late in the release<br />
cycle<br />
The decision is<br />
filed by an impor-<br />
tant customer<br />
The decision took<br />
a long time to<br />
make<br />
No influ- This decrease the<br />
ence probability of rejectionjection<br />
() () ()<br />
() () ()<br />
() () ()<br />
() () ()<br />
307
PAPER V: FACTORS AFFECTING DECISION OUTCOME AND LEAD-TIME IN<br />
LARGE-SCALE REQUIREMENTS ENGINEERING<br />
308
Bibliography<br />
REFERENCES<br />
Alenljung B, Persson A (2008) Portraying the practice of decision-making<br />
in requirements engineering: a case of large scale bespoke development.<br />
Requirements Engineering 13(4):257–279<br />
Ashrafi N (1998) Decision making framework for software total quality<br />
management. International Journal of Technology Management 16(4-<br />
6):532 – 543<br />
Aurum A, Wohlin C (2003) The fundamental nature of requirements engineering<br />
activities as a decision-making process. Information and Software<br />
Technology 45(14):945–954<br />
Aurum A, Wohlin C (2005) Engineering and managing software requirements.<br />
Springer Verlag<br />
Bagnall A, Rayward-Smith V, Whittley I (2001) The next release problem.<br />
Information and Software Technology 43(14):883 – 890<br />
Barney S, Aurum A, Wohlin C (2008) A product management challenge:<br />
Creating software product value through requirements selection. Journal<br />
of Systems Architecture - Embedded Systems Design 54(6):576–593<br />
Berander P, Andrews A (2005) Requirements prioritization. In: Aurum<br />
A, Wohlin C (eds) Engineering and Managing Software Requirements,<br />
Springer Berlin Heidelberg, pp 69–94<br />
Cleland-Huang J, Settimi R, BenKhadra O, Berezhanskaya E, Christina<br />
S (2005) Goal-centric traceability for managing non-functional requirements.<br />
In: Proceedings of the 27th international conference on Software<br />
engineering, ACM, New York, NY, USA, ICSE ’05, pp 362–371<br />
Cooper R (1990) Stage-gate systems: a new tool for managing new products.<br />
Business Horizons 33(3):44–54<br />
D’Agostino R, Pearson E (1973) Tests for departure from normality. empirical<br />
results for the distributions of b 2 and √ b 1 . Biometrika 60(3):613<br />
DeCarlo L (1997) On the meaning and use of kurtosis. Psychological Methods<br />
2(3):292–307<br />
DeGregorio G (1999) Enterprise-wide requirements and decision management.<br />
Proceedings of 9th International Symposium of the International<br />
Council on System Engineering<br />
Easterbrook S, Singer J, Storey MA, Damian D (2008) Selecting empirical<br />
methods for software engineering research. In: Shull F, Singer J, Sjøberg<br />
D (eds) Guide to Advanced Empirical Software Engineering, Springer<br />
London, pp 285–311<br />
309
REFERENCES<br />
Egyed A, Wile D (2006) Support for Managing Design-Time Decisions.<br />
IEEE Transactions on Software Engineering 32(5):299–314<br />
Evans R, Park S, Alberts H (1997) Decisions not requirements decisioncentered<br />
engineering of computer-based systems. In: The 1997 IEEE<br />
Conference and Workshop on Engineering of Computer-Based Systems,<br />
pp 435–442<br />
Field A (2009) Discovering statistics using SPSS. Sage Publications Ltd<br />
Fogelstrom N, Barney S, Aurum A, Hederstierna A (2009) When product<br />
managers gamble with requirements: attitudes to value and risk. Berlin,<br />
Germany, pp1–15<br />
Garcia-Retamero R, Hoffrage U (2006) How causal knowledge simplifies<br />
decision-making. Minds and Machines 16(3):365 – 80<br />
Hallowell R (1996) The relationships of customer satisfaction, customer<br />
loyalty, and profitability: an empirical study. International Journal of<br />
Service Industry Management 7(4):27–42<br />
Hogarth R (1975) Decision time as a function of task complexity. Utility,<br />
probability, and human decision making: selected proceedings of an interdisciplinary<br />
research conference, Rome, 3-6 September, 1973 pp 321–<br />
338<br />
Jacoby J, Matell M (1971) Three-point Likert scales are good enough. Journal<br />
of Marketing Research 8(4):495–500<br />
Jonsson P, Lindvall M (2005) Impact analysis. In: Aurum A, Wohlin C (eds)<br />
Engineering and Managing Software Requirements, Springer Berlin Heidelberg,<br />
pp 117–142<br />
Kabbedijk J, <strong>Wnuk</strong> K, Regnell B, Brinkkemper S (2010) What decision characteristics<br />
influence decision making in market-driven large-scale software<br />
product line development? In: Proceedings of the Product Line<br />
Requirements Engineering and Quality Workshop at the 16th REFSQ<br />
Conference, Duisburg, Germany, p 42–53<br />
Karlsson J, Ryan K (1997) A cost-value approach for prioritizing requirements.<br />
IEEE Software 14(5):67–74<br />
Karlsson L, Dahlstedt A, Regnell B, Natt och Dag J, Persson A<br />
(2007a) Requirements engineering challenges in market-driven software<br />
development–An interview study with practitioners. Information and<br />
Software technology 49(6):588–604<br />
Karlsson L, T T, Regnell B, Berander P, Wohlin C (2007b) Pair-wise comparisons<br />
versus planning game partitioning-experiments on requirements<br />
prioritisation techniques. Empirical Software Engineering 13(3):3–33<br />
310
REFERENCES<br />
Khatri N (2000) The Role of Intuition in Strategic Decision Making. Human<br />
Relations 53(1):57–86<br />
Kitchenham B, Pfleeger S (2002) Principles of survey research part 2: designing<br />
a survey. ACM SIGSOFT Software Engineering Notes 27(1):18–<br />
20<br />
Kitchenham BA, Travassos GH, von Mayrhauser A, Niessink F, Schneidewind<br />
NF, Singer J, Takada S, Vehvilainen R, Yang H (1999) Towards<br />
an ontology of software maintenance. Journal of Software Maintenance<br />
11(6):365–389<br />
Klein G, Orasanu J, Calderwood R, Zsambok C (eds) (1995) Decision making<br />
in action: Models and methods. New Jersey: Norwood<br />
Leffingwell D, Widrig D (2003) Managing Software Requirements: A Use<br />
Case Approach, 2nd edn. Pearson Education<br />
Lethbridge TC, Sim SE, Singer J (2005) Studying software engineers: Data<br />
collection techniques for software field studies. Empirical Softw Engg<br />
10:311–341<br />
Li C, van den Akker M, Brinkkemper S, Diepen G (2010) An integrated<br />
approach for requirement selection and scheduling in software release<br />
planning. Requirements Engineering 15(4):375 – 96<br />
Messerschmitt D (2004) Marketplace issues in software planning and design.<br />
IEEE Software 21(3):62–70<br />
Natt och Dag J, Regnell B, Carlshamre P, Andersson M, Karlsson J (2001)<br />
Evaluating automated support for requirements similarity analysis in<br />
market-driven development. Proceeding of the 7th International Workshop<br />
on Requirements Engineering: Foundation for Software Quality<br />
(REFSQ’01)<br />
Natt och Dag J, Regnell B, V Gervasi SB (2005) A Linguistic-Engineering<br />
Approach to Large-Scale Requirements Management. IEEE Software<br />
3:32–39<br />
Ngo-The A, Ruhe G (2005) Decision support in requirements engineering.<br />
In: Aurum A, Wohlin C (eds) Engineering and Managing Software Requirements,<br />
Springer Berlin Heidelberg, pp 267–286<br />
Ott L, Longnecker M (2008) An introduction to statistical methods and data<br />
analysis. Duxbury Pr<br />
Paech B, Koenig T, Borner L, Aurum A (2005) An Analysis of Empirical Requirements<br />
Engineering Survey Data. Engineering and Managing Software<br />
Requirements pp 427–452<br />
311
REFERENCES<br />
Pohl K, Böckle G, Van Der Linden F (2005) Software Product Line Engineering:<br />
Foundations, Principles, and Techniques. Springer-Verlag New<br />
York Inc<br />
Regnell B, Brinkkemper S (2005) Market-driven requirements engineering<br />
for software products. Engineering and managing software requirements<br />
pp 287–308<br />
Regnell B, Kuchcinski K (2011) Exploring software product management<br />
decision problems with constraint solving - opportunities for prioritization<br />
and release planning. In: Proceedings of the Fifth International<br />
Workshop on Software Product Management (IWSPM 2011), pp 47 –56<br />
Rolland C, Souveyet C, Moreno M (1995) An approach for defining waysof-working<br />
Ruhe G (2009) Product Release Planning: Methods, Tools and Applications.<br />
Auerbach Publications<br />
Ruhe G, Saliu M (2005) The Art and Science of Software Release Planning.<br />
IEEE Software 22(6):47–53<br />
Runeson P, Höst M (2009) Guidelines for conducting and reporting case<br />
study research in software engineering. Empirical Software Engineering<br />
14(2):131–164<br />
Saliu O, Ruhe G (2005) Supporting software release planning decisions for<br />
evolving systems. Proceedings of the 29th Annual IEEE/NASA Software<br />
Engineering Workshop pp 14–26<br />
Sheskin D (2004) Handbook of parametric and nonparametric statistical<br />
procedures. Chapman and Hall<br />
Smirnov N (1939) On the estimation of the discrepancy between empirical<br />
curves of distribution for two independent samples. Bulletin Mathematics<br />
Univiversity Moscow 2:3–14<br />
Spearman C (1904) General intelligence: Objectively determined and measured.<br />
The American Journal of Psychology 15(2):201–292<br />
Stevens S (1946) On the theory of scales of measurement. Science<br />
103(2684):677–680<br />
Strigini L (1996) Limiting the Dangers of Intuitive Decision Making. IEEE<br />
Software 13(1):101–103<br />
Taylor C, Miransky A, Madhavji N (2011) Request-implementation ratio as<br />
an indicator for requirements prioritisation imbalance. Trento, Italy, pp<br />
3–6<br />
312
REFERENCES<br />
van den Akker M, Brinkkemper S, Diepen G, Versendaal J (2008) Software<br />
product release planning through optimization and what-if analysis. Information<br />
and Software Technology 50(1-2):101 – 11<br />
Wild C, Maly K, Zhang C, Roberts C, Rosca D, Taylor T (1994) Software engineering<br />
life cycle support-decision based systems development. New<br />
York, NY, USA, vol vol.2, pp 781 – 4<br />
<strong>Wnuk</strong> K (2012) The survey questions can be accessed at. <br />
<br />
<br />
<strong>Wnuk</strong> K, Regnell B, Karlsson L (2009) What happened to our features?<br />
visualization and understanding of scope change dynamics in a largescale<br />
industrial setting. In: Proceedings of the 17th IEEE International<br />
Requirements Engineering Conference (RE 2009), pp 89–98<br />
<strong>Wnuk</strong> K, Regnell B, Berenbach B (2011) Scaling up requirements engineering<br />
- exploring the challenges of increasing size and complexity in<br />
market-driven software development. In: Proceedings of the 17th international<br />
working conference on Requirements engineering: foundation<br />
for software quality, Springer-Verlag, Berlin, Heidelberg, REFSQ’11, pp<br />
54–59<br />
Wohlin C, Aurum A (2005) What is important when deciding to include<br />
a software requirements in a project or release? In: Proceedings of<br />
the International Symposium on Empirical Software Engineering (ISESE<br />
2005), pp 246–255<br />
Wohlin C, Höst M, Runeson P, Ohlsson M, Regnell B, Wesslén A (2000)<br />
Experimentation in software engineering: an introduction. Kluwer Academic<br />
Pub<br />
Yin R (2008) Case study research: Design and methods. Sage Publications,<br />
Inc<br />
Zur H, Breznitz S (1981) The effect of time pressure on risky choice behavior.<br />
Acta Psychologica 47(2):89–104<br />
313
REFERENCES<br />
314
Paper VI<br />
Scope Tracking and Visualization for Very<br />
Large-Scale Requirements Engineering<br />
<strong>Krzysztof</strong> <strong>Wnuk</strong>1 , David Callele2 , Tony Gorschek3 , Even-André Karlsson4 and Björn Regnell1 1Department of Computer Science,<br />
Lund University, Sweden<br />
<br />
2 TRLabs, Saskatoon, Saskatchewan, Canada ,<br />
<br />
3School of Computing Software Engineering Research Lab,<br />
Blekinge Institute of Technology,<br />
SE-371 79 Karlskrona, Sweden<br />
<br />
4Add a Lot, Sweden,<br />
<br />
submitted to the<br />
Transactions on Software Engineering journal 2012<br />
ABSTRACT<br />
Requirements scope management is an important part of<br />
software engineering. Deciding the optimal scope that fulfills<br />
the needs of the most important stakeholders is challenging<br />
due to a plethora of aspects may impact decisions. In rapidly<br />
changing software markets, frequently changing needs of stakeholders<br />
force decision makers to continuously adjust the scope<br />
of their projects. How to support decision makers facing many<br />
changes occurring in large software projects? This paper presents<br />
a visual technique designed to give a quick and effective overview<br />
over requirements scoping process for large and very-large projects.<br />
The technique provides multiple-views and it can visualize various<br />
information based on given filtering criteria. Furthermore,<br />
the paper analyzes the decision making patterns based on a<br />
large dataset from industry. The results are evaluated during<br />
interviews with practitioners.
1 Introduction<br />
1. INTRODUCTION<br />
The probability of project success is directly correlated with the quality of<br />
the scoping exercise; for some, the scope of a software project defines its<br />
success or failure (Iacovou and Dexter, 2004). Overscoping, scope-creep<br />
and requirements scrap are other aspects of scoping that may have negative<br />
impacts upon software projects (Bjarnason et al, 2012). Optimizing<br />
and maintaining scope while addressing the changing needs of key customers<br />
are critical for successful development projects.<br />
Large software projects operating in a Market-Driven Requirements<br />
Engineering (MDRE) context (Regnell and Brinkkemper, 2005) experience<br />
many scope changes during both requirements and development phases<br />
(<strong>Wnuk</strong> et al, 2009). These changes need to be analyzed, decisions made, actions<br />
taken and documentation maintained. When the number of changes<br />
is large, and the complexity of the impact analysis is significant, understanding<br />
the consequences of changes is challenging. Current requirements<br />
tools offer only partial solutions to this challenge.<br />
In this paper, we present a technique for visualizing scope changes in<br />
large software projects, successfully applied to datasets from projects with<br />
thousands of features. The implementation supports visualizing large feature<br />
sets, as well as sorting, filtering and interactive zooming. The technique<br />
was evaluated on a very large industry dataset then evaluated by<br />
and refined with the assistance of several industry practitioners.<br />
This paper is structured as follows: Section 2 presents background and<br />
related work, Section 3 presents the case study company description while<br />
Section 4 presents research methodology. The visual technique is presented<br />
in Section 5 while Section 6 presents and discusses the identified decision<br />
patterns. In Section 7 we conclude the paper.<br />
2 Background and Related Work<br />
Market-Driven Requirements Engineering (MDRE) (Regnell and Brinkkemper,<br />
2005) is defined as the process of managing requirements for software<br />
products that are offered to an open marked. Producing software<br />
for the open market differs from developing bespoke software in several<br />
ways. Among the most important characteristics, Regnell and Brinkkemper<br />
(2005) identified: (1) release planning focused on time-to-market and<br />
return-on-investment, (2) large volume of potential requirements and (3)<br />
consequences of RE decisions are suffered only by the company responsible<br />
for the decisions. The presence of a constant stream of incoming requirements,<br />
asynchronous to the development cycle, combined with market<br />
pressures from competitors’ products, increases the difficulty and importance<br />
of effective decision making in MDRE.<br />
Several studies reported a variety of challenges in MDRE contexts (Reg-<br />
317
PAPER VI: SCOPE TRACKING AND VISUALIZATION FOR VERY<br />
LARGE-SCALE REQUIREMENTS ENGINEERING<br />
nell and Brinkkemper, 2005; Karlsson et al, 2002; Lubars et al, 1993; Gorschek<br />
and Wohlin, 2006; Höst et al, 2001; Carlshamre et al, 2001). Among the reported<br />
decision making challenges in MDRE, Karlsson et al (2002) identified<br />
managing the communication gap between marketing staff and development<br />
as significant. Managing the constant flow of requirements, and<br />
the number of requirements, were also identified (Karlsson et al, 2002)<br />
as threats that could cause requirements process overloading (Höst et al,<br />
2001; Regnell and Brinkkemper, 2005), and overscoping (Bjarnason et al,<br />
2012). The absence of actual customers with which to negotiate requirements<br />
(Potts, 1995) and the many different forms and abstraction levels of<br />
incoming requirements (Gorschek and Wohlin, 2006) also complicate the<br />
decision making process. Given that requirements are (typically) highly interrelated<br />
(Carlshamre et al, 2001), selecting a requirement requires checking<br />
its dependencies and can even necessitate including dependent requirements.<br />
Identifying an appropriate balance between market pull and<br />
technology push (Regnell and Brinkkemper, 2005) in the context of release<br />
planning based on uncertain estimates (Karlsson and Ryan, 1997; Karlsson<br />
et al, 2002; Ruhe and Saliu, 2005) is a challenging task.<br />
Decision making occupies a central place in requirements engineering<br />
(Aurum and Wohlin, 2003) and is considered inevitable when managing<br />
requirements (DeGregorio, 1999). The decisions in requirements engineering<br />
process can range from the organizational down to the project<br />
level (Aurum and Wohlin, 2003; Ngo-The and Ruhe, 2005) and making<br />
these decisions is considered knowledge-intensive (Klein et al, 1995). Several<br />
studies identified challenges in requirements engineering decision making<br />
including incompleteness of available information (Ngo-The and Ruhe,<br />
2005), shifting, ill-defined or competing goals (Alenljung and Persson, 2008),<br />
finding the right balance between the commercial requirements over internal<br />
quality requirements (Karlsson and Ryan, 1997; Fogelström et al, 2009),<br />
conflicting priorities between stakeholders (Karlsson and Ryan, 1997), dependencies<br />
between requirements (Carlshamre et al, 2001), and the identification<br />
of business goals when performing release planning (Ngo-The and<br />
Ruhe, 2005). Further challenging aspects include the fact that decisions in<br />
requirements engineering are often semi-structured or unstructured (Ngo-<br />
The and Ruhe, 2005) and the fact that often decisions need to be changed<br />
or altered (<strong>Wnuk</strong> et al, 2009). Finally, as requirements decision making<br />
area is still in its initiation (Ngo-The and Ruhe, 2005), more research need<br />
to be conducted, e.g. in identifying objective criteria for guiding decision<br />
makers that could be based on past experiences (Strigini, 1996).<br />
Requirements prioritization, selecting the most valuable requirements<br />
for implementation, is challenging for many reasons including conflicting<br />
stakeholder priorities (Karlsson and Ryan, 1997), dependencies between<br />
requirements (Carlshamre et al, 2001), different requirement abstraction<br />
levels rendering comparison difficult (Gorschek and Wohlin, 2006) and<br />
limited requirements prioritization method scalability (Lehtola and Kaup-<br />
318
2. BACKGROUND AND RELATED WORK<br />
pinen, 2006). Techniques such as cost-value analysis (Karlsson and Ryan,<br />
1997), dividing requirements into three different piles (Beck and Andres,<br />
2004) can be employed. Scoping decisions based on requirements prioritization<br />
are often changed or altered due to a number of factors such as<br />
stakeholder business decision or lack of resources (<strong>Wnuk</strong> et al, 2009). Further<br />
research into management of the decision making process, including<br />
real-time feedback on ongoing projects, is recommended (Basili and Rombach,<br />
1988).<br />
The release planning process makes software available to users of an<br />
evolving software product (Ruhe, 2009) in planned stages (van der Hoek<br />
et al, 1997), extending the prioritization process to include temporal aspects<br />
such as the assignment of individual requirements to specific releases.<br />
Several methods for supporting release planning were proposed,<br />
e.g. the EVOLVE method (Greer and Ruhe, 2004), EVOLVE* - balancing<br />
release time, effort and value (Ruhe and Ngo, 2004), a method based on<br />
what-if analysis (van den Akker et al, 2008), a method based on combining<br />
cost-value analysis with requirements interdependencies (Carlshamre,<br />
2002), a method based on fixed release dates that allocates requirements<br />
to a "must" element and a "wish" element (Regnell et al, 1998). Incremental<br />
methods for release planning (Denne and Cleland-Huang, 2004) are<br />
a principal element of agile software development processes. Finally, approaches<br />
for release planning based on integer linear programming (van<br />
Den Akker et al, 2005) or constraint programming (Regnell and Kuchcinski,<br />
2011) were also proposed.<br />
Despite the large number of proposed methods for release planning,<br />
Svahnberg et al (2010) reported on 24 strategic release planning models<br />
presented in academic papers investigating market-driven software development,<br />
the activity remains challenging. Jantunen et al (2011) identified<br />
three main challenges of software release planning: (1) requirements prioritization,<br />
(2) resolving requirements interdependencies and (3) continuously<br />
changing problem definitions and viewpoints. The number of factors<br />
possible affecting priorities of requirements in software product companies<br />
is high (Lehtola and Kauppinen, 2006) including the volume of information<br />
that must be considered when performing release planning (Ruhe, 2009)<br />
and uncertainties about the sources and quality of this information (Ruhe,<br />
2009). This work addresses aspects of these issues by providing visualization<br />
techniques that support the release planning process.<br />
Requirements scoping is considered a core function in software release<br />
planning (Schmid, 2002), particularly in the context of software product<br />
lines (Schmid, 2002; Kishi et al, 2002; Savolainen et al, 2007). The software<br />
product line literature contains work on the identification aspect of<br />
scoping (Schmid, 2002; Savolainen et al, 2007) while our previous work<br />
has shown that scoping is a continuous activity, an activity where overscoping<br />
(Bjarnason et al, 2012) and scope reductions are frequent phenomena<br />
(<strong>Wnuk</strong> et al, 2009). Scoping is also prominent in the project and<br />
319
PAPER VI: SCOPE TRACKING AND VISUALIZATION FOR VERY<br />
LARGE-SCALE REQUIREMENTS ENGINEERING<br />
product management literature (Institute, 2000; Iacovou and Dexter, 2004;<br />
Legodi and Barry, 2010).<br />
Regarding related work on scoping in project and product management,<br />
several studies focused on a phenomenon of scope creep defined as<br />
uncontrolled expansion of initially decided scope (Carter et al, 2001; Hall<br />
et al, 2002; DeMarco and Lister, 2003; Iacovou and Dexter, 2004; Kulk and<br />
Verhoef, 2008). Scope creep could be cased by sales stuff agreeing to deliver<br />
unrealistically large features without checking the scheduling implications<br />
first (Hall et al, 2002) or by stakeholders unable to concur on project<br />
goals (DeMarco and Lister, 2003) and have serious negative consequences<br />
on project, including project failure (Iacovou and Dexter, 2004). To mitigate<br />
negative effects of scope creep, Carter et al (2001) suggested combining<br />
evolutionary prototyping and risk-mitigation strategy. Another related<br />
phenomenon is requirements scrap which is defined as a situation when the<br />
scope of a project both increases but also decreases (Kulk and Verhoef,<br />
2008). Whether increase of the project scope is simply scope creep, decrease<br />
of the scope could be a result of shrinking budgets or running out<br />
of schedule (Kulk and Verhoef, 2008). In our recent study about overscoping,<br />
defined as setting a scope that requires more resources than are available<br />
(Bjarnason et al, 2012), we identified and empirically investigated six<br />
main causes of overscoping and we confirmed that overscoping can have<br />
serious negative effects, including: many changes after the project scope<br />
is set, quality issues, wasted effort and customer expectations not always<br />
met (Bjarnason et al, 2012). The visualizations presented in this paper help<br />
to address both scope creep and scope scrap challenges by providing a robust<br />
overview over scoping decisions.<br />
Visualizing information improves comprehension, particularly with multidimensional<br />
data sets (Tufte, 1990) such as the requirements engineering<br />
decision making tasks considered by Gotel et al (2007). Visual notation<br />
supplemented by accompanying text according to dual channel theory (Moody,<br />
2009) have been shown to improve comprehension even further.<br />
Given that customers of software products are often non-technical people<br />
(Avison and Fitzgerald, 1998) and that requirements engineering is<br />
a communication intensive phase of software development, it is surprising<br />
that only a small number of studies focus on visualization in requirements<br />
engineering (Gotel et al, 2007). Visualizations appear to be principally<br />
used in later phases of the development lifecycle (Gotel et al, 2007),<br />
e.g. for creating visual representations of the code (Ball and Eick, 1996),<br />
to support test data selection (Leon et al, 2000) and to summarize bug<br />
reports (D’Ambros et al, 2007). Several researchers focused on visualizing<br />
open source software development projects, proposing visual techniques<br />
for: code clone analysis (Livieri et al, 2007), project communication<br />
(Oezbek et al, 2010), software evolution (Hanakawa, 2007) and analysis<br />
of developer social networks (Jermakovics et al, 2011).<br />
Three principle applications for visualization were identified in related<br />
320
2. BACKGROUND AND RELATED WORK<br />
work in requirements engineering (Gotel et al, 2007). The first application<br />
is to visualize structure and relationships between requirements, e.g. using<br />
graph-based visualization (Austin et al, 2006). The second application is to<br />
support requirements elicitation by visualizing soft goals (Sen and Jain,<br />
2007) or creating a ’Rich Picture’ of the system to be developed (Checkland,<br />
1981). The third application of requirements visualization is modeling.<br />
Several visual modeling techniques were proposed, e.g. UML diagrams<br />
(UML, 2010), the i* framework (Yu, 1997) and the KAOS framework<br />
(van Lamsweerde and Letier, 2004). Gotel et al (2007) postulated the<br />
need for more techniques to visualize requirements using metaphors to<br />
improve communication. The small number of studies that focus on providing<br />
visual assistance for decision makers in requirements engineering<br />
may suggest that requirements engineering field has yet to realize the benefits<br />
that could be delivered by information visualization techniques (Gotel<br />
et al, 2007).<br />
Regnell et al (2008) proposed a requirements engineering classification<br />
scheme based on the number of requirements and dependencies between<br />
them, claiming that most research papers seek to validate a proposed requirements<br />
engineering method or tool in small and medium scale contexts.<br />
This approach contrasts with work by Berenbach who reports a common<br />
misconception about requirements engineering is the expectation that<br />
processes that work for a small number of requirements will scale (Berenbach<br />
et al, 2009). There is evidence that scalable requirements engineering<br />
tools and methods should be implemented before the company and<br />
the number of requirements begin to grow rapidly (Berenbach et al, 2009;<br />
<strong>Wnuk</strong> et al, 2011) but the body of published work addressing large and<br />
very-large requirements engineering contexts is small.<br />
Among the related work that reports a technique or solution suitable<br />
for large-scale software engineering contexts, Carman et al (1995) proposed<br />
a framework for software reliability while Garg (1989) presented an information<br />
management model for large automotive projects. Among the related<br />
work that reports empirical evidence from large-scale contexts, Konrad<br />
and Gall (2008) reported lessons learned from large-scale requirements<br />
engineering projects - mentioning scope change and creep as one of the<br />
main challenges. Bergman et al (2002) investigated the political nature of<br />
requirements engineering for large systems while Ebert (2004) presented a<br />
technique for pragmatically dealing with non-functional requirements in<br />
large systems. Boehm (2006) identified increasingly rapid change as one of<br />
the future challenges for software engineering processes, Herbsleb (2007)<br />
called for more research to improve management of global development<br />
efforts while Northrop et al (2006) explored challenges of Ultra-Large-Scale<br />
systems. Across this body of related work, little research was reported for<br />
supporting large-scale requirements decision making by using visualization<br />
techniques.<br />
321
PAPER VI: SCOPE TRACKING AND VISUALIZATION FOR VERY<br />
LARGE-SCALE REQUIREMENTS ENGINEERING<br />
3 Case Study Description<br />
Strategy<br />
Product Product2 Product3 ProductN<br />
F1<br />
I1<br />
F3<br />
I3<br />
F4<br />
I4<br />
I7<br />
F7<br />
F2<br />
I2<br />
F6<br />
I6<br />
F<br />
I9<br />
F<br />
I8<br />
Features<br />
…..<br />
Unit of analysis<br />
Requirements<br />
user stories<br />
test cases<br />
Features are<br />
implemented<br />
Figure 6.1: The company’s context.<br />
The case study was conducted at a large company that uses integrated<br />
and incremental development model to deliver embedded software system<br />
product lines (Schmid, 2002) for the global market. The company has recently<br />
transitioned to an agile-inspired methodology inspired by ideas and<br />
principles from eXtreme programming (XP) (Beck and Andres, 2004) and<br />
Scrum (Schwaber and Beedle, 2002). The continuous development model,<br />
with frequent product releases, replaces a phase-based process.<br />
As a part of the process transitions, the company has adopted the following<br />
practices: (1) one continuous scope and release planning flow, (2)<br />
cross-functional development teams, (3) gradual and iterative detailing of<br />
requirements, (4) integrated requirements engineering and (5) user stories.<br />
The company emphasizes user stories (Cohn, 2004) for capturing user intentions<br />
and emphasizes user story acceptance criteria to ensure that user<br />
stories are correctly implemented. Requirement details are now iteratively<br />
322
3. CASE STUDY DESCRIPTION<br />
refined and all requirements related work is delivered by a cross-functional<br />
development team containing developers, business analysts, requirements<br />
engineering and software architects.<br />
The company’s context is depicted in Figure 6.1. The corporate strategy<br />
describes the long term (two to three year) goals and strategies, similar to<br />
the concept of roadmaps described by Regnell and Brinkkember (2005).<br />
The company releases about 50 products on yearly basis with product definitions<br />
derived from the strategies and containing up to 100 new features.<br />
Some products are only small adaptations of previous products while other<br />
products contain significantly more innovation represented by (up to) 100<br />
new features. Features are elaborated as user stories and requirements then<br />
implemented using test-driven development.<br />
M0 M1 M2 DO AE ES EC AI I<br />
NF<br />
D<br />
W<br />
Figure 6.2: An example history of changes for three features. The first feature,<br />
marked with dashed lines was successfully implemented. The second<br />
feature marked with solid arrows was withdrawn. The third feature<br />
marked with dashed-dotted arrows was discarded. The states are marked<br />
as follows: NF - New Feature, DS - Definition Started, DO - Definition Ongoing,<br />
AE - Awaiting Execution, ES - Execution Started, EC - Execution<br />
Completed, W - Withdrawn, D- Discarded. The states marked gray are the<br />
terminal states used in the analysis in Section 6<br />
Feature management is performed using the state-machine shown in<br />
Figure 6.2. Each newly created feature begins in an administrative state<br />
called New feature then enters the process at state M0. M0 validates that this<br />
newly created feature has a sponsor, sufficient business justification and is<br />
in line with the associated product strategy. Upon success, the feature is<br />
promoted to M1. Sets of features in M1 are prioritized, across all product<br />
lines, by scope owners using a one-dimensional prioritization method<br />
based on business value. The prioritized list is later used by the development<br />
teams to guide implementation and integration scheduling. A feature<br />
may be returned to the M0 state if further definition or refinement is<br />
required.<br />
After prioritization, features are promoted to M2. Development resources<br />
are consulted and implementation schedules are defined within<br />
323
PAPER VI: SCOPE TRACKING AND VISUALIZATION FOR VERY<br />
LARGE-SCALE REQUIREMENTS ENGINEERING<br />
a continuous delivery pipeline tool that controls resource and delivery<br />
scheduling. Due to resource constraints, it is unusual for feature priorities<br />
to be modified at this stage due to overbooked development resources<br />
or other reasons that impact the delivery date. Generally, the higher the<br />
feature priority, the faster it should be implemented and delivered.<br />
Features then pass through several development-related states, including:<br />
Definition Started, Definition Ongoing, Awaiting Execution, Execution Started<br />
and Execution Completed. A feature can exit this sequence at any time, transitioning<br />
to one of the following states: Withdrawn, Discarded or Already<br />
Supported.<br />
Records of all state changes, including their timestamp and reason, are<br />
stored in a corporate database. This development history, combined with<br />
feature attributes such as product line or stakeholder, was used as the data<br />
source for the visualizations presented in this paper. In the three examples<br />
depicted in Figure 6.2, we note that two features were sent back to the ’previous’<br />
state. This behavior is not prohibited by the process but it negatively<br />
impacts overall development efficiency. While the visualization depicted<br />
in Figure 6.2 can support the analysis of a small number of features, it<br />
is not suitable for the simultaneous analysis of hundreds or thousands of<br />
features.<br />
4 Research methodology<br />
In this section, we present the research methodology, the research questions,<br />
and the data collection methods used in the study.<br />
4.1 Research questions<br />
Two research questions investigated in this study are outlined in Table 6.1,<br />
complemented by aim. The first research question is focusing on different<br />
aspects related to efficiency and scalability of the visualized techniques.<br />
This question is detailed in four research subquestions. Research questions<br />
RQ1a, RQ1b, RQ1c and RQ1d focus on improvement to the Feature Survival<br />
Chart+ technique introduced in our previous work. Research question<br />
RQ2 investigated visual techniques for decision patterns.<br />
4.2 Research design and methods used<br />
The research reported in this paper has been conducted using an engineering<br />
approach (also called pragmatism stance (Easterbrook et al, 2007))<br />
which focuses mainly on obtaining practical knowledge as a valuable source<br />
of information. We opted for using a flexible research design and derive<br />
theories regarding scope visualization from interviews with practitioners<br />
(Robson, 2002). We selected a case study research strategy since<br />
324
Table 6.1: Research questions.<br />
Research question Aim<br />
RQ1: How useful is FSC+ as decision<br />
support for enabling scope<br />
management in very-large agileinspired<br />
context?<br />
RQ1a: What should be visualized<br />
on the Y-axis of the FSC+?<br />
RQ1b: How visualize the temporal<br />
aspect on the X-axis of the<br />
FSC+?<br />
RQ1c: How the FSC+ should be<br />
sorted?<br />
RQ1d: What should be filtered<br />
when creating the FSC+?<br />
RQ2: How do requirements decision<br />
patterns facilitate require-<br />
ments process analysis?<br />
RQ 2a: How the analysis of decision<br />
patterns can help in understanding<br />
the requirements scop-<br />
ing process?<br />
RQ2b: How can visualization of<br />
decision patterns can be used to<br />
facilitate process improvement?<br />
325<br />
4. RESEARCH METHODOLOGY<br />
To investigate how to visualize<br />
scope changes in very-large agileinspired<br />
context.<br />
To investigate what should be<br />
represented on the Y-axis.<br />
To understand how to visualize<br />
time on the X-axis.<br />
To investigate the most efficient<br />
ways of sorting.<br />
To identify the optimal way of filtering<br />
the information to be visualized<br />
by the FSC.<br />
To investigate possible ways of<br />
visualizing decision patters.<br />
To investigate possible ways to<br />
analyze decision patterns.<br />
To investigate possible ways of<br />
visualizing decision patters.
PAPER VI: SCOPE TRACKING AND VISUALIZATION FOR VERY<br />
LARGE-SCALE REQUIREMENTS ENGINEERING<br />
it is reported as suitable for software engineering research (Runeson and<br />
Höst, 2009) and considered as well suited for requirements engineering research<br />
(Wieringa and Heerkens, 2007). Finally, case studies could be used<br />
to investigate phenomena in their natural contexts (Yin, 2003).<br />
The study was conducted in an action research mode (Robson, 2002).<br />
Action research which focuses on investigating real and relevant problems<br />
and improve studied context. Our goals were not only to understand the<br />
scope process at the case company but also to make improvement proposals<br />
resulting from applying the proposed visualization and analysis techniques<br />
directly on the studied case company. In this way, we can receive<br />
both (1) an improvement of a practice of some kind and (2) and improved<br />
understanding of the studied problem (Wieringa and Heerkens, 2007).<br />
Two methods for collecting empirical data were used in this study. In<br />
the first phase of the study, we used content analysis to analyze the data<br />
related to features scoping at the case company. This technique is well<br />
suited for collecting large volumes of data (Singer et al, 2007). Further,<br />
content analysis is an unobtrusive technique where the act of measuring<br />
doesn’t change the actual values measured (Robson, 2002). Finally, the<br />
information collected during content analysis is in a written form which<br />
allows automatic analysis and tool support.<br />
In the second part of the study, we used interviews to collect empirical<br />
data. Interviews are a straightforward and inquisitive way of collecting<br />
opinions and other information (Singer et al, 2007). Despite its time<br />
consuming nature, interviews allow asking following up questions, interpreting<br />
the tone of the participants’ voice and intonations. Furthermore,<br />
interviews improve the control over the quality of information gathered<br />
during the first part of the study (Singer et al, 2007).<br />
In this study, semi-structured interviews (Robson, 2002) with a high<br />
degree of discussion were conducted. We used a set of predetermined<br />
question, but the order how asking them could be changed upon the interviewer’s<br />
perception of what seems to be the most appropriate. Finally,<br />
interviews allowed us to discuss the results from the content analysis as<br />
well as interpret and validate our findings together with practitioners from<br />
the company.<br />
Planning/Selection. Several brainstorming sessions were held. During<br />
the sessions, researchers discussed and adjusted the goals of the research<br />
with the needs of the practitioners. The requirements scoping process and<br />
the data generated by the process were also discussed during the meetings.<br />
Further, the decisions which data should be extracted and investigated in<br />
this study were made.<br />
When deciding which practitioners to interview, we used a combination<br />
of convenience sampling and variation sampling (Patton, 2002). The<br />
roles of participants were selected with respect to the interview instrument.<br />
One practitioner at the case company acted as a ’gate keeper’ ensuring that<br />
the selected participants are representative and suitable data points in the<br />
326
4. RESEARCH METHODOLOGY<br />
study.<br />
Data collection. Researchers were granted access to a database where<br />
the history of feature scope changes is stored. Several scripts that extract<br />
the history of features were developed and executed. The extracted dataset<br />
contained a detailed history of 8728 features . The extracted data was evaluated<br />
with one practitioner from the case company to ensure its correctness<br />
and usefulness for further analysis.<br />
The history was then analyzed using a tool developed in Java. The initial<br />
analysis included parsing and calculating lead-times between various<br />
scope states. After the history of each feature was read and analyzed the<br />
tool created detailed reports in an Excel format. Finally, the tool visualized<br />
the scope changes with given criteria, depicted in Figures X, Y and Z .<br />
The interview sessions were scheduled for 60 minutes with the possibility<br />
to reduce time or prolong it. The interviews were recorded and analyzed<br />
using content analysis. The results from each interview were send<br />
back to the interviewees for validation.<br />
4.3 Validity evaluation<br />
In this section, threats to validity are discussed according to four perspectives<br />
on validity proposed by Yin (2003).<br />
Construct validity is concerned with establishing appropriate methods<br />
and measured for the studied phenomena or concepts. By using the scope<br />
changes history stored in a database, we minimized the subjectivity of and<br />
analyzed data. Further, the process of data extraction was supervised by<br />
one practitioner from the case company who ensured that all administrative<br />
changes in the scope and other ’unimportant’ data was removed. Finally,<br />
we used interviews as a second source of evidence about the studied<br />
phenomenon in order to increase our understand and the quality of analyzed<br />
data.<br />
Internal validity is concerned with uncontrolled confounding factors<br />
that may affect the studied causal relationships. All inferences reported<br />
in Section 5 based on the analysis of the datasets were discussed with the<br />
interviewees during the interviews. In that way, not only the correctness<br />
of the inferences were confirmed but also alternative explanations for observed<br />
phenomena were explored. Finally, we used pattern matching of<br />
similar behavior of features when developing inferences.<br />
Reliability is concerned with the degree of repeatability of the study.<br />
We have reported the procedures used in the study to avoid biases and enable<br />
seamless replications. The analysis of the features scope changes was<br />
automated and thus complete replicability was ensured. The results from<br />
the interviews were recorded and written down to enable further analysis.<br />
Finally, the interviewees acted as audits towards the results of the scope<br />
changes database analysis.<br />
External validity is concerned with the ability to generalize the study’s<br />
327
PAPER VI: SCOPE TRACKING AND VISUALIZATION FOR VERY<br />
LARGE-SCALE REQUIREMENTS ENGINEERING<br />
findings. We are aware that our results are based on a single case study<br />
with a single unit of analysis. However, the fact that all available features<br />
at the case company (8728) were analyzed in this study greatly increase<br />
external validity of the findings.<br />
5 Feature Survival Charts+<br />
The Feature Survival Chart+ technique is demonstrated in Figure 6.3 and<br />
Figure 6.5, illustrating two significant development efforts at the case company.<br />
The company uses an iterative development model with continuous<br />
creation and execution of features. Therefore, the FSC+ charts are an evolution<br />
of the previously reported visualizations (<strong>Wnuk</strong> et al, 2008, 2009)<br />
with time now represented on the X-axis as a relative value: all features<br />
begin at the origin of the X-axis regardless of their actual start date. Ordering<br />
along the Y-axis is based on the time spent in the process before being<br />
removed from scope. Features that remain in scope for the duration of a<br />
release are at the bottom of the chart; features that are removed early in the<br />
release schedule (e.g. in the Withdrawn or Discarded) states are at the top<br />
of the chart. Features still in scope are in green, completed features are in<br />
blue and withdrawn or discarded features are in red.<br />
This presentation facilitates identification of two behaviors: (1) the corporate<br />
response time for scoping decisions and (2) the behavior of features<br />
that remain in the process for extended periods. The sooner a feature<br />
transitions to blue (analyzed and implemented) or red (removed from<br />
scope), the faster the response time and the less opportunity for wasted<br />
effort (<strong>Wnuk</strong> et al, 2012), particularly in rapidly changing MDRE contexts.<br />
FSC+ charts are generated using a Java implementation that supports<br />
dynamic filters, multiple y-axis presentation sort orders and control of the<br />
meaning and length of the X-axis based on user preferences. The implementation<br />
also supports pan and zoom operations and data introspection<br />
for individual features. Control over the color scheme and temporal representations<br />
(absolute and relative) are also supported.<br />
A magnified view, using the zoom feature, is shown in Figure 6.4. We<br />
see an area of 14 features and their early life in the process. One feature<br />
(feature number 9855) has been in the process for a very short time (a small<br />
green area) and was discarded quite early. To avoid cluttering the view,<br />
the implementation shows the time and state names only for features with<br />
more than 100 hours in process. The displayed information can vary depending<br />
on the magnification level.<br />
Visual inspection of the the main application features stream (Figure<br />
6.3) and the core software components stream (Figure 6.5) shows a green<br />
region with a similar shape in both charts. However, the red area seems<br />
to be larger in Figure 6.3 (application stream). Further analysis revealed<br />
that 831 features from the core components stream and 1351 from the ap-<br />
328
5. FEATURE SURVIVAL CHARTS+<br />
Figure 6.3: FSC+ for the main application features stream of development<br />
at the case company.<br />
329
PAPER VI: SCOPE TRACKING AND VISUALIZATION FOR VERY<br />
LARGE-SCALE REQUIREMENTS ENGINEERING<br />
Figure 6.4: An example of a zoomed in view from Figure 6.3<br />
plication stream were rejected. The average time in process before removal<br />
was 77 days for the core components features and 65 days for application<br />
stream features. This difference is statistically significant (p-value
5. FEATURE SURVIVAL CHARTS+<br />
Figure 6.5: The FSC+ for the core software components stream of development<br />
at the case company.<br />
331
PAPER VI: SCOPE TRACKING AND VISUALIZATION FOR VERY<br />
LARGE-SCALE REQUIREMENTS ENGINEERING<br />
Next, we looked at the time spent in requirements definition, analysis<br />
and decision making for features that were implemented and discarded.<br />
Implemented features spent an average of 21 days in requirements definition<br />
and decision making while withdrawn or discarded features spent<br />
44 days in the same states. This difference is statistically significant (pvalue
5. FEATURE SURVIVAL CHARTS+<br />
who worked with features on a daily basis, did note that filters could be<br />
used instead of zooming.<br />
Tasks that FSC+ could support. Interview respondents identified several<br />
further tasks that FSC+ could potentially support. Communicating<br />
the current scope and scope changes were the most frequently mentioned<br />
tasks. Five respondents mentioned providing an overview of the "scope<br />
history" and the "health of the scope". One respondent suggested that<br />
FSC+ could help visualize congestion and to visualize how various subprocesses<br />
are synchronized. Another interviewee suggested that FSC+ can<br />
show the wasted implementation effort for features that were sent to implementation<br />
and then canceled. Three respondents mentioned that FSC+<br />
can help analyze features that are "stuck in the process": FSC+ are much<br />
better than the current database filters since they also visualize how long<br />
the features remained in the process without a final decision. Nine out of<br />
ten respondents pointed out that the ability to compare FSC+ that were<br />
generated for differing criteria is very useful for improved process understanding<br />
and can provide valuable feedback for process improvement activities.<br />
5.2 X-axis and Y-axis representations: RQ1a, RQ1b<br />
The majority of interview respondents suggested that the Y-axis should<br />
represent development effort and the greater the effort required for a certain<br />
feature the thicker the line. As a result, the green color areas will more<br />
accurately represent the effort spent on both implemented and withdrawn<br />
features. At the same time, the green areas for implemented features will<br />
represent the total effort spent on them. Two respondents suggested that<br />
priority should be on the Y-axis. On the other hand, three respondents said<br />
that priority is changing frequently and therefore it would be less useful<br />
than effort. Finally, one respondent pointed out that the current ’one-size<br />
for all features’ representation is sufficient since it gives a good overview<br />
about the number of features.<br />
Regarding the X-axis, four respondents suggested analyzing one year<br />
in the past. One respondent suggested that the unit on the X-axis should be<br />
one week. On the other hard, two respondents working with process management<br />
and improvement wanted to see the entire time on the X-axis.<br />
One respondent suggested starting the FSC+ chart from the M2 state since<br />
then features are discussed with development effort. Another respondent<br />
wanted FSC+s to start from the definition ongoing state since that is the moment<br />
were the implementation effort and waste can be calculated. The<br />
current FSC+ implementation allows starting the chart from any point on<br />
the X-axis.<br />
333
PAPER VI: SCOPE TRACKING AND VISUALIZATION FOR VERY<br />
LARGE-SCALE REQUIREMENTS ENGINEERING<br />
5.3 Sorting and filtering FSC+s: RQ1c and RQ1d<br />
Four respondents suggested that the FSC+ should be filtered per products.<br />
At the same time, 5 respondents suggested that looking at the entire<br />
stream of development is interesting from the management and overview<br />
perspective. One respondent wanted to filter out only legacy features, so<br />
features that have already been noticed in the system for earlier activities.<br />
Five respondents suggested filtering out: (1) executed features, (2) withdrawn<br />
features and (3) features in the process. Among them, three respondents<br />
wanted to filter out features that were stuck in the process for a long<br />
time. Finally, one respondent suggested filtering per stakeholders that issued<br />
features.<br />
Two respondents suggested sorting per lead-time in a specific state.<br />
One respondent focused on sorting by the lead-time in M2 state, one focused<br />
on the M1 state. Sorting per M2 leadtime gives an overview of how<br />
log it took to make an agreement with the development. Sorting per M1<br />
state gives an overview of how long the prioritization phase took. Further,<br />
three respondents stressed that the current way of sorting (see Figure 6.3<br />
and Figure 6.5) is sufficient and gives a good overview of the agility of the<br />
analysis and decision processes. Finally, two respondents suggested sorting<br />
by priority and placing the most important features at the top of FSC+.<br />
This view allows comparing the lead-time for the most important features<br />
(placed at the top) with the least important (pleaced at the bottom).<br />
The three respondents that wanted to filter out features that are stuck<br />
in the process suggested sorting per total time in the process, including<br />
requirements analysis and software definition states. One respondent suggested<br />
sorting per time in definition ongoing state while other respondent<br />
suggested sorting per time in execution started. All mentioned ways of sorting<br />
are possible within the current implementation.<br />
6 Feature decision patterns analysis and visualization:<br />
RQ2<br />
Decision patterns are state changes that features undergone. 2248 decision<br />
patterns were identified in the dataset. The decision patterns were<br />
analyzed in collaboration with industry participants from the case company.<br />
Table 6.2 depicts the top twenty decision patterns. The patterns were<br />
sorted according to their frequency in the dataset. The top 10 patterns have<br />
over 100 features. The patterns were categorized into unsuccessful, successful<br />
and in process. Successful decision patterns represent features that were<br />
implemented, unsuccessful represent features that were withdrawn or discarded<br />
and in process represent features still in the process.<br />
There seems to be no dominant pattern in the dataset as the most frequent<br />
pattern was followed by only 294 features out of 8728. The the two<br />
334
6. FEATURE DECISION PATTERNS ANALYSIS AND VISUALIZATION: RQ2<br />
Table 6.2: Feature decision patterns.<br />
Frequency Type Decision pattern<br />
294 Unsuccessful M0 –> D –> M0 –> D –> M1<br />
244 Unsuccessful M0 –> M2 –> M0 –> D<br />
231 Successful M0 –> M1 –> M2 –> DO –> AE –> ES –> EC<br />
201 In process M0 –> M1 – M0 –> NF<br />
194 In process M0 –> M1 –> M2<br />
151 Unsuccessful M0 –> W –> M0 –> W<br />
132 In process M0 –> M1 –> M2 –> DO<br />
109 In process M0 –> M2<br />
103 In process M0 –> M1 –> M2 –> DO –> AE –> ES<br />
102 Successful M0 –> M2 –> AE –> EC –> M0 –> EC –> M0<br />
–> EC<br />
98 In process M0 –> M1 –> M0<br />
93 Successful M0 –> EC –> M1 –> EC –> M0 –> EC –> M0<br />
–> EC –> M0 –> EC<br />
88 Unsuccessful M0 –> D –> M1 –> D<br />
80 Unsuccessful M0 –> M2 –> D –> W –> D –> W<br />
79 Successful M0 –> M1 –> M2 –> EC<br />
75 In process M0 –> M1<br />
73 Successful M0 –> M2 –> EC –> M0 –> EC –> M0 –> EC<br />
72 In process M0<br />
66 In process M0 –> NF<br />
64 Unsuccessful M0 –> M1 –> W<br />
335
PAPER VI: SCOPE TRACKING AND VISUALIZATION FOR VERY<br />
LARGE-SCALE REQUIREMENTS ENGINEERING<br />
most frequent patterns turned out to be unsuccessful patterns. Further,<br />
two most frequent patterns have 4 or 5 state changes. In both patterns, features<br />
were send back in the process to the initial state called M0. The third<br />
most frequent decision pattern was a successful pattern. In this decision<br />
pattern features went straight through the state machine, according to the<br />
official process description, and were not send back in the process.<br />
Nine out of 20 most frequent decision patterns are ongoing patterns.<br />
As these features have not yet reached their final states, we could assume<br />
that their final decision patterns will change. Five patterns are successful<br />
patterns and six patterns are unsuccesful patterns. Looking further at the<br />
frequency of the patterns, there seems to be no clear dominance of one<br />
type of decision pattern over another. Therefore, we further analyzed the<br />
identified decision pattern to identify decision archetypes.<br />
6.1 Decision archetypes: RQ2a<br />
Decision archetypes are the feature decision characteristics based on the<br />
analyzed decision patterns. The archetypes combine time characteristics<br />
and decision patterns of features. We have identified five decision archetypes<br />
based on our dataset:<br />
• Fast execution - is the most desirable feature archetype from the process<br />
efficiency perspective. Fast executions are features that were<br />
quickly analyzed and executed with none or not many backwards<br />
transitions. The third most frequent decision pattern (with 231 features)<br />
is an example of not sending features back in the process. Only<br />
190 features out of 8728 went through the process in less than 3 month<br />
and with one or none decision cycles. 437 features were implemented<br />
in not more than 3 months and with up to 3 decision cycles.<br />
• Fast rejection - is the second most desirable feature archtype from the<br />
requirements and product definition efficiency perspective. We define<br />
a fast rejected feature as a feature that was rejected in less than<br />
one month from its inception and with not more than one decision<br />
cycle. Only 135 features were categorized as fast rejection based on<br />
the above criteria. Increasing the time to reject to 3 months (more<br />
than the average leadtime for all withdrawn features) gave 249 fast<br />
rejections. Therefore, it appears that the number of decision cycles is<br />
influencing the behavior more than the leadtime. Allowing up to 3<br />
decision cycles and 3 months lead-time gave 1104 fast rejection features.<br />
• Slow execution - is still successful but less desirable feature archetype<br />
from the process efficiency perspective. Slow executions are features<br />
that were executed in more than 3 months. 2176 features were categorized<br />
to this archetype. Further, for 188 features there were four or<br />
336
6. FEATURE DECISION PATTERNS ANALYSIS AND VISUALIZATION: RQ2<br />
more decision cycles (passes through the same state in the state machine)<br />
before these features reached implementation.<br />
• Slow rejection - is the decision archetype where a feature stays in the<br />
process for quite some time, circulates over the state machne and is finally<br />
rejected. 2293 feature took more than 3 months to reject or withdrawn.<br />
Further, 617 features cycled three or more times throughout<br />
the state machine before being withdrawn or executed.<br />
• Evolving - is a feature that was sent back in the process process. 5863<br />
features (67%) were categorized as evolving, 1950 features (22%) were<br />
not evolving and for 915 features it was not yet sure if they will be<br />
evolving or not.<br />
6.2 Interview results regarding decision patterns analysis:<br />
RQ2<br />
All respondents considered analyzing decision patterns as useful. Five<br />
respondents suggested that analyzing decision patterns helps to see how<br />
many back and forth transitions were made. Three respondents suggested<br />
that the decision patterns analysis could help in understanding to what<br />
degree the process was followed. In particular, one respondent suggested<br />
that decision patterns analysis could help to understand how the process<br />
was implemented by different organizations of the company.<br />
All interview respondents were negatively surprised about the number<br />
of decision patterns identified. One respondent suggested that the high<br />
number is a result of using the process to discuss features by changing the<br />
states back and forth rather than making a state change after these discussions.<br />
Three respondents pointed out that the high number of patterns is<br />
related with a lot of administrative changes in the features databse. Further<br />
it may be a result of pure process knowledge among some practitioners<br />
and thus incorrect usage of the tool in relation to the process description.<br />
Finally, one respondent mentioned that "this analysis is very interesting<br />
and should be presented to the top management".<br />
6.3 Visualizing decision patterns: RQ2b<br />
Figures 6.6 and 6.7 depict atomic decisions visualized using a flowgraph.<br />
The arrows in the graph represent atomic transitions. The length of the<br />
arrows does not have any meaning. The width of the arrows represent the<br />
frequency of a certain transition in the entire dataset. The transitions are<br />
divided into forward transitions (Figure 6.6) and backward transitions (Figure<br />
6.7). Forward transitions are transitions that lead to implementation while<br />
backwards transitions are the opposite transitions. Transitions from the<br />
two terminal states (withdrawn and discarded) and from execution completed<br />
are also considered as backwards transitions.<br />
337
PAPER VI: SCOPE TRACKING AND VISUALIZATION FOR VERY<br />
LARGE-SCALE REQUIREMENTS ENGINEERING<br />
The most frequent transition among all analyzed transition is the transition<br />
between M0 and M1 states. The second most frequent transition is<br />
between M1 and M2. Interesthignly, the fourth most frequent transition<br />
in the dataset is the transition between M0 state and execution completed.<br />
This transition, visualized at the top of Figure 6.6 is a way of "bypassing"<br />
the entire process and sending the features from the start to the end. Administrative<br />
changes in the tool are one of the reasons for this transitions<br />
together with the fact that several features cycled in the process back and<br />
forth.<br />
Results from interviews. Four of the interview respondents considered<br />
the visualizations (Figures 6.6 and 6.7) as partly useful and the remaining<br />
respondents very useful. The reason why some respondent considered the<br />
visualization partly useful was because they would prefer the visualizations<br />
of the streams done separately since every organization implemented<br />
some additions to the process. However, all these four respondents agreed<br />
that the visualization of the entire dataset shows general process adherence<br />
at the case company.<br />
Respondents working with process improvement and management, including<br />
high-level management considered visualizations as very useful.<br />
The most interesting transitions to analyze turned out to be transitions M0<br />
–> Execution completed. One manager mentioned that these kind of transitions<br />
are not possible according to the official process description and<br />
thus it is very valuable to investigate the reasons for this way of using the<br />
process. Another respondent suggested that the transition M0 –> Execution<br />
completed was used to clean up features that were in the process for<br />
a long time (execution completed state was used instead of withdrawn or<br />
discarded). Another respondent explained that the high number of these<br />
transition s is caused by the fact that one feature was reused in several<br />
product and thus resubmitted to the processes several times. One respondent<br />
suggested that visualization (Figure 6.6 and Figure 6.7) clearly shows<br />
that the process was used as a way to communicate and resolve questions<br />
regarding features instead of email of live negotiations.<br />
Three respondents mentioned that Figures 6.6 and 6.7 clearly show that<br />
some people did not use the tool and the process in the right way. Finally,<br />
one respondent pointed out that the visualizations show that the democratic<br />
model was insufficient at the company and suggested that a dictatorship<br />
model would have been much better in this case. His conclusion<br />
in especially interesting in relation to the Ultra Large-Scale Systems literature<br />
(Northrop et al, 2006) suggesting that for ultra-large systems overall<br />
control is not possible and thus these systems need to exist as separately<br />
managed system. In our case, it seems to be that around 10 000 features is<br />
not yet large enough for efficient decentralized management.<br />
338
6. FEATURE DECISION PATTERNS ANALYSIS AND VISUALIZATION: RQ2<br />
2421<br />
170<br />
736<br />
268<br />
232<br />
134<br />
292<br />
316<br />
92<br />
840<br />
404<br />
814<br />
303<br />
428<br />
2364<br />
4463 3472<br />
1462 1210 1700<br />
5526<br />
339<br />
M0 M1 M2<br />
DO AE<br />
ES EC<br />
1590 625 114 484 27 370<br />
63 10<br />
9<br />
4 103<br />
36<br />
526<br />
2326<br />
178<br />
W<br />
D<br />
DDNF<br />
Figure 6.6: Forward transitions visualized.
PAPER VI: SCOPE TRACKING AND VISUALIZATION FOR VERY<br />
LARGE-SCALE REQUIREMENTS ENGINEERING<br />
Figure 6.7: Backward transitions visualized.<br />
DNF<br />
D<br />
W<br />
347<br />
5<br />
585<br />
60<br />
2385<br />
1626<br />
30 48<br />
M0 M1 M2<br />
DO AE<br />
ES EC<br />
?<br />
213<br />
1<br />
776<br />
8 96<br />
41<br />
2<br />
8<br />
8<br />
454<br />
8<br />
872<br />
498<br />
340<br />
842<br />
531<br />
25<br />
87<br />
2<br />
663<br />
37<br />
161<br />
24<br />
88<br />
267<br />
31<br />
548<br />
138<br />
2298
7 Conclusions<br />
7. CONCLUSIONS<br />
Effective scope management plays an important role in successful project<br />
management (Iacovou and Dexter, 2004; Bjarnason et al, 2012). Issues with<br />
managing the scope may have negative consequences upon software projects<br />
(Bjarnason et al, 2012). Development process information for 8728 features<br />
was analyzed to investigate topics of interest such as process efficacy, efficiency<br />
and adherence. Management decision patterns were extracted from<br />
the production dataset and five archetypical decision patterns in use at the<br />
case company were identified: fast execution, slow execution, fast rejection,<br />
slow rejection and evolving. The detailed analysis of process patterns<br />
identified unexpected behaviors at the case company, triggering further<br />
internal investigations.<br />
Given the quantity of data available in this very-large scale requirements<br />
engineering context, new visualization techniques were required to<br />
effectively capture meaning and information from the data set. The FSC+<br />
technique was developed to visualize scope changes across the large number<br />
of features and then reviewed by 10 industry practitioners. FSC+s provided<br />
useful overviews of the scope history and the "health" of the development<br />
efforts currently in scope. In general, FSC+ was positively received<br />
but the practitioners indicated that considerable flexibility was necessary<br />
to meet the widely varying needs of the stakeholders, particularly in the<br />
area of filtering the datasets. The FSC+ charts are generated using a Java<br />
implementation that supports dynamic filters, multiple y-axis presentation<br />
sort orders and control of the meaning and length of the X-axis based on<br />
user preferences. The implementation also supports pan and zoom operations<br />
and data introspection for individual features.<br />
Atomic decision patterns throughout the dataset were summarized using<br />
flow graphs with visually weighted edges representing frequency of<br />
occurrence within the dataset. The industry practitioners found that this<br />
visualization allowed them to quickly identify unexpected behavior in the<br />
development process.<br />
The reviewing practitioners found utility in all aspects of the present<br />
work with senior management finding the work slightly more useful than<br />
those charged with day to day execution. The new visualization techniques<br />
greatly facilitate comprehension of process operations compared to direct<br />
inspection of the raw data and practitioners felt that they could be used to<br />
guide management decisions such as process optimization.<br />
Future work focuses on further improvements to the FSC+ technique<br />
and further improvements to the performance of the visualization tool.<br />
Further empirical studies to confirm or deny the industrial applicability<br />
of the technique are planned. Finally, further investigations of feature decision<br />
archetypes will attempt to determine whether the identified archetypes<br />
are general, rather than specific to the case company, and whether there<br />
may be any omissions from the set of archetypes.<br />
341
PAPER VI: SCOPE TRACKING AND VISUALIZATION FOR VERY<br />
LARGE-SCALE REQUIREMENTS ENGINEERING<br />
Acknowledgment<br />
This work was supported by VINNOVA within the UPITER2 project. We<br />
would like to thank all anonymous interviewees and workshop respondents<br />
for their invaluable contribution to this project.<br />
342
Appendix A: Interview questions<br />
Usefulness of visualizing the scope and FSC+:<br />
7. CONCLUSIONS<br />
1. How useful is according to You the FSC+ technique for scope visualization?<br />
2. Which tasks can FSC+ support?<br />
3. How often would you use scope visualization in your daily work?<br />
Show a FSC for their context and discuss the possible extensions<br />
in Y -axis<br />
4. What do you think about the moving map solution?<br />
5. What do you think about the zooming in solution?<br />
6. How would you like to be represented in the Y-axis? (priority, criticality,<br />
size, impact etc.)<br />
Filtering and sorting<br />
7. What type of information should be filtered by FSC+?<br />
8. How would you like the chart to be sorted?<br />
9. What is the most optimal time-spam to visualize?<br />
Decision patterns<br />
10. Do you think that analyzing decision patterns would be useful for your<br />
work?<br />
11. Do you think that visualizing decision patterns would be beneficial<br />
in your work?<br />
Analyzing decision pattern<br />
12. How would you interpret the number of unique patterns in the dataset?<br />
13. How would you interpret the number of cycles in the patterns?<br />
14. Why do so many paths terminate at illogical states?<br />
343
PAPER VI: SCOPE TRACKING AND VISUALIZATION FOR VERY<br />
LARGE-SCALE REQUIREMENTS ENGINEERING<br />
344
Bibliography<br />
REFERENCES<br />
Alenljung B, Persson A (2008) Portraying the practice of decision-making<br />
in requirements engineering: a case of large scale bespoke development.<br />
Requirements Engineering 13(4):257–279<br />
Aurum A, Wohlin C (2003) The fundamental nature of requirements engineering<br />
activities as a decision-making process. Information and Software<br />
Technology 45(14):945–954<br />
Austin M, Mayank V, Shmunis N (2006) Paladinrm: Graph-based visualization<br />
of requirements organized for team-based design. Syst Eng<br />
9(2):129–145<br />
Avison D, Fitzgerald G (1998) Information systems development methodologies<br />
techniques, and tools. John Wiley<br />
Ball T, Eick S (1996) Software visualization in the large. Computer 29(4):33<br />
–43<br />
Basili V, Rombach H (1988) The tame project: towards improvementoriented<br />
software environments. IEEE Transactions on Software Engineering<br />
14(6):758 –773<br />
Beck K, Andres C (2004) Extreme Programming Explained: Embrace<br />
Change (2nd Edition). Addison-Wesley Professional<br />
Berenbach B, Paulish D, Kazmeier J, Rudorfer A (2009) Software & Systems<br />
Requirements Engineering: In Practice. Pearson Education Inc.<br />
Bergman M, King J, Lyytinen K (2002) Large scale requirements analysis<br />
as heterogeneous engineering. Scandinavian Journal of Information Systems<br />
14(4):37–55<br />
Bjarnason E, <strong>Wnuk</strong> K, Regnell B (2012) Are you biting off more than<br />
you can chew? a case study on causes and effects of overscoping in<br />
large-scale software engineering. Information and Software Technology<br />
54(10):1107 – 1124<br />
Boehm B (2006) Some future trends and implications for systems and software<br />
engineering processes. Systems Engineering 9(1):1–19<br />
Carlshamre P (2002) Release planning in market-driven software product<br />
development: Provoking an understanding. Requirements Engineering<br />
7:139–151<br />
Carlshamre P, Sandahl K, Lindvall M, Regnell B, Natt och Dag J (2001) An<br />
industrial survey of requirements interdependencies in software product<br />
release planning. In: Proceedings of the Fifth IEEE International<br />
Symposium on Requirements Engineering (RE 2001), pp 84–91<br />
345
REFERENCES<br />
Carman D, Dolinsky A, Lyu M, Yu J (1995) Software reliability engineering<br />
study of a large-scale telecommunications software system. In: Proceedings<br />
of the Sixth International Symposium on Software Reliability<br />
Engineering, pp 350 –359<br />
Carter RA, Antón A, Dagnino A, Williams L (2001) Evolving beyond requirements<br />
creep: A risk-based evolutionary prototyping model. In:<br />
Proceedings of the 5th IEEE International Symposium on Requirements<br />
Engineering (RE’01, pp 94–101<br />
Checkland P (1981) Systems Thinking, Systems Practice. John Wiley and<br />
Sons Ltd.,<br />
Cohn M (2004) User Stories Applied: For Agile Software Development.<br />
The Addison-Wesley Signature Series, Addison-Wesley<br />
D’Ambros M, Lanza M, Pinzger M (2007) "a bug’s life" visualizing a bug<br />
database. In: Proceedings of the 4th IEEE International Workshop on<br />
Visualizing Software for Understanding and Analysis, VISSOFT 2007,<br />
pp 113 –120<br />
DeGregorio G (1999) Visual tool support for configuring and understanding<br />
software product lines. In: Proceedings of the 9th International Symposium<br />
of the International Council on System Engineering, pp 1–7<br />
DeMarco T, Lister T (2003) Risk management during requirements. Software,<br />
IEEE 20(5):99 – 101<br />
Denne M, Cleland-Huang J (2004) The incremental funding method: Datadriven<br />
software development. IEEE Software 21:39–47<br />
Easterbrook S, Singer J, Storey M, Damian D (2007) Guide to Advanced<br />
Empirical Software Engineering, Springer, chap Selecting Empirical<br />
Methods for Software Engineering Research, pp 285–311<br />
Ebert C (2004) Dealing with nonfunctional requirements in large software<br />
systems. Annals of Software Engineering 3(1):367–395<br />
Fogelström N, Barney S, Aurum A, Hederstierna A (2009) When product<br />
managers gamble with requirements: Attitudes to value and risk. In:<br />
Proceedings of the 15th International Working Conference on Requirements<br />
Engineering: Foundation for Software Quality, Springer-Verlag,<br />
Berlin, Heidelberg, REFSQ ’09, pp 1–15<br />
Garg P (1989) On supporting large-scale decentralized software engineering<br />
processes. In: Proceedings of the 28th IEEE Conference on Decision<br />
and Control, pp 1314 –1317 vol.2<br />
Gorschek T, Wohlin C (2006) Requirements abstraction model. Requirements<br />
Engineering Journal 11:79–101<br />
346
REFERENCES<br />
Gotel O, Marchese F, Morris S (2007) On requirements visualization. In:<br />
Proceedings of the Second International Workshop on Requirements Engineering<br />
Visualization, IEEE Computer Society, Washington, DC, USA,<br />
REV ’07, pp 11–20<br />
Greer D, Ruhe G (2004) Software release planning: an evolutionary and<br />
iterative approach. Information and Software Technology 46(4):243 – 253<br />
Hall T, Beecham S, Rainer A (2002) Requirements problems in twelve software<br />
companies: an empirical analysis. IEEE Software 149(5):153 – 160<br />
Hanakawa N (2007) Visualization for software evolution based on logical<br />
coupling and module coupling. In: Proceedings of the Asia-Pacific Software<br />
Engineering Conference, APSEC 2007. 14th Asia-Pacific, pp 214 –<br />
221<br />
Herbsleb J (2007) Global software engineering: The future of sociotechnical<br />
coordination. Future of Software Engineering 1(1):188–198<br />
Höst M, BRegnell, JNatt och Dag, Nedstam J, CNyberg (2001) Exploring<br />
bottlenecks in market-driven requirements management. Journal of Systems<br />
and Software 59(3):323–332<br />
Iacovou C, Dexter A (2004) Turning around runaway information technology<br />
projects. Engineering Management Review, IEEE 32(4):97 –112<br />
Institute PM (2000) A Guide to the Project Management Body of Knowledge<br />
(PMBOK Guide), 2000, Project Management Institute, Four Campus<br />
Boulevard, Newtown Square, PA 19073-3299, USA, chap Chapter 5:<br />
Project Scope Management, pp 47–59<br />
Jantunen S, Lehtola L, Gause D, Dumdum U, Barnes R (2011) The challenge<br />
of release planning. In: Proceedings of the Fifth International Workshop<br />
on Software Product Management (IWSPM’2011), pp 36 –45<br />
Jermakovics A, Sillitti A, Succi G (2011) Mining and visualizing developer<br />
networks from version control systems. In: Proceedings of the 4th International<br />
Workshop on Cooperative and Human Aspects of Software<br />
Engineering, ACM, New York, NY, USA, CHASE ’11, pp 24–31<br />
Karlsson J, Ryan K (1997) A cost-value approach for prioritizing requirements.<br />
IEEE Software 14(5):67–74<br />
Karlsson L, Dahlstedt s, Natt Och Dag J, Regnell B, Persson A (2002) Challenges<br />
in market-driven requirements engineering - an industrial interview<br />
study. In: Proceedings of the Eighth International Workshop on Requirements<br />
Engineering: Foundation for Software Quality (REFSQ 2002)<br />
347
REFERENCES<br />
Kishi T, Noda N, Katayama T (2002) A method for product line scoping<br />
based on a decision-making framework. In: Chastek G (ed) Software<br />
Product Lines, Lecture Notes in Computer Science, vol 2379, Springer<br />
Berlin / Heidelberg, pp 53–65, 10.1007/3-540-45652-X22<br />
Klein G, Orasanu J, Calderwood R, Zsambok C (1995) Decision making in<br />
action: Models and methods. New Jersey Norwood<br />
Konrad S, Gall M (2008) Requirements engineering in the development of<br />
large-scale systems. In: Proceedings of the 16th International Requirements<br />
Engineering Conference (RE 2008), pp 217–222<br />
Kulk G, Verhoef C (2008) Quantifying requirements volatility effects. Sci<br />
Comput Program 72(3):136–175<br />
van Lamsweerde A, Letier E (2004) From object orientation to goal orientation:<br />
A paradigm shift for requirements engineering. In: Wirsing M,<br />
Knapp A, Balsamo S (eds) Radical Innovations of Software and Systems<br />
Engineering in the Future, Lecture Notes in Computer Science, vol 2941,<br />
Springer Berlin / Heidelberg, pp 153–166<br />
Legodi I, Barry M (2010) The current challenges and status of risk management<br />
in enterprise data warehouse projects in south africa. In: Proceedings<br />
of the 2010 Proceedings of PICMET ’10: Technology Management<br />
for Global Economic Growth, pp 1 –5<br />
Lehtola L, Kauppinen M (2006) Suitability of requirements prioritization<br />
methods for market-driven software product development. Software<br />
Process: Improvement and Practice 11(1):7–19<br />
Leon D, Podgurski A, White L (2000) Multivariate visualization in<br />
observation-based testing. In: Proceedings of the 22nd International<br />
Conference on Software Engineering, ACM, New York, NY, USA, ICSE<br />
’00, pp 116–125<br />
Livieri S, Higo Y, Matushita M, Inoue K (2007) Very-large scale code clone<br />
analysis and visualization of open source programs using distributed<br />
ccfinder: D-ccfinder. In: Proceedings of the 29th international conference<br />
on Software Engineering, IEEE Computer Society, Washington, DC,<br />
USA, ICSE ’07, pp 106–115<br />
Lubars M, Potts C, Richter C (1993) A review of the state of the practice in<br />
requirements modeling. In: Proceedings of the IEEE International Symposium<br />
on Requirements Engineering (RE’93), pp 2 –14<br />
Moody D (2009) The physics of notations: Toward a scientific basis for<br />
constructing visual notations in software engineering. IEEE Transactions<br />
on Software Engineering 35:756–779<br />
348
REFERENCES<br />
Ngo-The A, Ruhe G (2005) Engineering and Managing Software Requirements,<br />
Springer, chap Decision Support in Requirements Engineering,<br />
pp 267–286<br />
Northrop L, Felier P, Habriel R, Boodenough J, Linger R, Klein M, Schmidt<br />
D, Sullivan K, Wallnau K (2006) Ultra-Large-Scale Systems: The Software<br />
Challenge of the Future. Software Engineering Institute<br />
Oezbek C, Prechelt L, Thiel F (2010) The onion has cancer: some social<br />
network analysis visualizations of open source project communication.<br />
In: Proceedings of the 3rd International Workshop on Emerging Trends<br />
in Free/Libre/Open Source Software Research and Development, ACM,<br />
New York, NY, USA, FLOSS ’10, pp 5–10<br />
Patton M (2002) Qualitative Research & Evaluation Methods. Sage Publication<br />
Ltd<br />
Potts C (1995) Invented requirements and imagined customers: requirements<br />
engineering for off-the-shelf software. In: Proceedings of the Second<br />
IEEE International Symposium on Requirements Engineering (RE<br />
95), pp 128–130<br />
Regnell B, Brinkkemper S (2005) Engineering and Managing Software Requirements,<br />
Springer, chap Market–Driven Requirements Engineering<br />
for Software Products, pp 287–308<br />
Regnell B, Kuchcinski K (2011) Exploring software product management<br />
decision problems with constraint solving - opportunities for prioritization<br />
and release planning. In: Proceedings of the Fifth International<br />
Workshop on Software Product Management (IWSPM’2011), pp 47 –56<br />
Regnell B, Beremark P, Eklundh O (1998) A market-driven requirements<br />
engineering process: Results from an industrial process improvement<br />
programme. Requirements Engineering 3:121–129<br />
Regnell B, Berntsson Svensson R, <strong>Wnuk</strong> K (2008) Can we beat the complexity<br />
of very large-scale requirements engineering? In: Lecture Notes<br />
in Computer Science, vol 5025, pp 123-128<br />
Robson C (2002) Real World Research. Blackwell Publishing<br />
Ruhe G (2009) Product Release Planning: Methods, Tools and Applications.<br />
Auerbach Publications<br />
Ruhe G, Ngo A (2004) Hybrid intelligence in software release planning. Int<br />
J Hybrid Intell Syst 1(1-2):99–110<br />
Ruhe G, Saliu M (2005) The Art and Science of Software Release Planning.<br />
IEEE Software 22(6):47–53<br />
349
REFERENCES<br />
Runeson P, Höst M (2009) Guidelines for conducting and reporting case<br />
study research in software engineering. Empirical Software Engineering<br />
Journal 14(2):131–164<br />
Savolainen J, Kauppinen M, Mannisto T (2007) Identifying key requirements<br />
for a new product line. In: Proceedings of the 14th Asia-Pacific<br />
Software Engineering Conference, IEEE Computer Society, Washington,<br />
DC, USA, APSEC ’07, pp 478–485<br />
Schmid K (2002) A comprehensive product line scoping approach and its<br />
validation. In: Proceedings of the 24th International Conference on Software<br />
Engineering (ICSE 2002), pp 593–603<br />
Schwaber K, Beedle M (2002) Agile software development with scrum. Series<br />
in agile software development, Prentice Hall<br />
Sen A, Jain S (2007) A visualization technique for agent based goal refinement<br />
to elicit soft goals in goal oriented requirements engineering. In:<br />
Proceedings of the Second International Workshop on Requirements Engineering<br />
Visualization (REV 2007), pp 2–11<br />
Strigini L (1996) limiting the dangers of intuitive decision making. Software,<br />
IEEE 13(1):101 –103<br />
Svahnberg M, Gorschek T, Feldt R, Torkar R, Saleem S, Shafique M (2010) A<br />
systematic review on strategic release planning models. Inf Softw Technol<br />
52(3):237–248<br />
Tufte E (1990) Envisioning Information. Graphics Press LLC<br />
UML (2010) The unified modeling language webpage. <br />
<br />
van Den Akker J, Brinkkemper S, Diepen G, Versendaal J (2005) Determination<br />
of the next release of a software product: an approach using integer<br />
linear programming. In: Proceeding of the 11th International Workshop<br />
on Requirements Engineering: Foundation for Software Quality<br />
REFSQ’05, pp 247–262<br />
van den Akker M, Brinkkemper S, Diepen G, Versendaal J (2008) Software<br />
product release planning through optimization and what-if analysis. Inf<br />
Softw Technol 50(1-2):101–111<br />
van der Hoek A, Hall R, Heimbigner D, Wolf A (1997) Software release<br />
management. In: In Proceedings of the Sixth European Software Engineering<br />
Conference, Springer, pp 159–175<br />
Wieringa R, Heerkens H (2007) Designing requirements engineering research.<br />
In: Proceedings of the 5th International Workshop on Comparative<br />
Evaluation in Requirements Engineering, pp 36–48<br />
350
REFERENCES<br />
<strong>Wnuk</strong> K, Regnell B, Karlsson L (2008) Visualization of feature survival in<br />
platform-based embedded systems development for improved understanding<br />
of scope dynamics. In: Proceedings of the Third International<br />
Workshop on Requirements Engineering Visualization (REV 2008), pp<br />
41–50<br />
<strong>Wnuk</strong> K, Regnell B, Karlsson L (2009) What happened to our features?<br />
visualization and understanding of scope change dynamics in a largescale<br />
industrial setting. In: Proceedings of the 17th IEEE International<br />
Requirements Engineering Conference (RE 2009), pp 89–98<br />
<strong>Wnuk</strong> K, Regnell B, Berenbach B (2011) Scaling up requirements engineering:<br />
Exploring the challenges of increasing size and complexity<br />
in market-driven software development. In: Berry D, Franch X (eds)<br />
Requirements Engineering: Foundation for Software Quality, Lecture<br />
Notes in Computer Science, vol 6606, Springer Berlin / Heidelberg, pp<br />
54–59<br />
<strong>Wnuk</strong> K, Callele D, Karlsson EA, Regnell B (2012) Controlling lost opportunity<br />
costs in agile development: The basic lost opportunity estimation<br />
model for requirements scoping. In: Cusumano M, Iyer B, Venkatraman<br />
N (eds) Software Business, Lecture Notes in Business Information Processing,<br />
vol 114, Springer Berlin Heidelberg, pp 255–260<br />
Yin R (2003) Case Study Research: Design and Methods. Sage Publications<br />
Yu E (1997) Towards modelling and reasoning support for early-phase requirements<br />
engineering. In: Proceedings of the Third IEEE International<br />
Symposium on Requirements Engineering (RE’97), pp 226 –235<br />
351