Regulation of Fuels and Fuel Additives: Renewable Fuel Standard ...
Regulation of Fuels and Fuel Additives: Renewable Fuel Standard ...
Regulation of Fuels and Fuel Additives: Renewable Fuel Standard ...

You also want an ePaper? Increase the reach of your titles
YUMPU automatically turns print PDFs into web optimized ePapers that Google loves.
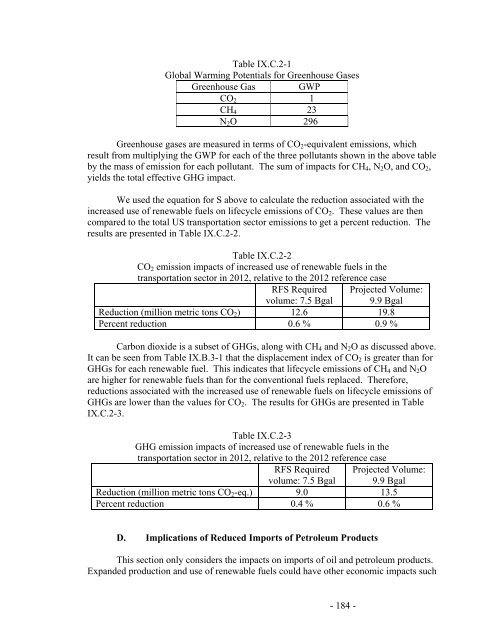
Table IX.C.2-1<br />
Global Warming Potentials for Greenhouse Gases<br />
Greenhouse Gas GWP<br />
CO2 1<br />
CH4 23<br />
N2O 296<br />
Greenhouse gases are measured in terms <strong>of</strong> CO2-equivalent emissions, which<br />
result from multiplying the GWP for each <strong>of</strong> the three pollutants shown in the above table<br />
by the mass <strong>of</strong> emission for each pollutant. The sum <strong>of</strong> impacts for CH4, N2O, <strong>and</strong> CO2,<br />
yields the total effective GHG impact.<br />
We used the equation for S above to calculate the reduction associated with the<br />
increased use <strong>of</strong> renewable fuels on lifecycle emissions <strong>of</strong> CO2. These values are then<br />
compared to the total US transportation sector emissions to get a percent reduction. The<br />
results are presented in Table IX.C.2-2.<br />
Table IX.C.2-2<br />
CO2 emission impacts <strong>of</strong> increased use <strong>of</strong> renewable fuels in the<br />
transportation sector in 2012, relative to the 2012 reference case<br />
RFS Required Projected Volume:<br />
volume: 7.5 Bgal 9.9 Bgal<br />
Reduction (million metric tons CO2) 12.6 19.8<br />
Percent reduction 0.6 % 0.9 %<br />
Carbon dioxide is a subset <strong>of</strong> GHGs, along with CH4 <strong>and</strong> N2O as discussed above.<br />
It can be seen from Table IX.B.3-1 that the displacement index <strong>of</strong> CO2 is greater than for<br />
GHGs for each renewable fuel. This indicates that lifecycle emissions <strong>of</strong> CH4 <strong>and</strong> N2O<br />
are higher for renewable fuels than for the conventional fuels replaced. Therefore,<br />
reductions associated with the increased use <strong>of</strong> renewable fuels on lifecycle emissions <strong>of</strong><br />
GHGs are lower than the values for CO2. The results for GHGs are presented in Table<br />
IX.C.2-3.<br />
Table IX.C.2-3<br />
GHG emission impacts <strong>of</strong> increased use <strong>of</strong> renewable fuels in the<br />
transportation sector in 2012, relative to the 2012 reference case<br />
RFS Required Projected Volume:<br />
volume: 7.5 Bgal 9.9 Bgal<br />
Reduction (million metric tons CO2-eq.) 9.0 13.5<br />
Percent reduction 0.4 % 0.6 %<br />
D. Implications <strong>of</strong> Reduced Imports <strong>of</strong> Petroleum Products<br />
This section only considers the impacts on imports <strong>of</strong> oil <strong>and</strong> petroleum products.<br />
Exp<strong>and</strong>ed production <strong>and</strong> use <strong>of</strong> renewable fuels could have other economic impacts such<br />
- 184 -