Regulation of Fuels and Fuel Additives: Renewable Fuel Standard ...
Regulation of Fuels and Fuel Additives: Renewable Fuel Standard ...
Regulation of Fuels and Fuel Additives: Renewable Fuel Standard ...

Create successful ePaper yourself
Turn your PDF publications into a flip-book with our unique Google optimized e-Paper software.
RFG due to the absence <strong>of</strong> an RVP waiver for ethanol blends. The reader is referred to<br />
Chapter 2 <strong>of</strong> the DRIA for discussion <strong>of</strong> how ethanol levels will change at the state-level.<br />
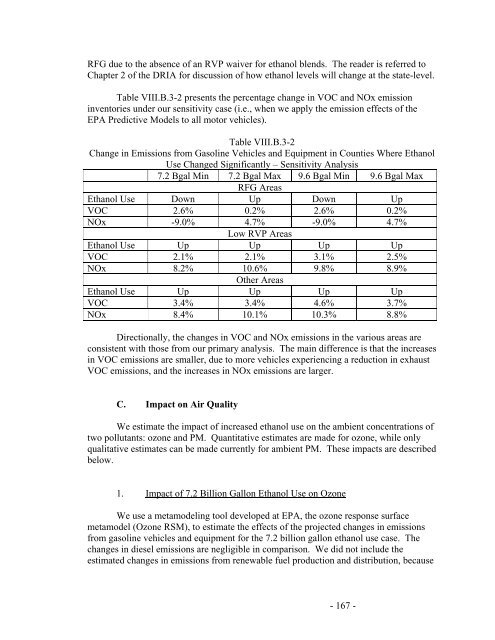
Table VIII.B.3-2 presents the percentage change in VOC <strong>and</strong> NOx emission<br />
inventories under our sensitivity case (i.e., when we apply the emission effects <strong>of</strong> the<br />
EPA Predictive Models to all motor vehicles).<br />
Table VIII.B.3-2<br />
Change in Emissions from Gasoline Vehicles <strong>and</strong> Equipment in Counties Where Ethanol<br />
Use Changed Significantly – Sensitivity Analysis<br />
7.2 Bgal Min 7.2 Bgal Max 9.6 Bgal Min 9.6 Bgal Max<br />
RFG Areas<br />
Ethanol Use Down Up Down Up<br />
VOC 2.6% 0.2% 2.6% 0.2%<br />
NOx -9.0% 4.7% -9.0% 4.7%<br />
Low RVP Areas<br />
Ethanol Use Up Up Up Up<br />
VOC 2.1% 2.1% 3.1% 2.5%<br />
NOx 8.2% 10.6% 9.8% 8.9%<br />
Other Areas<br />
Ethanol Use Up Up Up Up<br />
VOC 3.4% 3.4% 4.6% 3.7%<br />
NOx 8.4% 10.1% 10.3% 8.8%<br />
Directionally, the changes in VOC <strong>and</strong> NOx emissions in the various areas are<br />
consistent with those from our primary analysis. The main difference is that the increases<br />
in VOC emissions are smaller, due to more vehicles experiencing a reduction in exhaust<br />
VOC emissions, <strong>and</strong> the increases in NOx emissions are larger.<br />
C. Impact on Air Quality<br />
We estimate the impact <strong>of</strong> increased ethanol use on the ambient concentrations <strong>of</strong><br />
two pollutants: ozone <strong>and</strong> PM. Quantitative estimates are made for ozone, while only<br />
qualitative estimates can be made currently for ambient PM. These impacts are described<br />
below.<br />
1. Impact <strong>of</strong> 7.2 Billion Gallon Ethanol Use on Ozone<br />
We use a metamodeling tool developed at EPA, the ozone response surface<br />
metamodel (Ozone RSM), to estimate the effects <strong>of</strong> the projected changes in emissions<br />
from gasoline vehicles <strong>and</strong> equipment for the 7.2 billion gallon ethanol use case. The<br />
changes in diesel emissions are negligible in comparison. We did not include the<br />
estimated changes in emissions from renewable fuel production <strong>and</strong> distribution, because<br />
- 167 -