Regulation of Fuels and Fuel Additives: Renewable Fuel Standard ...
Regulation of Fuels and Fuel Additives: Renewable Fuel Standard ...
Regulation of Fuels and Fuel Additives: Renewable Fuel Standard ...

Create successful ePaper yourself
Turn your PDF publications into a flip-book with our unique Google optimized e-Paper software.
assumed to be affected by ethanol. Emissions <strong>of</strong> the four air toxics generally decrease<br />
slightly, due to the greater reduction in exhaust VOC emissions.<br />
3. Local <strong>and</strong> Regional VOC <strong>and</strong> NOx Emission Impacts In July<br />
We also estimate the percentage change in VOC <strong>and</strong> NOx emissions from<br />
gasoline fueled motor vehicles <strong>and</strong> equipment in those areas which actually experienced a<br />
significant change in ethanol use. Specifically, we focused on areas where the market<br />
share <strong>of</strong> ethanol blends was projected to change by 50 percent or more. We also focused<br />
on summertime emissions, as these are most relevant to ozone formation. Finally, we<br />
developed separately estimates for: 1) RFG areas, including the state <strong>of</strong> California <strong>and</strong><br />
the portions <strong>of</strong> Arizona where their CBG fuel programs apply, 2) low RVP areas (i.e.,<br />
RVP st<strong>and</strong>ards less than 9.0 RVP, <strong>and</strong> 3) areas with a 9.0 RVP st<strong>and</strong>ard. This set <strong>of</strong><br />
groupings helps to highlight the emissions impact <strong>of</strong> increased ethanol use in those areas<br />
where emission control is most important.<br />
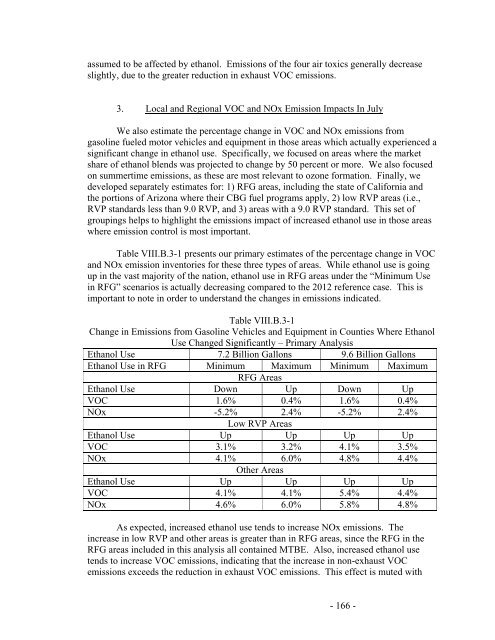
Table VIII.B.3-1 presents our primary estimates <strong>of</strong> the percentage change in VOC<br />
<strong>and</strong> NOx emission inventories for these three types <strong>of</strong> areas. While ethanol use is going<br />
up in the vast majority <strong>of</strong> the nation, ethanol use in RFG areas under the “Minimum Use<br />
in RFG” scenarios is actually decreasing compared to the 2012 reference case. This is<br />
important to note in order to underst<strong>and</strong> the changes in emissions indicated.<br />
Table VIII.B.3-1<br />
Change in Emissions from Gasoline Vehicles <strong>and</strong> Equipment in Counties Where Ethanol<br />
Use Changed Significantly – Primary Analysis<br />
Ethanol Use 7.2 Billion Gallons 9.6 Billion Gallons<br />
Ethanol Use in RFG Minimum Maximum Minimum Maximum<br />
RFG Areas<br />
Ethanol Use Down Up Down Up<br />
VOC 1.6% 0.4% 1.6% 0.4%<br />
NOx -5.2% 2.4% -5.2% 2.4%<br />
Low RVP Areas<br />
Ethanol Use Up Up Up Up<br />
VOC 3.1% 3.2% 4.1% 3.5%<br />
NOx 4.1% 6.0% 4.8% 4.4%<br />
Other Areas<br />
Ethanol Use Up Up Up Up<br />
VOC 4.1% 4.1% 5.4% 4.4%<br />
NOx 4.6% 6.0% 5.8% 4.8%<br />
As expected, increased ethanol use tends to increase NOx emissions. The<br />
increase in low RVP <strong>and</strong> other areas is greater than in RFG areas, since the RFG in the<br />
RFG areas included in this analysis all contained MTBE. Also, increased ethanol use<br />
tends to increase VOC emissions, indicating that the increase in non-exhaust VOC<br />
emissions exceeds the reduction in exhaust VOC emissions. This effect is muted with<br />
- 166 -