Regulation of Fuels and Fuel Additives: Renewable Fuel Standard ...
Regulation of Fuels and Fuel Additives: Renewable Fuel Standard ...
Regulation of Fuels and Fuel Additives: Renewable Fuel Standard ...

Create successful ePaper yourself
Turn your PDF publications into a flip-book with our unique Google optimized e-Paper software.
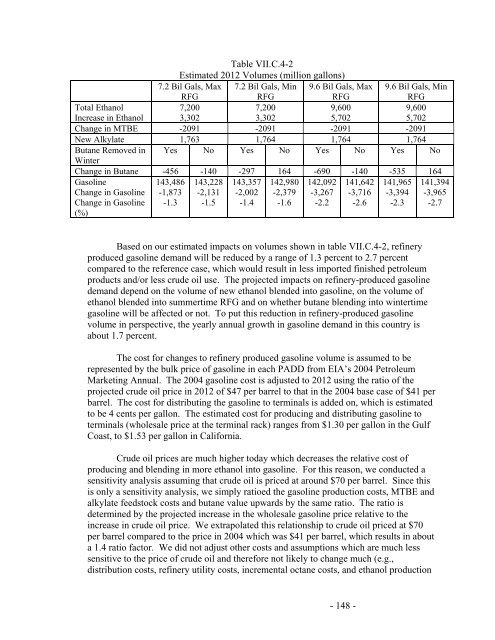
Table VII.C.4-2<br />
Estimated 2012 Volumes (million gallons)<br />
7.2 Bil Gals, Max 7.2 Bil Gals, Min 9.6 Bil Gals, Max 9.6 Bil Gals, Min<br />
RFG<br />
RFG<br />
RFG<br />
RFG<br />
Total Ethanol<br />
7,200<br />
7,200<br />
9,600<br />
9,600<br />
Increase in Ethanol 3,302<br />
3,302<br />
5,702<br />
5,702<br />
Change in MTBE -2091 -2091 -2091 -2091<br />
New Alkylate 1,763 1,764 1,764 1,764<br />
Butane Removed in<br />
Winter<br />
Yes No Yes No Yes No Yes No<br />
Change in Butane -456 -140 -297 164 -690 -140 -535 164<br />
Gasoline<br />
143,486 143,228 143,357 142,980 142,092 141,642 141,965 141,394<br />
Change in Gasoline -1,873 -2,131 -2,002 -2,379 -3,267 -3,716 -3,394 -3,965<br />
Change in Gasoline<br />
(%)<br />
-1.3 -1.5 -1.4 -1.6 -2.2 -2.6 -2.3 -2.7<br />
Based on our estimated impacts on volumes shown in table VII.C.4-2, refinery<br />
produced gasoline dem<strong>and</strong> will be reduced by a range <strong>of</strong> 1.3 percent to 2.7 percent<br />
compared to the reference case, which would result in less imported finished petroleum<br />
products <strong>and</strong>/or less crude oil use. The projected impacts on refinery-produced gasoline<br />
dem<strong>and</strong> depend on the volume <strong>of</strong> new ethanol blended into gasoline, on the volume <strong>of</strong><br />
ethanol blended into summertime RFG <strong>and</strong> on whether butane blending into wintertime<br />
gasoline will be affected or not. To put this reduction in refinery-produced gasoline<br />
volume in perspective, the yearly annual growth in gasoline dem<strong>and</strong> in this country is<br />
about 1.7 percent.<br />
The cost for changes to refinery produced gasoline volume is assumed to be<br />
represented by the bulk price <strong>of</strong> gasoline in each PADD from EIA’s 2004 Petroleum<br />
Marketing Annual. The 2004 gasoline cost is adjusted to 2012 using the ratio <strong>of</strong> the<br />
projected crude oil price in 2012 <strong>of</strong> $47 per barrel to that in the 2004 base case <strong>of</strong> $41 per<br />
barrel. The cost for distributing the gasoline to terminals is added on, which is estimated<br />
to be 4 cents per gallon. The estimated cost for producing <strong>and</strong> distributing gasoline to<br />
terminals (wholesale price at the terminal rack) ranges from $1.30 per gallon in the Gulf<br />
Coast, to $1.53 per gallon in California.<br />
Crude oil prices are much higher today which decreases the relative cost <strong>of</strong><br />
producing <strong>and</strong> blending in more ethanol into gasoline. For this reason, we conducted a<br />
sensitivity analysis assuming that crude oil is priced at around $70 per barrel. Since this<br />
is only a sensitivity analysis, we simply ratioed the gasoline production costs, MTBE <strong>and</strong><br />
alkylate feedstock costs <strong>and</strong> butane value upwards by the same ratio. The ratio is<br />
determined by the projected increase in the wholesale gasoline price relative to the<br />
increase in crude oil price. We extrapolated this relationship to crude oil priced at $70<br />
per barrel compared to the price in 2004 which was $41 per barrel, which results in about<br />
a 1.4 ratio factor. We did not adjust other costs <strong>and</strong> assumptions which are much less<br />
sensitive to the price <strong>of</strong> crude oil <strong>and</strong> therefore not likely to change much (e.g.,<br />
distribution costs, refinery utility costs, incremental octane costs, <strong>and</strong> ethanol production<br />
- 148 -