

Supply Chain-Based Solution to Prevent Fuel-Tax Evasion: Proof of ...
Supply Chain-Based Solution to Prevent Fuel-Tax Evasion: Proof of ...
Supply Chain-Based Solution to Prevent Fuel-Tax Evasion: Proof of ...

Create successful ePaper yourself
Turn your PDF publications into a flip-book with our unique Google optimized e-Paper software.
ORNL/TM-2011/132<br />
<strong>Supply</strong> <strong>Chain</strong>–<strong>Based</strong> <strong>Solution</strong> <strong>to</strong> <strong>Prevent</strong><br />
<strong>Fuel</strong> <strong>Tax</strong> <strong>Evasion</strong>: <strong>Pro<strong>of</strong></strong> <strong>of</strong> Concept<br />
Final Report<br />
November 2011<br />
Prepared by<br />
Gary Capps<br />
Mary Beth Lascurain<br />
Oscar Franzese<br />
Duncan Earl<br />
David West<br />
Timothy McIntyre<br />
Shih-Miao Chin<br />
Ho-Ling Hwang<br />
Raynella Connatser<br />
Samuel Lewis
Energy and Transportation Science Division<br />
ORNL/TM-2011/132<br />
SUPPLY CHAIN–BASED SOLUTION TO PREVENT FUEL TAX<br />
EVASION: PROOF OF CONCEPT FINAL REPORT<br />
Gary Capps<br />
Mary Beth Lascurain<br />
Oscar Franzese<br />
Duncan Earl<br />
David West<br />
Timothy McIntyre<br />
Shih-Miao Chin<br />
Ho-Ling Hwang<br />
Raynella Connatser<br />
Samuel Lewis<br />
Date Published: November 2011<br />
Prepared by<br />
OAK RIDGE NATIONAL LABORATORY<br />
Oak Ridge, Tennessee 37831-6283<br />
managed by<br />
UT-BATTELLE, LLC<br />
for the<br />
U.S. DEPARTMENT OF ENERGY<br />
under contract DE-AC05-00OR22725
CONTENTS<br />
LIST OF FIGURES .................................................................................................................................... vii<br />
LIST OF TABLES ....................................................................................................................................... xi<br />
ACRONYMNS AND ABBREVIATIONS ............................................................................................... xiii<br />
ACKNOWLEDGMENTS .......................................................................................................................... xv<br />
EXECUTIVE SUMMARY ...................................................................................................................... xvii<br />
1. INTRODUCTION ................................................................................................................................ 1<br />
1.1 BACKGROUND ........................................................................................................................ 1<br />
1.2 GOALS AND OBJECTIVES ..................................................................................................... 2<br />
1.3 ROLES AND PARTNERSHIPS ................................................................................................ 3<br />
1.4 OVERVIEW OF TEST METHODOLOGY ............................................................................... 3<br />
2. FUEL MARKER .................................................................................................................................. 5<br />
2.1 FUEL MARKER BACKGROUND ........................................................................................... 5<br />
2.1.1 Fluorescence .................................................................................................................. 5<br />
2.1.2 Marking or Tagging <strong>of</strong> <strong>Fuel</strong>s ......................................................................................... 7<br />
2.2 SELECTION OF FUEL MARKER ............................................................................................ 8<br />
2.2.1 Required Marker Characteristics: Compatibility as a <strong>Fuel</strong> Additive ........................... 10<br />
2.2.2 Required Marker Characteristics: Utility as a Tracking Moiety .................................. 11<br />
2.3 AGING AND CHEMICAL STABILITY TESTING ............................................................... 17<br />
2.3.1 IR676 ........................................................................................................................... 17<br />
2.3.2 SiNaph ......................................................................................................................... 23<br />
2.3.3 Sister Dye: 3,3ꞌ-diethylthiatricarbocyanine iodide ....................................................... 27<br />
3. SENSORS ........................................................................................................................................... 31<br />
3.1 GENERAL SENSOR SUITE CONSIDERATIONS ................................................................ 31<br />
3.1.1 Required Functionality ................................................................................................. 31<br />
3.1.2 General Trailer Layout and Operation ......................................................................... 31<br />
3.1.3 General Sensor System Specifications and Constraints on Installation ....................... 32<br />
3.2 HATCH AND VALVE SENSOR DEVELOPMENT AND EVALUATION ......................... 33<br />
3.2.1 Approach and Sensor Selection and Off-Vehicle Evaluation ...................................... 33<br />
3.2.2 Off-Trailer Evaluation ................................................................................................. 33<br />
3.3 LEVEL SENSOR DEVELOPMENT AND EVALUATION ................................................... 34<br />
3.3.1 Approach ...................................................................................................................... 34<br />
3.3.2 Sensor Selection and Off-Vehicle Evaluation ............................................................. 36<br />
3.4 MARKER SENSOR DEVELOPMENT ................................................................................... 37<br />
3.4.1 Approach ...................................................................................................................... 37<br />
3.4.2 Optical Design ............................................................................................................. 37<br />
3.4.3 Mechanical Design ....................................................................................................... 42<br />
3.4.4 Electrical Design .......................................................................................................... 44<br />
3.4.5 Firmware Development ............................................................................................... 44<br />
3.4.6 Off-trailer Evaluation ................................................................................................... 44<br />
iii<br />
Page
3.5 SENSOR SYSTEM LAYOUT AND CONFIGURATION ...................................................... 47<br />
3.5.1 Approach ...................................................................................................................... 47<br />
3.5.2 Off-Trailer Evaluation and Development .................................................................... 47<br />
4. COMMUNICATIONS ....................................................................................................................... 51<br />
4.1 SELECTION OF METHODOLOGY ....................................................................................... 51<br />
4.1.1 Use <strong>of</strong> Currently Existing Telematics Device .............................................................. 51<br />
4.1.2 Use <strong>of</strong> ORNL DAS ...................................................................................................... 52<br />
4.2 DESIGN OF THE T2TCU ........................................................................................................ 54<br />
4.3 DATA RETRIEVAL ................................................................................................................ 56<br />
5. GEO-FENCING AND EVIDENTIAL REASONING APPLICATIONS .......................................... 59<br />
5.1 BACKGROUND ...................................................................................................................... 59<br />
5.1.1 Geo-Fencing Basics ..................................................................................................... 59<br />
5.1.2 Fundamentals <strong>of</strong> Evidential Reasoning Methods ......................................................... 59<br />
5.1.3 Challenges .................................................................................................................... 61<br />
5.2 REAL-WORLD FUEL DELIVERY OPERATION DATA COLLECTION EFFORTS......... 62<br />
5.2.1 Real-World Information Relating <strong>to</strong> Pilot Tanker Truck Operations .......................... 62<br />
5.2.2 Truck Travel Behavior Data (PeopleNet Fleet Manger Reports) ................................ 66<br />
5.2.3 Service Station, Terminals, and Wholesale Cus<strong>to</strong>mer Locations ................................ 68<br />
5.3 ANALYSIS OF TRUCK TRAVEL BEHAVIOR DATA ........................................................ 71<br />
5.3.1 Duration <strong>of</strong> S<strong>to</strong>ps ......................................................................................................... 71<br />
5.3.2 Travel Routes ............................................................................................................... 74<br />
5.4 GEO-FENCING APPLICATION ............................................................................................. 74<br />
5.4.1 Methodologies <strong>to</strong> Detect Out-<strong>of</strong>-Fence Travel Behavior ............................................. 74<br />
5.4.2 TRC Roadway Network ............................................................................................... 75<br />
5.4.3 Location Tracking at the TRC ..................................................................................... 77<br />
5.4.4 Geo-fencing Example .................................................................................................. 77<br />
5.5 EVIDENTIAL REASONING APPLICATION ....................................................................... 77<br />
5.5.1 Overview <strong>of</strong> Concepts .................................................................................................. 77<br />
5.5.2 Development <strong>of</strong> Detection Rules ................................................................................. 79<br />
5.5.3 Determining Uncertainties in Marker Concentration and <strong>Fuel</strong> Level<br />
Measurements .............................................................................................................. 81<br />
5.5.4 Basic Algorithms ......................................................................................................... 83<br />
5.6 INTEGRATING THE GEO-FENCING AND EVIDENTIAL REASONING RULES ........... 84<br />
5.6.1 Initial Setup with Passenger-Car Simulation Runs ...................................................... 84<br />
5.6.2 Additional Passenger Car Simulation Scenarios on Actual Truck Routes................... 84<br />
6. TEST TRACK ACTIVITIES ............................................................................................................. 87<br />
6.1 PRELIMINARY TESTING ...................................................................................................... 87<br />
6.1.1 <strong>Fuel</strong> Loop Sensor Testing ............................................................................................ 87<br />
6.1.2 Passenger Car Communications Testing ...................................................................... 90<br />
6.2 FIELD TEST ............................................................................................................................. 94<br />
6.2.1 Integration .................................................................................................................... 94<br />
6.2.2 Testing Activities ......................................................................................................... 98<br />
6.2.3 Results and Data Analysis ......................................................................................... 100<br />
6.2.4 De-Instrumentation .................................................................................................... 116<br />
7. LESSONS LEARNED ..................................................................................................................... 117<br />
7.1 APPROACH AND METHODOLOGY .................................................................................. 117<br />
7.2 FUEL MARKER .................................................................................................................... 117<br />
iv
7.3 SENSORS ............................................................................................................................... 118<br />
7.4 COMMUNICATIONS ........................................................................................................... 121<br />
7.5 EVIDENTIAL REASONING ................................................................................................. 121<br />
8. ARCHITECTURE AND COSTS ..................................................................................................... 123<br />
8.1 RECOMMENDED ARCHITECTURE .................................................................................. 123<br />
8.1.1 System Components ................................................................................................... 123<br />
8.1.2 Data and Communications ......................................................................................... 123<br />
8.2 COST ASSESSMENT ............................................................................................................ 125<br />
8.2.1 Real-time Interdiction System ................................................................................... 126<br />
8.2.2 Centralized System .................................................................................................... 127<br />
8.2.3 <strong>Fuel</strong>-marker Break-even Cost .................................................................................... 127<br />
9. FUTURE DIRECTIONS .................................................................................................................. 129<br />
9.1 RECOMMENDATIONS FOR PHASE II .............................................................................. 129<br />
9.1.1 Approach and Methodology ...................................................................................... 129<br />
9.1.2 <strong>Fuel</strong> Marker ................................................................................................................ 129<br />
9.1.3 Sensors ....................................................................................................................... 130<br />
9.1.4 Communications ........................................................................................................ 132<br />
9.1.5 Evidential Reasoning ................................................................................................. 133<br />
9.2 LONG-TERM EFFORTS AND APPLICATIONS ................................................................ 134<br />
APPENDIX A. FLUORESCENCE SPECTRA ....................................................................................... A-1<br />
APPENDIX B. FUEL MARKER SENSOR SCHEMATICS AND LAYOUT....................................... B-1<br />
APPENDIX C. FUEL MARKER SENSOR MECHANICAL DRAWINGS .......................................... C-1<br />
APPENDIX D. FUEL MARKER SENSOR BILL OF MATERIALS .................................................... D-1<br />
APPENDIX E. FUEL MARKER SENSOR FIRMWARE SOURCECODE .......................................... E-1<br />
APPENDIX F. FUEL MARKER SENSOR COMMAND SPECIFICATION......................................... F-1<br />
APPENDIX G. CUSTOM SIGHT GLASS DRAWINGS ...................................................................... G-1<br />
v
LIST OF FIGURES<br />
Figure Page<br />
1 A concept drawing <strong>of</strong> the proposed fuel tax evasion system .................................................... 1<br />
2 Some typical cyanine dyes ........................................................................................................ 6<br />
3 SiNaph, the chosen fuel-tax-evasion project marker, in its single macromolecule<br />
structure ..................................................................................................................................... 6<br />
4 Some representative structures <strong>of</strong> several prominent fielded fuel dyes (A–C) and<br />
candidate dyes tested but not selected for the fuel tax evasion project (D and E) .................. 12<br />
5 Absorbance measurements with IR676 (“novel marker”) and agricultural diesel<br />
demonstrating lack <strong>of</strong> interference with fuel-tax-evasion project long wavelength<br />
marker’s spectral region by Solvent Red 26/164-based agricultural diesel dye ...................... 13<br />
6 Fluorescence spectra collected for pump diesel <strong>to</strong> determine whether competing<br />
fluorescence in the wavelength region <strong>of</strong> excitation above 630 nm would pose any<br />
significant interference, and none was noted .......................................................................... 13<br />
7 Fluorescence spectra collected for pump diesel containing the fielded fuel dye Solvent<br />
Yellow 124 <strong>to</strong> determine whether competing fluorescence in wavelength region <strong>of</strong><br />
excitation above 630 nm would pose any significant interference, and none was noted ........ 14<br />
8 Diesel fuel is excited with 405 nm light (left) and 676 nm light (right) .................................. 15<br />
9 Broad range calibration <strong>of</strong> IR676 in diesel on the pro<strong>to</strong>type self-referencing fuel marker<br />
sensor ....................................................................................................................................... 16<br />
10 Focused-range incremental calibration curve <strong>of</strong> IR676 in diesel on the pro<strong>to</strong>type selfreferencing<br />
fuel marker sensor ................................................................................................ 17<br />
11 Absorption spectra <strong>of</strong> IR676 at concentrations ranging from 0.052 ppm–9.4 ppm<br />
collected after no wait time ..................................................................................................... 18<br />
12 Emission spectra collected after no wait time <strong>of</strong> IR676 samples in diesel .............................. 18<br />
13 Emission spectra collected after 1 week <strong>of</strong> aging <strong>of</strong> IR676 samples in diesel ........................ 19<br />
14 Absorption spectra after 2 weeks <strong>of</strong> IR676 aging in diesel fuel .............................................. 19<br />
15 Emission spectra collected after 2 weeks <strong>of</strong> aging <strong>of</strong> IR676 samples in diesel ...................... 20<br />
16 Change in emission spectrum <strong>of</strong> over time for the highest concentration <strong>of</strong> IR676 in<br />
diesel ........................................................................................................................................ 20<br />
17 Various representations <strong>of</strong> an advanced macromolecule evaluated after stability failure<br />
<strong>of</strong> IR676 but ruled out due <strong>to</strong> price <strong>of</strong> $162.50 for 1 milligram .............................................. 21<br />
18 Naphthenic acids are prevalent in diesel and other heavier hydrocarbon fuels ....................... 22<br />
19 Absorbance pr<strong>of</strong>iles collected over a week’s time for SiNaph ............................................... 23<br />
20 Excitation and emission characteristics <strong>of</strong> SiNaph.................................................................. 24<br />
21 Initial absorbance measurements at room temperature, low temperature, and high<br />
temperature (traces are overlapping) <strong>of</strong> SiNaph-marked diesel in the presence <strong>of</strong> tank<br />
metal ........................................................................................................................................ 24<br />
22 Room-temperature marked diesel aging study ........................................................................ 25<br />
23 Low-temperature marked diesel aging study .......................................................................... 26<br />
24 High-temperature marked diesel aging study .......................................................................... 26<br />
25 High-temperature unmarked diesel aging study ...................................................................... 27<br />
26 Blue trace (with peak at ~770 nm) shows initial absorbance response <strong>of</strong> “sister” dye in<br />
diesel ........................................................................................................................................ 28<br />
27 Degradation <strong>of</strong> sister dye at low, room, and high temperature in presence <strong>of</strong> tank metal....... 29<br />
28 <strong>Fuel</strong> trailer compartmentalization and access points ............................................................... 31<br />
29 Sample GO switch installation <strong>to</strong> moni<strong>to</strong>r valve position ....................................................... 33<br />
30 Setup for <strong>of</strong>f-trailer evaluation <strong>of</strong> hatch and valve sensors ..................................................... 34<br />
vii
31 Differential pressure sensor schematic <strong>of</strong> operation................................................................ 35<br />
32 Pressure-based level sensor used for POC testing ................................................................... 36<br />
33 Setup for <strong>of</strong>f-trailer evaluation <strong>of</strong> level sensor and results ...................................................... 36<br />
34 <strong>Pro<strong>of</strong></strong>-<strong>of</strong>-principle fuel marker sensor breadboard experiment ............................................... 38<br />
35 Optical model <strong>of</strong> pro<strong>to</strong>type fuel marker sensor ....................................................................... 38<br />
36 Spectral response <strong>of</strong> marked diesel at two excitation wavelengths ......................................... 39<br />
37 Focal point for blue LED (at 6 mm beyond cover window) ................................................... 41<br />
38 Focal point for red LED (located 6 mm beyond cover window) ............................................. 41<br />
39 Variation in focal distribution with distance from cover window ........................................... 42<br />
40 Assembly view <strong>of</strong> sensor housing ........................................................................................... 43<br />
41 Marker sensor back view ......................................................................................................... 45<br />
42 Marker sensor front view ........................................................................................................ 45<br />
43 Marker sensor internal electronics........................................................................................... 46<br />
44 Data from vials containing marked diesel fuel ........................................................................ 46<br />
45 Schematic <strong>of</strong> sensor placement around fill valve on trailer compartment............................... 47<br />
46 View <strong>of</strong> downpipe region on trailer showing sight glasses and bot<strong>to</strong>m valves ....................... 48<br />
47 Sensors mounted on trailer fill valve and ORNL-designed sight glass ................................... 49<br />
48 Conceptual components <strong>of</strong> the fuel-tax-evasion system ......................................................... 52<br />
49 ORNL DAS used for data collection ....................................................................................... 53<br />
50 <strong>Fuel</strong>-tax-evasion communications major components ............................................................ 54<br />
51 T2TCU with test sensors ......................................................................................................... 55<br />
52 <strong>Fuel</strong>-<strong>Tax</strong>-<strong>Evasion</strong> Upload Data Service s<strong>of</strong>tware ................................................................... 56<br />
53 <strong>Fuel</strong>-<strong>Tax</strong>-<strong>Evasion</strong> Upload Data Service s<strong>of</strong>tware—FTE settings ........................................... 57<br />
54 <strong>Fuel</strong> <strong>Tax</strong> <strong>Evasion</strong> Upload Data Service s<strong>of</strong>tware—started data retrieval service ................... 57<br />
55 <strong>Fuel</strong>-<strong>Tax</strong>-<strong>Evasion</strong> Upload Data Service s<strong>of</strong>tware—communications s<strong>of</strong>tware ...................... 58<br />
56 Example <strong>of</strong> a geo-fencing proximity ....................................................................................... 60<br />
57 Types <strong>of</strong> reports available from PeopleNet Fleet Manager ..................................................... 67<br />
58 Examples <strong>of</strong> GPS location reports available from PeopleNet ................................................. 67<br />
59 Examples <strong>of</strong> Travel Activity reports ....................................................................................... 68<br />
60 Service stations owned by Pilot-Flying J, LLC ....................................................................... 69<br />
61 Pilot and Flying J service stations around the Knoxville, Tennessee, region.......................... 70<br />
62 Terminals around the Knoxville, Tennessee, region ............................................................... 70<br />
63 Examples <strong>of</strong> wholesalers and other cus<strong>to</strong>mers served by Pilot tankers................................... 71<br />
64 Distribution <strong>of</strong> s<strong>to</strong>p durations at the terminals (in minutes) .................................................... 72<br />
65 Distribution <strong>of</strong> s<strong>to</strong>p durations at gas stations (in minutes) ...................................................... 73<br />
66 Distribution <strong>of</strong> s<strong>to</strong>p durations at other locations, including wholesale cus<strong>to</strong>mers<br />
(in minutes) ............................................................................................................................. 73<br />
67 Example <strong>of</strong> multiple route choices between a specific terminal and service station pair<br />
in Knoxville, Tennessee .......................................................................................................... 74<br />
68 Selected simulated refuel and delivery locations in TRC ........................................................ 76<br />
69 Digitized roadway network around the TRC test site.............................................................. 76<br />
70 Predetermined nominal scenario route and geo-fencing boundary ......................................... 78<br />
71 Simplified decision rules for TRC testing ............................................................................... 80<br />
72 Potential warning paths ........................................................................................................... 81<br />
73 Example <strong>of</strong> fuel level pr<strong>of</strong>ile ................................................................................................... 82<br />
74 Linear utility function .............................................................................................................. 83<br />
75 Example route for a simulation run in Knoxville, Tennessee ................................................. 84<br />
76 A comparison <strong>of</strong> spatial location accuracy in data collected with the DAS device<br />
(points) and a commercial Trimble unit (lines) ....................................................................... 85<br />
77 Example <strong>of</strong> mock delivery ...................................................................................................... 85<br />
78 <strong>Fuel</strong> loop test rig ...................................................................................................................... 88<br />
viii
79 Marker sensor data from fuel loop test at TRC ....................................................................... 89<br />
80 Marker concentration data ....................................................................................................... 90<br />
81 DAS and T2TCU testing with fuel loop .................................................................................. 91<br />
82 FTE sensor simulation unit ...................................................................................................... 91<br />
83 Travel routes based on GPS data from communications testing ............................................. 92<br />
84 Simulated data collected during communications testing at TRC ........................................... 93<br />
85 GPS plots <strong>of</strong> the pre-test routes at the TRC on March 22, 2011 ............................................. 93<br />
86 Sample scenario results from the pre-test at TRC on March 22, 2011 .................................... 94<br />
87 T2TCU installed on tanker ...................................................................................................... 95<br />
88 Marker sensor in situ operation verification ............................................................................ 95<br />
89 Instrumented hatch located on <strong>to</strong>p <strong>of</strong> tanker ........................................................................... 96<br />
90 Instrumented valve on tanker .................................................................................................. 96<br />
91 DAS installed in test vehicle ................................................................................................... 97<br />
92 Test vehicle connected <strong>to</strong> TRC tanker for fuel transfer ........................................................... 98<br />
93 Tanker routes at TRC during second day <strong>of</strong> field test ............................................................. 99<br />
94 Activity from <strong>of</strong>floading <strong>of</strong> compartment 1 under Scenario 1 .............................................. 101<br />
95 Activities from <strong>of</strong>floading <strong>of</strong> compartment 4 under Scenario 1 ............................................ 102<br />
96 Activities from loading <strong>of</strong> compartment 1 under Scenario 2 ................................................ 103<br />
97 Activities from loading <strong>of</strong> compartment 4 under Scenario 2 ................................................ 104<br />
98 Activities from <strong>of</strong>floading compartment 1 under Scenario 2 ................................................ 104<br />
99 Activities from <strong>of</strong>floading compartment 4 under Scenario 2 ................................................ 105<br />
100 Activities from loading <strong>of</strong> compartment 1 under Scenario 3 ................................................ 107<br />
101 Offloading 50 gal at an unscheduled location under Scenario 3 ........................................... 107<br />
102 Activities measured from <strong>of</strong>floading at destination under Scenario 3 .................................. 108<br />
103 Activities <strong>of</strong> loading first 150 gal under Scenario 4 .............................................................. 110<br />
104 Activity from adding 150 gal unmarked fuel under Scenario 4 ............................................ 110<br />
105 Activity from <strong>of</strong>floading at delivery destination under Scenario 4 ....................................... 111<br />
106 Activity from loading <strong>of</strong> compartment 1 under Scenario 5 ................................................... 112<br />
107 Activity from loading <strong>of</strong> compartment 4 under Scenario 5 ................................................... 113<br />
108 Activity from loading at unscheduled s<strong>to</strong>p under Scenario 5 ................................................ 114<br />
109 Activity from <strong>of</strong>floading <strong>of</strong> compartment 1 under Scenario 5 .............................................. 115<br />
110 Activity from <strong>of</strong>floading <strong>of</strong> compartment 4 under Scenario 5 .............................................. 116<br />
111 RF-induced noise in pro<strong>to</strong>type fuel marker sensor ................................................................ 120<br />
112 Data flow for recommended architecture .............................................................................. 124<br />
113 NovaChem capabilities for bulk manufacturing .................................................................... 130<br />
114 Valve with dust cover sensing apparatus ............................................................................... 131<br />
115 Portion <strong>Fuel</strong> Level Pr<strong>of</strong>ile at S<strong>to</strong>p t ....................................................................................... 133<br />
C.1 Assembly <strong>of</strong> sensor components ........................................................................................... C-1<br />
C.2 Side view <strong>of</strong> critical dimensions............................................................................................ C-1<br />
C.3 Top view <strong>of</strong> critical dimensions ............................................................................................ C-2<br />
C.4 Critical holes and edges on PCB board layout ...................................................................... C-2<br />
C.5 Critical PCB component placement (front) ........................................................................... C-3<br />
C.6 Critical PCB component placement (back) ........................................................................... C-3<br />
ix
LIST OF TABLES<br />
Table Page<br />
1 SiNaph descrip<strong>to</strong>rs .................................................................................................................... 7<br />
2 Dyes used for fuel marking worldwide ..................................................................................... 9<br />
3 Diesel mo<strong>to</strong>r fuel additives ...................................................................................................... 10<br />
4 Some parameters <strong>of</strong> marine fuel oils according <strong>to</strong> ISO 8217 .................................................. 11<br />
5 Summary <strong>of</strong> sensors per fuel tanker compartment .................................................................. 56<br />
6 Summary <strong>of</strong> FTE-related costs for the proposed architecture ............................................... 126<br />
xi
ACRONYMNS AND ABBREVIATIONS<br />
BOS Back Office System<br />
CCM Chassis Communications Module<br />
COTS Commercial <strong>of</strong>f-the shelf<br />
CSV Comma Separated Value<br />
DAS Data Acquisition System<br />
DOE United States Department <strong>of</strong> Energy<br />
DOT United States Department <strong>of</strong> Transportation<br />
D-S Dempster Shafter<br />
FHWA Federal Highway Administration<br />
FSK Frequency Shift Key<br />
FTE <strong>Fuel</strong> <strong>Tax</strong> <strong>Evasion</strong><br />
GIS Geographical Information System<br />
gpm Gallons per minute<br />
GPS Global Positioning System<br />
IC Integrated Circuit<br />
IDS Intelligent Decision System<br />
LED Light Emitting Diode<br />
ml milliliter<br />
mm millimeter<br />
mW milliwatt<br />
NIR Near Infrared<br />
nm nanometer<br />
ORNL Oak Ridge National Labora<strong>to</strong>ry<br />
PCB Printed Circuit Board<br />
Pilot Pilot Travel Centers, LLC (including Flying J Travel Centers)<br />
POC <strong>Pro<strong>of</strong></strong> <strong>of</strong> Concept<br />
ppb Parts per billion<br />
ppm Parts per million<br />
psi Pounds per square inch (gauge)<br />
RF Radio frequency<br />
SE VDA Southeastern Vehicle Dynamic Area<br />
SiNAPH 2,3-naphthalocyanina<strong>to</strong>-bis(trihexylsiloxy)silane, bis(trihexylsiloxy)silicon 2,3naphthalocyanine<br />
T2TCU Trac<strong>to</strong>r <strong>to</strong> Trailer Communications Unit<br />
TRC Transportation Research Center<br />
UV Ultraviolet<br />
VDC Voltage Direct Current<br />
WRC Winding Road Course<br />
WRI Wireless Roadside Inspection<br />
xiii
ACKNOWLEDGMENTS<br />
ORNL would like <strong>to</strong> thank Pilot Travel Centers, LLC, for their gratis partnership in this pro<strong>of</strong>-<strong>of</strong>-concept<br />
testing. Pilot generously donated the use <strong>of</strong> their vehicle and fuel for the testing. In addition, Doug<br />
Drummer, David Breeding, driver Nick Peaker, and others provided the research team with valuable<br />
information regarding fleet operations and access <strong>to</strong> fleet data; they also allowed the research team <strong>to</strong><br />
observe operations firsthand in order <strong>to</strong> better design the test systems, formulate test plans, and select<br />
instrumentation.<br />
ORNL would also like <strong>to</strong> thank the staff at the Transportation Research Center for their testing support.<br />
Seth Reynolds, Ken Webster, and drivers, technicians, and other support staff made it possible<br />
<strong>to</strong> complete the full set <strong>of</strong> tests, adapting <strong>to</strong> various weather and technical issues which arose during<br />
the testing.<br />
xv
EXECUTIVE SUMMARY<br />
The goal <strong>of</strong> this research was <strong>to</strong> provide a pro<strong>of</strong>-<strong>of</strong>-concept (POC) system for preventing non-taxable<br />
(non-highway diesel use) or low-taxable (jet fuel) petrochemical products from being “blended” with<br />
taxable fuel products and preventing taxable fuel products from cross-jurisdiction evasion. The research<br />
worked <strong>to</strong> fill the need <strong>to</strong> validate the legitimacy <strong>of</strong> individual loads, <strong>of</strong>floads, and movements by<br />
integrating and validating, on a near-real-time basis, information from global positioning system (GPS),<br />
valve sensors, level sensors, and fuel-marker sensors.<br />
There were five innovative aspects <strong>to</strong> this pilot research:<br />
1. Instead <strong>of</strong> relying on a single solution, fuel tax evasion (FTE) will be prevented through the<br />
integration <strong>of</strong> multiple measures.<br />
2. This research recognized that there is not a “silver bullet” for preventing FTE. As such, solutions<br />
will be tailored <strong>to</strong> address specific scam(s).<br />
3. Inline sensors were developed and evaluated for their feasibility <strong>to</strong> authenticate the presence and<br />
concentration <strong>of</strong> fuel markers in the fuel.<br />
4. This research integrated advances in sensor technology, wireless communications, vehicle<br />
tracking, and information analysis. An integrated sensor suite, communications system, and data<br />
acquisition platform were developed. The platform allowed the use <strong>of</strong> various sensor modules and<br />
communication methods <strong>to</strong> fit specific applications. Local data s<strong>to</strong>rage was also provided for<br />
backup purposes.<br />
5. The simulated control center was designed <strong>to</strong> be able <strong>to</strong> communicate with law enforcement<br />
personnel in a timely manner <strong>to</strong> allow them <strong>to</strong> investigate potential fuel diversion activities.<br />
The inclusion <strong>of</strong> a chemical marker and sensor system as an indica<strong>to</strong>r <strong>of</strong> fuel dilution was intended <strong>to</strong><br />
serve as a confirmation <strong>of</strong> illegal activities associated with evasion <strong>of</strong> fuel tax. The ORNL team<br />
successfully identified and rigorously tested a fuel marker with the following characteristics:<br />
compatibility with fuels and engines, production <strong>of</strong> no objectionable emissions or by-products, no<br />
visibility <strong>to</strong> the naked eye, chemical stability under thermal extremes over the period <strong>of</strong> months, and high<br />
enough optical yields <strong>to</strong> produce detectable fluorescence in the parts-per-billion range. The optical and<br />
aging chemistries <strong>of</strong> candidates other than the marker chosen were investigated along the way, as was the<br />
performance <strong>of</strong> less expensive <strong>of</strong>f-the-shelf alternative markers. The SiNaph system was chosen because<br />
it proved <strong>to</strong> be the purest and therefore most stable over the long term and the most optically reliable <strong>of</strong><br />
those studied. Ultimately, this marker can be reliable as a long-term fuel marker and for dilution sensing.<br />
A suite <strong>of</strong> sensors attached <strong>to</strong> a fuel transport vehicle provided the critical information needed <strong>to</strong> evaluate<br />
whether or not a FTE has occurred. In the most general terms, the sensor suite must furnish information<br />
capable <strong>of</strong> determining whether any <strong>of</strong> the access points in<strong>to</strong> the trailer were opened, how much fuel is<br />
present (fuel level), and whether the fuel in the truck is the fuel on which taxes were paid at the load<br />
point. The marker sensor was developed in-house by ORNL, and mounting solutions were designed inhouse<br />
with commercial, <strong>of</strong>f-the-shelf sensors for the pressure sensors and the valve and hatch position<br />
sensors. In contrast <strong>to</strong> the hatch, valve, and level sensors, the marker sensor required that a selfreferencing<br />
sensor and sensing technique be developed that had no commercial counterpart.<br />
The communications system required <strong>to</strong> accomplish the needs <strong>of</strong> the FTE effort was able <strong>to</strong> collect and<br />
format sensor signals from the trailer (switches, level sensor, marker sensor, weight), convey the sensor<br />
signals from the trailer <strong>to</strong> the trac<strong>to</strong>r without the addition <strong>of</strong> any cabling or wiring between the trac<strong>to</strong>r and<br />
trailer via power line communications, receive sensor data from the trailer and condition and format the<br />
sensor signals for acceptance by the onboard computer, and be capable <strong>of</strong> sending the data packets <strong>to</strong> a<br />
back <strong>of</strong>fice system (BOS) for processing. Due <strong>to</strong> the restrictions imposed by the use <strong>of</strong> the RS485<br />
pro<strong>to</strong>col for the fuel marker sensor, a suitable commercial <strong>of</strong>f-the-shelf solution was not identified for the<br />
xvii
trac<strong>to</strong>r-<strong>to</strong>-trailer communications unit (T2TCU), so the development was contracted <strong>to</strong> private industry.<br />
The data posted by the T2TCU was read by the ORNL data acquisition system (DAS) at 1 Hz. A realtime<br />
communications link was established between an ORNL computer and the DAS, was made possible<br />
by the onboard cellular modem. This streaming data was moni<strong>to</strong>red and split in<strong>to</strong> short files capturing 5min<br />
increments <strong>of</strong> data; these files were made available <strong>to</strong> the evidential reasoning component for<br />
analysis via au<strong>to</strong>mated uploads <strong>to</strong> a server.<br />
As part <strong>of</strong> this research study, the development <strong>of</strong> a POC intelligent Geographical Information System<br />
(GIS)–based system was called for <strong>to</strong> facilitate near-real time notification <strong>of</strong> suspicious variation in<br />
standard delivery processes, tracking the tanker as it travels from the origin (e.g., terminal) <strong>to</strong> its<br />
destinations (e.g., retail outlet) on the delivery route. The control center, where the “system” resides,<br />
moni<strong>to</strong>rs sensor activities occurring at and between the terminal loading <strong>of</strong> the tank truck and the<br />
unloading at the retail outlet. By applying sensor technologies in combination with <strong>to</strong>ols developed based<br />
on data fusion and validation techniques, suspicious activities could be identified in real time. The<br />
intelligent GIS-based system developed under this research study performed two major functions: ge<strong>of</strong>encing<br />
and evidential reasoning. Data related <strong>to</strong> fuel delivery operations were obtained from several<br />
sources including observations made during “shadowing” <strong>of</strong> tanker drivers during normal operations,<br />
notes gathered from interviews with Pilot managers, and analysis <strong>of</strong> specific PeopleNet reports.<br />
Supplemental information was also collected through web searches and internal communications with the<br />
Sensor Team. In addition, simulations were conducted <strong>to</strong> generate sensor information using a passenger<br />
car with connections <strong>to</strong> the DAS.<br />
The technical approach taken in this activity provides a proactive rather than a reactive capability <strong>to</strong><br />
determine if non-taxed fuel is being diverted for use in mo<strong>to</strong>r vehicles. An integrated sensor,<br />
communications, and power management platform will be installed on the tank truck. The sensor units<br />
were able <strong>to</strong> identify, in real time, the opened or closed status <strong>of</strong> the tank truck valve, the level <strong>of</strong> fuel that<br />
is being loaded or unloaded, and the amount <strong>of</strong> fuel marker in the fuel. The tanker also had a GPS unit for<br />
tracking. This was tied <strong>to</strong> a geo-fencing program that identified s<strong>to</strong>ps along the vehicle’s route. The ge<strong>of</strong>encing<br />
program was integrated with the evidential reasoning system <strong>to</strong> provide, when combined with the<br />
transportation manifest, an appropriate level <strong>of</strong> warning <strong>of</strong> suspicious activities.<br />
After a thorough search for commercially available materials <strong>to</strong> build each system component <strong>to</strong> detect<br />
FTE, ORNL laid out a test methodology whereby each system component was tested individually prior <strong>to</strong><br />
the assembly <strong>of</strong> the complete system. The fuel marker components were first designed on a bench<strong>to</strong>p<br />
system within a lab where each sensor component <strong>of</strong> the fuel marker sensor suite was tested. Once the<br />
bench<strong>to</strong>p system was proven, the assembly was scaled up for retr<strong>of</strong>it <strong>to</strong> a fuel tanker. Due <strong>to</strong> liability<br />
issues, ORNL contracted with the Transportation Research Center (TRC) in East Liberty, Ohio, <strong>to</strong><br />
conduct the field test on a closed track. ORNL began by testing the fuel loop assembly on the tanker at<br />
TRC <strong>to</strong> see how the assembly processed full-scale fuel flow and <strong>to</strong> rule out fuel leaks. That test was<br />
successful and was followed by a field test within an instrumented tanker using FTE scenarios.<br />
The POC testing does not lend itself <strong>to</strong> real-world data collection due <strong>to</strong> the non-production nature <strong>of</strong> the<br />
equipment and sensors used and the need <strong>to</strong> control the testing steps and maneuvers <strong>to</strong> gather the required<br />
data. These fac<strong>to</strong>rs and the general concern for staff safety and the safety <strong>of</strong> the Pilot Travel Centers, LLC<br />
(Pilot) vehicle led <strong>to</strong> a decision early in the project <strong>to</strong> conduct this POC vehicle-based data collection at a<br />
closed test facility. The TRC in East Liberty, Ohio, was chosen based on the size <strong>of</strong> its facility (several<br />
miles <strong>of</strong> roadway), experience with commercial vehicle testing, and ability <strong>to</strong> handle the needed fuel<br />
transfers.<br />
Prior <strong>to</strong> the field test with the tanker, preliminary testing was conducted at TRC <strong>to</strong> test out the marker<br />
sensor hardware and s<strong>of</strong>tware under conditions similar <strong>to</strong> those which would be experienced during the<br />
xviii
field test; this opportunity was also taken <strong>to</strong> test the pro<strong>to</strong>type T2TCU with a functioning marker sensor.<br />
Additionally, the simulated sensor data was collected as the test scenarios were performed on-site at TRC<br />
<strong>to</strong> confirm the DAS-<strong>to</strong>-BOS communications and collect data <strong>to</strong> fine-tune the evidential reasoning<br />
system.<br />
The Field Test conducted at TRC using the Pilot’s tanker trac<strong>to</strong>r-trailer involved the full ORNL end-<strong>to</strong>end<br />
FTE system. The test vehicle was moved from location <strong>to</strong> location within the TRC reservation <strong>to</strong><br />
simulate loading and <strong>of</strong>floading locations such as a fuel terminal and retail fuel sales location and<br />
included several test scenarios which mimicked real-world operations.<br />
This POC testing was successful, proving the feasibility <strong>of</strong> this FTE detection solution. In addition, this<br />
research provided valuable information regarding where future research efforts are needed <strong>to</strong> further<br />
develop such a system.<br />
xix
1.1 BACKGROUND<br />
1. INTRODUCTION<br />
Revenues from mo<strong>to</strong>r fuel and other highway use taxes provide the primary source <strong>of</strong> funding for the<br />
United States’ transportation system, and ensuring all <strong>of</strong> these taxes are collected, remitted, and credited<br />
<strong>to</strong> the Highway Trust Fund is a priority for the U.S. Department <strong>of</strong> Transportation (DOT) Federal<br />
Highway Administration (FHWA). In the past, loss <strong>of</strong> revenue due <strong>to</strong> tax evasion has been estimated <strong>to</strong><br />
range from $1 billion annually <strong>to</strong> as much as 25% <strong>of</strong> <strong>to</strong>tal revenues. After the point <strong>of</strong> taxation was<br />
changed for both gasoline (1988) and diesel fuel (1994), significant increases in tax revenue were realized<br />
which were assumed <strong>to</strong> be due <strong>to</strong> decreased evasion. Additionally, diesel fuel that was <strong>to</strong> be used for <strong>of</strong>froad<br />
(non-taxable use) purposes was marked with a red dye, making it easier for on-road enforcement<br />
personnel <strong>to</strong> identify the propulsion fuel as having had all proper taxes paid prior <strong>to</strong> its use in the vehicle.<br />
However, there are still a number <strong>of</strong> extensive and convoluted schemes <strong>to</strong> evade fuel taxes that cannot be<br />
addressed by a single solution. Rather, a supply-chain–based solution is needed. This research used<br />
evidential reasoning techniques, fuel markers, sensor devices, and vehicle tracking devices <strong>to</strong> moni<strong>to</strong>r,<br />
track, and detect the transfer and movements <strong>of</strong> petroleum products between different locations and<br />
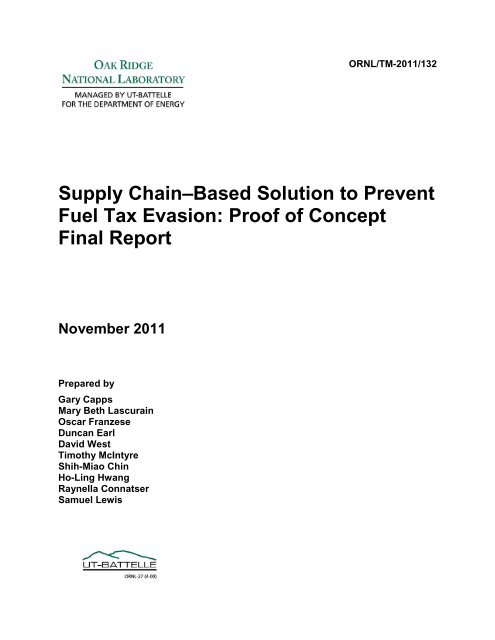
determine the “legitimacy” <strong>of</strong> the movements and fuel loading/unloading (Fig. 1). This fuel tax evasion<br />
(FTE) detection system has the potential <strong>to</strong> reduce or eliminate a number <strong>of</strong> FTE schemes, resulting in<br />
millions <strong>of</strong> dollars <strong>of</strong> additional revenue in the Highway Trust Fund.<br />
Fig. 1. A concept drawing <strong>of</strong> the proposed fuel tax evasion system.<br />
1
For Federal tax purposes, the point <strong>of</strong> taxation for gasoline and diesel fuel is at the point <strong>of</strong> its removal<br />
from bulk s<strong>to</strong>rage at the terminal rack. Approximately half <strong>of</strong> the states in the United States have the same<br />
point <strong>of</strong> taxation. However, the rest <strong>of</strong> the states have a point <strong>of</strong> taxation at the wholesaler/distribu<strong>to</strong>r<br />
level or below. This presents additional challenges in tracking untaxed fuel after it leaves the bulk s<strong>to</strong>rage.<br />
Some <strong>of</strong> the technologies introduced in this research project would be useful in tracking the “below the<br />
rack” (after the product leaves the bulk terminal) movement. The terminal rack is the facility where fuel<br />
from bulk s<strong>to</strong>rage tanks is loaded in<strong>to</strong> tanker trucks for delivery <strong>to</strong> retail stations or bulk users. Only dyed<br />
diesel fuel may be removed from bulk s<strong>to</strong>rage without payment <strong>of</strong> the Federal diesel fuel excise tax, and<br />
the taxes in various states that have similar dyed diesel statutes. Dyed diesel is used by farmers,<br />
fishermen, and others for <strong>of</strong>f-road proposes. There are no dyeing requirements for gasoline.<br />
The current approaches in identifying and preventing FTE are primarily through fuel tax enforcement,<br />
electronic registration and data reporting, and processing and analyzing fuel tax data. The enforcement<br />
activities include checking highway diesel users for dyed fuel in their tanks and audits <strong>of</strong> the gasoline<br />
tank truck delivery system. These approaches are time consuming, and they attempt <strong>to</strong> discover and<br />
investigate evasions after they have taken place. This research proposes <strong>to</strong> moni<strong>to</strong>r and determine, in near<br />
real time, the “legitimacy” <strong>of</strong> every loading, <strong>of</strong>floading, and movement <strong>of</strong> petroleum products. By so<br />
doing, this proposed solution provides enforcement staff with intelligence on a potential diversion <strong>of</strong> fuel<br />
or other tax evasion during such an event.<br />
1.2 GOALS AND OBJECTIVES<br />
The goal <strong>of</strong> this research was <strong>to</strong> provide a pro<strong>of</strong> <strong>of</strong> concept (POC) system for preventing (1) non-taxable<br />
(non-highway diesel use) or low-taxable (jet fuel) petrochemical products from being “blended” with<br />
taxable fuel products and (2) taxable fuel products from cross-jurisdiction evasion. The research worked<br />
<strong>to</strong> fill the need <strong>to</strong> validate the legitimacy <strong>of</strong> individual loads, <strong>of</strong>floads, and movements by integrating and<br />
validating, on a near-real-time basis, information from global positioning system (GPS), valve sensors,<br />
level sensors, and fuel-marker sensors.<br />
There were five innovative aspects <strong>to</strong> this pilot research.<br />
1. Instead <strong>of</strong> relying on a single solution, FTE will be prevented through the integration <strong>of</strong> multiple<br />
measures.<br />
2. This research recognized that there is not a “silver bullet” for preventing FTE. As such, solutions<br />
will be tailored <strong>to</strong> address specific scam(s).<br />
3. Inline sensors were developed and evaluated for their feasibility <strong>to</strong> authenticate the presence and<br />
concentration <strong>of</strong> fuel markers in the fuel.<br />
4. This research integrated advances in sensor technology, wireless communications, vehicle<br />
tracking, and information analysis. An integrated sensor suite, communications system, and data<br />
acquisition platform were developed. The platform allowed the use <strong>of</strong> various sensor modules and<br />
communication methods <strong>to</strong> fit specific applications. Local data s<strong>to</strong>rage was also provided for<br />
backup purposes.<br />
5. The simulated control center was designed <strong>to</strong> be able <strong>to</strong> communicate with law enforcement<br />
personnel in a timely manner <strong>to</strong> allow them <strong>to</strong> investigate potential fuel diversion activities.<br />
The major benefit <strong>to</strong> the highway programs is the potential <strong>to</strong> increase the collection <strong>of</strong> fuel tax revenue.<br />
It is estimated that Highway Trust Fund could be depleted in the near future. This research will<br />
substantially increase the resources needed <strong>to</strong> build and maintain the transportation infrastructure.<br />
The technical approach taken in this activity provides a proactive rather than a reactive capability <strong>to</strong><br />
determine if non-taxed fuel is being diverted for use in mo<strong>to</strong>r vehicles. An integrated sensor,<br />
communications, and power management platform were installed on the tank truck. The sensor units were<br />
2
able <strong>to</strong> identify, in real time, the open or closed status <strong>of</strong> the tank truck valve, the level <strong>of</strong> fuel that is<br />
being loaded or unloaded, and the amount <strong>of</strong> fuel marker in the fuel. The tanker also had a Global<br />
Positioning System (GPS) unit for tracking. This was tied <strong>to</strong> a geo-fencing program that identified s<strong>to</strong>ps<br />
along the vehicle’s route. The geo-fencing program was integrated with the evidential reasoning system <strong>to</strong><br />
provide, when combined with the transportation manifest, an appropriate level <strong>of</strong> warning for suspicious<br />
activities.<br />
This system allowed for near-real-time notification <strong>of</strong> any suspicious variation in standard delivery<br />
processes as the tanker moved from the origin (e.g., terminal) <strong>to</strong> the destinations (e.g., retail outlet) on its<br />
delivery route. Therefore, the key metrics <strong>to</strong> measure the impacts <strong>of</strong> this research include, but are not<br />
limited <strong>to</strong>,<br />
1. the propensity and accuracy <strong>of</strong> detecting illegal blending and bootlegging;<br />
2. the ease and the costs (including both direct and indirect costs) <strong>of</strong> deploying the proposed system;<br />
3. the frequency and speed by which the communications center is notified <strong>of</strong> a potential illegal<br />
activity; and<br />
4. the transparency <strong>of</strong> the detection system <strong>to</strong> the carriers’ operations.<br />
A testing procedure was developed <strong>to</strong> measure these key metrics and data collection, and analysis plans<br />
were developed <strong>to</strong> quantify the impacts <strong>of</strong> the research.<br />
1.3 ROLES AND PARTNERSHIPS<br />
Oak Ridge National Labora<strong>to</strong>ry (ORNL) provided the technical and managerial support for the project.<br />
This role included the development and integration <strong>of</strong> sensors, tracking devices, fuel markers,<br />
communications s<strong>of</strong>tware, evidential reasoning s<strong>of</strong>tware, geographical information system (GIS)<br />
s<strong>of</strong>tware, and display interfaces.<br />
Pilot Travel Center, LLC (Pilot), which owns carrier and retail outlets, donated diesel fuel <strong>to</strong> conduct the<br />
tests scenarios that were conducted in the field operational test. Tracking devices, valve position<br />
indica<strong>to</strong>rs, fuel-marker sensors, power supply, and a data acquisition system (DAS) fitted with wireless<br />
communication capability were installed on a tanker truck from Pilot’s carrier fleet at the Transportation<br />
Research Center (TRC) in East Liberty, Ohio.<br />
ORNL contracted with Air-Weigh <strong>to</strong> build a specialized trailer-<strong>to</strong>-trac<strong>to</strong>r communications unit (T2TCU)<br />
<strong>to</strong> interface with the sensor suite that was mounted on the tanker. This device transferred data from the<br />
sensors through the trailer’s data bus <strong>to</strong> the truck’s in-cab DAS. More detailed discussions regarding these<br />
devices follow in Sects. 3 and 4 <strong>of</strong> this report.<br />
1.4 OVERVIEW OF TEST METHODOLOGY<br />
After a thorough search for commercially available materials <strong>to</strong> build each system component <strong>to</strong> detect<br />
FTE, ORNL laid out a test methodology whereby each system component was tested individually prior <strong>to</strong><br />
the assembly <strong>of</strong> the complete system. The fuel marker components were first designed on a bench<strong>to</strong>p<br />
system within a lab where each sensor component <strong>of</strong> the fuel marker sensor suite was tested. Once the<br />
bench<strong>to</strong>p system was proven, the assembly was scaled up for retr<strong>of</strong>it <strong>to</strong> a fuel tanker. Due <strong>to</strong> liability<br />
issues, ORNL contracted with TRC in East Liberty, Ohio, <strong>to</strong> conduct the field test on a closed track.<br />
ORNL began by testing the fuel loop assembly on the tanker at TRC <strong>to</strong> see how the assembly processed<br />
full-scale fuel flow and <strong>to</strong> rule out fuel leaks. That test was successful and was followed by a field test<br />
within an instrumented tanker using FTE scenarios.<br />
3
2. FUEL MARKER<br />
The inclusion <strong>of</strong> a chemical marker and sensor system as an indica<strong>to</strong>r <strong>of</strong> fuel dilution was intended <strong>to</strong><br />
serve as a confirmation <strong>of</strong> illegal FTE activities within the larger, multifaceted approach <strong>to</strong> mitigating<br />
revenue loss from illicit transfers <strong>of</strong> fuel. The ORNL team has successfully identified and rigorously<br />
tested a fuel marker that has the following characteristics:<br />
• compatibility with fuels and engines,<br />
• production <strong>of</strong> no objectionable emissions or by-products,<br />
• no visibility <strong>to</strong> the naked eye,<br />
• chemical stability under thermal extremes over the period <strong>of</strong> months, and<br />
• optical yields high enough <strong>to</strong> produce detectable fluorescence in the parts-per-billion range.<br />
The optical and aging chemistries <strong>of</strong> candidates other than the marker chosen were investigated along the<br />
way, as was the performance <strong>of</strong> less-expensive <strong>of</strong>f-the-shelf alternative markers. However, the SiNaph<br />
system was chosen because it proved <strong>to</strong> be the purest and therefore the most stable over the long term and<br />
the most optically reliable <strong>of</strong> those studied. Ultimately, this marker can be reliable as a long-term fuel<br />
marker and for dilution sensing. In going forward, a less expensive purchase route for the same highquality<br />
marker could be followed given lead time <strong>of</strong> 6 months. Most integral <strong>to</strong> a real-world<br />
implementation <strong>of</strong> the fuel marker system would be the development <strong>of</strong> a specialty manufacture niche<br />
that could produce a SiNaph marker for the lowest possible cost at a lead time <strong>of</strong> 1 <strong>to</strong> 2 years.<br />
2.1 FUEL MARKER BACKGROUND<br />
The <strong>Fuel</strong> Marker Team sought <strong>to</strong> implement their knowledge <strong>of</strong> fluorescence and tagging chemistries<br />
within the framework <strong>of</strong> au<strong>to</strong>motive and diesel fuel applications <strong>to</strong> the benefit <strong>of</strong> the multi-strategy POC<br />
research approach for mitigating FTE. This section will introduce the fundamental principles <strong>of</strong><br />
fluorescence; give a working his<strong>to</strong>ry <strong>of</strong> fuel tagging via optical markers; and detail all the work that led <strong>to</strong><br />
the final selection <strong>of</strong> a marker. Other project-critical <strong>to</strong>pics such as the density <strong>of</strong> diesel, the integral<br />
nature <strong>of</strong> purified optical material, and the effect <strong>of</strong> mixing very highly concentrated, nearly saturated<br />
solutions in<strong>to</strong> pure diluent will be covered as well.<br />
2.1.1 Fluorescence<br />
Molecular fluorescence results when light, commonly in the ultraviolet, visible, or infrared region <strong>of</strong> the<br />
electromagnetic spectrum, impinges upon a compound and promotes the molecule or system <strong>of</strong> molecules<br />
and a<strong>to</strong>ms <strong>to</strong> an excited (increased internal energy) electronic state. As the molecule or system <strong>of</strong><br />
molecules and a<strong>to</strong>ms relaxes <strong>to</strong> the more statistically favored, lower-energy ground state, some <strong>of</strong> the<br />
released energy can be detected as emitted light. The energy value <strong>of</strong> this emitted light reflects aspects <strong>of</strong><br />
the chemical structure <strong>of</strong> the fluorescent compound, and a graph <strong>of</strong> emission intensity versus energy value<br />
(wavelength) can create a descrip<strong>to</strong>r unique <strong>to</strong> a molecule or, more accurately, a family <strong>of</strong> molecules.<br />
Because certain families <strong>of</strong> molecules can be excited and made <strong>to</strong> emit fluorescence in wavelength<br />
regions where most other ambient compounds do not, the emitted light <strong>of</strong> a fluorescent marker <strong>of</strong>fers a<br />
strong, high signal relative <strong>to</strong> lower background levels. When these properties are exploited as a tagging<br />
strategy in order <strong>to</strong> moni<strong>to</strong>r the increase, decrease, or migration <strong>of</strong> a fluorescent species, extremely<br />
sensitive detection is possible, even in optically dense or “murky” solutions. Some examples <strong>of</strong> the<br />
double bonds within an organic molecule that <strong>of</strong>fer “loosely held” electrons that can be excited by<br />
wavelengths <strong>of</strong> visible energy are shown in the generic and widely available cyanine pure organic dyes in<br />
Fig. 2. A series <strong>of</strong> such pi bonds, the extended association <strong>of</strong> multiple double bonds within a molecule or<br />
complex, can be referred <strong>to</strong> as conjugation.<br />
5
Fig. 2. Some typical cyanine dyes. Note the conjugation, or extended double bond—single bond—double bond<br />
pattern, within the molecules that leads <strong>to</strong> fluorescence. (Image source: http://en.wikipedia.org/wiki/Cyanine)<br />
The final FTE marker that was chosen is 2,3-naphthalocyanina<strong>to</strong>-bis(trihexylsiloxy)silane,<br />
bis(trihexylsiloxy)silicon 2,3-naphthalocyanine, (henceforth denoted as “SiNaph”). SiNaph’s structure is<br />
shown in Fig. 3.<br />
Table 1 includes basic physical and spectroscopic properties, as well as useful identifying numbers, <strong>to</strong><br />
facilitate further searches regarding this compound. It is a complicated synthetic product from cyanine<br />
roots.<br />
For the purposes <strong>of</strong> the FTE project, the fluorescent marker system was ultimately based on this<br />
fluorophore, whose emission results from highly extended conjugation and whose stability was facilitated<br />
by organic ligand complexation around a silicon core ion. These “flexible” organo-silicon chemical<br />
linkages <strong>of</strong>fer dual advantages <strong>to</strong> the SiNaph molecule. The central ion allows long-range electronic<br />
conjugation for high fluorescent yield and thermal stabilization. This structural robustness <strong>of</strong> the<br />
macromolecule cushions the blow <strong>of</strong> acidic diesel components and thermal effects, thereby preventing<br />
molecular degradation and its attendant decrease in signal due <strong>to</strong> anything other than concentration<br />
dilution. Other, competing reductions in fluorescent signal emitted from the chosen marker molecules<br />
include degradation <strong>of</strong> the marker by chemical attack from diesel components or additives <strong>to</strong> diesel<br />
(naphthenic acids, peptizing agents, surfactants) as well as chemical degradation due <strong>to</strong> absorbance <strong>of</strong><br />
excess molecular-level heat, the other relaxation route <strong>of</strong> an optically excited molecule.<br />
Fig. 3. SiNaph, the chosen fuel-tax-evasion project marker, in its single<br />
macromolecule structure.<br />
6
Table 1. SiNaph descrip<strong>to</strong>rs<br />
Name: Silicon 2,3-naphthalocyanine bis(trihexylsilyloxide)<br />
Synonym: 2,3-Naphthalocyanina<strong>to</strong>-bis(trihexylsiloxy)silane,<br />
Bis(trihexylsiloxy)silicon 2,3-naphthalocyanine<br />
CAS number: 92396-88-8<br />
Beilstein registry number: 4348502<br />
Linear formula: C84H102N8O2Si3<br />
Molecular weight: 1340.02<br />
2.1.2 Marking or Tagging <strong>of</strong> <strong>Fuel</strong>s<br />
Melting point: 270 °C (dec.)(lit.)<br />
UV absorption: λmax 729 nanometer (nm)<br />
λmax 774 nm (2nd)<br />
Marking, tagging, or dyeing <strong>of</strong> heating and vehicular fuels has been implemented widely over the last<br />
three decades <strong>to</strong> differentiate lower taxed and/or higher polluting fuels used for industrial endeavors,<br />
aviation, marine navigation, and home heating from au<strong>to</strong>motive fuels. The greater volume <strong>of</strong> these onroad<br />
fuels used results in a significant revenue stream from increased tax rates. In addition, environmental<br />
regula<strong>to</strong>ry agencies provide guidelines regarding on-road fuels as a source <strong>of</strong> sulfur, nitrogen oxides, and<br />
groundwater contamination. Significant pollution could occur were there not strict limitations imposed <strong>to</strong><br />
keep the levels <strong>of</strong> insulting species as low as possible for on-road fuels. Most currently fielded strategies<br />
<strong>to</strong> tag fuel mark the lower-taxed stream and require sampling <strong>of</strong> the fuel from the consumer end. The FTE<br />
project has proved an approach <strong>to</strong> mitigating FTE at the distribu<strong>to</strong>r end for on-road au<strong>to</strong>motive diesel via<br />
a more-real-time, lower-concentration, less-perceptible fuel marking strategy that relies upon<br />
fluorescence, not absorbance or titration. The discussion below introduces the two main marker systems<br />
already fielded, one in Europe and one domestically, <strong>to</strong> create a context for the novel nature <strong>of</strong> the FTE<br />
project proved in concept by the ORNL team.<br />
Solvent Yellow 124 is a yellow “azo dye” (organic chromophores containing amino acid groups that can<br />
be neutral or ionic) added <strong>to</strong> fuels not intended for au<strong>to</strong>motive use in the European Union countries <strong>to</strong><br />
differentiate those road vehicle fuels from home heating fuels. It is a marker used since August 2002 <strong>to</strong><br />
distinguish diesel fuel intended for heating from a higher-taxed mo<strong>to</strong>r diesel fuel. The dye is added <strong>to</strong><br />
lower-taxed non-road fuels in amounts <strong>of</strong> 6 mg/L or 7 mg/kg (or ppm) under the name Euromarker. This<br />
dye can be easily hydrolyzed with acids; splits <strong>of</strong>f the acetal group are responsible for its miscibility in<br />
hydrocarbons and lead <strong>to</strong> the formation <strong>of</strong> a hydrophilic form similar <strong>to</strong> the common methyl orange food<br />
and clothing dye. A pH value in the acidic range leads <strong>to</strong> a red colorimetric reading detectable in fuel at<br />
300 parts per billion via extraction <strong>to</strong> hydrochloric acid. These operations require manpower, sample<br />
destruction, and time <strong>to</strong> identify the marker in fuel samples, steps that the FTE project and the ORNL<br />
team sought <strong>to</strong> avoid incorporating in the ultimate deployment <strong>of</strong> the tax evasion mitigation strategy. The<br />
amount <strong>of</strong> Solvent Yellow 124 added <strong>to</strong> the fuel is determined via a much more tedious method than our<br />
online sensor, namely by removing samples from the fuel lines and by measuring the Euromarker content<br />
in the fuel. In this way, it is possible for cus<strong>to</strong>ms agents (equivalent <strong>to</strong> our tax <strong>of</strong>ficers) <strong>to</strong> calculate how<br />
much <strong>of</strong> the low-taxed fuel was added <strong>to</strong> the legal one, regardless <strong>of</strong> the usage <strong>of</strong> such scam techniques as<br />
duel fuel tanks or dummy reservoirs. Current trends in the European Union countries include efforts by<br />
Great Britain <strong>to</strong> circumvent the “laundering” or chemically bleaching/leaching <strong>of</strong> dye out <strong>of</strong> the diluted<br />
fuel as well as replacement for a biological marker in Denmark.<br />
7
Solvent Red 26, also known as C.I. 26120, is also an azo dye created synthetically and utilized for<br />
colorimetric distinction <strong>of</strong> higher-sulfur-content, tax-reduced, or tax-exempt agricultural and heavy<br />
equipment diesel and lighter home heating oils from au<strong>to</strong>motive diesel fuel. Colorimetric markers are<br />
measured by the absorbance <strong>of</strong> light, not their emitted light detection as in the case with fluorimetric<br />
markers such as SiNaph. Solvent Red 26, whose chemical formula is C25H22N4O, or 1-[[2,5-dimethyl-4-<br />
[(2-methylphenyl)azo]-phenyl]azo]-2-naphthol, is soluble in oils and insoluble in water. Replacement <strong>of</strong><br />
Solvent Red 26 with Solvent Red 164 is increasingly common due <strong>to</strong> its longer alkyl chains which<br />
facilitate an increased solubility in the hydrocarbon matrices it marks. The IRS, which governs taxation,<br />
requires 11.13 mg/l Solvent Red per liter <strong>of</strong> fuel; the EPA, which governs sulfur regulations, requires<br />
fivefold less. Both values are based on the integrated optical spectroscopic response <strong>of</strong> the colorimetric<br />
dye in a given wavelength range, since the batch-<strong>to</strong>-batch variations in the chemistry <strong>of</strong> unrefined dyes<br />
such as these can produce significant variations in the exact absorbance or fluorescent (in the case <strong>of</strong><br />
unrefined SiNaph lots) responses and magnitudes.<br />
Table 2 presents a wider swath <strong>of</strong> the fuel dyes used worldwide. All <strong>of</strong> these are either sampled (not real<br />
time/online), colorimetric, titration, or placed in <strong>of</strong>f-road fuels.<br />
Shortcomings <strong>of</strong> currently fielded fuel marking methodology that our approach seeks <strong>to</strong> mitigate include<br />
lack <strong>of</strong> response sensitivity in colorimetric systems, lack <strong>of</strong> a real-time measurement capability, and<br />
personnel-intensive moni<strong>to</strong>ring scheme.<br />
2.2 SELECTION OF FUEL MARKER<br />
Two aspects <strong>of</strong> the fuel marker figured equally importantly in the selection <strong>of</strong> a compound <strong>to</strong> indicate<br />
illegal fuel dilution. Generally these descrip<strong>to</strong>rs fall in<strong>to</strong> the categories <strong>of</strong> optical performance and<br />
au<strong>to</strong>motive compatibility.<br />
The first is the requirement attendant <strong>to</strong> the optical and chemical characteristics <strong>of</strong> a dye. Along this line,<br />
the compound needed <strong>to</strong><br />
• exhibit intense (high yield) fluorescence <strong>to</strong> minimize the amount <strong>of</strong> marker needed, thereby<br />
minimizing cost and ensuring the concentration <strong>of</strong> marker in the fuel falls below the EPA rule <strong>of</strong><br />
3% difference for fuel additives;<br />
• emit fluorescence in a spectral region distinct from that <strong>of</strong> diesel and other fielded fuel colorants<br />
for clear identification <strong>of</strong> the concentration level; and<br />
• be highly miscible with diesel fuel <strong>to</strong> ensure the concentration <strong>of</strong> marker is consistent throughout.<br />
The second requirement centers on the fact that this marker system will exist in a combustible fuel<br />
system. Hence, in addition <strong>to</strong> the optical requirements detailed above, the compound must also<br />
• pose no calculable threat <strong>to</strong> an internal combustion engine via accumulations <strong>of</strong> salts or heavy<br />
metals within fuel systems, and<br />
• any non-combustible component <strong>of</strong> the dye would need <strong>to</strong> be present at levels low enough <strong>to</strong> be<br />
comparable <strong>to</strong> other inorganic contributions <strong>to</strong> fuel systems due <strong>to</strong> existing chemicals present<br />
such as lube oil.<br />
Identifying a fuel marker that met these requirements was an iterative process, beginning with surveys <strong>of</strong><br />
the academic literature and existing fielded technologies for fuel marking and tracking. These intensive<br />
surveys were followed by initial experimental assays <strong>of</strong> promising marker candidates. From an early field<br />
<strong>of</strong> four <strong>to</strong> six candidates, one was chosen. After aging studies proved that marker <strong>to</strong> be substandard in<br />
meeting all our desired expectations for the marker, new chemistries <strong>to</strong> <strong>of</strong>fer similar or greater optical<br />
8
Table 2. Dyes used for fuel marking worldwide<br />
(Source: http://www.wikipedia.com/fueldyes)<br />
Country <strong>Fuel</strong> Dye<br />
Australia Regular Unleaded Petrol Purple (or Bronze)<br />
Premium Unleaded Petrol Yellow<br />
Austria Heating oil Any red dye<br />
Canada Agricultural <strong>Fuel</strong> Red/purple dye<br />
Finland Heating oil Furfural and Solvent Yellow 124<br />
Diesel for construction and<br />
agriculture<br />
France Gas oil Solvent Red 24<br />
Marine diesel Solvent Blue 35<br />
9<br />
Furfural and Solvent Yellow 124<br />
Es<strong>to</strong>nia Heating oil Au<strong>to</strong>mate Red NR or similar + Solvent Yellow 124<br />
Agricultural diesel Au<strong>to</strong>mate Blue 8 GHF or similar + Solvent Yellow 124<br />
Germany Heating oil Solvent Yellow 124 and similar<br />
Greece Heating oil Any red dye<br />
Marine diesel Any black dye<br />
Ireland Gas oil Solvent Blue 79<br />
Kerosene Solvent Red 19 and similar<br />
Italy Heating oil Solvent Red 161<br />
Gas oil Solvent Green 33<br />
Netherlands Agricultural diesel Any red dye and the additive Furfural<br />
Norway Agricultural diesel Any green dye<br />
Portugal Agricultural diesel Solvent Blue 35<br />
Heating oil Solvent Red 19 and similar<br />
Spain Agricultural diesel Any red dye<br />
Heating oil Any blue dye<br />
Sweden Heating oil Solvent Blue 35, Solvent Blue 79, Solvent Blue 98<br />
United Kingdom Gas oil (“Red Diesel”) Solvent Red 24, quinizarin<br />
Rebated kerosene Coumarin<br />
European Union Many rebated Solvent Yellow 124 (“Euromarker”)<br />
United States Low-tax fuels, high-sulfur fuels Solvent Red 26, Solvent Red 164<br />
Worldwide Aviation gasoline 80/87 Red dye<br />
Aviation gasoline 82UL Purple dye<br />
Aviation gasoline 100LL Blue dye<br />
Aviation gasoline 100/130 green dye
esponse accompanied by increased chemical stability were identified. Out <strong>of</strong> this effort came the<br />
discovery <strong>of</strong> SiNaph as a solution for FTE project fuel marker. A discussion <strong>of</strong> current fuel additives as<br />
well as a description <strong>of</strong> the chemicals in diesel fuel that attacked early marker follows. This information<br />
helps frame where SiNaph falls in the scheme <strong>of</strong> fuel additives, and what it means for it <strong>to</strong> withstand acid<br />
attack and thereby maintain a stable optical response over the course <strong>of</strong> months. Both these aspects relate<br />
directly back <strong>to</strong> the requirements set forth above for a successful fuel marker moiety.<br />
2.2.1 Required Marker Characteristics: Compatibility as a <strong>Fuel</strong> Additive<br />
Nickel and vanadium, among other earthen metals, are inherent in the raw petroleum sources that can<br />
contaminate refined diesel and foul au<strong>to</strong>motive mechanisms and the environment over time. More metals<br />
can be introduced during fuel production and s<strong>to</strong>rage, such as copper, iron, nickel, and zinc. In addition,<br />
other components can accumulate within engines or in emissions that result from fuel-performanceimproving<br />
additives. The ORNL FTE project team evaluated these levels <strong>of</strong> metals, inorganic<br />
compounds, and larger organic molecules <strong>to</strong> illustrate the fact that SiNaph adds no insult <strong>to</strong> the engine or<br />
environment outside the bounds <strong>of</strong> existing fuel and oil contents. Table 3 lists common additives <strong>to</strong> diesel<br />
mo<strong>to</strong>r fuels. <strong>Fuel</strong> additives, generally speaking, comprise chemical substances added <strong>to</strong> gasoline, diesel,<br />
kerosene, and other fuels <strong>to</strong> impart or improve certain properties. Ace<strong>to</strong>ne, ether, nitrous oxide (nitrous),<br />
nitromethane (nitro), butyl rubber, ferox, oxyhydrogen, ferrous picrate, silicone and other anti-foaming<br />
agents, and tetranitromethane, fuel injec<strong>to</strong>r cleaners, fuel injec<strong>to</strong>r treatments, octane boosters, diesel fuel<br />
treatments, and water removers are also available. Additional categories <strong>of</strong> fuel additives include<br />
antioxidants, hybrid compound blends, oxygenates, antiknock agents, leader scavengers, fuel dyes, metal<br />
deactiva<strong>to</strong>rs, and corrosion inhibi<strong>to</strong>rs. Both nitrous oxide (nitrous) and nitromethane (nitro) are used in<br />
au<strong>to</strong> racing and other high-performance applications. Ace<strong>to</strong>ne is a vaporization additive used mainly with<br />
methane racing fuel. Butyl rubber is a detergent for diesel fuel injec<strong>to</strong>rs, while ferox is an engine catalyst<br />
that improves fuel economy and reduces emissions in gasoline engines. Ferrous picrate and oxyhydrogen<br />
are also used <strong>to</strong> improve fuel mileage. Silicone is used as anti-foaming agent in diesel engines. <strong>Fuel</strong><br />
additives such as tetranitromethane can help <strong>to</strong> improve the combustion properties <strong>of</strong> diesel fuel. Finally,<br />
lubricants can, over time, migrate in<strong>to</strong> fuel lines and, when burned, build up components like zinc and<br />
silicon, which are deposited in<strong>to</strong> the diesel particulate filter. After calculating the contribution <strong>of</strong> silicon<br />
from SiNaph <strong>to</strong> a diesel particulate filter over time, and in consultation with diesel particulate filtration<br />
(DPF) and lube oil researchers within ORNL, it was determined that the levels <strong>of</strong> silicon or silicon<br />
dioxide resulting from SiNaph marking <strong>of</strong> diesel fuel were adequately low <strong>to</strong> fall within the range <strong>of</strong><br />
inorganic oxide deposition due <strong>to</strong> lube oil and engine wear.<br />
Table 3. Diesel mo<strong>to</strong>r fuel additives<br />
Purpose Identity Amount<br />
Ignition improvers n-hexyl nitrate 0.2%<br />
Stability improvers Peptizing agents a (can be acidic or basic) 100 ppm<br />
Corrosion stabilizers Sulfonates 50 ppm<br />
Conductivity improvers Polymeric amine salt Not listed<br />
Winter de-icer Ethanol 0.1%<br />
a<br />
Peptizing agents enhance dispersion <strong>of</strong> a substance in<strong>to</strong> colloidal form and contributes <strong>to</strong> colloidal<br />
stability once formed. These are surface-active molecules added <strong>to</strong> a suspending medium <strong>to</strong> promote<br />
uniform and maximum separation <strong>of</strong> extremely fine solid particles, <strong>of</strong>ten <strong>of</strong> colloidal size.<br />
As an extended example <strong>of</strong> the levels <strong>of</strong> silicon, which was our main concern for accumulation in the<br />
engines <strong>of</strong> vehicles burning diesel marked with SiNaph, it is highlighted in the ISO 8217 parameters in<br />
Table 4 that aggregate aluminum and silicon much be at 80 ppm or below. In our marked diesel, silicon is<br />
at 800 parts per billion (ppb), an order <strong>of</strong> magnitude lower than this example. This lent early<br />
10
encouragement <strong>to</strong> the utility <strong>of</strong> the SiNaph marker system, although marine fuels were not the primary<br />
target for SiNaph marking.<br />
Table 4. Some parameters <strong>of</strong> marine fuel oils according <strong>to</strong> ISO 8217 (3rd Ed., 2005)<br />
Marine residual fuels (RMA30—RME 180 denote different grades)<br />
Parameter Unit Limit RMA 30 RMB 30 RMD 80 RME 180<br />
Density at 15°C kg/m 3 Max 960.0 975.0 980.0 991.0<br />
Viscosity at 50°C mm²/s Max 30.0 30.0 80.0 180.0<br />
Water % V/V Max 0.5 0.5 0.5 0.5<br />
Sulfur a % (m/m) Max 3.5 3.5 4.0 4.5<br />
Aluminum + Silicon b mg/kg Max 80 80 80 80<br />
Flash point c °C Min 60 60 60 60<br />
Pour point, Summer °C Max 6 24 30 30<br />
Pour point, Winter °C Max 0 24 30 30<br />
a Maximum sulfur content is 1.5% in designated areas.<br />
b The aluminum+silicon value is used <strong>to</strong> check for remains <strong>of</strong> the catalyst after catalytic cracking. Most catalysts<br />
contain aluminum or silicon, and remains <strong>of</strong> catalyst can cause damage <strong>to</strong> the engine.<br />
c The flash point <strong>of</strong> all fuels used in the engine room should be at least 60°C.<br />
A final evaluation <strong>of</strong> the SiNaph as compatible in engines did not come until deep in<strong>to</strong> the marker-sensor<br />
characterization when a sensitivity determination could be made and the linear dynamic range <strong>of</strong> the <strong>to</strong>tal<br />
system was defined. Several days <strong>of</strong> effort, including searches <strong>of</strong> commercial and scientific literature as<br />
well as consultation with fuel scientists within ORNL and with contacts in the commercial fuel blending<br />
sec<strong>to</strong>r, concluded that the amount <strong>of</strong> silicon contributed <strong>to</strong> the engine from this marker system at 1 ppm<br />
(~60 ppb silicon) concentration dye in diesel is well below what is introduced by lubricating oil and other<br />
external sources, and therefore poses no threat <strong>to</strong> engine performance or emissions characteristics. Once<br />
the level <strong>of</strong> 800 ppb <strong>of</strong> SiNaph was established as a detectable concentration for fuel marking with the<br />
current sensor system, a calculation was executed <strong>to</strong> determine that the amount <strong>of</strong> silicon dioxide<br />
produced over 100,000 miles driven by a 20 mile per gallon vehicle is 1.405 g. The levels <strong>of</strong> silicon<br />
contributed by the SiNaph are well within a range comparable <strong>to</strong> other inorganic materials that are used in<br />
fuel and lubricant oil additives such as zinc. This finding was promising in the process <strong>of</strong> moving the fuel<br />
marker system in<strong>to</strong> a potential position <strong>of</strong> commercialization.<br />
2.2.2 Required Marker Characteristics: Utility as a Tracking Moiety<br />
The identification <strong>of</strong> an appropriate fuel taggant began with an extensive literature searches <strong>to</strong> determine<br />
which dyes or tags are already being utilized in the field, both in the United States and abroad. This serves<br />
multiple purposes, including<br />
• identifying which wavelength ranges our own chosen taggant will have <strong>to</strong> avoid <strong>to</strong> mitigate<br />
interference from diluent dyes and<br />
• familiarizing the research team with the various chemistries employed <strong>to</strong> achieve dye-fuel<br />
miscibility, engine compatibility, and environmental impact.<br />
Several dyes were identified <strong>to</strong> include the most probable diluent fuel dyes based on usage in untaxed<br />
diesel fuel in the United States; as indicated above, the selected taggant must fluoresce in a range outside<br />
that <strong>of</strong> these existing dyes. These dyes included Solvent Red 26 (agricultural diesel), Solvent Yellow 124,<br />
also known as EuroMarker (some marine and heating fuels in the United States, all transportation diesel<br />
in the European Union), Solvent Orange 7 (some fuel ethanol in United States and all fuel ethanol in<br />
Brazil), and Solvent Blue 59 (marine diesel in United States). Aviation fuel in the United States is dyed<br />
11
green or purple; green is generally based on a cyanine dye and purple from a mix <strong>of</strong> blue anthraquinone<br />
and red azo dyes, in most cases. In the process <strong>of</strong> identifying these dyes, a survey was made <strong>of</strong> similar<br />
dyes from Sigma-Aldrich <strong>to</strong> evaluate their ranges <strong>of</strong> absorption <strong>of</strong> light in order <strong>to</strong> estimate orthogonality<br />
with existing, potentially interfering fielded diesel dyes. One common characteristic among existing fuel<br />
dyes included that the dye molecule should be a neutral organic and not contain metallic moieties, which<br />
could lead <strong>to</strong> engine reactivity and corrosiveness or shifts in spectral response due <strong>to</strong> chemical<br />
complexation or intramolecular rearrangement. The most prevalent dye structures are shown in Fig. 4,<br />
both for fielded dyes and markers novel <strong>to</strong> fuel marking used in the FTE project (but not ultimately<br />
selected due <strong>to</strong> degradation, as discussed later).<br />
Fig. 4. Some representative structures <strong>of</strong> several prominent fielded fuel dyes (A–C) and candidate<br />
dyes tested but not selected for the fuel tax evasion project (D and E).<br />
Standard samples <strong>of</strong> the already-fielded dyes listed above were ordered <strong>to</strong> allow UV-visible absorbance<br />
and fluorescence measurements <strong>to</strong> be made on them in the concentrations commensurate with use in<br />
pump diesel. S<strong>to</strong>ck solutions for spectral interrogation were spiked <strong>to</strong> contain 7 ppm dye in diesel. This<br />
concentration matches the levels <strong>of</strong> Solvent Yellow 124 used in transportation diesel in the European<br />
Union and strikes a balance between the 3 ppm Solvent Blue 59 used in marine and aviation diesel and<br />
the 15 ppm Solvent Red 26 used in agricultural diesel here in the United States. Moreover, these s<strong>to</strong>ck<br />
solutions were mixed in<strong>to</strong> unmarked diesel at 3% and 30% “untaxed” loading, for example, <strong>to</strong> simulate a<br />
situation where someone had diluted taxed pump diesel with as high as 1/3 and as low as 1/33 volumes <strong>of</strong><br />
untaxed (dyed) diesel. Absorbance and fluorescence data described in detail below is shown in Fig. 5<br />
through Fig. 7.<br />
12
Fig. 5. Absorbance measurements with IR676 (“novel marker”) and agricultural diesel demonstrating lack <strong>of</strong><br />
interference with fuel-tax-evasion project long wavelength marker’s spectral region by Solvent Red 26/164based<br />
agricultural diesel dye.<br />
Fig. 6. Fluorescence spectra collected for pump diesel <strong>to</strong> determine whether competing fluorescence in the<br />
wavelength region <strong>of</strong> excitation above 630 nm would pose any significant interference, and none was noted.<br />
13
Fig. 7. Fluorescence spectra collected for pump diesel containing the fielded fuel dye Solvent Yellow 124 <strong>to</strong><br />
determine whether competing fluorescence in wavelength region <strong>of</strong> excitation above 630 nm would pose any<br />
significant interference, and none was noted.<br />
Specifically, each compound or mixture <strong>of</strong> isomers from a list <strong>of</strong> seven potential dye markers emissive<br />
beyond 650 nm and novel <strong>to</strong> fuel applications was tested for the following characteristics:<br />
• solubility in a suitable delivery solvent (ace<strong>to</strong>ne, methanol, ethanol, hexane; all are acceptable<br />
based on environmental and engine performance parameters);<br />
• miscibility <strong>of</strong> marker/delivery solvent s<strong>to</strong>ck solution with diesel at a range <strong>of</strong> mass loadings<br />
spanning 15 ppb <strong>to</strong> 28 ppm;<br />
• appreciable fluorescence emission as tested on a bench<strong>to</strong>p fluorimeter using both the<br />
manufacturer-reported maximum and absorbance maxima experimentally determined during<br />
excitation and emission scans; and<br />
• ability <strong>to</strong> discerning the exact wavelengths <strong>of</strong> greatest emission due <strong>to</strong> a particular excitation<br />
energy was important <strong>to</strong> maximizing the efficiency <strong>of</strong> dye sensing since these dyes have never<br />
been tested in hydrocarbon or diesel matrices. (Excitation and emission energies can shift slightly<br />
due <strong>to</strong> solvent environment.)<br />
Two candidate dye markers were down-selected from the list <strong>of</strong> seven based on their solubility and<br />
emissive performance, and each <strong>of</strong> these was tested for altered optical output due <strong>to</strong> interference from<br />
agricultural diesel, which contains a non-fluorescent red dye. No interference was measured for pump<br />
diesel sample containing 0.3 ppm novel marker, 1.5 ppm novel marker, and 7 ppm novel marker for a<br />
range <strong>of</strong> dilutions by agricultural diesel (0.5%, 5%, 10%, 15%, and 30% volume dilution by agricultural<br />
diesel in each <strong>of</strong> the three marked diesel concentrations). Figure 5 shows that the only change effected by<br />
dilutions by agricultural diesel is the decrease in the broadband fluorescence response <strong>of</strong> the marker<br />
IR676 centered at ~695 nm. This was expected due <strong>to</strong> the dilution itself, and no dimerization or<br />
quenching effects <strong>of</strong> the novel marker’s emission results from the introduction <strong>of</strong> the red dye molecules<br />
with agricultural diesel mixing, again as shown in Fig. 5. Note that addition <strong>of</strong> agricultural diesel reduces<br />
(and is not additive <strong>to</strong>) the absorbance in the magnitude <strong>of</strong> its dilution <strong>of</strong> the IR676 marked diesel.<br />
To determine the level <strong>of</strong> fluorescence interference we could expect from the fielded dye standards in<br />
diesel, fluorimetry (quantitative measurement <strong>of</strong> the fluorescent response over a given spectral range) was<br />
carried out on these samples in pump diesel. These data are shown in Fig. 6 and Fig. 7 with descriptive<br />
titles on each panel. After several iterations <strong>of</strong> excitation <strong>of</strong> pump diesel, it was determined that any<br />
illumination below 575–600 nm generated some fluorescent background from the diesel fuel alone as well<br />
14
as from the Solvent Yellow 124 at 7 ppm. Next, an excitation wavelength <strong>of</strong> 633 nm was chosen, which is<br />
commensurate with widely available, respectably high-powered and low-cost helium-neon gas lasers<br />
(632.8 nm) and red diode lasers (635 nm). None <strong>of</strong> the currently fielded dyes or the pump diesel itself<br />
showed any significant fluorescent response <strong>to</strong> the 633 nm wavelength excitation. These data are included<br />
in Appendix A. This held true for the 690 nm line that was ultimately chosen as well. These early marker<br />
tests and literature survey gave us a significant direction for specifying a taggant and detection system.<br />
After this survey, it was determined that a long visible or near-infrared wavelength <strong>of</strong> excitation would<br />
serve best <strong>to</strong> avoid interference from existing diesel and fuel dye fluorescence; therefore, a marker<br />
chemistry <strong>to</strong> facilitate fluorescence in that range was sought accordingly. During this decision-making<br />
period, the <strong>Fuel</strong>-in-Oil (now DaFiO®) laser-induced fluorescence spectroscopy system was discussed<br />
with one <strong>of</strong> its ORNL inven<strong>to</strong>rs, with the Sensor Team and <strong>Fuel</strong> Marker Team, for issues such as sensor<br />
drift, optic clouding, and signal <strong>to</strong> background. The decision was made <strong>to</strong> focus on laser-induced<br />
fluorescent direct detection <strong>of</strong> a high-fluorescence quantum yield diesel marker. A more complete<br />
description <strong>of</strong> the advantages, basic detection components, and specific requirements for this project <strong>of</strong><br />
laser-induced fluorescence (LIF) is provided in the sensors section <strong>of</strong> this report. Briefly, using a laser <strong>to</strong><br />
excite fluorescence <strong>of</strong> a dye taggant in a region <strong>of</strong> the electromagnetic spectrum (in our case, the visible<br />
spectrum above 630 nm) where the diesel and other diluent dyes show little <strong>to</strong> no emissive properties, as<br />
can be seen in the fluorescence emission scans in Fig. 7, lends an advantage in sensitivity <strong>to</strong> the detection<br />
technique. Ultimately, it was also decided by the sensors team that a spectral ratio method would give the<br />
most reliable quantitation <strong>of</strong> the marker level. Two wavelengths, mutually exclusive <strong>of</strong> detecting diesel<br />
and the marker, were identified. One measures diesel fluorescence at 405 nm excitation, and one<br />
measures marker fluorescence with excitation in the high 600 nm range. Early testing <strong>of</strong> the IR676<br />
marker indicated such a scheme would function, and the spectral evidence <strong>of</strong> mutual exclusivity is shown<br />
in Fig. 8.<br />
Fig. 8. Diesel fuel is excited with 405 nm light (left) and 676 nm light (right).<br />
Although the exciting radiation is visible in these spectra, the lack <strong>of</strong> significant fluorescent emission at<br />
676 nm relative <strong>to</strong> 405 nm indicated that a ratiometric spectral quantitation would work well with this<br />
system; that is, differences between different concentrations <strong>of</strong> the taggant would be discernable with<br />
good resolution.<br />
After a general approach and wavelength ranges desirable for the marker emission were identified, a<br />
broad range <strong>of</strong> dye concentrations in diesel were tested for the linearity <strong>of</strong> their fluorescence responses on<br />
the bench<strong>to</strong>p commercial fluorimeter and, later, on the self-referencing pro<strong>to</strong>type built by the Sensor<br />
Team. This broad characterization shown in Fig. 9 indicated two pertinent results:<br />
15
Response fac<strong>to</strong>r, marker <strong>to</strong><br />
0.600<br />
0.500<br />
0.400<br />
0.300<br />
0.200<br />
0.100<br />
0.000<br />
0 0.1 0.2 0.3 0.4 0.5 0.6 0.7 0.8 0.9<br />
Fig. 9. Broad range calibration <strong>of</strong> IR676 in diesel on the pro<strong>to</strong>type self-referencing fuel marker<br />
sensor.<br />
• a useful range over which the dye should be tested using much smaller incremental<br />
concentrations was identified, and<br />
• the self-referencing fuel marker sensor pro<strong>to</strong>type was shown <strong>to</strong> be functional, and at least an<br />
order <strong>of</strong> magnitude more sensitive than the labora<strong>to</strong>ry bench<strong>to</strong>p fluorimeter.<br />
This result is not surprising in view <strong>of</strong> the fact that lasers and bandpass filters are used instead <strong>of</strong> a<br />
broadly emissive lamp and dispersive gratings, as in the bench<strong>to</strong>p system. Lasers <strong>of</strong>fer higher <strong>to</strong>tal power<br />
at wavelengths more centered at the relevant energy for dye and diesel excitation, and judiciously selected<br />
filters increase throughput at chosen wavelengths where the response is strongest with less loss <strong>of</strong> <strong>to</strong>tal<br />
power due <strong>to</strong> dispersion in a grating.<br />
Next, a range <strong>of</strong> concentrations was tested within the linear region <strong>of</strong> the concentrations probed during the<br />
linear dynamic range investigation. These data are shown in Fig. 10. This set <strong>of</strong> experiments was carried<br />
out <strong>to</strong> more closely moni<strong>to</strong>r change in signal with change in amount <strong>of</strong> dye added on the self-referencing<br />
pro<strong>to</strong>type built by the Sensor Team. <strong>Solution</strong>s were prepared by mass via serial dilution and measured in<br />
a cuvette; the whole series (ascending order) was measured three times. This focused-range<br />
characterization indicated two pertinent results:<br />
• a useful range over which the dye should be tested using much smaller incremental<br />
concentrations was identified, and<br />
• the self-referencing fuel marker sensor pro<strong>to</strong>type was confirmed <strong>to</strong> be functional, and at least an<br />
order <strong>of</strong> magnitude more sensitive than the labora<strong>to</strong>ry bench<strong>to</strong>p fluorimeter.<br />
16<br />
Conc marker in diesel (ppm)
Fig. 10. Focused-range incremental calibration curve <strong>of</strong> IR676 in diesel on the<br />
pro<strong>to</strong>type self-referencing fuel marker sensor.<br />
After fluorescence by a long-wavelength-emitting dye was identified as the detection route <strong>of</strong> choice for<br />
fuel marker dilution moni<strong>to</strong>ring, new dyes were then identified and tested for high fluorescent yield in<br />
diesel and longer-term stability. These included molecules with similar structural characteristics <strong>to</strong> the<br />
previously tested compounds, in the hope that the favorable diesel solubilities observed with the<br />
degradable dye would remain. These candidates were surveyed over a period commensurate with duration<br />
<strong>of</strong> marker persistence desired by the user community. The experiments were conducted using the<br />
independent labora<strong>to</strong>ry fluorimeter as well as the modified bench<strong>to</strong>p pro<strong>to</strong>type laser-induced fluorescence<br />
detection system. In this manner, two goals, (1) persistent marker identification and (2) preliminary<br />
pro<strong>to</strong>type validation, can be accomplished nearly simultaneously.<br />
2.3 AGING AND CHEMICAL STABILITY TESTING<br />
2.3.1 IR676<br />
Samples <strong>of</strong> diesel fuel spiked with various amounts IR676 dye were examined by absorption and<br />
emission spectroscopy <strong>to</strong> follow the fate <strong>of</strong> the dye with time. Figure 11 shows the absorption spectra <strong>of</strong><br />
samples containing 0.052 ppm IR676, 0.079 ppm IR676, 0.11 ppm IR676, 9.4 ppm IR676, and one<br />
“blank” sample, containing no dye, taken on March 30, 2010.<br />
As the data indicates, only the sample containing 9.4 ppm IR676 shows a broad peak around<br />
500–750 nm, indicative <strong>of</strong> dye absorption. Figure 12 shows the emission spectra <strong>of</strong> all the samples<br />
excited at 639 nm taken on March 30, 2010.<br />
It is clear from the graph that samples with less than 1 ppm IR676 hardly emit in the region where IR676<br />
emits. However, sample 84-8, which contains 9.4 ppm IR676, shows a good emission. Figure 13 shows<br />
the emission spectra <strong>of</strong> all the samples taken on April 7, 2010.<br />
As can be seen from the graph, besides the 9.4 ppm sample, the samples all show practically no emission<br />
in the region where IR676 emits. Figure 14 shows the changes in the absorption spectra <strong>of</strong> the samples<br />
with time taken on April 13, 2010.<br />
17
Fig. 11. Absorption spectra <strong>of</strong> IR676 at concentrations ranging from 0.052 ppm–9.4 ppm collected<br />
after no wait time.<br />
Fig. 12. Emission spectra collected after no wait time <strong>of</strong> IR676 samples in diesel.<br />
18
Fig. 13. Emission spectra collected after 1 week <strong>of</strong> aging <strong>of</strong> IR676 samples in diesel.<br />
Fig. 14. Absorption spectra after 2 weeks <strong>of</strong> IR676 aging in diesel fuel.<br />
19
Comparison <strong>of</strong> Fig. 14 with Fig. 11 reveals that only the absorption <strong>of</strong> the sample containing 9.4 ppm<br />
IR676 in the 500–750 nm region has decreased considerably. The emission spectra <strong>of</strong> the samples taken<br />
on April 13, 2010, are shown in Fig. 15.<br />
Fig. 15. Emission spectra collected after 2 weeks <strong>of</strong> aging <strong>of</strong> IR676 samples in diesel.<br />
It is clear from the data that only the sample containing 9.4 ppm showed a significant emission, and all<br />
the other ones show none. Interestingly, the emission <strong>of</strong> the 9.4 ppm sample appears <strong>to</strong> have increased<br />
with time, as shown in Fig. 16.<br />
Fig. 16. Change in emission spectrum <strong>of</strong> over time for the highest concentration <strong>of</strong><br />
IR676 in diesel.<br />
20
This increase may be due <strong>to</strong> slow dissolution <strong>of</strong> IR676 at higher concentrations in diesel fuel. The sample<br />
containing 9.4 ppm IR676 was checked finally at an aging time <strong>of</strong> 3 weeks (April 20, 2010) and showed<br />
an emission decrease <strong>to</strong>
contaminant surrogate samples were followed with absorbance measurements confirmed the hypothesis<br />
that acids in diesel were the root cause <strong>of</strong> emission degradation in all cases but that <strong>of</strong> SiNaph.<br />
Fig. 18. Naphthenic acids are prevalent in diesel and other heavier hydrocarbon fuels. Shown are typical<br />
naphthenic acid structures, where R = alkyl. For the acyclic case, z = 0 and the structure is simply R-COOH.<br />
What follows is an eloquent and concise discussion <strong>of</strong> naphthenic acids, shown in Fig. 18, intrinsic in<br />
diesel fuel.<br />
The following excerpt is from the Kirk-Othmer Encyclopedia <strong>of</strong> Chemical Technology. 1<br />
Chemically, naphthenic acids behave like typical carboxylic acids with similar acid<br />
strength as the higher fatty acids. Dissociation constants are on the order <strong>of</strong> 10−5 <strong>to</strong><br />
10−6 (15). They are slightly weaker acids than low molecular weight carboxylic acids<br />
such as acetic, but are stronger acids than phenol and cresylic acid. Whereas the principal<br />
use <strong>of</strong> naphthenic acids has been in the production <strong>of</strong> metal salts, they also can react <strong>to</strong><br />
form esters, amine salts, amides, imidazolines, and many other derivatives (see Esters,<br />
organic; Amides). Derivatives <strong>of</strong> naphthenic acid <strong>of</strong>ten have advantageous physical<br />
properties over fatty acid derivatives, particularly their high stability <strong>to</strong> oxidation and<br />
solubility in hydrocarbons. Naphthenic acid corrosion has been a problem in petroleumrefining<br />
operations since the early 1900s. Naphthenic acid corrosion data have been<br />
reported for various materials <strong>of</strong> construction (16), and correlations have been found<br />
relating corrosion rates <strong>to</strong> temperature and <strong>to</strong>tal acid number (17). Refineries processing<br />
highly naphthenic crudes must use steel alloys; 316 stainless steel [11107-04-3] is the<br />
material <strong>of</strong> choice. Conversely, naphthenic acid derivatives find use as corrosion<br />
inhibi<strong>to</strong>rs in oil-well and petroleum refinery applications. Naphthenic acids occur in a<br />
wide boiling range <strong>of</strong> crude oil fractions, with acid content increasing with boiling point<br />
<strong>to</strong> a maximum in the gas oil fraction (ca 325°C). Jet fuel, kerosene, and diesel fractions<br />
are the source <strong>of</strong> most commercial naphthenic acid. The acid number <strong>of</strong> the naphthenic<br />
acids decreases as heavier petroleum fractions are isolated, ranging from 255 mg KOH/g<br />
22
for acids recovered from kerosene and 170 from diesel, <strong>to</strong> 108 from heavy fuel oil (19).<br />
The amount <strong>of</strong> unsaturation as indicated by iodine number also increases in the high<br />
molecular weight acids recovered from heavier distillation cuts.<br />
We postulate that these compounds are largely responsible for the degradation <strong>of</strong> IR 676 and other dyes<br />
not workable in the long term for diesel fuel due <strong>to</strong> acid attack and cleaving <strong>of</strong> the fluorophore structure.<br />
The presence <strong>of</strong> silicon within the SiNaph prevents permanent acid attack by <strong>of</strong>fering electronic<br />
association <strong>of</strong> the lone pair electrons on the nitrogens, a probable site <strong>of</strong> association for the naphthenic<br />
acids. This association would lead <strong>to</strong> molecular disintegration or simply form a complex whose spectral<br />
qualities are not amenable for fluorescent excitation and emission at the wavelengths outside the<br />
instrumental setup.<br />
2.3.2 SiNaph<br />
Labora<strong>to</strong>ry testing showed that SiNaph persists with stable absorbance and emission pr<strong>of</strong>iles over<br />
6 weeks. SiNaph is also directly soluble in diesel, requiring no additional organic solvent for creation <strong>of</strong> a<br />
s<strong>to</strong>ck solution. This will facilitate integration <strong>of</strong> the dye marker in<strong>to</strong> the commercial setting <strong>of</strong> diesel<br />
distribution. To demonstrate SiNaph’s stability, Fig. 19 shows absorbance pr<strong>of</strong>iles collected at time points<br />
throughout a week for a solution <strong>of</strong> SiNaph in diesel at 1 ppm. Figure 20 shows the excitation and<br />
emission characteristics <strong>of</strong> SiNaph, which indicate that it shows up in a spectral region free <strong>of</strong><br />
competition from other components both intrinsic and extrinsic <strong>to</strong> diesel fuel.<br />
Careful testing for the aging or degradation, if any, <strong>of</strong> the newly identified fuel marker system based on<br />
SiNaph dye was carried out. It was found that over a period <strong>of</strong> 44 days, no degradation <strong>of</strong> dye optical<br />
activity was measurable. For continuing studies, metal from the trailer <strong>of</strong> an actual tanker was obtained<br />
and cut in<strong>to</strong> manageable pieces for use in an aging/degradation test centered on ascertaining whether<br />
anything in the tank metal would facilitate in-tank degradation <strong>of</strong> the fuel marker. The initial absorbance<br />
scan <strong>of</strong> three samples prepared with 1 ppm SiNaph in diesel containing a piece <strong>of</strong> tank metal is shown in<br />
Fig. 21.<br />
Fig. 19. Absorbance pr<strong>of</strong>iles collected over a week’s time for SiNaph.<br />
23
Fig. 20. Excitation and emission characteristics <strong>of</strong> SiNaph.<br />
Fig. 21. Initial absorbance measurements at room temperature, low temperature, and high<br />
temperature (traces are overlapping) <strong>of</strong> SiNaph-marked diesel in the presence <strong>of</strong> tank metal.<br />
One sample remained at room temperature, a second was subjected <strong>to</strong> freezing temperatures, and a third<br />
was heated <strong>to</strong> 140°C. These samples continued <strong>to</strong> be followed spectroscopically <strong>to</strong> determine whether the<br />
presence <strong>of</strong> metal and/or temperature extremes adversely affected the fuel marker’s optical response.<br />
This demonstrated that no immediate effects on the marker result from a reaction with the tank metal and<br />
paved the way for longer-term temperature-based studies in the presence <strong>of</strong> the tank metal.<br />
24
After determining that the SiNaph dye is stable in diesel chemical environment after more than 60 days,<br />
aging studies were expanded <strong>to</strong> include temperature variables as well as metal from an actual tanker truck<br />
compartment. Inclusion <strong>of</strong> this metal allowed thermal and temporal aging <strong>to</strong> proceed in as realistic a<br />
chemical environment as possible in light <strong>of</strong> prior knowledge that metal surfaces sometimes facilitate<br />
degradation <strong>of</strong> organic and ligand-bound chromophores and fluorophores. However, we were able <strong>to</strong><br />
show that, even over months, the SiNaph retains its optical signature, even at 32°F and >140°F. It was<br />
even found that the optical signature <strong>of</strong> the fuel marker persisted beyond the lifetime <strong>of</strong> the diesel itself in<br />
the case <strong>of</strong> the high-temperature time study.<br />
All samples were created as described in the following steps. Aluminum alloy metal cut from a large<br />
piece <strong>of</strong>f a fuel tanker truck’s tank was machined down <strong>to</strong> shards measuring 1 in. × 2 in.. One shard was<br />
placed in each <strong>of</strong> five containers, three <strong>of</strong> which were Nalgene® 250 mL jars and two <strong>of</strong> which were<br />
borosilicate glass jars. Pump diesel marked at 1 ppm in SiNaph was added <strong>to</strong> two <strong>of</strong> the plastic (Nalgene)<br />
bottles and one <strong>of</strong> the glass jars. The remaining bottle and jar received unmarked diesel <strong>to</strong> serve as roomtemperature<br />
and heated diesel blanks. Initial absorbance spectra were collected against the roomtemperature<br />
unmarked diesel blank and then one marked sample went in<strong>to</strong> a freezer, one in<strong>to</strong> a 140°F<br />
oven, and one on<strong>to</strong> the lab counter<strong>to</strong>p. The samples were measured every day for a week and every 4 <strong>to</strong><br />
7 days after that for 8 weeks. Figure 22 illustrates the stability <strong>of</strong> the room-temperature aging sample.<br />
Figure 23 shows the results at low temperature, and Fig. 24 demonstrates absorbance spectra from<br />
the high-temperature samples over time. Figure 25 confirms the degradation <strong>of</strong> the diesel fuel itself at<br />
high temperatures.<br />
<strong>Based</strong> on observation, diesel degradation is the likely cause <strong>of</strong> an increasing absorbance both in the 400–<br />
500 nm wavelength regions as well as the eventual creation <strong>of</strong> a broad, nondescript background as the<br />
high temperatures more completely altered the diesel viscosity, hue, and chemical character <strong>to</strong>ward the<br />
end <strong>of</strong> the study. This information was very useful in conveying the longevity <strong>of</strong> the SiNaph marker<br />
system as well as testing the complete sensor suite on the bench and on the test track.<br />
Fig. 22. Room-temperature marked diesel aging study.<br />
25
Fig. 23. Low-temperature marked diesel aging study.<br />
Fig. 24. High-temperature marked diesel aging study.<br />
26
Absorbance (A.U.)<br />
4<br />
3<br />
2<br />
1<br />
0<br />
400 600 800<br />
Fig. 25. High-temperature unmarked diesel aging study.<br />
Additionally, further fuel maker aging <strong>to</strong> a time <strong>of</strong> even greater than 3 months reveals that even at high<br />
temperature (140°F) in the presence <strong>of</strong> tank metal, the diesel itself degrades in<strong>to</strong> a yellowed, viscous<br />
product that creates an overall higher background for the dye, which only shows a negligible amount <strong>of</strong><br />
degradation and band broadening.<br />
2.3.3 Sister Dye: 3,3ꞌ-diethylthiatricarbocyanine iodide<br />
Diesel aged with metal at >140F, 7/01/10<br />
Diesel aged with metal at >140F, 7/13/10<br />
Diesel aged with metal at >140F, 7/21/10<br />
Wavelength (nm)<br />
An exhaustive search <strong>of</strong> literature and commercial chemical starting materials resulted in the<br />
identification <strong>of</strong> a less expensive (by about an order <strong>of</strong> magnitude) sister dye marker for the detection <strong>of</strong><br />
fuel dilution and adulteration. The excitation and emission characteristics <strong>of</strong> this naphthalocyanine moiety<br />
are amenable for use with the current SiNaph sensor configuration. The chief structural difference is the<br />
exclusion <strong>of</strong> silicon from the more affordable dye marker; this and other minor structural differences,<br />
along with lower single-component molecular purity, result in reduced solubility characteristics in<strong>to</strong><br />
diesel and a requirement <strong>to</strong> be doped in at a 1.5 ppm level for equivalent fluorescent emission yield. Early<br />
results in aging with metal studies at low, room, and high temperatures indicate ample stability for low<br />
and room temperatures with some signal loss with time at 120°F. This reduction in stability with heating<br />
could also be due <strong>to</strong> the absence <strong>of</strong> a organometallic center. A new dye, 3,3ꞌ-diethylthiatricarbocyanine<br />
iodide, was assayed that <strong>of</strong>fered lower cost than the SiNaph system. It was observed that the “sister” dye,<br />
which does not contain silicon and is nearly an order <strong>of</strong> magnitude less expensive than the SiNaph<br />
system, does show some marginal aging characteristics at room temperature and low temperature, as well<br />
as significant aging at very high temperatures. A cost/conditions analysis or discussion will allow us <strong>to</strong><br />
determine if the value added by the SiNaph’s longevity at very high temperatures justifies its higher price.<br />
Figure 26 shows the difference in absorbance pr<strong>of</strong>ile <strong>of</strong> non-Si dye marker at 1 ppm in diesel after<br />
28 days <strong>of</strong> s<strong>to</strong>rage with tank metal in 120°F conditions. The blue trace represents the initial absorbance<br />
pr<strong>of</strong>ile <strong>of</strong> the dye, whereas the red represents its optical absorbance after long-term high-heat s<strong>to</strong>rage.<br />
This case represents the worst example <strong>of</strong> long-term optical performance deterioration; in the low and<br />
room-temperature aging studies, and in the short-term high-temperature studies, the non-Si marker<br />
27
performs acceptably. Figure 26 illustrates the essence <strong>of</strong> these aging studies, in that the “sister” marker<br />
shows negligible optical response after aging less time and at lower temperatures than SiNaph and was<br />
therefore deems unusable for the field trials.<br />
As illustrated in Fig. 26, at low and room temperatures, this less expensive dye marker system shows<br />
stability. After evaluating full spectrum envelopes for changes in “sister dye” absorbance peak intensities<br />
<strong>to</strong> assess degradation due <strong>to</strong> time, temperature, and exposure <strong>to</strong> tank metal, the complement <strong>of</strong> data was<br />
reduced <strong>to</strong> trends in absorbance intensity with time (number <strong>of</strong> days), shown in Fig. 27.<br />
The comparison <strong>of</strong> this dye with the SiNaph does indicate acceptable performance, especially at nearfreezing<br />
and near-room temperature, but not in the long term at high (120°F) temperatures. The sister<br />
dye’s optical emission stability degrades on a timescale that precludes use in cases <strong>of</strong> retained evidence or<br />
extreme summer heat s<strong>to</strong>rage. This dye’s stability would only be acceptable in the case <strong>of</strong> a duty cycle<br />
length <strong>of</strong> 1 business week or less. Although this may be adequate for the ultimate fielded pro<strong>to</strong>col <strong>to</strong><br />
moni<strong>to</strong>r trucks in transit and at depots, it will not suffice for longer-range applications. <strong>Based</strong> on the<br />
results <strong>of</strong> these tests, the <strong>Fuel</strong> Marker team chose SiNaph <strong>to</strong> be utilized in the POC testing.<br />
A.U.<br />
Wavelength (nm)<br />
Fig. 26. Blue trace (with peak at ~770 nm) shows initial absorbance response <strong>of</strong> “sister” dye in diesel. Red<br />
trace is same sample’s absorbance after 28 days under exposure <strong>to</strong> tank metal at 120°F.<br />
28
Fig. 27. Degradation <strong>of</strong> sister dye at low, room, and high temperature in presence <strong>of</strong> tank metal.<br />
29
3. SENSORS<br />
A suite <strong>of</strong> sensors attached <strong>to</strong> a fuel transport vehicle provides the critical information needed <strong>to</strong> evaluate<br />
whether or not FTE is or has occurred. These sensors, the motivation behind their use, and any relevant<br />
details regarding unique development or implementation issues are presented in this section.<br />
3.1 GENERAL SENSOR SUITE CONSIDERATIONS<br />
In this section we consider the general design and layout <strong>of</strong> a sensor suite suitable for detection <strong>of</strong> FTE.<br />
We begin by considering the general functionality required <strong>of</strong> the sensor system.<br />
3.1.1 Required Functionality<br />
In the most general terms, the sensor suite must furnish information capable <strong>of</strong> answering the following<br />
questions:<br />
• Are any <strong>of</strong> the access points in<strong>to</strong> the trailer open?<br />
• How much fuel is present—what is the fuel level?<br />
• Is the fuel in the truck the fuel on which excise taxes were paid at the load point?<br />
In the rest <strong>of</strong> this section we develop a general layout and Concept <strong>of</strong> Operations for how a sensor suite<br />
capable <strong>of</strong> answering these questions may be deployed on a fuel transport.<br />
3.1.2 General Trailer Layout and Operation<br />
Figure 28 below shows a schematic <strong>of</strong> a typical fuel trailer layout. The trailers are normally divided in<strong>to</strong><br />
three <strong>to</strong> four compartments, with each compartment having its own hatch, emergency valve, and<br />
fill valve.<br />
Fig. 28. <strong>Fuel</strong> trailer compartmentalization and access points.<br />
31
The emergency valve, by law, must be kept closed during over-the-road operation as it prevents<br />
uncontrolled release <strong>of</strong> the compartment contents should the plumbing and valves below it be<br />
compromised. Filling and emptying <strong>of</strong> the trailer is done through the fill valve. At the terminal rack,<br />
during the filling operation, the fuel is pumped in at a volumetric flow <strong>of</strong> about 500 gal per minute (gpm),<br />
while unloading (typically at a retail station) is done under gravity feed, so the flow rate will vary<br />
continuously throughout the <strong>of</strong>f-load operation.<br />
It is clear from Fig. 28 that there are two access points in<strong>to</strong> each compartment, the fill valve and the hatch.<br />
It is also clear that each compartment will have its own fuel level. Therefore, in order <strong>to</strong> answer the first<br />
two <strong>of</strong> the three questions, we must moni<strong>to</strong>r the hatch and valve on each compartment as well as the fuel<br />
level in each compartment. As for the third question, this requires the development <strong>of</strong> a “marker,” the<br />
correct concentration <strong>of</strong> which indicates unadulterated taxed fuel, as well as a sensing system for<br />
measuring same. A detailed description <strong>of</strong> the marker selection methodology and characteristics <strong>of</strong> the<br />
selected marker are described in Sect. 2. For the purposes <strong>of</strong> this general discussion, we are considering<br />
only the general functionality <strong>of</strong> the sensing device.<br />
3.1.3 General Sensor System Specifications and Constraints on Installation<br />
The considerations above are adequate for laying out the general specifications for the individual sensors<br />
required. The sensors required are hatch and valve sensors, a level sensor, and a sensor <strong>to</strong> determine the<br />
marker concentration in the fuel. The general requirements on each <strong>of</strong> these sensors are as follows.<br />
• Hatch and valve sensors:<br />
— Binary output (open/closed) and<br />
— Low or zero power consumption<br />
• Level sensor:<br />
— Range empty <strong>to</strong> full, resolution ± 200‒300 gal,<br />
— Temperature, slosh and tilt effects compensated or minimized, and<br />
— Accommodates presence <strong>of</strong> bot<strong>to</strong>m valve.<br />
• Marker sensor:<br />
— Concentration range 0‒1000 ppb, resolution ±50 ppb,<br />
— Temperature and flow effects compensated or minimized,<br />
— Inline, real-time sampling strongly preferred, and<br />
— Calibration (if required) infrequent.<br />
In addition <strong>to</strong> these requirements, the addition <strong>of</strong> sensors <strong>to</strong> the trailer should not add measurably <strong>to</strong> the<br />
height or width <strong>of</strong> the trailer and should not affect the ground clearance <strong>of</strong> the trailer. The sensors should<br />
also ultimately be able <strong>to</strong> satisfy intrinsic safety requirements necessary for operation at the terminal rack<br />
and other hazardous locations, although this requirement could be waived for the field tests <strong>to</strong> be<br />
conducted in a very controlled test environment. Finally, since a loaned trailer from Pilot was <strong>to</strong> be used<br />
for the field test, installation <strong>of</strong> the sensor suite could not require any penetration <strong>of</strong> the fuel trailer or<br />
permanently modify the combination vehicle in any way.<br />
In the following sections, the detailed considerations that went in<strong>to</strong> the selection and development <strong>of</strong> the<br />
various sensors are described. The hatch, valve, level, and marker sensors are considered. Finally, in<br />
Sect. 3.5, we describe the hardware developed <strong>to</strong> mount the sensors on<strong>to</strong> a fuel transport trailer for the<br />
field test.<br />
32
3.2 HATCH AND VALVE SENSOR DEVELOPMENT AND EVALUATION<br />
3.2.1 Approach and Sensor Selection and Off-Vehicle Evaluation<br />
Detection <strong>of</strong> hatch or valve opening and closing is an exercise in position sensing. Since modern<br />
industrial au<strong>to</strong>mation has created significant demand for position-sensing technologies, there was high<br />
confidence that commercial, <strong>of</strong>f-the-shelf (COTS) technologies could be identified <strong>to</strong> meet this need.<br />
Very rapidly the search for appropriate position-sensing technologies converged <strong>to</strong> the “GO” switch<br />
technology <strong>of</strong>fered by TopWorx (Louisville, Kentucky). The GO switch is an explosion-pro<strong>of</strong>, magnetic<br />
proximity switch developed for use in hazardous locations. The switch will close when a magnetic target<br />
is moved <strong>to</strong> within a certain distance (normally ~1/4 in.) <strong>of</strong> the sensing face. A sample installation (image<br />
courtesy <strong>of</strong> TopWorx) is shown in Fig. 29.<br />
Fig. 29. Sample GO switch installation <strong>to</strong> moni<strong>to</strong>r valve position.<br />
Using a similar arrangement <strong>to</strong> that shown in Fig. 29, GO switches can be connected <strong>to</strong> the opening<br />
mechanisms on fuel valves and fuel compartment hatches <strong>to</strong> detect when the valves/hatches are open or<br />
closed.<br />
3.2.2 Off-Trailer Evaluation<br />
Figure 30 shows the configuration used <strong>to</strong> test the functionality <strong>of</strong> the TopWorx hatch and valve sensors.<br />
The switching action occurs between the wires shown connecting <strong>to</strong> the side <strong>of</strong> the proximity switch in<br />
Fig. 30 and was readily verified for the TopWorx switches. Therefore these sensors were deemed suitable<br />
for use in the field test.<br />
33
Fig. 30. Setup for <strong>of</strong>f-trailer evaluation <strong>of</strong> hatch and valve sensors.<br />
3.3 LEVEL SENSOR DEVELOPMENT AND EVALUATION<br />
3.3.1 Approach<br />
As was the case with the sensing <strong>of</strong> valve and hatch position, level measurement <strong>of</strong> fluids is a common<br />
process engineering challenge. There are several general approaches that can be used, as described in the<br />
summary by Boyes. 2 There have also been specialized techniques developed just for hydrocarbons. We<br />
will review both <strong>of</strong> these briefly here. According <strong>to</strong> (Boyes, 2007), the primary general techniques that<br />
may be applicable <strong>to</strong> hydrocarbons are ultrasonic, radar, and differential pressure measurements.<br />
Ultrasonic measurements function by “time <strong>of</strong> flight,” whereby an ultrasonic pulse is launched either<br />
from the container bot<strong>to</strong>m (nonintrusive) or from above the liquid (intrusive). This wave will reflect at the<br />
interface between the liquid and the gas due <strong>to</strong> the large mismatch in “acoustic impedance.” The reflected<br />
wave is detected by a suitable transducer, and then the level can be calculated from the velocity <strong>of</strong> sound<br />
in either the air or the liquid, depending on whether the operation is intrusive or nonintrusive. Radar<br />
measurements are similar <strong>to</strong> ultrasonic but radar instead <strong>of</strong> ultrasonic waves is used, and nonintrusive<br />
techniques are not possible.<br />
Differential pressure level measurements function as shown in Fig. 31. A differential sensor is required<br />
because pvapor (the vapor pressure in the tank above the surface <strong>of</strong> the fuel) will vary with temperature. In<br />
our specific application, pvapor will vary between the limits set by a DOT-mandated relief valve (not<br />
shown in Fig. 31) that relieves at 1 psi for pressure and 3/8 psi for vacuum. 3<br />
Several vendors <strong>of</strong>fer versions <strong>of</strong> the above technologies that are safe <strong>to</strong> use with hydrocarbons—they are<br />
intrinsically safe or explosion pro<strong>of</strong>. For example, guided wave radar sensors for petroleum product level<br />
measurements are <strong>of</strong>fered by Titan Pacific Resources. 4 There are also novel mechanical measurement<br />
technologies developed just for hydrocarbons. JOWA Consilium manufactures a system with the<br />
trademark name “Petrotape.” 5 In this system a tape containing two spatially separate conduc<strong>to</strong>rs is<br />
suspended in a perforated stillpipe inside the tank. Below the fluid level, the hydrostatic pressure <strong>of</strong> the<br />
fluid will press the two conduc<strong>to</strong>rs <strong>to</strong>gether, lowering the electrical resistance <strong>of</strong> the immersed length and<br />
enabling an inference <strong>of</strong> the fluid level <strong>to</strong> be made. Other similar devices from other manufacturers use<br />
capacitance.<br />
34
Fig. 31. Differential pressure sensor schematic <strong>of</strong> operation.<br />
It is clear from the foregoing information that there are many options for level measurement; however, the<br />
constraints imposed by the inability <strong>to</strong> penetrate the trailer, and the need <strong>to</strong> operate over the road,<br />
eliminate many <strong>of</strong> these sensors. The inability <strong>to</strong> penetrate the trailer eliminates the guided wave radar,<br />
intrusive ultrasonic, and Petrotape-style options, as these are typically bulky and would exceed the height<br />
<strong>of</strong> the guard in Fig. 28. This leaves only nonintrusive ultrasonic and differential pressure, with penetration<br />
for the pvapor measurement (Fig. 31) being made on a replacement hatch specifically purchased for the<br />
field test.<br />
Prior work at ORNL had indicated one challenge in ultrasonic distance (level) measurement was the need<br />
for the interface being detected <strong>to</strong> be parallel with the transducer face. Relative tilts between the<br />
transducer face and the interface <strong>of</strong> even a few degrees drastically reduce the amplitude <strong>of</strong> the detected<br />
reflection. Since in over-the-road applications there will be significant tilt and slosh <strong>of</strong> the liquid,<br />
sophisticated correction algorithms * need <strong>to</strong> be applied. Such challenges in fact led <strong>to</strong> the discontinuation<br />
<strong>of</strong> a commercial nonintrusive ultrasonic level sensing system for petroleum tankers that was <strong>of</strong>fered by<br />
Canongate Technology (United Kingdom). Therefore we decided <strong>to</strong> adopt pressure-based level sensing<br />
techniques for the field testing. Furthermore, given that the testing was a POC only, it was decided <strong>to</strong><br />
employ simply absolute-pressure-based technology for the level measurement.<br />
Intrinsically safe pressure transducers are available from a wide number <strong>of</strong> vendors, and the selection was<br />
made based on (1) the desired pressure range and (2) the desire by our third-party partner (AirWeigh) <strong>to</strong><br />
have a ratiometric output transducer with MetriPack connections. The desired pressure range is easy <strong>to</strong><br />
deduce from the relation given in Fig. 31, p = ρgh, where ρ is the density <strong>of</strong> diesel fuel (~830 kg/m 3 ), g is<br />
the acceleration due <strong>to</strong> gravity (9.8 m/s 2 ), and h is the height <strong>of</strong> the fuel. Therefore a column <strong>of</strong> diesel will<br />
generate pressure on the order <strong>of</strong> 0.36 psi/ft, indicating that a pressure sensing range <strong>of</strong> 0–5 psi<br />
(corresponding <strong>to</strong> 0–14 ft) would be nearly ideal. An intrinsically safe sensor with this measuring range as<br />
well as the electrical features (ratiometric output, Metripack connec<strong>to</strong>r) requested by AirWeigh was<br />
*See correction algorithms such as those found in “Accurate Fluid Level Measurement in Dynamic Environment Using<br />
Ultrasonic Sensor and ν-SVM.” Terzic, Jenny, Nagarajah, Romesh and Alamgir, Muhammad. 10, Oc<strong>to</strong>ber 2009, Sensors &<br />
Transducers, Vol. 109, Issue 10, Oc<strong>to</strong>ber 2009, pp. 76-91.<br />
35
available from American Sensor Technologies and purchased for the field testing. A picture <strong>of</strong> the sensor<br />
is shown in Fig. 32.<br />
Fig. 32. Pressure-based level sensor used for POC testing.<br />
3.3.2 Sensor Selection and Off-Vehicle Evaluation<br />
Using a bench<strong>to</strong>p rig that had been assembled prior <strong>to</strong> the field testing, the operation <strong>of</strong> the level sensor<br />
could be investigated <strong>of</strong>f-trailer. The setup for this is illustrated in Fig. 33(a), and typical results are<br />
shown in Fig. 33(b) and (c). The output from the sensor was linear with fluid height over the range that<br />
was available for investigation, and the ratiometric output was verified for supply voltages between 5 and<br />
6 voltage direct current (VDC). Therefore this sensor was deemed suitable for use in the field testing.<br />
Fig. 33. Setup for <strong>of</strong>f-trailer evaluation <strong>of</strong> level sensor and results.<br />
36
3.4 MARKER SENSOR DEVELOPMENT<br />
In contrast <strong>to</strong> the hatch, valve, and level sensors, the marker sensor required developing a sensor and<br />
sensing technique that had no commercial counterpart. Although accurate <strong>of</strong>f-line measurements <strong>of</strong> fuel<br />
marker concentrations are possible in the labora<strong>to</strong>ry, no method <strong>of</strong> on-vehicle moni<strong>to</strong>ring was available at<br />
the start <strong>of</strong> this project. On-vehicle measurements are challenging because accurate absorption and<br />
fluorescence measurements—the primary method <strong>of</strong> measuring fuel marker concentration—are extremely<br />
difficult <strong>to</strong> make without a highly controlled reference sample <strong>to</strong> compare against. Reference samples are<br />
easily established and utilized in a labora<strong>to</strong>ry setting, but for a vehicle in the field—where diesel fuel is<br />
being loaded and unloaded from various sources—reference samples are not a feasible requirement.<br />
As such, a self-referencing method <strong>of</strong> measuring diesel fuel marker concentration was desired and<br />
needed <strong>to</strong> be developed. This section describes the development efforts undertaken <strong>to</strong> achieve this new<br />
type <strong>of</strong> sensor.<br />
3.4.1 Approach<br />
When illuminated with ultraviolet (UV) light, diesel fluoresces and produces blue light. An additive that<br />
fluoresces at a different color can be added <strong>to</strong> the fuel <strong>to</strong> serve as a fuel marker. The higher the marker’s<br />
concentration in the fuel, the larger the non-blue fluorescence will be relative <strong>to</strong> the diesel’s natural blue<br />
fluorescence. This is the basic measurement technique behind fuel marking.<br />
To enhance this basic sensing technique, ORNL developed a cus<strong>to</strong>m fuel marker that fluoresces in the red<br />
<strong>to</strong> near-infrared (NIR) region <strong>of</strong> the optical spectrum (Sect. 2). This marker was unique in that it only<br />
weakly fluoresced when illuminated with ultraviolet light but strongly fluoresced when excited by red<br />
light. By separately exciting and measuring the fluorescence <strong>of</strong> marked diesel with both UV light and red<br />
light, the amount <strong>of</strong> diesel fuel present versus the amount <strong>of</strong> marker present can be accurately determined.<br />
This measurement produces relative marker concentrations that are expressed in parts per billion (ppb).<br />
Most importantly, this technique is “self-referencing,” meaning that it can determine a relative marker<br />
concentration value without the need for an external reference sample or external calibration source.<br />
Given the various types and sources <strong>of</strong> diesel fuel that must be moni<strong>to</strong>red for FTE, a “self-referencing”<br />
method is critical <strong>to</strong> real-world implementations. The research and development steps required <strong>to</strong> design<br />
and produce this sensor are detailed below.<br />
3.4.2 Optical Design<br />
A pro<strong>of</strong>-<strong>of</strong>-principle apparatus was first constructed on a large optical breadboard (Fig. 34). It was tested<br />
<strong>to</strong> verify feasibility and estimate achievable resolution. Labora<strong>to</strong>ry tests demonstrated that the basic<br />
approach was sound and could likely detect marker concentration changes in the tens <strong>of</strong> ppb range. The<br />
technique’s exact implementation, however, would be highly dependent upon the details <strong>of</strong> the marker<br />
still under development and, as such, any pro<strong>to</strong>type design needed <strong>to</strong> maintain flexibility in its design <strong>to</strong><br />
permit future modification and changes <strong>to</strong> the marker specification/performance. In addition, the system<br />
needed <strong>to</strong> be low cost, low power, and rugged. A cost <strong>of</strong> $100 (for a production unit) was targeted with an<br />
environmental rating, ultimately, <strong>of</strong> IP65.<br />
Once the pro<strong>of</strong>-<strong>of</strong>-principle experiment had been demonstrated, the basic optical components utilized in<br />
the experiment were re-specified for use in a compact, pro<strong>to</strong>type sensor. These components and the basic<br />
optical system were modeled using ZEMAX ray tracing s<strong>of</strong>tware and are shown in Fig. 35.<br />
As can be seen in Fig. 35, the optical outputs from a red and blue/UV light-emitting diode (LED) are<br />
combined with the help <strong>of</strong> a glass focusing lens. This combined output is imaged through a glass “cover<br />
37
Fig. 34. <strong>Pro<strong>of</strong></strong>-<strong>of</strong>-principle fuel marker sensor breadboard experiment.<br />
Fig. 35. Optical model <strong>of</strong> pro<strong>to</strong>type fuel marker sensor.<br />
38
window” and on<strong>to</strong> an imaging plane roughly 1 in. from the LEDs. Under normal operations, diesel gas is<br />
located in the image plane (beyond the cover window), producing a fluorescent signal that scatters light<br />
back through the cover window. This fluorescent light is then collected by the lens and imaged on<strong>to</strong> the<br />
two integrated circuit (IC) optical detec<strong>to</strong>rs attached <strong>to</strong> the printed circuit board (PCB) adjacent <strong>to</strong> the<br />
LEDs.<br />
The IC detec<strong>to</strong>rs are silicon detec<strong>to</strong>rs that <strong>of</strong>fer broadband sensitivity. However, an optical filter (either<br />
red or blue) is covering each <strong>of</strong> the IC detec<strong>to</strong>rs, making the detec<strong>to</strong>r only sensitive <strong>to</strong> a defined band <strong>of</strong><br />
the fluorescent spectrum. A plastic optical baffle structure is located between the two LEDs and two<br />
detec<strong>to</strong>rs. The baffle structure reduces the amount <strong>of</strong> internal reflection and direct illumination <strong>of</strong> the<br />
detec<strong>to</strong>rs by the LEDs.<br />
This pro<strong>to</strong>type device allows two different wavelength LEDs <strong>to</strong> excite the same region <strong>of</strong> a fuel sample<br />
(at separate times) while using two separate detec<strong>to</strong>rs <strong>to</strong> measure different corresponding regions <strong>of</strong> the<br />
fluorescent spectrum. The sensor’s optical design has been optimized <strong>to</strong> ensure a high degree <strong>of</strong> isolation<br />
between the two measurements. This is critical <strong>to</strong> detecting small changes in concentration. The spectral<br />
sensitivity <strong>of</strong> the filtered detec<strong>to</strong>rs, as well as the fluorescent response <strong>of</strong> marked diesel (at two different<br />
excitation bands), is shown graphically in Fig. 36. The blue region corresponds <strong>to</strong> the bandwidth <strong>of</strong> the<br />
blue filter, while the pink region corresponds <strong>to</strong> the bandwidth <strong>of</strong> the red filter.<br />
Fig. 36. Spectral response <strong>of</strong> marked diesel at two excitation wavelengths.<br />
As mentioned earlier, the “blue” peak in Fig. 36 is a natural by-product <strong>of</strong> diesel (marked or unmarked),<br />
while the “red” peak is a by-product <strong>of</strong> the cus<strong>to</strong>m marker. Measuring and dividing the intensity <strong>of</strong> the<br />
two peaks gives a “self-referenced” measurement <strong>of</strong> the marker concentration strength.<br />
To physically realize the design in Fig. 36, two identical detec<strong>to</strong>rs were used <strong>to</strong> detect the amount <strong>of</strong> red<br />
and blue light fluorescing from marked diesel. To ease assembly and reduce size, a pho<strong>to</strong>detec<strong>to</strong>r with an<br />
integrated amplifier was used in a surface mount IC package. It <strong>of</strong>fered broadband spectral response, high<br />
39
sensitivity (0.4 A/W), suitable speed (14 kilohertz), low cost (≈$7), and low quiescent power consumption<br />
(≈1.5 mW).<br />
Two LEDs, one red and one blue, were used <strong>to</strong> separately excite the diesel fuel. To improve signal quality<br />
and meet power requirements, these LEDs were required <strong>to</strong> produce a large flux <strong>of</strong> light in<strong>to</strong> a narrow<br />
beam with minimal power consumption. Some <strong>of</strong> the best LEDs for this purpose are manufactured by<br />
Roithner LaserTechnik (a German company) and were utilized in this pro<strong>to</strong>type design. These LEDs have<br />
a center wavelength (405 nm and 630 nm respectively) that is optimal for excitation <strong>of</strong> either the diesel or<br />
the selected fuel marker.<br />
As mentioned, two optical filters (one red and one blue) were used <strong>to</strong> isolate portions <strong>of</strong> the fluorescence<br />
spectrum during excitation by one <strong>of</strong> the LEDs. These filters were required <strong>to</strong> <strong>of</strong>fer good extinction <strong>of</strong> the<br />
excitation bands while providing good transmission <strong>of</strong> the nearby spectral region-<strong>of</strong>-interest. There are<br />
many high-quality dielectric stack filters that provide exceptional spectral control for exactly this type <strong>of</strong><br />
application. Unfortunately, though, most <strong>of</strong> these filters were <strong>to</strong>o expensive for our target cost. To balance<br />
cost and performance, two filters were chosen that minimized cost while still providing good extinction <strong>of</strong><br />
the excitation bands. Where possible, colored glass filters were used instead <strong>of</strong> dielectric stacks <strong>to</strong> reduce<br />
cost. The blue filter used was a narrow band interference filter that was centered on 480 nm. The filter<br />
was more expensive (≈$45) than a colored glass alternative, but it provided a narrow transmission<br />
bandwidth that was more likely <strong>to</strong> capture just diesel fluorescence and not other unwanted commercial<br />
markers. The red filter used was a low-cost colored glass filter.<br />
The output from the LEDs needed <strong>to</strong> be concentrated in<strong>to</strong> a single, centralized region. Otherwise, the red<br />
LED and blue LED would measure different portions <strong>of</strong> the sample, and more importantly, the detec<strong>to</strong>rs<br />
would not be able <strong>to</strong> optimally collect the refocused fluorescent signal. A simple concave lens (30 mm<br />
focal length) allowed us <strong>to</strong> achieve this with acceptable efficiency. The lens has a magnesium fluoride<br />
anti-reflection coating on all surfaces <strong>to</strong> minimize the possibility <strong>of</strong> back reflections in<strong>to</strong> the detec<strong>to</strong>rs<br />
(which would increase the noise <strong>of</strong> the detec<strong>to</strong>rs).<br />
By design, the lens focuses the LED light with a high degree <strong>of</strong> spherical aberration. This created a large<br />
region where the focal width remained largely unchanged. This region, called the “region <strong>of</strong> least<br />
confusion,” is the optimal location for stimulating fluorescence. This region is approximately 6 mm deep<br />
by 5 mm in diameter.<br />
To create a design that can be sealed from the environment, the “region <strong>of</strong> least confusion” was located<br />
just beyond a glass window. The design, therefore, assumes that the diesel fuel <strong>to</strong> be examined will be<br />
present 3 <strong>to</strong> 9 mm beyond this glass window. The window is 25 mm in diameter and coated with a<br />
magnesium fluoride anti-reflection coating <strong>to</strong> guard against stray reflections in<strong>to</strong> the detec<strong>to</strong>r. It was<br />
assumed that this window would be the last optical surface in the sensor and would integrate with a gasket<br />
in the sensor housing <strong>to</strong> form a watertight seal.<br />
All <strong>of</strong> the optical components described were modeled in ZEMAX Raytracing s<strong>of</strong>tware <strong>to</strong> evaluate<br />
system performance and <strong>to</strong>lerance requirements. The model was then optimized <strong>to</strong> maximize the number<br />
<strong>of</strong> pho<strong>to</strong>ns collected at the two IC detec<strong>to</strong>rs while simultaneously minimizing alignment requirements.<br />
The greatest challenge <strong>of</strong> this design was <strong>to</strong> efficiently “centralize” the optical outputs <strong>of</strong> the two LEDs.<br />
Because both LEDs have a fair amount <strong>of</strong> divergence (which is different for each LED), optimization <strong>of</strong><br />
the focusing lens’ position was a primary concern. Figure 37 and Fig. 38 show the location in the focal<br />
plane <strong>of</strong> each LEDs focal spot.<br />
40
Fig. 37. Focal point for blue LED (at 6 mm beyond cover window).<br />
Fig. 38. Focal point for red LED (located 6 mm beyond cover window).<br />
41
As can be seen in Fig. 37 and Fig. 38, there is a slight displacement between the focal regions <strong>of</strong> the two<br />
LEDs. However, this configuration produced the largest modeled return signal for the two IC detec<strong>to</strong>rs.<br />
The optical efficiency <strong>of</strong> the simulated design at focusing and collecting light in<strong>to</strong> a centralized region<br />
was approximately 38%—with the majority <strong>of</strong> losses coming from internal reflections and non-focused<br />
light (due <strong>to</strong> the high divergence <strong>of</strong> the LEDs). For the LEDs selected, that represents approximately<br />
4 mW <strong>of</strong> illumination for both the red and blue LEDs, which is comparable <strong>to</strong> (or greater than) the light<br />
energy levels used in early breadboard experiments.<br />
As mentioned previously, the focused light experiences a high level <strong>of</strong> spherical aberration <strong>to</strong> create a<br />
6 mm long region where the focal distribution is relatively unchanged. Figure 39 details the change in<br />
focal distribution from 3 <strong>to</strong> 9 mm beyond the system’s “cover window.”<br />
As can be seen in Fig. 39, the change in focal distribution is small over the measurement window.<br />
The ZEMAX model <strong>of</strong> the optical design was used <strong>to</strong> produce the optimal configuration and positioning<br />
<strong>of</strong> detec<strong>to</strong>rs, sources, and support optics. This information was critical <strong>to</strong> the design <strong>of</strong> the mechanical<br />
housing that followed, which would maintain the mechanical position and alignment <strong>to</strong>lerances necessary<br />
<strong>to</strong> ensure proper operation.<br />
3.4.3 Mechanical Design<br />
(a) 3 mm (b) 5 mm (c) 7 mm (d) 9 mm<br />
Fig. 39. Variation in focal distribution with distance from cover window.<br />
The sensor’s mechanical housing design was required <strong>to</strong> serve three main functions:<br />
• Must accurately position optical components,<br />
• Must provide environmental protection for electronic components (IP65), and<br />
• Must provide a rugged mount for integration with a fuel tanker vehicle.<br />
Simultaneously meeting all <strong>of</strong> these requirements in a small package and at minimal cost was a<br />
considerable challenge. To provide as much design flexibility as possible, a plastic housing was pursued<br />
that was fabricated using a stereolithographic 3D printing technique. The 3D printing technique allowed<br />
for rapid pro<strong>to</strong>typing <strong>of</strong> sophisticated housing geometries and was well suited <strong>to</strong> the size and mechanical<br />
<strong>to</strong>lerance <strong>of</strong> this pro<strong>to</strong>type sensor.<br />
Initially, two housing designs were developed. One assumed an external power source, while the other<br />
incorporated an internal battery pack. Discussions with the Sensor Team concluded that it was unlikely<br />
that an internal battery source would actually be needed given the available DC power on the vehicle.<br />
Therefore, only the housing (without internal battery supply) is presented in this report.<br />
42
The sensor’s pro<strong>to</strong>type housing design is shown in an exploded view in Fig. 40.<br />
The design is roughly the size <strong>of</strong> a deck <strong>of</strong> cards and incorporates all <strong>of</strong> the optical components specified<br />
previously. The optical components are carefully positioned relative <strong>to</strong> an internal electronics board,<br />
while peripheral electronics (i.e., switches, power receptacles, etc.) are panel mounted on the sides <strong>of</strong> the<br />
housing. Detailed descriptions <strong>of</strong> the mechanical dimensions and components are provided in<br />
Appendix B.<br />
Four screws hold the front and back housing layers <strong>to</strong>gether, while a thin sheet gasket is compressed<br />
between the two halves <strong>to</strong> create a watertight seal. The front half <strong>of</strong> the housing also contains an optical<br />
window. Silicone is used <strong>to</strong> hold the window in place and <strong>to</strong> maintain the watertight seal. All external<br />
connec<strong>to</strong>rs are IP67 rated with an o-ring around the panel mount and are equipped with covers when not<br />
in use.<br />
In addition <strong>to</strong> the housing’s two main halves (front and back housing), an internal structure is also present<br />
that maintains the alignment <strong>of</strong> key optical components. The “Internal Optical Mount” is a plastic<br />
component that screws in<strong>to</strong> four holes on the sensor’s main PCB board. The mount houses a red and blue<br />
optical filter (held in place with epoxy) and positions them over the <strong>to</strong>p <strong>of</strong> two board-mounted optical<br />
detec<strong>to</strong>rs. Red and blue LEDs are encapsulated by the mount <strong>to</strong> reduce the amount <strong>of</strong> stray light that<br />
might be incident upon the detec<strong>to</strong>rs. Finally, a 1 in. diameter lens is positioned at the front <strong>of</strong> the optical<br />
mount. The lens focuses the light from the LEDs <strong>to</strong>ward an optical window located at the front <strong>of</strong> the<br />
sensor housing. Details regarding this mechanical component and the mechanical design in general are<br />
made in Appendix C.<br />
Fig. 40. Assembly view <strong>of</strong> sensor housing.<br />
43
3.4.4 Electrical Design<br />
The sensor’s electrical design was required <strong>to</strong> serve several functions, including the following:<br />
• Must accurately position electro-optical components,<br />
• Must pulse two LEDs and moni<strong>to</strong>r two analog detec<strong>to</strong>rs,<br />
• Must fit within the mechanical enclosure defined in the previous section,<br />
• Must provide power regulation for use with 12 VDC vehicle power,<br />
• Must provide 2 months <strong>of</strong> battery backup <strong>of</strong> internal operational parameters,<br />
• Must have measurement speeds in excess <strong>of</strong> 10 samples/second,<br />
• Must provide RS232/RS485 communications, and<br />
• Must be individually addressable for use in networks.<br />
Simultaneously meeting all <strong>of</strong> these requirements in a small package and at minimal cost was<br />
again a considerable challenge. To provide as much design flexibility as possible, a general-purpose<br />
microprocessor/microcontroller was selected as the controls platform. This processor<br />
(Rabbit Semiconduc<strong>to</strong>r RCM3400) is an established processor that incorporates various analog input<br />
subsystems. The RCM3400 features a low-EMI Rabbit® 3000-based CPU subsystem running at<br />
29.4 megahertz, with 512K Flash / 512K SRAM, 5 serial ports, and 8 channels <strong>of</strong> programmable gain<br />
analog input in an extremely small footprint (1.37 in. × 1.16 in./34 × 29 mm).<br />
This processor was used <strong>to</strong> control all electro-optics hardware on a cus<strong>to</strong>m-designed PCB. Firmware was<br />
written in Dynamic C, and communications with outside devices were achieved over a 3-wire RS232<br />
pro<strong>to</strong>col.<br />
The sensor’s electrical design was broken in<strong>to</strong> two sub-systems: power conditioning and electro-optical<br />
controls. Schematics <strong>of</strong> these two sub-system circuits are detailed in Appendix B. Fabricating a working<br />
electronics package required the development <strong>of</strong> cus<strong>to</strong>m PCB, integration <strong>of</strong> various connec<strong>to</strong>rs and<br />
peripheral components, and programming <strong>of</strong> the system’s core processor. <strong>Based</strong> on the circuit design<br />
described in Appendix B, a four-layer PCB board was designed, routed, and fabricated. Where possible,<br />
surface-mount components were used <strong>to</strong> minimize the footprint <strong>of</strong> the components and maximize the use<br />
<strong>of</strong> both sides <strong>of</strong> the board. A complete Bill <strong>of</strong> Materials for these components and other ancillary<br />
components is provided in Appendix D.<br />
3.4.5 Firmware Development<br />
Appendix E provides the complete firmware source code for version 1.4 <strong>of</strong> the pro<strong>to</strong>type sensor. This<br />
code was written in Dynamic C, a free compiler available from Rabbit Semiconduc<strong>to</strong>r and similar <strong>to</strong> most<br />
C+ firmware environments. Appendix F provides an overview <strong>of</strong> the communication functions<br />
implemented by the firmware and made available <strong>to</strong> third-party developers who were partnering with<br />
ORNL <strong>to</strong> complete this project. These functions allowed the cus<strong>to</strong>m fuel marker sensor <strong>to</strong> communicate<br />
reliably with other third-party systems and sensors present in the field trial.<br />
3.4.6 Off-trailer Evaluation<br />
The completed pro<strong>to</strong>type sensor is shown in Figs. 41 through 43.<br />
To evaluate the sensors performance and sensitivity, eleven 40 milliliter (ml) vials <strong>of</strong> marked diesel were<br />
prepared at increasing levels <strong>of</strong> marker concentration (0 ppb, 100 ppb, 200 ppb . . . , 1000 ppb). The<br />
marker sensor was then used <strong>to</strong> evaluate each vial, in the labora<strong>to</strong>ry, <strong>to</strong> discern the level <strong>of</strong> noise and<br />
sensitivity exhibited by the device. These tests showed that the sensor response was roughly linear and,<br />
given the noise levels exhibited, had a resolution <strong>of</strong> approximately 20 ppb (Fig. 44).<br />
44
Fig. 41. Marker sensor back view.<br />
Fig. 42. Marker sensor front view.<br />
45
1.4<br />
1.2<br />
1<br />
0.8<br />
0.6<br />
0.4<br />
0.2<br />
0<br />
Fig. 43. Marker sensor internal electronics.<br />
0 100 200 300 400 500 600<br />
Fig. 44. Data from vials containing marked diesel fuel.<br />
46
<strong>Based</strong> on these early results, the performance <strong>of</strong> the newly developed fuel marker sensor was deemed<br />
acceptable and ready for use in a test track–based field test. The cost <strong>of</strong> the device in low-volume<br />
production was estimated at less than $100.<br />
3.5 SENSOR SYSTEM LAYOUT AND CONFIGURATION<br />
3.5.1 Approach<br />
In the initial phases <strong>of</strong> this project, collaborative agreements were pursued with a vendor that purported <strong>to</strong><br />
design and market fuel tracking sensor systems. Another vendor was also identified that made similar<br />
claims. However, the first vendor was unable <strong>to</strong> provide any specifications or details that would enable<br />
consideration <strong>of</strong> their system, so attempts at collaboration were abandoned. The second vendor would not<br />
respond <strong>to</strong> phone and e-mail inquiries regarding their products. Therefore we resolved <strong>to</strong> develop our own<br />
mounting hardware for the sensor suite.<br />
3.5.2 Off-Trailer Evaluation and Development<br />
After careful consideration, a decision was made <strong>to</strong> mount all <strong>of</strong> the sensing hardware, with the exception<br />
<strong>of</strong> the hatch sensor, down by the fill valve <strong>of</strong> each compartment <strong>to</strong> be moni<strong>to</strong>red, as shown schematically<br />
in Fig. 45.<br />
Fig. 45. Schematic <strong>of</strong> sensor placement around fill valve on trailer compartment.<br />
47
Further, since each downpipe leading from the compartment bot<strong>to</strong>m <strong>to</strong> the fill valve already has a<br />
replaceable, acrylic sight glass, as shown in Fig. 46, it was decided <strong>to</strong> design a “drop-in” replacement<br />
sight glass that could accommodate the various sensors. In this section we will describe how the sensors<br />
were integrated with the sight glass and valve. See Appendix G for detailed drawings <strong>of</strong> the cus<strong>to</strong>m-made<br />
sight glass.<br />
Fig. 46. View <strong>of</strong> downpipe region on trailer showing sight glasses and bot<strong>to</strong>m<br />
valves.<br />
Figure 47 shows how the sensors were arranged on the sight glass and valve. As discussed previously, the<br />
marker sensor (not yet installed in Fig. 47) mounts on the bot<strong>to</strong>m <strong>of</strong> this sight glass. Figure 47 shows the<br />
isolation and bleed valves that were placed inline with the pressure-based level sensor, the isolation valve<br />
being upstream and the bleed valve downstream <strong>of</strong> the sensor. The isolation valve was primarily intended<br />
<strong>to</strong> protect the sensor in scenarios where high impulse pressure was anticipated. High impulse pressures<br />
were feared during fuel loading, when the fuel is pumped in using pressure supplied by the loading pump.<br />
A secondary purpose <strong>of</strong> the isolation valve was <strong>to</strong> isolate the sensor if leaking or other failure occurred.<br />
The bleed valve allows entrapped air or built-up pressure <strong>to</strong> be bled <strong>of</strong>f as needed during the field test<br />
efforts.<br />
The proximity sensor (valve switch) is mounted via a bracket that also serves <strong>to</strong> hold a pipe hanger for the<br />
level sensor. It was necessary <strong>to</strong> install a target magnet on the valve handle because the valve handles are<br />
cast aluminum and thus could not trigger the proximity switch.<br />
With the sight glass and mounting hardware shown in Fig. 47, and the sensor development described<br />
above, the sensor team was able <strong>to</strong> <strong>of</strong>fer a “drop-in” sensing suite for the field testing, a solution for<br />
moni<strong>to</strong>ring the valve, the level <strong>of</strong> the fuel, and the marker in the fuel. Section 7 discusses what lessons<br />
were learned when deploying this sensor suite during the field testing.<br />
48
Fig. 47. Sensors mounted on trailer fill valve and ORNL-designed sight glass.<br />
49
4. COMMUNICATIONS<br />
The communications portion <strong>of</strong> the FTE effort handled the real-time collection and transmission <strong>of</strong> onboard<br />
sensor data <strong>to</strong> the back <strong>of</strong>fice.<br />
4.1 SELECTION OF METHODOLOGY<br />
In the initial planning for this effort, it was thought that ORNL would use a wireless technology solution<br />
<strong>to</strong> transmit sensor data from the trac<strong>to</strong>r <strong>to</strong> the trailer. Then, a computer-based DAS would be developed <strong>to</strong><br />
gather and package the data for transmission <strong>to</strong> the back <strong>of</strong>fice via a novel or third-party land-based<br />
cellular system.<br />
ORNL transportation staff were consulted about possible options based on their prior and ongoing heavytruck<br />
data collection and transmission work conducted for the Department <strong>of</strong> Energy’s (DOE’s) Vehicle<br />
Technologies Program and the Federal Mo<strong>to</strong>r Carrier Safety Administration’s Wireless Roadside<br />
Inspection (WRI) Program. It was suggested that the work being done under these projects could be<br />
adapted and applied <strong>to</strong> the FTE project <strong>to</strong> reduce duplication <strong>of</strong> effort and provide better control <strong>of</strong> the<br />
data collection and transmission process by ORNL, which would be critical for the success <strong>of</strong> this phase<br />
<strong>of</strong> the effort.<br />
The communications system required <strong>to</strong> accomplish the needs <strong>of</strong> the FTE effort would generally consist<br />
<strong>of</strong> the following major components:<br />
1. Device <strong>to</strong> collect and format sensor signals from trailer (switches, level sensor, marker sensor,<br />
weight)<br />
2. Device <strong>to</strong> convey the sensor signals from the trailer <strong>to</strong> the trac<strong>to</strong>r without the addition <strong>of</strong> any<br />
cabling or wiring between the trac<strong>to</strong>r and trailer (maintaining the integrity <strong>of</strong> the standard trac<strong>to</strong>rtrailer<br />
electrical connection was a requirement in order for the FTE solution <strong>to</strong> be universally<br />
accepted by stakeholders)<br />
3. Device <strong>to</strong> receive sensor data from trailer and condition and format the sensor signals for<br />
acceptance by the on-board computer<br />
4. Communications platform capable <strong>of</strong> sending the data packets <strong>to</strong> a back <strong>of</strong>fice system (BOS) for<br />
processing<br />
The basic conceptual components <strong>of</strong> the FTE system are shown in Fig. 48.<br />
Two concepts for data collection and transmission were proposed: (1) use currently existing cellular<br />
telematics solution such as an electronic on-board recorder or (2) use the DAS and communications<br />
systems developed by ORNL for the WRI POC testing. These methods will be coved in Sects. 4.1.1 and<br />
4.1.2. For either <strong>of</strong> these transmission methods <strong>to</strong> be successful, an effective means <strong>of</strong> communicating the<br />
sensor data from the trailer <strong>to</strong> the trac<strong>to</strong>r would need <strong>to</strong> be identified or developed. This will be covered in<br />
detail in Sect. 4.2.<br />
4.1.1 Use <strong>of</strong> Currently Existing Telematics Device<br />
There currently exist a number <strong>of</strong> <strong>of</strong>f-the-shelf technologies <strong>to</strong> retrieve data from commercial vehicles.<br />
These systems, called “telematics devices,” consist <strong>of</strong> an on-board computer, an interface <strong>to</strong> the vehicle<br />
data bus, optional external input ports, a display screen, a keyboard or other input device, and wireless<br />
communications capability <strong>to</strong> transfer information from the vehicle via commercial mobile radio services.<br />
Such devices are used by the trucking industry <strong>to</strong> communicate information <strong>to</strong> and from the driver, track<br />
51
vehicles and cargo, record driver hours <strong>of</strong> service, and moni<strong>to</strong>r vehicle systems and vehicle performance<br />
for maintenance and safety personnel.<br />
Fig. 48. Conceptual components <strong>of</strong> the fuel-tax-evasion system.<br />
In order <strong>to</strong> use a currently existing telematics device, the sensor data from the vehicle would need <strong>to</strong> be<br />
brought <strong>to</strong> the trac<strong>to</strong>r (the location <strong>of</strong> the telematics computer), be accepted by the telematics device<br />
(input port available, data format, and data sample rate), be s<strong>to</strong>red by the device, and be packaged for<br />
transmission by the device. Additionally, the telematics supplier’s back <strong>of</strong>fice would need <strong>to</strong> be able <strong>to</strong><br />
receive and parse the additional data for this effort and transmit it via the Internet for use by ORNL.<br />
ORNL had previously conducted a survey <strong>of</strong> the capabilities <strong>of</strong> existing telematics hardware and systems<br />
for the WRI effort and contacted vendors whose systems seemed promising for the FTE project.<br />
However, the required sample rate and RS485 communications defined for the FTE project’s fuel marker<br />
sensor proved <strong>to</strong> be problematic <strong>to</strong> the telematics providers. While their systems could be adapted <strong>to</strong><br />
facilitate the needs <strong>of</strong> the FTE project, considerable time and resources would be required. Additionally,<br />
there were risks associated with the development <strong>of</strong> the needed s<strong>of</strong>tware application. It was decided <strong>to</strong> use<br />
the ORNL DAS developed for the WRI project because it provided the reliability and flexibility needed<br />
for this early stage <strong>of</strong> system testing and development. Once a successful field test was conducted using<br />
the ORNL DAS, a set <strong>of</strong> functional specifications for the system could be developed and shared with the<br />
telematics industry for their use in supporting future FTE efforts.<br />
4.1.2 Use <strong>of</strong> ORNL DAS<br />
To circumvent the identified issues relative <strong>to</strong> the use <strong>of</strong> a standard telematics solution (acceptance <strong>of</strong><br />
sensor signals, fast sample rate, data buffering, connection <strong>to</strong> the vehicle’s data bus), it was decided <strong>to</strong> use<br />
52
the DAS and communications systems developed by ORNL for the WRI POC testing (Fig. 49). This<br />
system was readily able <strong>to</strong> connect <strong>to</strong> the vehicles data bus (older J1708 and/or the newer J1939) and was<br />
able <strong>to</strong> sample the data at rates up <strong>to</strong> 1 hertz (Hz) while buffering data for extended periods <strong>of</strong> time if<br />
necessary. Additionally, this ORNL DAS had a built-in cellular modem <strong>to</strong> allow the data <strong>to</strong> be wirelessly<br />
transmitted <strong>to</strong> a webpage for manipulation by the evidential reasoning system.<br />
Fig. 49. ORNL DAS used for data collection.<br />
With the ORNL DAS’s ability <strong>to</strong> connect directly <strong>to</strong> the vehicle data bus, it was decided <strong>to</strong> post the trailer<br />
sensor data <strong>to</strong> the trac<strong>to</strong>r’s J1939 data bus using Frequency Shift Key (FSK) signaling. FSK signaling<br />
allows for the transmission <strong>of</strong> digitized data from the trailer-borne sensors <strong>to</strong> be passed from the trailer <strong>to</strong><br />
the trac<strong>to</strong>r over the standard J560 electrical connec<strong>to</strong>r. An FSK modem converts the digital data<br />
(modulated in the frequency domain) across the J560 connec<strong>to</strong>r, and a mating FSK modem on the trailer<br />
coverts the frequency domain signal back <strong>to</strong> digital data (demodulation). This novel approach “piggybacks”<br />
on the existing trailer-<strong>to</strong>-trac<strong>to</strong>r wiring and requires no additional connections.<br />
The major components <strong>of</strong> the proposed FTE data communications system were as follows:<br />
• Trailer-<strong>to</strong>-Trac<strong>to</strong>r Communications Unit (T2TCU), consisting <strong>of</strong> a module <strong>to</strong> receive the sensor<br />
signals, an FSK modem modula<strong>to</strong>r <strong>to</strong> send sensor data over the J560 connec<strong>to</strong>r, FSK modem<br />
demodula<strong>to</strong>r <strong>to</strong> convert sensor data back <strong>to</strong> digital information, and a module <strong>to</strong> place sensor data<br />
on<strong>to</strong> the trac<strong>to</strong>rs J1939. The T2TCU set <strong>of</strong> components are located both on the trac<strong>to</strong>r and trailer.<br />
• ORNL DAS with cellular model for wireless data transfer.<br />
These major components are shown in Fig. 50.<br />
53
4.2 DESIGN OF THE T2TCU<br />
Fig. 50. <strong>Fuel</strong>-tax-evasion communications major components.<br />
Due <strong>to</strong> the restrictions imposed by the use <strong>of</strong> the RS485 pro<strong>to</strong>col for the fuel marker sensor, a suitable<br />
commercial <strong>of</strong>f-the-shelf solution was not identified for the T2TCU. Therefore, the decision was made <strong>to</strong><br />
draft a set <strong>of</strong> functional specifications for such a device and <strong>to</strong> seek bids from private industry <strong>to</strong> supply<br />
the T2TCU in a hardened form for use in the field testing. Air-Weigh, Inc. (Air-Weigh) <strong>of</strong> Eugene,<br />
Oregon, was awarded the contract <strong>to</strong> design and build the T2TCU for use in the FTE project.<br />
The T2TCU was developed with the following inputs in mind:<br />
1. RS485 fuel marker sensors (2),<br />
2. Hatch position sensors (2),<br />
3. Belly valve position sensors (2),<br />
4. <strong>Fuel</strong> level transducers (2),<br />
5. Trailer weight transducer (1), and<br />
6. Trac<strong>to</strong>r weight transducer (1).<br />
Air-Weigh proposed modifying their already-existing eStroke Chassis Communications Module (CCM),<br />
an FSK-based device, <strong>to</strong> facilitate the needed sensor data collection, transfer the data from the trailer <strong>to</strong><br />
the trac<strong>to</strong>r, and post this information on<strong>to</strong> the trac<strong>to</strong>r’s J1939 data bus. This device was already capable <strong>of</strong><br />
handling the weight transducer signals as well as posting sensor data on<strong>to</strong> the trac<strong>to</strong>r’s J1939 data bus.<br />
Air-Weigh’s design team met the additional requirements <strong>of</strong> the FTE effort by performing the following<br />
work steps:<br />
54
1. Modified the CCM device <strong>to</strong> collect data from hatch, valve, liquid level, and marker<br />
concentration sensors. The modification consisted <strong>of</strong> hardware changes for the device <strong>to</strong> operate<br />
in a trailer environment exposed <strong>to</strong> outside weather conditions, hardware changes relative <strong>to</strong><br />
sensor connectivity, and s<strong>of</strong>tware <strong>to</strong> interface the CCM unit <strong>to</strong> the sensors. This modified device<br />
was identified as T2TCU Trailer.<br />
2. Modified the CCM s<strong>of</strong>tware such that the T2TCU Trailer device will transmit the data as<br />
collected <strong>to</strong> a corresponding an Air-Weigh LoadMaxx trac<strong>to</strong>r unit (identified as T2TCU Trac<strong>to</strong>r)<br />
over the standard trac<strong>to</strong>r-trailer J560 power/signals connec<strong>to</strong>r.<br />
3. Modified the LoadMaxx s<strong>of</strong>tware <strong>to</strong> serve as a T2TCU Trac<strong>to</strong>r device <strong>to</strong> receive the data from<br />
the T2TCU Trailer device and transmitted this data <strong>to</strong> the vehicle J1939 data bus.<br />
4. Provided three sets <strong>of</strong> modified hardware for the project. Each set <strong>of</strong> hardware consisted <strong>of</strong> a<br />
modified CCM device with sensor and power cables and a modified LoadMaxx device with<br />
power and interface cables. The three sets <strong>of</strong> hardware were used for<br />
(a) Lab Testing by Air-Weigh (non-environmentally hardened system),<br />
(b) Lab Testing by ORNL (non-environmentally hardened system), and<br />
(c) Field Testing on a vehicle which included a trac<strong>to</strong>r and trailer (environmentally hardened<br />
system).<br />
5. Provided assistance <strong>to</strong> ORNL in testing and identifying J1939 parameters.<br />
The trailer side <strong>of</strong> the T2TCU provided power <strong>to</strong> the sensors installed for each instrumented<br />
compartment. The T2TCU transmitted the sensor readings constantly at a rate <strong>of</strong> 1 Hz; no data accrual or<br />
additional on-board decision-making was required. Communication between the trac<strong>to</strong>r and trailer was<br />
done via the standard J560 connection native <strong>to</strong> the vehicle. The trac<strong>to</strong>r-side information interface was<br />
done via the J1939. The T2TCU is shown in Fig. 51, along with a few sensors used in bench<strong>to</strong>p testing.<br />
Fig. 51. T2TCU with test sensors.<br />
Further, Air-Weigh was tasked <strong>to</strong> provide support for installation <strong>of</strong> the T2TCU equipment on a trac<strong>to</strong>r<br />
and trailer, support ORNL during the field testing, and assist ORNL in preparation <strong>of</strong> the final report as<br />
needed.<br />
A list <strong>of</strong> the sensors along with their corresponding measurements and power requirements is shown in<br />
Table 5; two tanker compartments were instrumented for a <strong>to</strong>tal <strong>of</strong> eight sensors.<br />
55
Table 5. Summary <strong>of</strong> sensors per fuel tanker compartment<br />
Sensor Type Measurement<br />
56<br />
Power<br />
requirements<br />
Other information<br />
Hatch SPDT switch Open/closed status 5–12V,
Once the password was validated, the s<strong>of</strong>tware presented the user with the “FTE Settings” dialog box<br />
shown in Fig. 53. In the “Data Sampling Information” frame (lower-left corner), the user could specify<br />
the sampling and data saving frequencies, as well as other parameters such as the length <strong>of</strong> the reporting<br />
period (5-min data files was the default). The “FTE Settings” dialog box also allowed the user <strong>to</strong> specify<br />
information describing the FTE vehicles and the IP addresses <strong>of</strong> the on-board DAS. In cases where<br />
communication was lost, or if there were any other problem detected by the FTE Upload Data Service<br />
s<strong>of</strong>tware, a message was e-mailed <strong>to</strong> the address specified in the “Communication Information” frame<br />
within the “FTE Settings” dialog box.<br />
After all the data retrieval and saving parameters were specified, the user pressed the “Start Service”<br />
but<strong>to</strong>n (Fig. 52). The s<strong>of</strong>tware then started the data service, indicating this event on the main screen<br />
(Fig. 54). At that point, the “Start Service” but<strong>to</strong>n changed <strong>to</strong> “S<strong>to</strong>p Service” <strong>to</strong> allow the user <strong>to</strong><br />
terminate the data-retrieval and saving service.<br />
Fig. 53. <strong>Fuel</strong>-<strong>Tax</strong>-<strong>Evasion</strong> Upload Data Service s<strong>of</strong>tware—FTE settings.<br />
Fig. 54. <strong>Fuel</strong> <strong>Tax</strong> <strong>Evasion</strong> Upload Data Service s<strong>of</strong>tware—started data retrieval service.<br />
57
Once the user was ready <strong>to</strong> start the actual data collection, the “Start Data Stream” but<strong>to</strong>n located in the<br />
main screen was pressed. This triggered the communication s<strong>of</strong>tware <strong>to</strong> establish communication with the<br />
vehicle(s) participating in the tests and start retrieving, processing, and saving the real-time information<br />
generated by the vehicle(s). Figure 55 shows the communications s<strong>of</strong>tware accessing one <strong>of</strong> the vehicles<br />
that participated in the test; note that the communications s<strong>of</strong>tware used was publicly available s<strong>of</strong>tware<br />
named “curl.”<br />
The FTE Upload Data Service s<strong>of</strong>tware could also be used <strong>to</strong> post-process the data files (note: the onboard<br />
DAS also saved the data collected in files that could be post processed after the tests were<br />
concluded). This was achieved by checking the “Post Processing” check box on the main screen and<br />
pressing the “Start Service” but<strong>to</strong>n (Fig. 52).<br />
Fig. 55. <strong>Fuel</strong>-<strong>Tax</strong>-<strong>Evasion</strong> Upload Data Service s<strong>of</strong>tware—communications s<strong>of</strong>tware.<br />
58
5. GEO-FENCING AND EVIDENTIAL REASONING APPLICATIONS<br />
As part <strong>of</strong> this research study, the development <strong>of</strong> a POC intelligent GIS-based system was called for. The<br />
system aims <strong>to</strong> facilitate near-real time notification <strong>of</strong> suspicious variation in standard delivery processes,<br />
tracking the tanker as it travels from the origin (e.g., terminal) <strong>to</strong> its destinations (e.g., retail outlet) on the<br />
delivery route. The control center, where the “system” resides, moni<strong>to</strong>rs sensor activities occurring at and<br />
between the terminal loading <strong>of</strong> the tank truck and the unloading at the retail outlet. By applying sensor<br />
technologies in combination with <strong>to</strong>ols developed based on data fusion and validation techniques,<br />
suspicious activities can be identified in real time. When necessary, communication with law enforcement<br />
personnel can be performed in a timely manner <strong>to</strong> facilitate the investigation <strong>of</strong> potential fuel diversion<br />
activities.<br />
The intelligent GIS-based system developed under this research study performs two major functions: ge<strong>of</strong>encing<br />
and evidential reasoning. Description <strong>of</strong> these techniques, general uses, and their specific roles<br />
applied within the scope <strong>of</strong> this study are covered in this section.<br />
5.1 BACKGROUND<br />
5.1.1 Geo-Fencing Basics<br />
A geo-fence is a virtual perimeter for a given geographic area, for example, a point location or a region.<br />
The geo-fence could be set with a predetermined set <strong>of</strong> boundaries (e.g., school zone) or be dynamically<br />
generated (e.g., within a 2 mile radius <strong>of</strong> the point location). The geo-fencing capability is a critical<br />
element in the telematics system’s functionalities, which is commonly used in the trucking industry (e.g.,<br />
PeopleNet) for vehicle tracking and moni<strong>to</strong>ring. When a geo-fence is crossed by an equipped vehicle (as<br />
determined from GPS data), a warning is triggered. This warning can then be transmitted electronically<br />
(e.g., email or other communication) <strong>to</strong> the designated person (e.g., opera<strong>to</strong>r at the control center or<br />
enforcement personnel). In certain extreme situations, the geo-fencing can be linked <strong>to</strong> technology that<br />
immobilizes the vehicle (such as in the case <strong>of</strong> a s<strong>to</strong>len vehicle).<br />
Under this research study, instead <strong>of</strong> geo-fencing at a point location (e.g., the gas station) as is typically<br />
provided by telematics providers, a buffer zone along the truck travel route is considered (Fig. 56). A<br />
discussion <strong>of</strong> the development <strong>of</strong> a geo-fencing application, related tracking methodology, and challenges<br />
encountered in this project are provided in Sect. 5.3 <strong>of</strong> this report.<br />
5.1.2 Fundamentals <strong>of</strong> Evidential Reasoning Methods<br />
Under this POC study, the evidential reasoning approach is <strong>to</strong> be integrated in<strong>to</strong> an intelligent threat<br />
identification and assessment GIS-based system <strong>to</strong> assist an analyst in sorting through volumes <strong>of</strong> data<br />
and information (i.e., evidence). This system would flag any peculiar patterns or suspicious activities, so<br />
proper responses and timely actions can be taken.<br />
Evidential reasoning techniques are commonly used in knowledge-based expert systems and artificial<br />
intelligence researches. The objective <strong>of</strong> this technique is <strong>to</strong> assess the effect <strong>of</strong> all available pieces <strong>of</strong><br />
evidence upon a hypothesis, by making use <strong>of</strong> domain-specific knowledge. Various techniques can be<br />
applied <strong>to</strong> perform evidential reasoning tasks, each with several variants depending on their applications.<br />
Many discussions <strong>of</strong> reasoning frameworks can be found in literatures, for example, <strong>to</strong> name only a few,<br />
Valin, 6 Yang & Xu, 7 and Tang & Al-shaer. 8 Two specific types <strong>of</strong> evidential reasoning applications are<br />
implemented in this current FTE detection research study; they are the rule-based logic reasoning<br />
technique and the Dempster-Shafer (D-S) believe function-based approach. A brief introduction <strong>of</strong> these<br />
two reasoning approaches is given below.<br />
59
5.1.2.1 Rule-based logic reasoning<br />
Fig. 56. Example <strong>of</strong> a geo-fencing proximity.<br />
Rule-based reasoning approach is based on simple logic <strong>of</strong> if-then rules. This approach has obvious<br />
computational advantages. These if-then rules typically can be established <strong>to</strong> reflect logic and patterns<br />
recognized from examining existing datasets (e.g., relevant his<strong>to</strong>rical data). In many cases, particularly<br />
when formal data is not readily available, knowledge from subject experts can also be captured <strong>to</strong> derive<br />
decision rules. For complex situations, however, an excessive amount <strong>of</strong> expert knowledge will be<br />
required in order <strong>to</strong> have a comprehensive set <strong>of</strong> rules <strong>to</strong> effectively perform the necessary reasoning.<br />
This is one <strong>of</strong> the disadvantages <strong>of</strong> this type <strong>of</strong> reasoning approach. Furthermore, information based on<br />
knowledge <strong>of</strong> experts could be quite subjective, and combining multiple sets <strong>of</strong> knowledge from a group<br />
<strong>of</strong> experts <strong>to</strong> draw a consensus might not necessarily be trivial.<br />
Moreover, the rules are commonly fixed and exact (i.e., if A then B). Therefore, uncertainty is generally<br />
not considered. To allow limited consideration <strong>of</strong> uncertainty in this reasoning approach, researchers have<br />
included fuzzy logic in some rules. In this case, instead <strong>of</strong> the exact “true or false” when evaluating a rule,<br />
fuzzy logic variables can be set <strong>to</strong> have a range <strong>of</strong> values based on the degree <strong>of</strong> likelihood (i.e., from<br />
0 <strong>to</strong> 1).<br />
60
5.1.2.2 Dempster-Shafer evidential reasoning techniques<br />
Dempster-Shafer (D-S) theory is a powerful technique <strong>of</strong> combining accumulative evidence or for<br />
changing prior opinions in the light <strong>of</strong> new evidence. It is well known for its usefulness <strong>to</strong> express<br />
uncertainty and, at times, conflicting judgments (such as knowledge gathered from a panel <strong>of</strong> experts).<br />
The D-S theory, although a probabilistic approach, not only allows for a measure <strong>of</strong> uncertainty but also<br />
takes in<strong>to</strong> account a proposition’s ignorance <strong>of</strong> which hypothesis is correct. This is the main difference<br />
between probability and the D-S reasoning (which defines measures as “beliefs”). For example, in<br />
probability theory, the probabilities <strong>of</strong> mutually exclusive hypothesis must sum <strong>to</strong> 1, so if the probability<br />
<strong>of</strong> “snow” is 0.6, it implies that the probability <strong>of</strong> “not snow” is 0.4 (i.e., 1 – 0.6). On the other hand, D-S<br />
beliefs for mutually exclusive hypothesis may sum <strong>to</strong> less than 1. For a given event A, the D-S measures<br />
are defined as follows:<br />
• Belief (A), which represents the lower bound (pessimistic)<br />
• Doubt (A) = Belief (not A)<br />
• Plausibility (A) = 1 – Doubt (A) which represents the upper bound (optimistic)<br />
The capability <strong>to</strong> model the “doubt” makes D-S belief theory a prevailing choice for many researchers<br />
and applications. That is, D-S approach allows “incomplete” assessments <strong>to</strong> be conducted when situations<br />
such as a lack <strong>of</strong> data or the inability <strong>of</strong> experts <strong>to</strong> assess or provide precise information occur.<br />
Essentially, the D-S belief network can be viewed as a graphical and numerical representation <strong>of</strong><br />
dependences and uncertainty. A belief network is a computational structure composed <strong>of</strong> clusters <strong>of</strong> nodes<br />
representing variables (e.g., evidence) interrelated by links signifying the relationships among the nodes.<br />
It is frequently used as a knowledge representation scheme <strong>to</strong> handle situations where causal or diagnostic<br />
relationships are <strong>to</strong> be captured and reviewed.<br />
Various forms <strong>of</strong> D-S evidential reasoning approaches have been applied in classification <strong>of</strong> image<br />
texture for remote sensing applications, in detection <strong>of</strong> insurance fraud, in system safety and reliability<br />
modeling, and in many other applications. Since the D-S evidential reasoning approach uses beliefs <strong>to</strong><br />
allow an “agent” (i.e., s<strong>of</strong>tware or algorithm) <strong>to</strong> act rationally, it is more likely <strong>to</strong> produce diagnoses<br />
correctly and more quickly than other evidential reasoning techniques.<br />
5.1.3 Challenges<br />
In an ideal setting, the “legitimacy” <strong>of</strong> individual loads, <strong>of</strong>floads, and movements <strong>of</strong> petroleum products<br />
can be identified by integrating and validating, through evidential reasoning processes, information from<br />
electronic shipping documentation, vehicle tracking devices, sensor devices, and fuel markers. Suspicious<br />
activities can then be “flagged” and appropriate actions can be taken by the control center personnel (e.g.,<br />
contact driver, inform enforcement).<br />
Several challenges were encountered during the course <strong>of</strong> the project that limited the development <strong>of</strong><br />
“ideal” functionality <strong>of</strong> the intelligent GIS-based system. Although Pilot provided the Evidential<br />
Reasoning Team access its PeopleNet tracking reports (data collected from on-board telematics devices),<br />
no shipping documentation or information from dispatcher scheduling (about the deliveries) was<br />
available. Available PeopleNet reports allowed the Evidential Reasoning Team <strong>to</strong> geographically trace<br />
Pilot truck travel routes, s<strong>to</strong>p locations and durations, time and dates, and similar information. However,<br />
there was no information available regarding fuel quantity being handled (loaded or <strong>of</strong>floaded) at any<br />
locations, whether a particular s<strong>to</strong>p was for a scheduled delivery or for other purposes, or any information<br />
about actual activities being conducted at the given locations.<br />
61
Another major limitation was the availability <strong>of</strong> sensor data (for valve, hatch, fuel level in the tank, and<br />
fuel marker concentration). Since no Pilot trucks (nor the passenger car used for simulation) were actually<br />
instrumented with the sensors, the Evidential Reasoning Team had <strong>to</strong> rely on very limited simulation data<br />
for its modeling and algorithm design and development. Additional information on the system design and<br />
development is given in this section.<br />
5.2 REAL-WORLD FUEL DELIVERY OPERATION DATA COLLECTION EFFORTS<br />
Data related <strong>to</strong> fuel delivery operations was obtained from several sources including observations made<br />
during “shadowing” <strong>of</strong> tanker drivers during normal operations, notes gathered from interviews with Pilot<br />
managers, and analysis <strong>of</strong> specific PeopleNet reports. Supplemental information was also collected<br />
through web searches and internal communications with the Sensor Team. In addition, simulations were<br />
conducted <strong>to</strong> generate sensor information using a passenger car with connections <strong>to</strong> the DAS. These data<br />
sources and summary findings are briefly described in this section.<br />
5.2.1 Real-World Information Relating <strong>to</strong> Pilot Tanker Truck Operations<br />
Information regarding Pilot tanker truck delivery operations was gathered from observations made by the<br />
Evidential Reasoning Team members during trips shadowing the tanker drivers as well as from<br />
discussions with Pilot managers. Summaries from these information collection efforts are presented in the<br />
following subsections.<br />
5.2.1.1 Observations from Pilot fuel delivery operations<br />
The Evidential Reasoning Team made two visits <strong>to</strong> the Pilot tanker truck terminal located in Knoxville,<br />
Tennessee. Several trips were made in which the team shadowed Pilot tanker truck drivers. The first visit<br />
focused on activities where tanker trucks conducted the fuel loading, while the second visit were <strong>to</strong><br />
observe all fuel-delivery-related activities. During their time with the drivers, the Evidential Reasoning<br />
Team acquired some useful information on how the trucks operate. This section describes what the team<br />
observed from the entire pickup (i.e., loading from a terminal rack) and delivery processes (i.e., <strong>of</strong>floading<br />
fuel at a delivery location).<br />
General operations<br />
Pilot does not own fuel terminals, although Pilot might own the fuel that is s<strong>to</strong>red at the terminal. The<br />
team learned that Pilot gas stations and Travel Centers (i.e., gas stations with convenient s<strong>to</strong>res) are not<br />
individually owned franchises; rather, they are owned and operated by the Pilot Travel Center LLC<br />
(currently, Pilot & Flying J LLC) Corporation. Thus, all gas station/s<strong>to</strong>re employees are Pilot employees.<br />
All fuels sold at Pilot gas stations are delivered by Pilot’s own tanker trucks. In addition <strong>to</strong> delivering fuel<br />
for Pilot travel centers and gas stations (which now includes Flying J gas stations), Pilot tankers also<br />
make fuel deliveries <strong>to</strong> other gas stations, truck s<strong>to</strong>ps, and wholesale cus<strong>to</strong>mers. These non-Pilot-owned<br />
gas stations could also utilize multiple companies <strong>to</strong> deliver their fuels.<br />
Although, Pilot fuel tankers operate 24 hours a day, 7 days a week, their drivers are on a 12-hour work<br />
shift, operating under the required DOT hours-<strong>of</strong>-service rule. The on-board system serves as driver’s<br />
logbook and provides au<strong>to</strong>matic tracking information (active on-duty hours and active driving hours) for<br />
the driver. In terms <strong>of</strong> daily schedule, the drivers receive their list <strong>of</strong> deliveries from the dispatcher in the<br />
morning. The dispatchers’ list is generated hours in advance, typically based on estimates <strong>of</strong> gas sales<br />
from the day before. Usually a driver makes about four <strong>to</strong> five pickup and delivery <strong>to</strong>urs per shift. One <strong>of</strong><br />
the Pilot drivers being shadowed for this visit is a “Team Leader” driver. The “Team Leader” reports<br />
directly <strong>to</strong> the fleet manager and usually has a group <strong>of</strong> Pilot tanker drivers that report <strong>to</strong> him.<br />
62
The Pilot drivers use both PeopleNet and cell phones for communication. PeopleNet allows text<br />
communication (messaging) among the Pilot tanker trucks, the fuel terminals, Pilot headquarters, and<br />
Pilot Travel Centers (gas stations). While the dispatcher can reroute a tanker <strong>to</strong> make an “unscheduled”<br />
delivery if the need arises, the driver can also ping a gas station prior <strong>to</strong> a “scheduled” delivery <strong>to</strong> obtain<br />
more up-<strong>to</strong>-date fuel inven<strong>to</strong>ries by fuel types, so the need <strong>of</strong> delivery can be confirmed. That is, the Pilot<br />
driver has the ability <strong>to</strong> double-check prior <strong>to</strong> traveling <strong>to</strong> the gas station, <strong>to</strong> determine whether the station<br />
actually has the s<strong>to</strong>rage capacity for the amount <strong>of</strong> fuel that was scheduled <strong>to</strong> be delivered. If the needed<br />
s<strong>to</strong>rage capacity is not available, the driver will communicate with the dispatcher <strong>to</strong> obtain other delivery<br />
assignments. Drivers can get more up-<strong>to</strong>-date inven<strong>to</strong>ry data by communicating with the gas station<br />
system right before its scheduled delivery.<br />
It is not unusual for the drivers <strong>to</strong> have last-minute schedule changes. One driver indicated that his<br />
delivery schedule for that morning had changed twice already before the Evidential Reasoning team<br />
shadowing exercise started in that morning. Also during one <strong>of</strong> the shadowing exercises, a driver received<br />
an urgent message from the dispatcher regarding a non-Pilot s<strong>to</strong>re that was out <strong>of</strong> gas. The dispatcher<br />
asked the driver <strong>to</strong> make this station his next delivery. According <strong>to</strong> the driver, this situation would not<br />
happen <strong>to</strong> a Pilot-owned gas station or travel center because the Pilot system tracks inven<strong>to</strong>ries for all the<br />
s<strong>to</strong>res they own. Non-Pilot owned s<strong>to</strong>res are responsible for checking their own inven<strong>to</strong>ries.<br />
Equipment (tanker truck) operations<br />
Typically, Pilot tanker trucks are equipped with four compartments; the first and the fourth compartments<br />
have capacities <strong>of</strong> 3,000 gal, and the middle two compartments are 1,500 gal each. In practice, drivers<br />
usually do not load the compartments up <strong>to</strong> their full capacities, however. For instance, one <strong>of</strong> the drivers<br />
being shadowed only filled about 2,500 gal each in<strong>to</strong> the two 3,000 gal compartments and about 1,300<br />
each in<strong>to</strong> the other two 1,500 gal compartments, which is roughly about 85% capacity. The reason<br />
provided by the drivers was that, under current DOT highway law, the overall gross vehicle weight <strong>of</strong> the<br />
truck is not <strong>to</strong> exceed 80,000 lb. Therefore, drivers would either fill the tanker compartments partially full<br />
(as in the given example) or load only two or three <strong>of</strong> the four compartments.<br />
There are hatches on the <strong>to</strong>p <strong>of</strong> the tankers, but no “<strong>to</strong>p” loading is allowed due <strong>to</strong> EPA ruling. The<br />
hatches are typically used during maintenance <strong>of</strong> the tankers. However, hatches can be opened for<br />
moni<strong>to</strong>ring the fuel intake (which requires two people) on tankers that do not have an au<strong>to</strong>matic tank-full<br />
s<strong>to</strong>p mechanism installed. There is no flow meter equipped on the tankers, even though one driver<br />
claimed that he can “time” the opening and closing <strong>of</strong> the valve <strong>to</strong> “guesstimate” how many gallons <strong>of</strong><br />
fuel are being transferred. This is the main reason why drivers do not want <strong>to</strong> <strong>of</strong>f-load partial loads from<br />
the tanker compartments.<br />
<strong>Fuel</strong> loading operations<br />
Before starting the tanker, the driver usually make a visual inspection <strong>of</strong> the truck by walking around it <strong>to</strong><br />
ensure that no obstacles could hinder the truck’s free movement, and some also checked all tires. At<br />
times, the line at the fueling terminal could be long, so the driver would have <strong>to</strong> wait a while before<br />
pulling in<strong>to</strong> the rack. Since Pilot drivers are paid by the hour, this waiting time does not penalize them.<br />
Pilot does not instruct the drivers <strong>to</strong> obtain fuels from any specific fuel terminals. Drivers may choose any<br />
nearby terminals for fuel purchasing, with the lowest cost being the selection criteria, whether or not the<br />
fuel is owned by the Pilot company. When a terminal is out <strong>of</strong> fuel, another nearby terminal can be used.<br />
All “purchasing” processes at the terminals are conducted electronically. The driver used a plastic card<br />
with a magnetic strip, similar <strong>to</strong> a credit card, <strong>to</strong> purchase the fuel. He entered the codes (e.g., company<br />
id, driver id), type <strong>of</strong> fuel, and amount <strong>of</strong> fuel, etc., in<strong>to</strong> the computer terminals set up next <strong>to</strong> the rack.<br />
63
When the loading process was complete, a bill <strong>of</strong> lading (BOL) was au<strong>to</strong>matically generated and sent <strong>to</strong><br />
the billing company and Pilot. A hard copy was then printed so the driver can keep a copy for his records.<br />
The driver also entered this fuel intake information in<strong>to</strong> the on-board system (before leaving the terminal),<br />
which was immediately transmitted <strong>to</strong> Pilot’s headquarters via PeopleNet.<br />
Offloading operations<br />
Before <strong>of</strong>floading the fuel at the destination gas stations, the drivers used a long stick <strong>to</strong> measure the<br />
depth <strong>of</strong> the existing fuel in the underground s<strong>to</strong>rage tank. This is a common practice, according <strong>to</strong> the<br />
drivers. It serves as an added precaution <strong>to</strong> ensure the s<strong>to</strong>rage tank can hold the amount that will be<br />
<strong>of</strong>floaded in<strong>to</strong> it. Another purpose <strong>of</strong> using the long stick is <strong>to</strong> verify whether or not there is water in the<br />
tank (e.g., due <strong>to</strong> leaking or other reason). If water is present, the end <strong>of</strong> that stick will turn red <strong>to</strong> provide<br />
a warning signal.<br />
The <strong>of</strong>floading process required some time <strong>to</strong> complete because it is basically a gravity-based flow and is<br />
being conducted one compartment at a time at the speed <strong>of</strong> approximately 400 gpm. The drivers would<br />
ensure fuel was completely drained out from the line <strong>to</strong> the underground s<strong>to</strong>rage tank before they<br />
proceeded <strong>to</strong> <strong>of</strong>fload <strong>to</strong> another compartment.<br />
After shutting <strong>of</strong>f all the valves and securely locking all equipment, the drivers would enter the s<strong>to</strong>re<br />
(Pilot gas stations) <strong>to</strong> obtain a signature on the BOL from the s<strong>to</strong>re managers. The drivers would also<br />
enter their delivery information in<strong>to</strong> kiosks (computer terminals) inside the s<strong>to</strong>res. Information entered by<br />
the drivers includes time, date, who made the delivery, how much fuel was delivered, what type <strong>of</strong> fuel,<br />
etc. A printed report <strong>of</strong> the fuel delivery with bar codes would then be generated from the kiosk. Printed<br />
copies <strong>of</strong> the BOLs, from both fuel intake and delivery, as well as the bar code report were then faxed<br />
back <strong>to</strong> Pilot headquarters before the drivers left the Pilot s<strong>to</strong>res. The abovementioned information was<br />
also submitted <strong>to</strong> Pilot headquarters again via PeopleNet after the drivers returned <strong>to</strong> their cab.<br />
Comments from the Evidential Reasoning Team<br />
<strong>Based</strong> on what was learned from the visits with the drivers, the Evidential Reasoning Team recognized<br />
that the entire delivery process was not as straightforward as what the project team had originally<br />
expected. The flexibility <strong>of</strong> delivery schedule and locations could add complications in the geo-fencing<br />
construction, evidential reasoning process, and exceptions detections. Therefore, it was recommended that<br />
a meeting with Pilot dispatchers <strong>to</strong> learn the fuel delivery operation and process, as well as <strong>to</strong> request<br />
access <strong>to</strong> their routes and communication information, would be beneficial <strong>to</strong> the project team. The team<br />
pointed out that the availability <strong>of</strong> his<strong>to</strong>rical BOL info would enable the construction <strong>of</strong> realistic ge<strong>of</strong>encing<br />
model and the “rules” building for detecting exceptions.<br />
5.2.1.2 Meeting with Pilot management team at Knoxville Headquarters<br />
A group <strong>of</strong> project team members held a meeting with the Transportation Operations Manager and the<br />
Central Dispatch Manager at the Pilot headquarter in Knoxville, Tennessee, in 2010. Discussions during<br />
the meeting focused mainly on the operations <strong>of</strong> dispatching and tanker driver schedules. Highlights on<br />
information gathered from that meeting are briefly summarized in this section.<br />
Dispatching<br />
The team learned that a dispatch plan is set by the dispatcher for the following shift based on information<br />
obtained from the previous 6–10 hours. Because <strong>of</strong> this, it is well unders<strong>to</strong>od that changes <strong>to</strong> the plan are<br />
likely. Roughly speaking, changes <strong>to</strong> the daily dispatches are made about 35% <strong>of</strong> the time. There are two<br />
64
main goals that a dispatch plan is meant <strong>to</strong> achieve: (1) obtain the lowest priced fuel that is available and<br />
(2) get fuel <strong>to</strong> gas stations (Pilot s<strong>to</strong>res) before they run out <strong>of</strong> fuel. In order <strong>to</strong> achieving these goals,<br />
dispatchers use information from an in-house inven<strong>to</strong>ry system, which provides sales projections at the<br />
different Pilot s<strong>to</strong>res, as well as a web-based “feeder-root system,” which tracks the inven<strong>to</strong>ry <strong>of</strong> those<br />
s<strong>to</strong>res. Simple math is used by the dispatchers <strong>to</strong> estimate the number <strong>of</strong> loads (deliveries) that each s<strong>to</strong>re<br />
needs.<br />
Various reasons as <strong>to</strong> why a driver’s schedule may change were also discussed. These include such<br />
situations as when competi<strong>to</strong>rs pull out <strong>of</strong> certain business deals, Pilot could agree <strong>to</strong> sell gas <strong>to</strong> those<br />
waiting cus<strong>to</strong>mers, or when the price <strong>of</strong> fuel increases at other competi<strong>to</strong>rs’ stations, Pilot stations (being<br />
cheaper) would attract more cus<strong>to</strong>mers, thus increasing the s<strong>to</strong>re demand and requiring more fuel<br />
deliveries. Also, if a fuel s<strong>to</strong>rage tank at a Pilot s<strong>to</strong>re has a manifold valve that does not function properly,<br />
this could cause the fuel <strong>to</strong> flow through the tanks in an abnormal fashion, the end result being that<br />
s<strong>to</strong>rage tank capacities are significantly reduced. More tanker deliveries must be added in order <strong>to</strong><br />
counteract this issue. This creates a problem for the dispatcher. There might be other accidents and/or<br />
personnel issues that would require reallocation <strong>of</strong> deliveries or reassignment <strong>of</strong> drivers. Logistic issues<br />
could also be a reason.<br />
At Pilot, most drivers work in a 12 hour shift, and the shift schedule is adjusted <strong>to</strong> each driver’s personal<br />
schedule. Within those 12 hours, 10 hours are allocated for transit time (on-duty driving or other “work”),<br />
and 2 hours are allocated <strong>to</strong> non-transit activities (e.g., loading and <strong>of</strong>floading gas, lunch break). For<br />
loading and <strong>of</strong>floading fuel, typically 30 min is allocated for completing this job, although the actual time<br />
could vary from 15 <strong>to</strong> more than 30 min. An example <strong>of</strong> a long <strong>of</strong>floading time could be a situation in<br />
which a vehicle is parked over the s<strong>to</strong>rage tank access area but the driver cannot be tracked down quickly<br />
<strong>to</strong> move that vehicle. The tanker driver would have <strong>to</strong> wait until the access area is clear in order <strong>to</strong> <strong>of</strong>fload<br />
the fuel.<br />
Communications<br />
For communications, Pilot subscribes <strong>to</strong> the PeopleNet, which is a telematics system that provides<br />
communications as well as GPS tracking over time. The information communicated thru the PeopleNet<br />
can be recorded and s<strong>to</strong>red for later use. Driver activities, such as loading, <strong>of</strong>floading, or lunch breaks,<br />
can be logged thru the on-board device. PeopleNet does not record these activities specifically; Pilot asks<br />
their drivers <strong>to</strong> put a note in the record only if a delay lasts 45 min or more. PeopleNet only records where<br />
the driver actually went, not whether there were changes in delivery locations. Pilot has started <strong>to</strong> record<br />
information on where the driver was supposed <strong>to</strong> go (i.e., location originally assigned by the dispatcher),<br />
and where she/he actually went.<br />
Under the current setup, when a driver travels for more than 5 min, PeopleNet au<strong>to</strong>matically logs that the<br />
driver in<strong>to</strong> the on-duty driving mode. Hours are au<strong>to</strong>matically tracked by the on-board PeopleNet system<br />
for hours-<strong>of</strong>-service requirement. Pilot can access data from PeopleNet through a web <strong>to</strong>ol; currently<br />
PeopleNet retains the data for a 6 month period. The older data is s<strong>to</strong>red on a main server.<br />
Staffing and Operations<br />
Pilot typically staffs and equips their fuel delivery tanker fleet <strong>to</strong> handle 80–90% <strong>of</strong> sales. When they<br />
need more deliveries, they will use for-hire tankers and drivers. Pilot’s planning calls for the utilization <strong>of</strong><br />
for-hire work in the remainder <strong>of</strong> its deliveries in order <strong>to</strong> minimize possibility <strong>of</strong> lay-<strong>of</strong>fs during down<br />
time. The Central Dispatcher Office (in Knoxville) handles fuel dispatching activities for 215 Pilot s<strong>to</strong>res.<br />
The Knoxville-based Pilot tanker fleet (about 13–15 trucks) serves approximately 100 Pilot s<strong>to</strong>res within<br />
a 100 mile radius. Within the Knoxville region, there are about 45 Pilot convenience s<strong>to</strong>res. S<strong>to</strong>res outside<br />
65
the ~100 mile region are served by other Pilot tanker fleets in other locations. For s<strong>to</strong>res outside <strong>of</strong> what<br />
Central Dispatch serves, Pilot uses lead drivers <strong>to</strong> handle the tasks. Pilot drivers are not assigned <strong>to</strong><br />
specific s<strong>to</strong>res but typically work in specific regions. These regions are known as “bands,” and there are<br />
enough Pilot bands <strong>to</strong> service the entire United States. Typically, driver assignments must also follow a<br />
certain “turn-time.” Drivers are given tasks where they begin at an origin, deliver <strong>to</strong> a destination, and<br />
then return <strong>to</strong> the origin. Turn-times refer <strong>to</strong> the average amount <strong>of</strong> time it takes <strong>to</strong> complete this cycle.<br />
Depending on the distances between origin and destination, turn-times vary from 3 <strong>to</strong> 9 hours. Typically,<br />
Pilot tankers do not go long enough distances <strong>to</strong> require an overnight s<strong>to</strong>p; their tankers are “day cabs”<br />
which do not include sleeping space or other amenities. Overnight stays would serve <strong>to</strong> increase costs due<br />
<strong>to</strong> the miscellaneous expenses involved.<br />
It was confirmed that the federal fuel tax is assessed at the rack (fuel terminals). At the time the fuel is<br />
received from the fuel terminal, the Pilot tanker truck drivers must specify the intended fuel delivery state<br />
(for federal and local fuel tax purpose). If the Pilot dispatcher reroutes the tanker <strong>to</strong> another state,<br />
additional paperwork must be made so that the appropriate taxes are assessed. Instances <strong>of</strong> fuel theft that<br />
Pilot experienced were also discussed. In one situation, the driver was selling a portion <strong>of</strong> his fuel <strong>to</strong> a<br />
competi<strong>to</strong>r and pocketing the money. In other instances, the driver might park behind a trucking business<br />
or a large s<strong>to</strong>re, such as a K-Mart, and pump his/her fuel <strong>to</strong> an enclosed trailer. In the latter instances, the<br />
theft was detected through the GPS tracking system. Still, it was emphasized that the drivers were barely<br />
considered “<strong>of</strong>f-course” in this situation. In this case, perhaps the sensor solution might have helped Pilot<br />
<strong>to</strong> detect the theft activity much sooner. In addition <strong>to</strong> delivering fuel <strong>to</strong> its gas stations, Pilot also delivers<br />
fuel wholesale <strong>to</strong> other gas stations. Pilot also delivers the non-highway-use fuel (dyed diesel) for<br />
agricultural and industrial use. This information implies that tax evasions are possible within Pilot’s<br />
operations.<br />
5.2.2 Truck Travel Behavior Data (PeopleNet Fleet Manger Reports)<br />
In order <strong>to</strong> study travel patterns <strong>of</strong> tank trucks during their fuel delivery operations, it was necessary for<br />
the team <strong>to</strong> examine his<strong>to</strong>rical and other travel data from Pilot. To protect potentially sensitive or<br />
proprietary information related <strong>to</strong> Pilot operations, with the approval <strong>of</strong> UT-Battelle Legal Department,<br />
members <strong>of</strong> the Evidential Reasoning Team entered a nondisclosure agreement with the Pilot <strong>to</strong> receive<br />
Pilot’s PeopleNet data. With this agreement fully executed on Oc<strong>to</strong>ber 28, 2010, the Evidential Reasoning<br />
Team was granted access <strong>to</strong> Pilot’s PeopleNet Fleet Manger system.<br />
Many preconfigured cus<strong>to</strong>m reports are provided by PeopleNet <strong>to</strong> their subscribers for managing their<br />
fleet operations. Users can select their fleet <strong>of</strong> interests and specify a day, or a range <strong>of</strong> days (up <strong>to</strong><br />
7 days), <strong>to</strong> obtain reports. Reports that are relevant <strong>to</strong> this research study, specifically, are those related <strong>to</strong><br />
GPS locations and travel activities (circled in red in Fig. 57).<br />
Three GPS location reports were available, including GPS Location Report, GPS Location by Hour<br />
Report, and GPS Overview Report. Only the GPS Location by Hour Report (Fig. 58) provides specific<br />
latitude-longitude (lat-long) location information for the vehicles at the hourly “response” time (the time<br />
it was “pinged” by PeopleNet). The more detailed GPS Location Report only shows landmark names<br />
indicating where the vehicles are located at the time. The landmark name is clearly easier and more<br />
meaningful for the fleet managers <strong>to</strong> track their vehicle locations. This convention, however, created<br />
some added complications for the Evidential Reasoning Team. In order <strong>to</strong> use the information for the<br />
geospatial analysis required <strong>to</strong> develop the tracking and geo-fencing <strong>to</strong>ol, these location names<br />
(landmarks) had <strong>to</strong> be translated back <strong>to</strong> lat-long values, requiring additional effort for geo-coding and<br />
conversions.<br />
66
Fig. 57. Types <strong>of</strong> reports available from PeopleNet Fleet Manager.<br />
Fig. 58. Examples <strong>of</strong> GPS location reports available from PeopleNet.<br />
67
In addition <strong>to</strong> viewing the report on screen, PeopleNet allows its users <strong>to</strong> e-mail the report <strong>to</strong> themselves<br />
as a CSV (comma separated value) file. This allows the users <strong>to</strong> conduct their own analyses using the<br />
downloaded data. For this project, the limit <strong>of</strong> 7 days (for creating a report) posed a slight inconvenience<br />
for the team; <strong>to</strong> obtain an entire year <strong>of</strong> his<strong>to</strong>rical data from one report, the “e-mail and save file” process<br />
had <strong>to</strong> be repeated 52 times.<br />
The Travel Activity Reports (detail and summary, see Fig. 59) provide a slightly different organization <strong>of</strong><br />
the same information presented in the GPS Location Reports. Instead <strong>of</strong> sorting through all records <strong>of</strong> the<br />
GPS location report data, since these activity reports contain only records related <strong>to</strong> s<strong>to</strong>ps, it allows the<br />
Evidential Reasoning Team <strong>to</strong> examine the s<strong>to</strong>p durations by type <strong>of</strong> s<strong>to</strong>ps more efficiently. Similarly, the<br />
“e-mail and save file” process was conducted 52 times <strong>to</strong> obtain a year <strong>of</strong> his<strong>to</strong>rical data.<br />
Fig. 59. Examples <strong>of</strong> Travel Activity reports.<br />
5.2.3 Service Station, Terminals, and Wholesale Cus<strong>to</strong>mer Locations<br />
Additional web searches were conducted <strong>to</strong> obtain location data <strong>to</strong> further supplement information<br />
collected based on PeopleNet GPS reports. Types <strong>of</strong> s<strong>to</strong>ps were categorized by the Evidential Reasoning<br />
Team, for the purpose <strong>of</strong> this research study, based on characteristics <strong>of</strong> these s<strong>to</strong>p locations. Specifically,<br />
using information collected from the Pilot’s PeopleNet travel activity report (Sect. 5.2.1), s<strong>to</strong>ps were<br />
grouped in<strong>to</strong> three classifications, including terminals (fueling location or origin <strong>of</strong> a delivery supply<br />
chain), Pilot-owned stations (<strong>of</strong>floading location or destination <strong>of</strong> a delivery supply chain), and wholesale<br />
or other cus<strong>to</strong>mers (other <strong>of</strong>floading location or destination). As mentioned previously, landmark names<br />
68
were provided by the PeopleNet reports, instead <strong>of</strong> lat-long coordinates needed for geospatial study use.<br />
Geospatial location <strong>of</strong> these s<strong>to</strong>ps were therefore identified through the use <strong>of</strong> several information<br />
sources, including Pilot company website (specifically for locations <strong>of</strong> Pilot and Flying J stations),<br />
PeopleNet location identification <strong>to</strong>ol (i.e., Landmark Search), as well as the use <strong>of</strong> a Google Earth<br />
application.<br />
The map shown in Fig. 60 displays all Pilot-owned service stations (including Pilot and Flying J). Not<br />
surprisingly, most <strong>of</strong> these service stations are located along the interstate highways (highway network<br />
not displayed for stations within Canadian border). In addition <strong>to</strong> Pilot Travel Centers and convenience<br />
s<strong>to</strong>res and Flying J fuel stations, Pilot-Flying J also owns several other service stations throughout the<br />
United States (shown in yellow triangles).<br />
Fig. 60. Service stations owned by Pilot-Flying J, LLC.<br />
The focus <strong>of</strong> this study was <strong>to</strong> learn tanker truck delivery operations and fueling processes, with Pilot’s<br />
participation and assistance, so that realistic <strong>to</strong>ols (geo-fencing and evidential reasoning) could be<br />
developed <strong>to</strong> detect potential FTE as early as possible. To limit the scope for a POC study, data on Pilot<br />
operations around the Knoxville, Tennessee, area (where Pilot Headquarters is located) was used.<br />
Examples <strong>of</strong> the three types <strong>of</strong> s<strong>to</strong>ps, that is, service stations, terminals, and wholesale/other cus<strong>to</strong>mers,<br />
are presented in Figs. 61, 62, and 63.<br />
69
Fig. 61. Pilot and Flying J service stations around the Knoxville, Tennessee, region.<br />
Fig. 62. Terminals around the Knoxville, Tennessee, region.<br />
70
Fig. 63. Examples <strong>of</strong> wholesalers and other cus<strong>to</strong>mers served by Pilot tankers.<br />
5.3 ANALYSIS OF TRUCK TRAVEL BEHAVIOR DATA<br />
5.3.1 Duration <strong>of</strong> S<strong>to</strong>ps<br />
As discussed previously, the reports downloaded from the PeopleNet Fleet Manager allowed databases <strong>of</strong><br />
GPS location and travel activity data on Pilot tanker truck for the calendar year 2010 <strong>to</strong> be compiled and<br />
analyzed by the Evidential Reasoning Team. Specifically, the data was used in estimating the length <strong>of</strong><br />
s<strong>to</strong>p for loading and <strong>of</strong>f-loading activities. This allowed the team <strong>to</strong> establish a s<strong>to</strong>p-length (duration)<br />
distribution for each fueling activity (fueling and <strong>of</strong>f-loading). This information could then be used <strong>to</strong><br />
construct rules and weights (likelihood, probability, or belief) for determining unusual or suspicious<br />
behavior associated with fuel loading and <strong>of</strong>floading activities.<br />
The length <strong>of</strong> s<strong>to</strong>p estimates are calculated separately for each type <strong>of</strong> s<strong>to</strong>ps as discussed in the previous<br />
section; they are terminal, Pilot-owned stations, and wholesale and other cus<strong>to</strong>mers. These types were<br />
classified using the s<strong>to</strong>p location names given in the PeopleNet reports. S<strong>to</strong>p location names that did not<br />
contain specific station names (or s<strong>to</strong>re IDs), terminal names, or other company-like names were excluded<br />
from the duration analysis. For example, locations with names such as “in Knoxville, Tennessee and 3.7m<br />
SE <strong>of</strong> Karns, TN near I-40” and “69.7m N <strong>of</strong> Knoxville, TN and in N Corbin, KY on I-75” were clearly<br />
traffic s<strong>to</strong>ps. Thus, these records were excluded from the analysis.<br />
It is also possible that a specific landmark name could be shown in the activity report as the s<strong>to</strong>p location<br />
when the truck might be s<strong>to</strong>pping for other activities at a location that happened <strong>to</strong> be close <strong>to</strong> the<br />
71
landmark (e.g., Pilot headquarters). Thus, records with s<strong>to</strong>p location names containing “HQ” are also<br />
excluded from the analysis dataset.<br />
Note that although the GPS location data could be used <strong>to</strong> “track” the tanker truck movements, there is no<br />
specific information on any specific “routes” used, nor whether a delivery location was for a designated<br />
s<strong>to</strong>re on the dispatcher’s original schedule (i.e., the dispatch plan) or a new/revised delivery location<br />
based on a last-minute change. Furthermore, there was no information on why a tanker s<strong>to</strong>pped at a<br />
particular location, or what business being conducted at such a s<strong>to</strong>p was. The activity, for the purpose <strong>of</strong><br />
estimating the s<strong>to</strong>p-length distributions, was assumed <strong>to</strong> be fuel loading when the s<strong>to</strong>p was at the<br />
Knoxville terminal area and was assumed <strong>to</strong> be <strong>of</strong>f loading when the s<strong>to</strong>p was located at a Pilot or<br />
Flying J service station or a wholesale/cus<strong>to</strong>mer location.<br />
No attempt was made <strong>to</strong> sort through the detailed records <strong>to</strong> add up individual durations associated with<br />
the same s<strong>to</strong>p in<strong>to</strong> one accumulated <strong>to</strong>tal length for any given loading or <strong>of</strong>floading s<strong>to</strong>p. For example,<br />
when arriving at a terminal, the tanker truck could be joining a queue with a few s<strong>to</strong>p-and-go movements<br />
before finally reaching the position at the rack for fueling. Each <strong>of</strong> these s<strong>to</strong>p-and-go segments would<br />
result in a short-duration record, while the record that captures the actual fuel loading would have a longer<br />
duration associated with it. Since the focus <strong>of</strong> this study is more <strong>to</strong>ward the significantly longer durations<br />
(given that it is at a legitimate location) and for a POC research, additional efforts <strong>to</strong> clean up the dataset<br />
(related <strong>to</strong> a specifically company’s operation) would not be cost beneficial <strong>to</strong> the project as a whole.<br />
Thus, one should bear this in mind when reviewing the distributions shown in Figures 64, 65, and 66, the<br />
durations shown are not necessarily indicative <strong>of</strong> the fuel-hauling industry as a whole.<br />
35%<br />
30%<br />
25%<br />
20%<br />
15%<br />
10%<br />
5%<br />
0%<br />
Length <strong>of</strong> S<strong>to</strong>ps at Terminals<br />
5 10 15 20 25 30 35 40 45 50 60 90 120 &<br />
over<br />
Fig. 64. Distribution <strong>of</strong> s<strong>to</strong>p durations at the terminals (in minutes).<br />
72
35%<br />
30%<br />
25%<br />
20%<br />
15%<br />
10%<br />
5%<br />
0%<br />
35%<br />
30%<br />
25%<br />
20%<br />
15%<br />
10%<br />
5%<br />
0%<br />
Length <strong>of</strong> S<strong>to</strong>ps at Service Stations<br />
5 10 20 30 40 50 60 90 120<br />
Fig. 65. Distribution <strong>of</strong> s<strong>to</strong>p durations at gas stations (in minutes).<br />
Length <strong>of</strong> S<strong>to</strong>ps at Wholesale/Other Cus<strong>to</strong>mers<br />
5 10 20 30 40 50 60 90 120<br />
Fig. 66. Distribution <strong>of</strong> s<strong>to</strong>p durations at other locations, including wholesale cus<strong>to</strong>mers<br />
(in minutes).<br />
73
5.3.2 Travel Routes<br />
In addition <strong>to</strong> providing an opportunity <strong>to</strong> examine s<strong>to</strong>p durations, data gathered from the PeopleNet Fleet<br />
Manager reports were also used <strong>to</strong> study typical routes for fuel delivery operations (based on GPS<br />
information). The route patterns <strong>of</strong> Pilot tanker trucks were used <strong>to</strong> generate simulation cases discussed<br />
later in this section. Realistically, one cannot expect a fixed route <strong>to</strong> always be used when delivering fuel<br />
between a certain pair <strong>of</strong> origin (terminal) and destination (service station) locations. For example, as<br />
shown in Fig. 67, there are three routes which are most likely <strong>to</strong> be taken <strong>to</strong> travel from a fuel terminal<br />
located in Knoxville <strong>to</strong> a Pilot service center <strong>of</strong>f the Interstate 40. Here route A is via Interstate 40, route<br />
B is on the Interstate 640 bypass, and route C is on a state highway (Middlebrook Pike) in the Knoxville<br />
area. By examining the GPS data over time and with the aid <strong>of</strong> the team’s understanding <strong>of</strong> local travel<br />
routes and traffic conditions, basic rules for route selections could be built and used in developing ge<strong>of</strong>encing<br />
methodologies.<br />
Fig. 67. Example <strong>of</strong> multiple route choices between a specific terminal and service station pair in<br />
Knoxville, Tennessee.<br />
5.4 GEO-FENCING APPLICATION<br />
5.4.1 Methodologies <strong>to</strong> Detect Out-<strong>of</strong>-Fence Travel Behavior<br />
Geo-fencing is a relatively new technology advancement <strong>of</strong> telemetric hardware and s<strong>of</strong>tware. This<br />
concept refers <strong>to</strong> the practice <strong>of</strong> limiting human or equipment movements <strong>to</strong> a specific geographic<br />
location by tracking their whereabouts via GPS technology. For the purpose <strong>of</strong> this effort, geo-fencing is<br />
used <strong>to</strong> make sure certain mobile equipment or people stay within the boundaries specified by the<br />
moni<strong>to</strong>ring entity. The technology allows users <strong>of</strong> the system <strong>to</strong> draw zones around places <strong>of</strong> work,<br />
cus<strong>to</strong>mer sites, secure areas, and/or paths along a route. These geo-fences, when crossed by an<br />
equipped vehicle or person, can trigger a warning <strong>to</strong> the user or opera<strong>to</strong>r via text message or e-mail. In<br />
extreme circumstances, the zones can be linked <strong>to</strong> immobilization equipment within a vehicle and disable<br />
the engine.<br />
74
Geo-fencing boundaries generated based on the predetermined routes or anticipated paths are considered<br />
static geo-fencing boundaries. In common fuel delivery tanker dispatching practice, the dispatcher only<br />
instructs the driver where <strong>to</strong> deliver the fuel. The driver has the responsibility <strong>to</strong> find the fuel terminal<br />
with the lowest fuel price at the time <strong>of</strong> refueling the tanker, and the driver also has discretion regarding<br />
which route the tanker will take <strong>to</strong> reach the refueling service station. The tanker driver might also need <strong>to</strong><br />
deviate from his originally planned route due <strong>to</strong> unexpected circumstances such as traffic accidents or<br />
congestion. Static geo-fencing boundaries do not consider the above-mentioned dynamic situations.<br />
To compensate for the static nature inherent in the pre-determined the delivery route, the distance<br />
between the current position <strong>of</strong> the fuel tanker and the location <strong>of</strong> the delivery service station was<br />
calculated and compared <strong>to</strong> previous calculated distances over time. Great-circle distance was used in<br />
these calculations as the distance measurement.<br />
The great-circle distance is the shortest distance between any two points on the surface <strong>of</strong> a sphere<br />
measured along a path on the surface <strong>of</strong> the sphere (as opposed <strong>to</strong> going through the sphere’s interior).<br />
Because spherical geometry is rather different from ordinary Euclidean geometry, the equations for<br />
distance take on a different form. The distance between two points in Euclidean space is the length <strong>of</strong> a<br />
straight line from one point <strong>to</strong> the other. On the sphere, however, there are no straight lines. In non-<br />
Euclidean geometry, straight lines are replaced with geodesics. Geodesics on the sphere are the great<br />
circles (circles on the sphere whose centers are coincident with the center <strong>of</strong> the sphere). Because the<br />
earth is nearly spherical, equations for great-circle distance can be used <strong>to</strong> roughly calculate the shortest<br />
distance between points on the surface <strong>of</strong> the Earth (as the crow flies), and so have applications in<br />
navigation. <strong>Based</strong> on the cumulative distance progression information, one can easily judge the fuel<br />
tanker is getting closer <strong>to</strong> or moving away from the delivery service station. Although alternate methods<br />
<strong>of</strong> distance calculation may have been sufficient for the limited testing area <strong>of</strong> the Transportation<br />
Research Center (TRC), this methodology was selected <strong>to</strong> be suitable for real-world situations.<br />
5.4.2 TRC Roadway Network<br />
Due <strong>to</strong> safety and liability concerns, actual on-road testing <strong>of</strong> an instrumented tanker truck (with sensors<br />
and communication devices installed) was not possible. Instead, all field tests were conducted at the<br />
TRC’s closed test site. TRC is an independent au<strong>to</strong>motive proving ground located on approximately<br />
4,500 acres <strong>of</strong> land in East Liberty, Ohio, approximately 40 miles northwest <strong>of</strong> Columbus. TRC Inc.<br />
conducts programs designed <strong>to</strong> test for safety, energy, fuel economy, emissions, durability, noise, crash,<br />
crash simulation, and performance. TRC test trucks, buses, recreational vehicles, mo<strong>to</strong>rcycles, electric<br />
vehicles, passenger cars, and components.<br />
There are several test tracks spread throughout the TRC proving grounds. Only certain testing areas and<br />
routes were used in the field testing. After preliminary study and consultation with TRC personnel, four<br />
locations within the TRC facilities were selected as the refueling and fuel delivery locations (Fig. 68).<br />
These four locations are Building C, <strong>Fuel</strong> Plaza, Southeastern Vehicle Dynamics Area (SE VDA), and<br />
Winding Road Course (WRC) Pad.<br />
Although testing was performed at the test track rather than in a real-world situation, the testing <strong>of</strong> the<br />
hardware components (i.e., sensors and communication devices) was not expected <strong>to</strong> be impacted<br />
dramatically. As a result <strong>of</strong> this change, however, many rules and algorithms which were developed based<br />
on real-world Pilot data for the geo-fencing and evidential reasoning components <strong>of</strong> this study were no<br />
longer directly applicable <strong>to</strong> data collected at this controlled testing location. For example, the rules<br />
regarding distribution <strong>of</strong> s<strong>to</strong>p durations and alternative routes could not be applied <strong>to</strong> scenarios tested at<br />
the TRC site.<br />
75
Fig. 68. Selected simulated refuel and delivery locations in TRC.<br />
In addition, the new setting required a routable roadway network <strong>to</strong> be built for the TRC site so that<br />
routing <strong>of</strong> the delivery truck could be conducted and a geo-fencing buffer zone for each test route could<br />
be determined. Figure 69 shows the entire digitized roadway network in the TRC test site.<br />
Fig. 69. Digitized roadway network around the TRC test site.<br />
76
5.4.3 Location Tracking at the TRC<br />
The location information <strong>of</strong> the testing fuel tanker (trac<strong>to</strong>r-trailer), in terms <strong>of</strong> longitude and latitude, was<br />
collected every second. The second-by-second location information generated by the on-board GPS unit<br />
was s<strong>to</strong>red locally on the on-board data collection device in the cab <strong>of</strong> the test vehicle. This information<br />
was also transmitted, via cell phone communication network, <strong>to</strong> the evidential reasoning system every<br />
5 min.<br />
Because <strong>of</strong> the remote nature <strong>of</strong> the TRC testing location, cell services were spotty at best during the test<br />
period. Therefore, the information collected by the FTE project testing data server at 5-min intervals was<br />
fragmented. The complete set <strong>of</strong> data s<strong>to</strong>red in the on-board data collection device was therefore used <strong>to</strong><br />
fill in the data gaps <strong>to</strong> facilitate the evidential reasoning process.<br />
The second-by-second location information <strong>of</strong> the testing fuel tanker enabled the analyst <strong>to</strong> moni<strong>to</strong>r the<br />
routes traveled by the test vehicle. From preliminary location information alone, it proved very<br />
challenging <strong>to</strong> determine and interpret a s<strong>to</strong>p during a fuel delivery trip without any other supplemental<br />
data. We decided <strong>to</strong> use the Valve Open/Valve Close information <strong>to</strong>gether with the location information<br />
<strong>to</strong> determine the loading and <strong>of</strong>floading activities within the overall set <strong>of</strong> GPS test data.<br />
The location information was used in the following evidential reasoning processes <strong>to</strong> determine the<br />
legitimacy <strong>of</strong> the fuel tanker’s trajec<strong>to</strong>ry. The first evidential reasoning location verification process<br />
involved geo-fencing. The second evidential reasoning location screening process involved great-circle<br />
distance progression between the actual test vehicle location and the scheduled fuel delivery site.<br />
The actual longitude and latitude <strong>of</strong> the test vehicle was recorded on the on-board device every 1 second.<br />
The second-by-second location information was transmitted <strong>to</strong> the FTE evidential reasoning system every<br />
5 min. That is, at 5 min intervals, 300 geo-location records were processed <strong>to</strong> determine the “point within<br />
polygon” status immediately after the evidential reasoning system received the latest 5 min data packet.<br />
The “point not in polygon” would then trigger a warning <strong>to</strong> the opera<strong>to</strong>r. This information, combined with<br />
readings from the sensors, allowed the evidential reasoning algorithm <strong>to</strong> calculate estimates <strong>of</strong> the risk<br />
levels. When a high risk result is detected in a fielded system, an alert could be sent <strong>to</strong> dispatcher or<br />
enforcement if necessary.<br />
5.4.4 Geo-fencing Example<br />
The predetermined route (light yellow) for the nominal scenario (Scenario 1) is depicted in Fig. 70.<br />
A 500 ft width geo-fencing boundary (light-blue polygon) along the predetermined route for this scenario<br />
is illustrated in the figure. This polygon provides a “buffer zone” or geo-fence so that detection <strong>of</strong> an ou<strong>to</strong>f-bound<br />
situation can be flagged.<br />
5.5 EVIDENTIAL REASONING APPLICATION<br />
5.5.1 Overview <strong>of</strong> Concepts<br />
The concept <strong>of</strong> an evidential reasoning <strong>to</strong>ol designed for this study was based on a two-step approach.<br />
The first step was <strong>to</strong> develop a set <strong>of</strong> heuristic rules that could be used <strong>to</strong> identify abnormalities, based on<br />
information and data collected from Pilot staff/experts, his<strong>to</strong>rical operation data (e.g., BOL and<br />
schedules) and travel behavior data (e.g., detailed GPS data for delivery routes). These rules provided the<br />
basic capability <strong>to</strong> determine anomalies in the fuel delivery process, including determining out-<strong>of</strong>-bound<br />
buffer for the geo-fencing application. Next, knowledge about uncertainties and operational parameters<br />
77
Fig. 70. Predetermined nominal scenario route and geo-fencing boundary.<br />
(e.g., upper/lower bounds <strong>of</strong> measurement errors from sensor readings and their associated likelihoods or<br />
probabilities) was compiled and combined with the basic rules <strong>to</strong> establish the evidential reasoning <strong>to</strong>ol.<br />
This evidential reasoning <strong>to</strong>ol had the capability <strong>to</strong> determine the likelihood <strong>of</strong> an anomaly in the fuel<br />
delivery system (i.e., the supply-chain from loading <strong>to</strong> <strong>of</strong>floading <strong>of</strong> fuel products) and <strong>to</strong> alert the<br />
dispatcher regarding the status <strong>of</strong> the fuel shipment. The level <strong>of</strong> the warning could vary from contacting<br />
the driver <strong>to</strong> notifying local law enforcement authorities.<br />
To take advantage <strong>of</strong> an existing <strong>to</strong>ol that has already implemented the D-S reasoning technology instead<br />
<strong>of</strong> spending resources <strong>to</strong> build a model from scratch for this project, the Intelligent Decision System (IDS)<br />
which was developed and distributed by the Intelligent Decision Systems Limited * was considered. The<br />
IDS integrates D-S theory <strong>of</strong> evidence with evaluation analysis model <strong>to</strong> allow one <strong>to</strong> perform hybrid<br />
multiple criteria decision analysis. This Windows-based <strong>to</strong>ol can be accessed free <strong>of</strong> charge if the number<br />
<strong>of</strong> attributes is small (fewer than 10). Since the number <strong>of</strong> attributes considered under the current study<br />
was fewer than this limit, it was determined that the use <strong>of</strong> this <strong>to</strong>ol would be a cost-effective option. For<br />
this project, attributes <strong>to</strong> be evaluated included responses from the sensors (valve, hatch, fuel level, and<br />
fuel maker) and an indica<strong>to</strong>r generated from the GPS data (e.g., out <strong>of</strong> geo-fencing or non-scheduled<br />
s<strong>to</strong>p).<br />
*See http://www.e-ids.co.uk/ for additional information.<br />
78
5.5.2 Development <strong>of</strong> Detection Rules<br />
To begin the development <strong>of</strong> a reasoning <strong>to</strong>ol, a set <strong>of</strong> specific detection rules for the intended <strong>to</strong>ol had <strong>to</strong><br />
be designed and built in<strong>to</strong> the algorithm. The purpose <strong>of</strong> these detection rules was <strong>to</strong> enable the developed<br />
<strong>to</strong>ol (in this case, a pro<strong>to</strong>type expert system) <strong>to</strong> au<strong>to</strong>matically perform assessments or evaluations as a<br />
subject expert would do. That is, the system <strong>to</strong>ok results from an actual condition (e.g., truck s<strong>to</strong>ps at<br />
location x) and compared them <strong>to</strong> information about the expected or known condition (e.g., the scheduled<br />
s<strong>to</strong>p is not x). In cases where a significant deviation was identified, warnings or alerts could have been<br />
generated <strong>to</strong> notify a dispatcher or control center opera<strong>to</strong>rs.<br />
<strong>Based</strong> on current technology and practicality, it is not possible for a moving vehicle <strong>to</strong> take on or <strong>of</strong>fload<br />
fuel. Therefore, a major prerequisite required for “initiating” the detection rules was that the targeted<br />
tanker truck had <strong>to</strong> be at a s<strong>to</strong>p. Obviously, a truck could make s<strong>to</strong>ps at many legitimate locations in<br />
addition <strong>to</strong> s<strong>to</strong>ps at terminals for loading or at stations for <strong>of</strong>floading. Traffic signals and vehicle<br />
breakdowns are two examples <strong>of</strong> likely s<strong>to</strong>ps that could occur along a fuel delivery supply chain route.<br />
For situations where a truck was s<strong>to</strong>pped at given location (excluding traffic s<strong>to</strong>ps), the following specific<br />
actions were used <strong>to</strong> develop the detection rules under this research study.<br />
(a) Identify whether the s<strong>to</strong>p is scheduled or unscheduled<br />
This involves determining whether the scheduled s<strong>to</strong>p refers <strong>to</strong> a terminal (for loading) or a<br />
destination (for <strong>of</strong>floading) on the dispatcher-assigned delivery list or is not on the list. It is<br />
assumed that whenever changes are made <strong>to</strong> the delivery location, the dispatcher always knows<br />
the most up-<strong>to</strong>-date destination location. Thus, the scheduled destination would always be where<br />
the tanker truck should go <strong>to</strong> <strong>of</strong>fload its fuel. Using this definition, an unscheduled s<strong>to</strong>p would be<br />
a s<strong>to</strong>p that is made at a location different from the scheduled one. Since all activities related <strong>to</strong><br />
loading or <strong>of</strong>floading fuels require the truck <strong>to</strong> be s<strong>to</strong>pped, determining whether the s<strong>to</strong>p is<br />
scheduled or unscheduled is therefore an essential first step.<br />
(b) Moni<strong>to</strong>r the vehicle travel route<br />
This is where the GPS data from the telematics system is required. A geo-fencing technique is<br />
applied here <strong>to</strong> determine whether the travel route taken by a tanker is within a reasonable range<br />
<strong>of</strong> deviations from the expected route or scheduled s<strong>to</strong>p location(s). In the TRC testing<br />
environment, no route deviations were simulated as the number <strong>of</strong> alternate routes available in the<br />
proving grounds was extremely limited.<br />
(c) Estimate the time length <strong>of</strong> the s<strong>to</strong>p<br />
From the s<strong>to</strong>p duration distributions discussed previously, rules and/or beliefs could be designed<br />
<strong>to</strong> reflect the possibility (i.e., probability or weight) <strong>of</strong> the occurrence <strong>of</strong> longer s<strong>to</strong>ps (regardless<br />
<strong>of</strong> whether the s<strong>to</strong>ps were scheduled or not). A detection rule which incorporates a review <strong>of</strong> the<br />
s<strong>to</strong>p length could be useful <strong>to</strong> inform a dispatcher <strong>to</strong> contact a seemly inactive driver. In other<br />
words, a warning or alert could be made for extremely long s<strong>to</strong>ps, especially when a dispatcher<br />
had not been notified <strong>of</strong> any incidents. Under the limitation <strong>of</strong> TRC testing scenarios, however,<br />
s<strong>to</strong>p durations were not considered in the rules implemented in the test data.<br />
(d) Check whether the valve/hatch is open<br />
In conjunction with the s<strong>to</strong>p location (scheduled or unscheduled), the most important signals for<br />
developing the detection rules were from the valve/hatch sensors. When neither a valve nor a<br />
hatch was opened, regardless <strong>of</strong> whether the vehicles were at a scheduled or unscheduled<br />
location, it would be virtually impossible for any fuel <strong>to</strong> be loaded or <strong>of</strong>floaded. Of course, this<br />
rule did result in the generation <strong>of</strong> a warning message when a valve or a hatch was opened at an<br />
79
unscheduled location. The level <strong>of</strong> warning, however, could not be determined with high certainty<br />
without further supporting information (evidence) from other detection rules. For instance, an<br />
initial warning (e.g., from a valve being opened at an unscheduled location) would be increased <strong>to</strong><br />
a higher warning level if declining fuel levels were also detected.<br />
(e) Determine whether there are any changes in marker concentration, fuel level, or gross<br />
vehicle weight<br />
Sensors measuring fuel marker concentration and fuel level changes are important in determining<br />
changes in marker concentration and fuel quantity. <strong>Fuel</strong> integrity should always be consistent<br />
during the entire fuel delivery supply chain. That is, one can conclude that the fuel in question has<br />
been altered or diluted when a change <strong>of</strong> fuel marker concentration is detected. Changes in fuel<br />
quantity (i.e., fuel level), on the other hand, do not always indicate problems. <strong>Fuel</strong> level could be<br />
increasing or decreasing at a scheduled location, depending on whether the truck is loading or<br />
<strong>of</strong>floading at the time. Again, assuming that the dispatcher is always informed <strong>of</strong> location<br />
changes (even last-minute changes), fuel level changes during a scheduled s<strong>to</strong>p are by themselves<br />
insufficient for detecting problems. <strong>Fuel</strong> level changes taking place at an unscheduled s<strong>to</strong>p,<br />
however, should warrant a warning.<br />
Besides sensors’ readings <strong>of</strong> fuel marker and fuel level, vehicle weight could also be used as an<br />
added measure for moni<strong>to</strong>ring fuel quantity changes. This information was collected along with<br />
the GPS and speed data by the DAS. Therefore, an additional detection rule could be added based<br />
on detected changes <strong>of</strong> the vehicle weights.<br />
For the TRC field testing, a simple set <strong>of</strong> rules was designed based on measurements gathered from<br />
sensors for marker, fuel level, valve, and hatch. These rules combine the above actions a, d (for valve or<br />
hatch), and e (for marker and fuel level), as shown in the flowchart in Fig. 71.<br />
Fig. 71. Simplified decision rules for TRC testing.<br />
80
Specifically, the components <strong>of</strong> the flowchart have the following meanings:<br />
• 1—Is this an unscheduled s<strong>to</strong>p?<br />
• 2—Is the valve opened given that the s<strong>to</strong>p is right (i.e., scheduled s<strong>to</strong>p)?<br />
• 3—Is the valve/hatch opened given that the s<strong>to</strong>p is wrong (i.e., unscheduled s<strong>to</strong>p)?<br />
• 4—Is there any abnormal change in maker concentration or fuel level?<br />
• 5—Warning level, result <strong>of</strong> the process.<br />
Thus, the paths <strong>of</strong> combinations which should result in a warning (due <strong>to</strong> a deviation from a normal<br />
operation) are presented in Fig. 72.<br />
Fig. 72. Potential warning paths.<br />
Path 1 indicates a scheduled s<strong>to</strong>p in which a suspicious action happens only if there is a significant<br />
deviation from the normal operation in either marker concentration or fuel level. Path 2 indicates that if<br />
the driver makes a unscheduled s<strong>to</strong>p and the valve/hatch is opened, then some level <strong>of</strong> warning should be<br />
immediately dispatched. Path 3 is the most critical one, which indicates that the driver not only opened<br />
the valve/hatch during a unscheduled s<strong>to</strong>p, but there is also an unexpected variation in either marker<br />
concentration or fuel level.<br />
Because <strong>of</strong> the design <strong>of</strong> the marker and fuel level sensors, which were installed around the fuel intake<br />
locations on the lower part <strong>of</strong> the tanker, there were no sensors associated with the hatch <strong>to</strong> measure fuel<br />
characteristics. Under Path 3, therefore, the determination <strong>of</strong> variations in marker concentration and/or<br />
fuel level measurements could only be conducted under the condition that the valve was open. In the<br />
event that a hatch was open (but valves were not) at an unscheduled s<strong>to</strong>p, a warning should be sent<br />
immediately <strong>to</strong> the dispatcher. This is similar <strong>to</strong> Path 2.<br />
The final output <strong>of</strong> the flowchart presented in Fig. 71 is a warning with certain warning level. Such degree<br />
<strong>of</strong> warning due <strong>to</strong> suspicious actions (in Paths 1 or 3 <strong>of</strong> Fig. 72) is based on two quantitative attributes<br />
(the marker concentration and the fuel level) and/or the three qualitative attributes (valve is open/closed,<br />
hatch is open/closed, and whether the s<strong>to</strong>p is scheduled or not). In the determination <strong>of</strong> warning level, it<br />
was assumed that there is no uncertainty involved in the outputs <strong>of</strong> the valve and hatch sensors, whereas<br />
for the output <strong>of</strong> marker concentration and fuel level there might be uncertainties caused by noise<br />
variations in the measurements.<br />
In the following subsections, the calculation <strong>of</strong> changes and the ranges <strong>of</strong> uncertainties in marker<br />
concentration and fuel level are described. A discussion <strong>of</strong> the method for combining the uncertainties <strong>of</strong><br />
these variables and the valve/hatch sensor outputs <strong>to</strong> come up with a degree <strong>of</strong> suspicion follows.<br />
5.5.3 Determining Uncertainties in Marker Concentration and <strong>Fuel</strong> Level Measurements<br />
Since measurements <strong>of</strong> marker concentration and fuel level <strong>of</strong> the test vehicle could only be read when<br />
fuel was moving through the valve opening (i.e., when the valve was open), sensor measurement data <strong>to</strong><br />
be used for the detection analysis is thus taken during this period. To avoid the high level <strong>of</strong> noise in the<br />
sensor signals caused by initial pressure generated when fuel flows through the valve opening, it was<br />
thought that data collected <strong>to</strong>ward the end <strong>of</strong> the fueling/<strong>of</strong>floading might provide a less noisy signal for<br />
81
data analysis purposes. Thus, variations in marker concentration and fuel level data at each s<strong>to</strong>p were<br />
calculated in two steps.<br />
1. Calculate the median <strong>of</strong> a sample <strong>of</strong> data points within a small time period right before the valve<br />
is closed.<br />
2. Calculate the relative change by comparing the variation observed by the current and previous<br />
measurements (Xt and Xt-1), against the reference value X0, according <strong>to</strong> the following Eqs. (1)<br />
and (2).<br />
For an unscheduled s<strong>to</strong>p, the observed variation was calculated as follows:<br />
∆X = | Xt – Xt-1 | /X0 (1)<br />
For a scheduled s<strong>to</strong>p, the observed variation was calculated using the following equation:<br />
∆X = |X0 – | Xt – Xt-1 | | /X0 (2)<br />
As a reference, Fig. 73 shows an example <strong>of</strong> a hypothetical pr<strong>of</strong>ile <strong>of</strong> fuel level where the data points<br />
corresponding <strong>to</strong> the period in which the valve is open are highlighted and the portion <strong>of</strong> data used for<br />
calculation are indicated by the time widows denoted by twt.<br />
Fig. 73. Example <strong>of</strong> fuel level pr<strong>of</strong>ile.<br />
Under a normal operation, the relative change should lie within an expected error bound (ε) <strong>of</strong> the<br />
sensors, ∆X < ε. Any deviation outside this bound points <strong>to</strong> a suspicious action. However, since the<br />
equipment noise is a random variable, a value dependent on real-world implementation such as mounting<br />
location as well as the sensor electronics, there is no certainty that such anomaly truly represents an illegal<br />
act. In this case, one should estimate the probability <strong>of</strong> an anomaly, p(∆Xi > εi), for each variable i and<br />
combine all evidences (probabilities) <strong>to</strong> provide a degree <strong>of</strong> warning. In this context, the marker<br />
concentration and fuel level measurements are assumed <strong>to</strong> be two independent variables.<br />
In an attempt <strong>to</strong> capture the uncertainty in the measurement <strong>of</strong> attribute i, the error bound is allowed <strong>to</strong><br />
vary between two critical values: the most likely error denoted by εmin.i and the worst deviation error<br />
denoted by εmax,i. The bound εmin,i is the minimal expected error <strong>of</strong> attribute i, representing a situation <strong>of</strong><br />
highest uncertainty with respect <strong>to</strong> an illegal operation, whereas εmax,i should represent a situation in<br />
which an illegal act is very likely. All information provided by the marker concentration sensors, fuel<br />
level sensors, and qualitative attributes was aggregated through an evidential reasoning algorithm as<br />
briefly described in the next section.<br />
82
5.5.4 Basic Algorithms<br />
To combine the qualitative and quantitative information in the evidential reasoning approach, a commonscale<br />
grade was needed <strong>to</strong> classify the input measurements. To this end we used a utility function, in<br />
which the various inputs were given different weights <strong>to</strong> determine an overall warning level.<br />
For a given quantitative attribute, the different levels <strong>of</strong> uncertainty were defined by dividing the error<br />
bound [εmin,i , εmax,i], as defined in Sect. 5.5.3, in<strong>to</strong> five quantitative grades, with each category n<br />
represented by a bin number Fn and an associated utility value u(Fn) (utility <strong>of</strong> grade Fn) between 0 and<br />
1. The utility is a way <strong>to</strong> grade the different levels <strong>of</strong> error in terms <strong>of</strong> likelihood. If εi is very large,<br />
p(∆Xi > εi) should be very small, and therefore the likelihood <strong>of</strong> a deviation from normal operation is<br />
very likely. The main idea is that if a deviation occurrence is improbable and it still happens, it should be<br />
highly investigated.<br />
The relationship between the utility and the grade can be found from empirical data or assigned<br />
subjectively based on experience. Since no empirical data was available at the time this relationship was<br />
established (for testing purposes), it was assumed <strong>to</strong> be a linear relationship, as shown in Fig. 74. Notice<br />
that F1 = εmin,i and F2 = εmax,i.<br />
Fig. 74. Linear utility function.<br />
For the FTE evidential reasoning algorithm, the utility is interpreted as the likelihood <strong>of</strong> a questionable<br />
event. Therefore, higher utilities are associated with higher likelihoods <strong>of</strong> illegal acts. In this case there<br />
are five classes (grades) <strong>of</strong> likelihood outcomes: very unlikely, unlikely, moderate, likely, very likely.<br />
With respect <strong>to</strong> the qualitative attributes, it was assumed a simple scale in which the worst case was<br />
assumed for circumstances such as either the valve/hatch being open or the s<strong>to</strong>p being unscheduled,<br />
resulting in u5 = 1 (or very likely). Otherwise, the best case was assumed, resulting in u1 = 0 (very<br />
unlikely). There were no intermediate categories for these attributes.<br />
Uncertainties about an input value were represented by degrees <strong>of</strong> belief. Let βn,i be a degree <strong>of</strong> belief<br />
associated with the utility un for attribute i. Using the defined categories, any input value is then<br />
translated in<strong>to</strong> a distribution <strong>of</strong> beliefs defined as follows.<br />
Let e = {e1, …, ei, … , eL} be the set <strong>of</strong> input values for each attribute. An assessment for an attribute i is<br />
represented by the following utility distribution:<br />
S(ei) = {(un, βn,i), n = 1, …, N}, i = 1, …, L ,<br />
83
where L is the number <strong>of</strong> attributes (which is equal <strong>to</strong> 5 in the case <strong>of</strong> this project) and N is the number <strong>of</strong><br />
categories (also equal <strong>to</strong> 5).<br />
The evidential reasoning algorithm combines the five distributions, defined by S(ei), <strong>to</strong> generate the<br />
aggregated beliefs denoted by βn. The final result <strong>of</strong> the evidential reasoning algorithm is an average<br />
utility value. Since this problem is “complete” with regard <strong>to</strong> evidential reasoning algorithm, ∑n βn = 1<br />
(all beliefs add up <strong>to</strong> 1), the average utility or utility <strong>of</strong> the set <strong>of</strong> the input values given by the set e is<br />
given by<br />
u(e) = ∑n u(Fn).βn .<br />
5.6 INTEGRATING THE GEO-FENCING AND EVIDENTIAL REASONING RULES<br />
5.6.1 Initial Setup with Passenger-Car Simulation Runs<br />
Initial testing <strong>of</strong> GPS data collection using the DAS began in late Oc<strong>to</strong>ber 2010. The process started with<br />
the selection <strong>of</strong> several Pilot stations in the area, ranging in distance from 5 miles <strong>to</strong> 30 miles away from<br />
where the ORNL team was located. A route would begin at a simulated terminal or a Pilot station<br />
centrally located among the Knoxville terminals, and it would end at a Pilot station in the greater<br />
Knoxville area. Data was logged from terminal <strong>to</strong> station and upon arrival at a destination; the fuel and<br />
marker levels were manipulated (using the test box described in Sect. 4 <strong>to</strong> simulate the delivery <strong>of</strong> a load<br />
<strong>of</strong> fuel). Figure 75 shows a route (based on GPS data collected with a passenger car) from the terminal<br />
marked on the right side <strong>to</strong> a Pilot station approximately 5.5 miles from it.<br />
As an added check <strong>to</strong> evaluate the accuracy <strong>of</strong> the GPS data collected by the DAS, a Trimble Juno SB<br />
GPS unit was also used during the initial simulation runs. Due <strong>to</strong> tree cover, signal strength, multipath<br />
errors, and similar issues that arise when working with GPS devices, measurements for a small handful <strong>of</strong><br />
areas were slightly <strong>of</strong>f between the two instruments. However, the overall geographic display provided by<br />
the two systems closely overlaid each other. Figure 76 illustrates the two networks.<br />
5.6.2 Additional Passenger Car Simulation Scenarios on Actual Truck Routes<br />
In March 2011, the DAS system was used <strong>to</strong> collect additional data for more structured simulation runs.<br />
This time, seven different scenarios were constructed <strong>to</strong> depict more realistic situations which tanker<br />
truck drivers could encounter during their delivery operations. In addition <strong>to</strong> a control scenario where the<br />
Fig. 75. Example route for a simulation run in Knoxville, Tennessee.<br />
84
Fig. 76. A comparison <strong>of</strong> spatial location accuracy in data collected with the DAS device (points) and a<br />
commercial Trimble unit (lines). Two travel directions are displayed.<br />
delivery <strong>to</strong>ok place as scheduled by the dispatcher, scenarios that simulated fuel theft, jurisdiction<br />
crossing, blending, unplanned de<strong>to</strong>urs, and a vehicle breakdown were simulated. Actual truck route data<br />
was extracted from the Pilot PeopleNet Fleet Manager system and integrated <strong>to</strong> form the realistic driving<br />
behaviors for these simulations. Since no actual sensor was available for the passenger car simulation, the<br />
Sensor Simulation Unit was used <strong>to</strong> simulate sensor readings (marker concentration, fuel level, and valve<br />
and hatch position) in these scenarios.<br />
An example <strong>of</strong> one <strong>of</strong> these mock deliveries is displayed in Fig. 77. In this instance, a driver was assigned<br />
<strong>to</strong> make a delivery <strong>to</strong> the station on the east side <strong>of</strong> the map. His assigned route is outlined in green.<br />
However, the driver deviated from this path, followed the red route instead, and made a s<strong>to</strong>p in the<br />
irregularly shaped area shown in the northeast corner. The location <strong>of</strong> this shape, in fact, is a mall parking<br />
Fig. 77. Example <strong>of</strong> mock delivery.<br />
85
lot. To make things even more suspicious, the fuel levels in one <strong>of</strong> the tanker compartments increased,<br />
while the marker levels decreased, indicating that the driver was blending unauthorized substances in<strong>to</strong><br />
his fuel load.<br />
Because realistic sensor data was not available for these simulations, these cases were used only <strong>to</strong><br />
examine driving behaviors and explore how geo-fencing could be applied <strong>to</strong> identify abnormal patterns.<br />
In the example shown in Fig. 77, the red route could have reasonably been a legitimate alternative route <strong>to</strong><br />
the original green route if the truck had not s<strong>to</strong>pped at the parking lot and opened the valve (simulated)<br />
that resulted in a change <strong>of</strong> fuel integrity (simulated). This illustrated one <strong>of</strong> the complexities encountered<br />
when designing a geo-fencing algorithm: the availability <strong>of</strong> multiple routes between a pair <strong>of</strong> origin and<br />
destination points. This reemphasizes that geo-fencing alone would likely provide insufficient evidence <strong>to</strong><br />
detect FTE.<br />
86
6. TEST TRACK ACTIVITIES<br />
The POC testing did not lend itself <strong>to</strong> real-world data collection due <strong>to</strong> the non-production (not certified<br />
for hazmat tanker use and not environmentally hardened) nature <strong>of</strong> the equipment and sensors used, and<br />
the need <strong>to</strong> control the testing steps and maneuvers <strong>to</strong> gather the required data. These fac<strong>to</strong>rs and the<br />
general concern for staff safety and the safety <strong>of</strong> the Pilot vehicle led <strong>to</strong> a decision early in the project <strong>to</strong><br />
conduct this field vehicle-based data collection at a closed test facility. The TRC in East Liberty, Ohio,<br />
was chosen based on the size <strong>of</strong> their facility (several miles <strong>of</strong> roadway), their experience with<br />
commercial vehicle testing, and their ability <strong>to</strong> handle the required fuel transfers.<br />
6.1 PRELIMINARY TESTING<br />
Prior <strong>to</strong> the field test with the tanker, preliminary testing was conducted at TRC <strong>to</strong> test out the marker<br />
sensor hardware and s<strong>of</strong>tware under conditions similar <strong>to</strong> those which would be experienced during the<br />
field test; this opportunity was also taken <strong>to</strong> test the pro<strong>to</strong>type T2TCU with a functioning marker sensor.<br />
Additionally, the simulated sensor data was collected as the test scenarios were performed on-site at TRC<br />
<strong>to</strong> confirm the DAS-<strong>to</strong>-BOS communications and collect data <strong>to</strong> fine-tune the evidential reasoning<br />
system.<br />
6.1.1 <strong>Fuel</strong> Loop Sensor Testing<br />
The fuel loop test rig was constructed <strong>to</strong> allow fuel from a vehicle-mounted fuel tank <strong>to</strong> be pumped out <strong>of</strong><br />
the tank’s output connection, through a 6 ft long, 4 in. diameter aluminum pipe, and back in<strong>to</strong> the tank’s<br />
input connection. The fuel was circulated at 60 gal/min (gpm). The section <strong>of</strong> aluminum pipe was chosen<br />
because it matched the diameter and material <strong>of</strong> the input and output fuel lines on the tanker vehicle<br />
identified for the field test.<br />
Prior <strong>to</strong> testing, major preparations were successfully carried out for the doping <strong>of</strong> the fuel marker in<strong>to</strong><br />
diesel at loop testing field trials. For transport <strong>of</strong> concentrated marker solutions, 10 vials, each containing<br />
40 mL <strong>of</strong> highly concentrated marker solution, were used <strong>to</strong> sequentially dose in marker dye at the test<br />
track fuel loop setup. Each vial contributed slightly less than 100 ppb (mass: mass basis) <strong>of</strong> fuel marker<br />
dye, with the <strong>to</strong>tal exact amount added reaching about 1000 ppb, or 100 ppm. The <strong>to</strong>tal amount <strong>of</strong> marker<br />
used, in terms <strong>of</strong> mass, <strong>to</strong> dope 150 gal <strong>of</strong> fuel, was less than 500 milligrams, which was measured out <strong>to</strong><br />
go in<strong>to</strong> the concentrated doping solutions on an analytical microbalance accurate <strong>to</strong> milligram quantities.<br />
The fuel loop testing conducted at TRC enabled the first field evaluation <strong>of</strong> both the ORNL-designed<br />
sight glass and the marker sensor. The 4 inch diameter aluminum pipe was prepared with a flanged central<br />
section. This flanged section made it possible <strong>to</strong> attach a cus<strong>to</strong>m sight glass in-line. This sight glass<br />
permitted the fuel marker sensor <strong>to</strong> be mounted and <strong>to</strong> moni<strong>to</strong>r the fuel marker concentration levels within<br />
the pipe. To facilitate the testing, TRC constructed a rig which enabled fuel <strong>to</strong> flow through the<br />
instrumented sight glass in a continuous loop. This apparatus is shown in the test setup in Fig. 78, with a<br />
close-up <strong>of</strong> the glass and marker sensor. The high optical quality <strong>of</strong> the acrylic is evident in this figure.<br />
The fuel circulated through the fuel loop was initially unmarked (marker concentration levels <strong>of</strong> 0 ppb).<br />
After an initial baseline measurement, a small quantity <strong>of</strong> marker was introduced in<strong>to</strong> the fuel. The<br />
marker was contained in a 40 ml vial that contained highly concentrated marker dissolved in a small<br />
amount <strong>of</strong> diesel. The contents <strong>of</strong> the vial were added <strong>to</strong> the circulating fuel via a small vacuum inlet line.<br />
Once the contents were thoroughly mixed and diluted within the circulating fuel (<strong>of</strong> which there was<br />
350 gal), a small concentration <strong>of</strong> fuel marker resulted. Enough vials <strong>of</strong> marker were prepared <strong>to</strong> produce<br />
10 increasing levels <strong>of</strong> marker concentration in steps <strong>of</strong> approximately 100 ppb. Tests were conducted<br />
with a 60 gpm flow rate.<br />
87
Fig. 78. <strong>Fuel</strong> loop test rig.<br />
As the marker vials were added, the in-line pro<strong>to</strong>type fuel marker sensor recorded all changes in the<br />
marker concentration by moni<strong>to</strong>ring the recirculating fuel. For each added vial, a short period <strong>of</strong> the fuel<br />
flowing through the loop was recorded. This was followed by a short period <strong>of</strong> the fuel remaining static<br />
within the rig (i.e., non-flowing). The data collected during this experiment is shown in Fig. 79. The<br />
testing conducted with the fuel loop revealed that steady flow <strong>of</strong> the fuel had little impact on the sensor<br />
reading, and that no leak problems were caused by the modified Truck Trailer Manufacturer’s<br />
Association bolt pattern on the ORNL sight glass. The raw data shown in Fig. 79 indicates that under<br />
field conditions the current generation marker sensor was able <strong>to</strong> measure the concentration <strong>of</strong> the fuel<br />
marker with a resolution <strong>of</strong> at least ±100 ppb (12.5% <strong>of</strong> the anticipated 800 ppb marker level in the field<br />
tests).<br />
In this figure, (a) shows the sensor output as the marker concentration was increased from 0 <strong>to</strong> 1,000 ppb<br />
in 100 ppb increments and (b) is a magnified view <strong>of</strong> a portion <strong>of</strong> the data in (a), showing how the signal<br />
settled <strong>to</strong> a steady value after mixing <strong>of</strong> the marker. Between the first and second portions <strong>of</strong> the test<br />
(identified in the preceding figure as “Testing Paused”), the marker concentration read by the sensor<br />
increased. This was thought <strong>to</strong> be caused by two fac<strong>to</strong>rs. First, the test rig apparatus (particularly<br />
transitions between different cross sections <strong>of</strong> flow) lead <strong>to</strong> some <strong>of</strong> the highly concentrated marked fuel<br />
getting trapped in dead spots prior <strong>to</strong> fully mixing. This caused the apparent increase in concentration<br />
after the break in testing (after which the concentration stabilized before the next vial <strong>of</strong> marker was<br />
added): the marker was better dispersed during the break. Second, when the highly concentrated fuel was<br />
first introduced in<strong>to</strong> the tank, it likely splashed on<strong>to</strong> the tank walls. Over time, these droplets slowly<br />
drained/dripped back in<strong>to</strong> the fuel mixture. These situations were corrected for the mixes performed in<br />
preparation for the field testing.<br />
88
Fig. 79. Marker sensor data from fuel loop test at TRC.<br />
The data collected during this test provided three useful pieces <strong>of</strong> information. First, the data showed that<br />
the sensor worked well in the environment anticipated for the upcoming field test. Plus, the resolution <strong>of</strong><br />
the sensor in this environment could easily detect changes on the order <strong>of</strong> 100 ppb on either flowing or<br />
static fuel (Fig. 80).<br />
Secondly, the data showed that the mixing <strong>of</strong> highly concentrated fuel in<strong>to</strong> a larger reservoir <strong>of</strong> unmarked<br />
fuel required significant recirculation before the marker became fully blended. The increasing marker<br />
concentration experience with additional mixing can be seen in Fig. 79—where the marker concentration<br />
is seen slowly increasing from one vial <strong>to</strong> the next as the fuel is recirculated.<br />
Thirdly, the fuel loop test demonstrated that the gain <strong>of</strong> the detec<strong>to</strong>r’s amplifiers could be made<br />
significantly higher (times 6) <strong>to</strong> reduce the sensor’s signal-<strong>to</strong>-noise ratio. This technical detail was<br />
important for optimizing the sensitivity and range <strong>of</strong> the sensor.<br />
89
Sensor Response (Ratio)<br />
0.9<br />
0.8<br />
0.7<br />
0.6<br />
0.5<br />
0.4<br />
0.3<br />
0.2<br />
0.1<br />
0<br />
Comparison <strong>of</strong> Static and Flowing Conditions<br />
Static<br />
Flowing (60 ga/min)<br />
0 200 400 600 800 1000<br />
Fig. 80. Marker concentration data.<br />
Following the completion <strong>of</strong> this experiment, some minor changes were made <strong>to</strong> the circuitry <strong>of</strong> the<br />
pro<strong>to</strong>type fuel marker sensor <strong>to</strong> increase the gain <strong>of</strong> the sensor.<br />
Additionally, the DAS and T2TCU used in the tanker testing were connected <strong>to</strong> the optical sensor, and<br />
data was collected at flow rates <strong>of</strong> 60 and 120 gpm for a marker concentration <strong>of</strong> 1,000 ppb<br />
(Fig. 81). The data collected using this methodology confirmed the reliability <strong>of</strong> the T2TCU in correctly<br />
reporting the sensor readings <strong>to</strong> the DAS.<br />
6.1.2 Passenger Car Communications Testing<br />
Marker Concentration (PPB)<br />
In order <strong>to</strong> test the communications link at the test track, the test scenarios developed for the pilot test<br />
were implemented using a test box in <strong>to</strong> simulate sensor readings (Fig. 82). This test setup made use <strong>of</strong><br />
the analog and digital data collection capabilities <strong>of</strong> the DAS (in conjunction with GPS) <strong>to</strong> generate<br />
streaming data identical <strong>to</strong> that <strong>of</strong> the real test.<br />
During this testing, scenarios involving the four locations selected by TRC (simulated fuel rack and<br />
delivery points) were implemented with this equipment installed in a passenger car. The collected data<br />
was sent back <strong>to</strong> ORNL wirelessly and manipulated by the data retrieval <strong>to</strong>ol and submitted <strong>to</strong> the<br />
evidential reasoning system’s server in 5 min increments. The testing successfully demonstrated the realtime<br />
communication between the DAS and ORNL’s server using the FTE Upload Data Service s<strong>of</strong>tware<br />
developed for that purpose.<br />
90
Fig. 81. DAS and T2TCU testing with fuel loop.<br />
Fig. 82. FTE sensor simulation unit.<br />
91
Data collected from these test scenarios was analyzed upon returning <strong>to</strong> ORNL. Figure 83 shows the<br />
routes (using data on GPS locations) inside the TRC that were used during the pre-testing. An example <strong>of</strong><br />
the measure from sensors (simulated) is given in Fig. 84. As planned, the GPS and sensor response data<br />
were collected at 10 second intervals and transmitted as a packet at the rate <strong>of</strong> 5 min intervals. During the<br />
post-data examination, the 5-min data retrieval intervals proved sufficient, but it was discovered that some<br />
sensors’ responses could be “missed” due <strong>to</strong> short duration <strong>of</strong> the simulated activities. Therefore, the<br />
sample rate was increased <strong>to</strong> 1 Hz for the tanker testing.<br />
6.1.2.1 Pretest results from the passenger car testing<br />
Since the pretest was mainly for the purpose <strong>of</strong> conducting the fuel loop testing, no tanker truck was<br />
actually presented. A passenger car with the FTE sensor simulation unit, a test box with manual dials <strong>to</strong><br />
simulate sensor activities, was used <strong>to</strong> collect GPS and simulated sensor “responses” data. The DAS was<br />
powered by plugging in the passenger car, which caused certain unstable situations <strong>to</strong> the e-DAQ power<br />
connections. Nevertheless, data was collected as planned at every 10 second interval and packets <strong>of</strong> data<br />
were transmitted via cell communication back <strong>to</strong> the server (at ORNL) at a 5 min interval.<br />
Due <strong>to</strong> issues from the power source inside the passenger car and the GPS blockages in certain testing<br />
areas within the TRC site, signals transmitted from the e-DAQ, through the communication link, were not<br />
as good as expected. These issues resulted in several data gaps in datasets s<strong>to</strong>red on the server. Note that<br />
the communication issue does not generally affect the data s<strong>to</strong>red on the DAS system itself.<br />
6.1.2.2 Review <strong>of</strong> GPS and simulation scenario data<br />
Using on-board s<strong>to</strong>red data from the e-DAQ system, information collected from the pretest scenarios was<br />
post-processed after the team return <strong>to</strong> ORNL. Analysis was conducted using these post-processed data<br />
sets (i.e., data gaps filled). <strong>Based</strong> on GPS location data collected from the pretest, Fig. 85 shows the travel<br />
routes inside the TRC that were utilized during the pre-testing. An example <strong>of</strong> the measures from sensors<br />
(simulated) is given in Fig. 86. Obviously, loading and <strong>of</strong>floading activities can only occur within the<br />
time the valve is opened.<br />
Fig. 83. Travel routes based on GPS data from communications testing.<br />
92
1<br />
0.8<br />
0.6<br />
0.4<br />
0.2<br />
0<br />
4<br />
3.5<br />
3<br />
2.5<br />
2<br />
1.5<br />
1<br />
0.5<br />
0<br />
Open<br />
Closed<br />
10:30:00<br />
Initial<br />
loading<br />
10:35:00<br />
Scenario Example<br />
10:40:00<br />
10:45:00<br />
Offload small<br />
amount<br />
Fig. 84. Simulated data collected during communications testing at TRC.<br />
Fig. 85. GPS plots <strong>of</strong> the pre-test routes at the TRC on March 22, 2011.<br />
93<br />
10:50:00<br />
10:55:00<br />
Marker<br />
density<br />
<strong>Fuel</strong><br />
Level<br />
Off-loading @<br />
destination<br />
status<br />
11:00:00 Valve
6.2 FIELD TEST<br />
Fig. 86. Sample scenario results from the pre-test at TRC on March 22, 2011.<br />
The Field Test conducted at TRC using the Pilot Travel Center’s tanker trac<strong>to</strong>r-trailer involved the full<br />
ORNL end-<strong>to</strong>-end FTE system. The test vehicle was moved from location <strong>to</strong> location within the TRC<br />
reservation <strong>to</strong> simulate loading and <strong>of</strong>floading locations such as a fuel terminal and retail fuel sales<br />
location and included several test scenarios. This testing <strong>to</strong>ok place in mid-April 2011 and required a<br />
period <strong>of</strong> system integration prior <strong>to</strong> the <strong>of</strong>ficial testing, followed by a res<strong>to</strong>ration <strong>of</strong> the test vehicle <strong>to</strong> its<br />
original condition.<br />
6.2.1 Integration<br />
ORNL staff arrived at TRC several days before the actual testing <strong>to</strong> oversee the upfitting <strong>of</strong> the Pilot<br />
tanker trac<strong>to</strong>r-trailer (vehicle) by TRC staff. A technician from Air-Weigh also assisted. All tanker<br />
instrumentation was connected <strong>to</strong> the T2TCU, mounted above the valves on the trailer as shown in<br />
Fig. 87. A power connection was made <strong>to</strong> this unit, from which power would be distributed <strong>to</strong> other trailer<br />
instrumentation.<br />
Each <strong>of</strong> the two instrumented compartments (front- and rear-most) had the sight glasses replaced with<br />
instrumented units <strong>to</strong> which were attached marker and pressure sensors. The sensors were tested <strong>to</strong> verify<br />
they were functioning properly (Fig. 88).<br />
Switches were installed on the hatches and valves <strong>of</strong> these two compartments as well, as shown in Fig. 89<br />
and Fig. 90.<br />
94
Fig. 87. T2TCU installed on tanker.<br />
Fig. 88. Marker sensor in situ operation verification.<br />
95
Fig. 89. Instrumented hatch located on <strong>to</strong>p <strong>of</strong> tanker.<br />
Fig. 90. Instrumented valve on tanker.<br />
The ORNL DAS was installed in the trac<strong>to</strong>r, along with a GPS antenna (Fig. 91). Connections were made<br />
<strong>to</strong> the vehicle’s power and data bus, where the data from the T2TCU would be posted.<br />
The trac<strong>to</strong>r-based Air-Weigh ComLink and display had <strong>to</strong> be replaced with a J1939 compatible unit. This<br />
equipment was on hand at the time.<br />
Following the pre-test loading <strong>of</strong> fuel in the instrumented compartments, minor leaks were identified in<br />
the flange connections <strong>of</strong> the sight glasses as well as in the connections <strong>to</strong> the pressure transducers. These<br />
connections were sealed by a TRC mechanic and retested <strong>to</strong> confirm there were no additional leaks.<br />
96
Fig. 91. DAS installed in test vehicle.<br />
At the conclusion <strong>of</strong> the upfit, the Pilot Travel Centers vehicle was weighed in a near-empty state using<br />
the TRC pit scale, and then again with the addition <strong>of</strong> 1,000 gal <strong>of</strong> fuel in order <strong>to</strong> calibrate the trac<strong>to</strong>r and<br />
trailer Air-Weigh on-board weighing systems.<br />
The sensors and DAS were tested and confirmed <strong>to</strong> be functional. Although a connection <strong>to</strong> the ORNL<br />
computers was not possible due <strong>to</strong> ORNL network being closed, a work-around was facilitated with<br />
another researcher working from home on his personal Internet connection.<br />
During the vehicle upfit, TRC personnel mixed the marker in<strong>to</strong> the additional 350 gal <strong>of</strong> fuel needed for<br />
testing, combining this fuel with the fuel marked in the previous fuel loop testing. Dry aliquots were<br />
transported and mixed in<strong>to</strong> multi-gallon volumes <strong>of</strong> diesel for the test track trials, and this approach<br />
proved far more reliable in regard <strong>to</strong> full, fast dissolution <strong>of</strong> the dry SiNaph marker in<strong>to</strong> the large volume,<br />
turbulent flow containers than the method employed in the earlier fuel loop testing. Steps were taken <strong>to</strong><br />
avoid the incomplete mixing issues experienced in the fuel loop testing. To prevent the issue <strong>of</strong> highly<br />
concentrated marked fuel getting trapped in dead sections <strong>of</strong> the hosing, the test apparatus was not used in<br />
the initial mixing <strong>of</strong> the fuel; instead, hosing <strong>of</strong> a diameter (2 in.) consistent with the piping on the mixing<br />
truck was used. To alleviate the issues caused by splashing in the tank, the mixing was performed over<br />
several hours and with the fuel 350 gal, reducing the area within the tank for splashed fuel and allowing<br />
the splashed fuel <strong>to</strong> drain in<strong>to</strong> fuel mixture. After several hours <strong>of</strong> mixing <strong>to</strong> ensure a complete mix, the<br />
fuel test loop used in March testing at TRC was set up and configured <strong>to</strong> allow ORNL personnel <strong>to</strong> verify<br />
the complete mixing based on the stable measurements <strong>of</strong> the concentration observed during the period<br />
following the mix.<br />
At the beginning <strong>of</strong> the first day set aside for testing, the FTE moni<strong>to</strong>ring system was found <strong>to</strong> be working<br />
erratically. It was suggested after consultation with Air-Weigh that there might be data collisions on the<br />
J560 connec<strong>to</strong>r between the trac<strong>to</strong>r and trailer due <strong>to</strong> the fact that several vehicle systems use this line for<br />
communications. The team decided <strong>to</strong> run a dedicated power line for the T2TCU and the Air-Weigh<br />
ComLink. This action solved the erratic behavior <strong>of</strong> the system, and scenario testing began at noon on<br />
Monday, April 18, 2011.<br />
97
The Analysis Team members began testing by conducting an initial assessment <strong>of</strong> the “control center”<br />
room (TRC-provided conference room) <strong>to</strong> ensure internet was accessible <strong>to</strong> the team. Additional checking<br />
<strong>of</strong> the computer equipment was performed at the hotel room the evening before the <strong>of</strong>ficial test. Due <strong>to</strong><br />
the shutdown <strong>of</strong> the ORNL network, the originally designated data server located at ORNL could not be<br />
accessed. In response, the data retrieval program was modified <strong>to</strong> s<strong>to</strong>re files locally, and this new version<br />
was installed and configured on the standalone desk <strong>to</strong>p computer that was brought <strong>to</strong> Ohio. This was an<br />
unexpected complication, but with extensive communication between the Evidential Reasoning and<br />
Analysis Teams, a temporary on-site data collection solution was effectively set up by midnight prior <strong>to</strong><br />
testing. The system was ready for field testing the following morning.<br />
6.2.2 Testing Activities<br />
The testing (April 18–19, 2011) was designed around a few representative scenarios from which the<br />
evidential reasoning could identify several different types <strong>of</strong> FTE.<br />
• Nominal—legal movement <strong>of</strong> taxed and untaxed fuel (baseline)<br />
• Alternate Nominal—legal movement <strong>of</strong> untaxed fuel (additional scenario for sensor verification)<br />
• Jurisdiction Crossing—illegal diversion <strong>of</strong> taxed fuel<br />
• Theft—portion <strong>of</strong> load <strong>of</strong> taxed fuel diverted/s<strong>to</strong>len en route<br />
• Blending I—Dilution <strong>of</strong> marked fuel with an equal amount <strong>of</strong> unmarked fuel en route<br />
• Blending II—mixing <strong>of</strong> a small amount <strong>of</strong> simulated hazardous waste with marked fuel en route<br />
• Blending III—marked fuel mixed with unmarked fuel en route.<br />
A TRC fuel truck was used <strong>to</strong> simulate both the fuel rack and the fuel drop (convenience s<strong>to</strong>re or other).<br />
Figure 92 shows a typical connection used during the testing. In this image, the transfer is taking place at<br />
the <strong>Fuel</strong> Plaza, one <strong>of</strong> four locations designated by TRC <strong>to</strong> simulate various loading and <strong>of</strong>floading<br />
locations.<br />
Fig. 92. Test vehicle connected <strong>to</strong> TRC tanker for fuel transfer.<br />
All computer systems were set up in the control center on Monday morning, April 18, 2011. The data<br />
retrieval algorithm was tested again and no issues found. Some <strong>of</strong> the parameters in the evidential<br />
reasoning program were adjusted during the setup based on new information provided by the Sensor team<br />
98
such as marker reading error bound and fueling rate. The FHWA project sponsors visited the control<br />
center for a short briefing on the reasoning logic and a short demo <strong>of</strong> GPS data tracking/moni<strong>to</strong>ring on the<br />
GIS system, using the data collected from the pretesting exercise.<br />
Figure 93 shows the routes taken by the Pilot tanker while testing at TRC. Communication issues on the<br />
DAS occurred intermittently throughout the day, primarily due <strong>to</strong> missing cellular signals in some zones.<br />
However, a local copy <strong>of</strong> the data was s<strong>to</strong>red on the DAS and retrieved for post-processing at the<br />
conclusion <strong>of</strong> each day’s testing <strong>to</strong> fill in any data gaps in the real-time data files. Minor issues with<br />
instrumentation were seen during testing and identified in the post-processed data. These are described in<br />
the greater detail in Sect. 7.<br />
Fig. 93. Tanker routes at TRC during second day <strong>of</strong> field test.<br />
Communication issues with the data retrieval system occurred throughout the day, mainly due <strong>to</strong> cellular<br />
dead zones within the TRC site where the tanker was traveling. The Evidential Reasoning Team relied on<br />
phone communications with the Communications Team (both on site with the tanker and <strong>of</strong>fsite in<br />
Knoxville, Tennessee). The communications with on-site researcher, however, were much limited due <strong>to</strong><br />
the dead-zone issue mentioned previously.<br />
During the times that the system was communicating properly, a data file from each 5 min transmission<br />
was successfully received, converted, and s<strong>to</strong>red in<strong>to</strong> the database that fed the GIS system, as soon as it<br />
appeared in the designated file folder on the “server” (i.e., the desk<strong>to</strong>p computer or the temporary data<br />
retrieval system). Due <strong>to</strong> data gaps in the signal transmissions, however, only limited near-real-time<br />
analysis (analysis on the files received every 5 min) could be conducted. The full set <strong>of</strong> data was obtained<br />
from the on-board system on Monday evening, which provided better data with much less missing<br />
signals.<br />
99
All post-processed data files from the first day <strong>of</strong> testing were successfully converted in<strong>to</strong> a readable<br />
format for the GIS system. Unfortunately, data from the loading process <strong>of</strong> the first scenario was missing<br />
from the data set, likely due <strong>to</strong> a power issue the Communications Team encountered during the first part<br />
<strong>of</strong> the first day <strong>of</strong> testing. Certain “disappearing” <strong>of</strong> signals could clearly be observed from the data<br />
collected. With the exception <strong>of</strong> a few moments at the beginning <strong>of</strong> the day, the testing process was very<br />
similar <strong>to</strong> the first day <strong>of</strong> testing. Because the team was not aware that the TRC internet has an overnight<br />
time-out policy (probably due <strong>to</strong> guest login), there were some confusions as <strong>to</strong> why the DAS would not<br />
communicate properly on Tuesday morning. Communication issues were encountered the second day <strong>of</strong><br />
testing as well.<br />
One <strong>of</strong> the greatest challenges encountered during the second day <strong>of</strong> field testing was the weather.<br />
Adverse weather conditions further added <strong>to</strong> the already troublesome communication issues. Along with<br />
the DAS connectivity issue, one <strong>of</strong> the valve sensors gave incorrect values for a portion <strong>of</strong> the test, likely<br />
due <strong>to</strong> a mounting issue.<br />
6.2.3 Results and Data Analysis<br />
Due <strong>to</strong> the mounting solutions employed for the marker concentration and fuel level sensors, it was<br />
determined that readings from all sensors would only be “valid”—for the purpose <strong>of</strong> evidential<br />
reasoning—during the periods that the valve was open and fuel was flowing through the instrumented<br />
sight glass. In fact, due <strong>to</strong> the installation locations <strong>of</strong> sensor devices in the sight glass, the marker<br />
concentration and fuel level sensors are not capable <strong>of</strong> obtaining fuel activities during the time period<br />
prior <strong>to</strong> the valve opening or the time period after the valve closed. Thus, all analyses were conducted<br />
using data collected during time periods that the valves are opened.<br />
Due <strong>to</strong> the mounting configuration, the fuel level data typically had a higher level <strong>of</strong> noise in its readings,<br />
particularly when the valve was first opened. The noise level in fuel level data was clearly higher when<br />
the fuel was loaded in<strong>to</strong> the compartments; that is, data were smoother when the fuel was <strong>of</strong>floaded from<br />
the tanker. Similarly, marker concentration data also had a higher noise under the fuel intake process than<br />
when the fuel was being <strong>of</strong>floaded. The noise in the marker sensor data for the opening and closing parts<br />
(when valve was first opened and when valve was about <strong>to</strong> close) seemed <strong>to</strong> also be higher than those in<br />
the mid-stream for the marker sensors.<br />
Activities from each <strong>of</strong> the test scenarios are presented in the following section. Data gathered from the<br />
loading and <strong>of</strong>floading processes, by compartments, are presented in separate figures. The compartments<br />
are referred as “valve 1” and “valve 4” in the charts shown. Note that certain default (preset) values are<br />
used when sensor signals are “missing.” For fuel level, the default was 35, while fuel marker was set at<br />
1.0. Some <strong>of</strong> these can be observed in the figures that follow.<br />
6.2.3.1 Nominal scenario<br />
The initial trip was designed <strong>to</strong> verify the functionality <strong>of</strong> all the sensors and evidential reasoning system<br />
through implementing a legal scenario. In this scenario 500 gal marked fuel and 500 gal unmarked fuel<br />
were loaded on<strong>to</strong> the tanker at the <strong>Fuel</strong> Plaza. The marked fuel was then <strong>of</strong>floaded at Building C, and the<br />
unmarked fuel <strong>of</strong>floaded at the WRC Pad.<br />
Loading period<br />
As pointed out earlier in this report, data from this time period were not collected due <strong>to</strong> a power issue<br />
associated with a drained truck battery. This issue was corrected, and similar problems were prevented<br />
during the remainder <strong>of</strong> the testing by leaving the truck running at all times <strong>to</strong> avoid draining the battery.<br />
100
Off-loading period<br />
Data from the <strong>of</strong>floading process for both compartments were analyzed for scenario one. <strong>Based</strong> on the<br />
compartment 1 reading obtained from sensors (Fig. 94), measurements at the conclusion <strong>of</strong> <strong>of</strong>floading<br />
that would be used for evidential reasoning algorithm were<br />
• Type <strong>of</strong> s<strong>to</strong>p: scheduled,<br />
• Marker concentration 0.5, and<br />
• Final fuel level 0.0.<br />
Fig. 94. Activity from <strong>of</strong>floading <strong>of</strong> compartment 1 under Scenario 1.<br />
<strong>Based</strong> on the compartment 4 reading obtained from sensors (Fig. 95), measurements at <strong>of</strong>floading that<br />
would be used for evidential reasoning algorithm were<br />
• Type <strong>of</strong> s<strong>to</strong>p: scheduled,<br />
• Marker concentration 0.2, and<br />
• <strong>Fuel</strong> level 0.0.<br />
Warning level estimates<br />
An alert was not expected for this scenario, but since measurements from loading period were not<br />
available, no warning score could be computed for either compartment1 or compartment 4.<br />
101
Fig. 95. Activities from <strong>of</strong>floading <strong>of</strong> compartment 4 under Scenario 1.<br />
6.2.3.2 Jurisdiction crossing and alternate nominal scenarios<br />
The next trip was designed <strong>to</strong> incorporate “illegal” actions <strong>to</strong> begin testing the evidential reasoning<br />
system’s ability <strong>to</strong> recognize suspicious deviations from the “assigned” route. The <strong>of</strong>ficially assigned<br />
route was <strong>to</strong> begin with the loading <strong>of</strong> 300 gal unmarked fuel and 400 gal marked fuel at the WRC Pad.<br />
The unmarked fuel was then <strong>to</strong> be <strong>of</strong>floaded at the SE VDA, and the marked fuel at the <strong>Fuel</strong> Plaza. In<br />
keeping with the “<strong>of</strong>ficial” route, the marked fuel was <strong>of</strong>floaded as prescribed. However, delivery in a<br />
different jurisdiction was simulated when the marked fuel was <strong>of</strong>floaded at Building C instead.<br />
Loading period<br />
Data from the loading process for both compartments were captured and analyzed for the second trip <strong>of</strong><br />
the field test. As mentioned previously, the noise level in fuel level data was relatively high when the fuel<br />
was being loaded in<strong>to</strong> the compartment. The noise level for the marker concentration data typically was<br />
also higher at the beginning <strong>of</strong> fueling process. <strong>Based</strong> on the compartment 1 reading obtained from<br />
sensors (Fig. 96), measurements during the loading <strong>of</strong> compartment 1 were<br />
• Marker concentration 0.065 (the fuel was unmarked, i.e., ideally it should have been 0.00) and<br />
• <strong>Fuel</strong> level 8.680.<br />
102
Fig. 96. Activities from loading <strong>of</strong> compartment 1 under Scenario 2.<br />
Similar observations on data noises could be seen from the loading <strong>of</strong> compartment 4 (Fig. 97). The<br />
measurements at loading <strong>of</strong> compartment 4 were<br />
• Marker concentration 0.825 and<br />
• <strong>Fuel</strong> level 12.950.<br />
Off-loading period<br />
Again, data noise level in the fuel pressure was much lower for the <strong>of</strong>floading process. Due <strong>to</strong> issues with<br />
the marker sensor originally installed on this compartment, a replacement with a different operating scale<br />
was installed before the compartment <strong>of</strong> fuel was <strong>of</strong>floaded. Noise level for the marker concentration was<br />
much worse <strong>to</strong>ward the end <strong>of</strong> <strong>of</strong>floading, which seemed <strong>to</strong> be corresponding <strong>to</strong> the “empty” fuel tanks.<br />
<strong>Based</strong> on the compartment 1 reading obtained from sensors (Fig. 98), measurements at <strong>of</strong>floading that<br />
would be used for evidential reasoning algorithm were<br />
• Type <strong>of</strong> s<strong>to</strong>p: scheduled,<br />
• Marker concentration 0.07, and<br />
• <strong>Fuel</strong> level 0.280.<br />
103
Fig. 97. Activities from loading <strong>of</strong> compartment 4 under Scenario 2.<br />
Fig. 98. Activities from <strong>of</strong>floading compartment 1 under Scenario 2.<br />
104
Warning level estimates after <strong>of</strong>floading compartment 1<br />
The warning level based on evidential reasoning algorithm returned a value <strong>of</strong> 58%, which was high for a<br />
“legal” case. This false alarm was mainly caused by two fac<strong>to</strong>rs:<br />
1. The change <strong>of</strong> marker concentration from 0.065 <strong>to</strong> 0.07 is about 8%, which was higher than the<br />
preset threshold <strong>of</strong> 5% for error bound. Furthermore, it was also expected that the marker<br />
concentration value for “unmarked” fuel would be near 0.00. A reading <strong>of</strong> 0.07 was thus<br />
determined as “marked” by this interpretation. This reflects the larger than the noise level<br />
expected by the algorithm in the marker concentration data generated from the optical sensor.<br />
2. The fuel level <strong>of</strong> 0.280 was outside the threshold set for “empty” tank. Similar <strong>to</strong> above, this was<br />
also due <strong>to</strong> unexpected level <strong>of</strong> noise in the data collected from the sensor.<br />
Again, noise could be seen in fuel level measures at the beginning <strong>of</strong> <strong>of</strong>floading compartment 4 (Fig. 99),<br />
as well as those <strong>to</strong>ward the end <strong>of</strong> marker sensor readings. As pointed out previously, the fluctuating<br />
marker sensor measures appeared <strong>to</strong> be associated with the drop <strong>of</strong> fuel level <strong>to</strong> the empty state (zero).<br />
Measurements from the <strong>of</strong>floading <strong>of</strong> compartment 4 used for the evidential reasoning were<br />
• Type <strong>of</strong> s<strong>to</strong>p: unscheduled,<br />
• Marker concentration 0.400, and<br />
• <strong>Fuel</strong> level 0.000.<br />
Fig. 99. Activities from <strong>of</strong>floading compartment 4 under Scenario 2.<br />
105
Warning level estimates after <strong>of</strong>floading compartment 4<br />
The warning level based on information collected from sensors and evaluated by the evidential reasoning<br />
algorithm returned a high value <strong>of</strong> 84%. Two fac<strong>to</strong>rs caused the alert: an unscheduled s<strong>to</strong>p where the<br />
valve is opened and a large change (a 52% decrease) in the marker concentration (dropping from the<br />
reading <strong>of</strong> 0.825 at loading <strong>to</strong> a value <strong>of</strong> 0.400 at <strong>of</strong>floading). Thus the crossing jurisdiction case was<br />
successfully detected, although the marker sensor should not have reported a change in concentration for<br />
this scenario.<br />
6.2.3.3 Theft scenario<br />
“Legal” activities for this route would have involved the transfer <strong>of</strong> 400 gal marked fuel from Building C<br />
<strong>to</strong> the WRC Pad. However, the test vehicle s<strong>to</strong>pped at the SE VDA after loading <strong>to</strong> <strong>of</strong>fload 50 gal <strong>of</strong> its<br />
marked fuel payload, thereby simulating theft in transit. Only 350 gal <strong>of</strong> fuel remained <strong>to</strong> be delivered <strong>to</strong><br />
the WRC Pad. Only one compartment was used in this scenario.<br />
Loading period<br />
This scenario only utilized one compartment (compartment 1), and the <strong>to</strong>tal amount involved was 400 gal<br />
<strong>of</strong> marked fuel. Similar <strong>to</strong> previous scenarios, noise levels in fuel level data were relatively high when the<br />
fuel is being loaded in<strong>to</strong> the compartment. Noise on the marker concentration data was also higher at the<br />
beginning <strong>of</strong> fueling process, with a few missing signals (shown as 1.0) occasionally. <strong>Based</strong> on the<br />
compartment 1 reading obtained from sensors (Fig. 100), measurements at loading <strong>of</strong> compartment 1<br />
were<br />
• Marker concentration 0.575 and<br />
• <strong>Fuel</strong> level 10.920.<br />
Off-loading periods<br />
First s<strong>to</strong>p<br />
This activity <strong>of</strong>floaded 50 gal from the tanker, which not only was a very small amount but also a very<br />
short process that only lasted about 1.5 min (from valve opened <strong>to</strong> valve closed). Again, the noise level in<br />
the fuel level data was much lower for this <strong>of</strong>floading process. The marker concentration data did not<br />
show significant noise level changes (besides a missing signal), when compared <strong>to</strong> the noise previously<br />
observed. <strong>Based</strong> on the compartment 1 reading obtained from sensors (Fig. 101), measurements for this<br />
s<strong>to</strong>p resulted in the following values:<br />
• Type <strong>of</strong> s<strong>to</strong>p: unscheduled,<br />
• Marker concentration 0.584, and<br />
• <strong>Fuel</strong> level 6.650.<br />
Second s<strong>to</strong>p<br />
This is the “scheduled” delivery destination, where the remaining 350 gal were <strong>of</strong>floaded from the tanker.<br />
As discussed previously, noise in the fuel level signal was low except at the beginning <strong>of</strong> the <strong>of</strong>floading<br />
process. The marker concentration data again showed a significant increase in noise level when the fuel<br />
level dropped <strong>to</strong> zero at the end <strong>of</strong> the <strong>of</strong>floading process. <strong>Based</strong> on reading obtained from sensors<br />
(Fig. 102), measurements for this s<strong>to</strong>p are<br />
• Scheduled s<strong>to</strong>p,<br />
• Marker concentration 0.728, and<br />
• <strong>Fuel</strong> level 0.000.<br />
106
Fig. 100. Activities from loading <strong>of</strong> compartment 1 under Scenario 3.<br />
Fig. 101. Offloading 50 gal at an unscheduled location under Scenario 3.<br />
107
Warning level estimates<br />
Fig. 102. Activities measured from <strong>of</strong>floading at destination under Scenario 3.<br />
Unscheduled s<strong>to</strong>p<br />
As indicated previously, due <strong>to</strong> design limitations regarding where the sensors could be installed, fuel<br />
characteristic information could only be measured when it flowed through the valve. Thus, in this case,<br />
the small amount (50 gal) <strong>of</strong> fuel moving through the sensors could only be “seen” for less than 1.5 min.<br />
This short time frame did not prevent the sensors from performing their functions. The optical sensor<br />
successfully read what was needed <strong>to</strong> determine that the fuel marker concentration was acceptable, ~1.5%<br />
difference from the “base” measured at loading, which was within the error bound.<br />
The reading from the fuel level sensor, which was limited <strong>to</strong> measure what was flowing through at that<br />
time period, however, could not really be used for comparison with the “base” value. The major alarming<br />
activity for this s<strong>to</strong>p then was the unscheduled s<strong>to</strong>p. The estimated warning level for this s<strong>to</strong>p was 48%,<br />
not a high value but one that could be an initial warning pending on further confirmation from other<br />
actions (i.e., waiting on results from next activity).<br />
Final destination s<strong>to</strong>p<br />
The final warning level estimated for this scenario was 100%. The final measure for the fuel marker<br />
concentration was higher than normal mainly due <strong>to</strong> the large variation at the end when the fuel was<br />
dropped <strong>to</strong> empty. In the future, modification <strong>of</strong> avoiding reading marker measurements from the period<br />
when the fuel level is down <strong>to</strong> zero should be implemented. In this case, both marker and fuel level<br />
showed variations above the maximum error bound set for the algorithm. It reflects a supposedly very<br />
108
likely anomaly, even in the measurement itself or due <strong>to</strong> actual abnormal operations. This might be a false<br />
positive warning, since such high warning was not expected. This might have indicated that the proposed<br />
method <strong>of</strong> anomaly detection failed, or it might be inappropriate, or the data quality caused “confusion” in<br />
the algorithm. Further investigation and improvement is, thus, needed.<br />
6.2.3.4 Blending Scenario 1<br />
This scenario also only utilized one compartment (compartment 4). The “assigned” scenario called for the<br />
test vehicle <strong>to</strong> deliver 300 gal <strong>of</strong> marked fuel from the WRC Pad <strong>to</strong> Building C. Instead, the test vehicle<br />
loaded only 150 gal <strong>of</strong> marked fuel at the WRC pad, and s<strong>to</strong>pped in route at the <strong>Fuel</strong> Plaza <strong>to</strong> add 150 gal<br />
<strong>of</strong> unmarked fuel, thus simulating the blending <strong>of</strong> taxed and untaxed fuel <strong>to</strong> be “passed <strong>of</strong>f” as taxed. The<br />
mixed fuel was delivered <strong>to</strong> Building C.<br />
Loading period<br />
First loading<br />
Same as those observed previously, the noise level in the fuel level data was relatively high when the fuel<br />
was being loaded in<strong>to</strong> the compartment. Noise in the marker concentration data was also higher at the<br />
beginning <strong>of</strong> the fueling process. Since only 150 gal were loaded, it <strong>to</strong>ok a little more than 3 min for the<br />
entire process, from valve opened <strong>to</strong> valve closed. <strong>Based</strong> on the compartment 4 readings obtained from<br />
sensors (Fig. 103), measurements at this loading were<br />
• Marker concentration 0.936 and<br />
• <strong>Fuel</strong> level 7.000.<br />
Second loading (first s<strong>to</strong>p after initial loading)<br />
Although this was another fuel loading, it was not included in the vehicle’s “legal” route and was<br />
therefore considered <strong>to</strong> be an unscheduled s<strong>to</strong>p. The noise level in the fuel level data was again high<br />
during the loading process. Noise in the marker concentration data was higher at the beginning <strong>of</strong> the<br />
fueling process but dropped dramatically when it started “seeing” the unmarked fuel which was loaded at<br />
this s<strong>to</strong>p. This additional 150 gal also <strong>to</strong>ok about 3 min <strong>to</strong> load from the time the valve was opened <strong>to</strong> the<br />
time it was closed. <strong>Based</strong> on the readings obtained from the sensors (Fig. 104), measurements for this<br />
loading were<br />
• Type <strong>of</strong> s<strong>to</strong>p: unscheduled,<br />
• Marker concentration 0.096, and<br />
• <strong>Fuel</strong> level 7.560.<br />
Off-loading periods<br />
This activity <strong>of</strong>floaded 300 gal as scheduled from the tanker, which should have been all marked fuel (had<br />
the vehicle’s activities been confined <strong>to</strong> the “legal” scenario). As shown in Fig. 105, similar noise levels<br />
existed as those that had been observed from other cases. The fuel level, however, did not completely<br />
drop <strong>to</strong> the zero level at the end <strong>of</strong> the <strong>of</strong>floading. Measurements for this s<strong>to</strong>p resulted in the following<br />
values:<br />
• Scheduled s<strong>to</strong>p,<br />
• Marker concentration 0.354, and<br />
• <strong>Fuel</strong> level 0.840.<br />
109
Fig. 103. Activities <strong>of</strong> loading first 150 gal under Scenario 4.<br />
Fig. 104. Activity from adding 150 gal unmarked fuel under Scenario 4.<br />
110
Warning level estimates<br />
Fig. 105. Activity from <strong>of</strong>floading at delivery destination under Scenario 4.<br />
Unscheduled (second) fuel loading s<strong>to</strong>p<br />
This was an unscheduled s<strong>to</strong>p which would have raised some concern by itself already (without the<br />
benefit <strong>of</strong> sensor readings). The warning concern became more severe when the marker sensor detected<br />
the additional fuel being loaded in<strong>to</strong> the tanker was basically unmarked (low value <strong>of</strong> 0.096). Thus the<br />
warning level estimated for this s<strong>to</strong>p was 87%; as such, the algorithm successfully detected a problem for<br />
this activity.<br />
Final destination s<strong>to</strong>p<br />
At the final destination <strong>of</strong> this delivery, the marker concentration was detected at a significantly lower<br />
level than anticipated for marked fuel (0.354 instead <strong>of</strong> the original level <strong>of</strong> 0.936). This mixed fuel raised<br />
the concern and provided an estimated warning level at 63%, which would raise an alarm for a reasonably<br />
suspicious activity.<br />
6.2.3.5 Blending Scenarios 2 and 3<br />
This was the most complex scenario tested at TRC, and simulated two additional types <strong>of</strong> blending. The<br />
vehicle’s “assigned” route involved the delivery <strong>of</strong> two compartments <strong>of</strong> marked fuel (200 gal and<br />
300 gal, respectively) at the fuel plaza after loading at Building C. Instead, compartment 1 <strong>of</strong> the tanker<br />
was loaded with the 200 gal marked fuel (as “assigned”), but then the vehicle made an unscheduled s<strong>to</strong>p<br />
at the SE VDA where 20 gal <strong>of</strong> unmarked fuel (simulating hazardous waste or other substance) was added<br />
via the hatch. Furthermore, the 200 gal <strong>of</strong> fuel load in<strong>to</strong> compartment 4 at the start <strong>of</strong> the trip were<br />
111
unmarked (rather than the 300 gal <strong>of</strong> marked fuel “assigned”), and at the unscheduled s<strong>to</strong>p en route <strong>to</strong> the<br />
final destination, 100 gal <strong>of</strong> marked fuel were added. This simulated the addition <strong>of</strong> a lesser amount <strong>of</strong><br />
marked fuel <strong>to</strong> unmarked fuel, making the entire load “look” marked (taxed). Both compartments were<br />
<strong>of</strong>floaded at the <strong>Fuel</strong> Plaza.<br />
Loading period<br />
Loading at origin (i.e., terminal)<br />
The mounting solution for the valve sensor for this compartment led <strong>to</strong> data issues during this testing. The<br />
signal showed “valve open” continuously for a long period <strong>of</strong> time, during which the valve was known <strong>to</strong><br />
actually be closed. This lasted several hours during some <strong>of</strong> the driving time and during the time when the<br />
tanker was idle while the team <strong>to</strong>ok their lunch breaks. Signal disruptions over this time period seemed <strong>to</strong><br />
be more severe as well. This might have been impacted, at least <strong>to</strong> some degree, by the strong wind and<br />
heavy rain encountered the morning this scenario was tested.<br />
The noise in the fuel level and marker concentration data (Fig. 106 and Fig. 107) were slightly higher than<br />
what had been observed thus far. Measurements for compartment 1 (Fig. 106) at the end <strong>of</strong> the loading<br />
were<br />
• Marker concentration 0.582 and<br />
• <strong>Fuel</strong> level 9.240.<br />
Fig. 106. Activity from loading <strong>of</strong> compartment 1 under Scenario 5.<br />
112
Fig. 107. Activity from loading <strong>of</strong> compartment 4 under Scenario 5.<br />
Although unmarked fuel was loaded in<strong>to</strong> compartment 4, the data from the optical sensor on compartment<br />
4 still showed an appreciable (but low) level <strong>of</strong> marker concentration (indicating an error <strong>of</strong> around 10%<br />
in measurement). Measurements from compartment 4 (Fig. 107) at the end <strong>of</strong> its loading were<br />
• Marker concentration 0.096 and<br />
• <strong>Fuel</strong> level 6.930.<br />
Unscheduled s<strong>to</strong>p with hatch loading<br />
As a part <strong>of</strong> this trip, an unscheduled s<strong>to</strong>p with 20 gal unmarked fuel added in<strong>to</strong> compartment 1 <strong>of</strong> the<br />
tanker was performed. Because there was no other sensors (for fuel level and marker) present on the <strong>to</strong>p<br />
<strong>of</strong> the tanker (only a hatch switch) no fuel pressure or marker concentration changes could be measured.<br />
Thus, the only available indica<strong>to</strong>r that something unusual was occurring was the fact that the hatch was<br />
open and it was at an unscheduled s<strong>to</strong>p. In this case, however, the hatch was open for only 44 seconds.<br />
With such a short period <strong>of</strong> s<strong>to</strong>p, one could easily conclude that as a traffic s<strong>to</strong>p (e.g., s<strong>to</strong>p sign, or waiting<br />
for a turn). Therefore, under this scenario only the “hatch open” indica<strong>to</strong>r was flagged in the data.<br />
113
Same unscheduled s<strong>to</strong>p with additional fuel in<strong>to</strong> compartment 4<br />
At the same unscheduled s<strong>to</strong>p location as above, an additional 100 gal <strong>of</strong> marked fuel were added in<strong>to</strong><br />
compartment 4. Higher noises in fuel marker and fuel pressure measurements can be observed in<br />
Fig. 108. Specifically, the measurements estimated at the end <strong>of</strong> this loading were<br />
• Unscheduled s<strong>to</strong>p,<br />
• Marker concentration: 0.836, and<br />
• <strong>Fuel</strong> level: 8.890.<br />
Off-loading periods<br />
Fig. 108. Activity from loading at unscheduled s<strong>to</strong>p under Scenario 5.<br />
At the final destination <strong>of</strong> this scenario, more than the expected amount <strong>of</strong> fuel was <strong>of</strong>floaded from<br />
compartment 1 (220 gal instead <strong>of</strong> 200). Similar levels <strong>of</strong> noises in fuel pressures and marker<br />
concentration were seen in this data as observed in previous scenarios (Fig. 109). The fuel level did not<br />
drop completely <strong>to</strong> zero where it should be empty at the end <strong>of</strong> the <strong>of</strong>floading, however. The<br />
measurements showed<br />
• Scheduled s<strong>to</strong>p,<br />
• Marker concentration: 0.680, and<br />
• <strong>Fuel</strong> level: 0.980.<br />
114
Fig. 109. Activity from <strong>of</strong>floading <strong>of</strong> compartment 1 under Scenario 5.<br />
As in data collected from compartment 1, similar levels <strong>of</strong> noises in fuel pressures and marker<br />
concentration were presented in the compartment 4 measurement data (Fig. 110). The fuel level also did<br />
not drop <strong>to</strong> zero where it should be empty at the end <strong>of</strong> the <strong>of</strong>floading. The measurements from<br />
compartment 4 are<br />
• Scheduled s<strong>to</strong>p,<br />
• Marker concentration: 0.264, and<br />
• <strong>Fuel</strong> level: 0.840<br />
Warning level estimates<br />
Unscheduled loading s<strong>to</strong>p<br />
At this s<strong>to</strong>p, two parts <strong>of</strong> warnings could be detected. First, although no measurable quantities (see<br />
discussion above) could be used from the sensors, a hatch-open indica<strong>to</strong>r for compartment 1 was detected<br />
<strong>to</strong> reflect a potential problem. Second, the fuel marker level for the additional fuel being loaded in<strong>to</strong><br />
compartment 4 was significantly higher, indicating marked fuel was flowing in<strong>to</strong> compartment 4 (which<br />
should have been holding unmarked fuel per information obtained during the loading period). Thus, the<br />
warning level from this s<strong>to</strong>p was estimated at 98%. This provided a very high level <strong>of</strong> certainty regarding<br />
the warning.<br />
Final destination s<strong>to</strong>p<br />
At the final destination <strong>of</strong> this delivery, the significant change in marker concentration from compartment<br />
1 was detected. Adding <strong>to</strong> the unscheduled s<strong>to</strong>p issue earlier, this removed any uncertainty in the concern<br />
and provided an estimated warning level <strong>of</strong> 100%. Similar results were also observed in compartment 4<br />
data, leading <strong>to</strong> a warning level for compartment 4 which was also at 100%.<br />
115
6.2.4 De-Instrumentation<br />
Fig. 110. Activity from <strong>of</strong>floading <strong>of</strong> compartment 4 under Scenario 5.<br />
The Pilot trac<strong>to</strong>r-trailer was de-instrumented at the conclusion <strong>of</strong> the second day <strong>of</strong> testing with the<br />
exception <strong>of</strong> installing the original sight glasses. ORNL staff returned <strong>to</strong> TRC <strong>to</strong> oversee the installation<br />
<strong>of</strong> the original sight glasses on the Pilot trailer and <strong>to</strong> give instructions as <strong>to</strong> the reloading <strong>of</strong> the fuel<br />
borrowed from Pilot for the testing. The Pilot driver returned later that morning and received the test<br />
vehicle that had been res<strong>to</strong>red <strong>to</strong> original condition.<br />
116
7.1 APPROACH AND METHODOLOGY<br />
7. LESSONS LEARNED<br />
The nature <strong>of</strong> the POC testing precluded the ability <strong>to</strong> collect data from a vehicle hauling fuel in a realworld<br />
environment due <strong>to</strong> the fact that the sensors and electronics had not been certified for use on<br />
tankers hauling flammable liquids and due <strong>to</strong> the need <strong>to</strong> very closely control the sequence <strong>of</strong> test events.<br />
We found that the decision <strong>to</strong> conduct the testing at a test track proved <strong>to</strong> be an acceptable alternative <strong>to</strong><br />
real-world testing. The public was not exposed <strong>to</strong> the testing in any way, and all procedures, equipment,<br />
and installation methods were pre-approved by the Safety Committee at TRC. Further, the installation <strong>of</strong><br />
the equipment, the driving <strong>of</strong> the vehicle, and the transfer <strong>of</strong> the fuel was all handled by TRC staff.<br />
7.2 FUEL MARKER<br />
Three primary lessons were learned in the development <strong>of</strong> a fuel marker chemistry for the FTE POC.<br />
First, it is imperative that the stability <strong>of</strong> the fluorescence signal <strong>of</strong> the marker be tested over weeks or<br />
months, not days. Second, the aging must be done within a diesel matrix at representative temperatures,<br />
not just a “pure” industrial solvent surrogate such as a <strong>to</strong>luene-isopropanol-benzene mix, as this lacks the<br />
heterogeneity and chemical complexity <strong>of</strong> real diesel. As we have seen, components <strong>of</strong> diesel such as<br />
naphthenic acids can react with and diminish or deactivate entirely the fluorescent signal from a potential<br />
marker. Third, the subtleties <strong>of</strong> organic dyes and organic-inorganic complexes cannot be overlooked,<br />
including the fact that, during the synthesis <strong>of</strong> a dye, multiple differently fluorescent by-products or<br />
incompletely reacted reagents or intermediates may remain. The optical signal from these parasitic yields<br />
will degrade in a far different way from that <strong>of</strong> the purified product. The process <strong>of</strong> purification becomes<br />
the main source <strong>of</strong> expense in the preparation <strong>of</strong> a marker chemical due <strong>to</strong> separation apparatus, wash<br />
solvent consumption, and labor hours <strong>to</strong> execute the purification and collect the purified product.<br />
As field tests approached, significant progress was made <strong>to</strong> address the minor variations in fuel chemistry<br />
that had the potential <strong>to</strong> affect absolute marker concentration and thereby impact both the ultimate cost<br />
and sensitivity <strong>of</strong> the marker sensor measurement. Specifically, regional and seasonal variations in the<br />
density <strong>of</strong> diesel were carefully evaluated <strong>to</strong> assess how best <strong>to</strong> add marker <strong>to</strong> test fuel and, in a broader<br />
sense, how much accommodation for the normal variation in diesel density should be made as the<br />
moni<strong>to</strong>ring method is standardized and a pro<strong>to</strong>col written. Why, if the marker sensor reading is a relative<br />
measurement made within the frame <strong>of</strong> a single truckload <strong>of</strong> fuel, should such a seemingly negligible<br />
density variation be tracked? It must be accounted for, no matter how small, because bounds must be<br />
placed upon every variable that could effect change in the apparent marker concentration. In defining the<br />
greatest reasonable potential variation in fuel density, marker concentration variations detected by the<br />
sensor can more accurately reflect the possible range <strong>of</strong> unauthorized dilution. Density variation and its<br />
effect on concentration follows. In the most fundamental definition, density measures the amount <strong>of</strong> mass<br />
per unit <strong>of</strong> volume in a substance. If “more” molecules <strong>of</strong> fuel are packed in<strong>to</strong> the same volume (i.e.,<br />
higher density), slightly more marker molecules would be required <strong>to</strong> mix in<strong>to</strong> that matrix <strong>to</strong> yield the<br />
same sensor signal. For this reason, it was imperative that the fuel marker team equip the sensor team<br />
with the density variation value so that marker sensor values could be assessed in consideration <strong>of</strong><br />
seasonal and regional variations impacting physical properties <strong>of</strong> the diesel fuel. During the winter<br />
months, more volatile, lower molecular weight components are included in diesel blends <strong>to</strong> avert any <strong>of</strong><br />
the “waxing out” <strong>of</strong> the fuel during exposure <strong>to</strong> temperatures below 20–40°F. This waxing out or<br />
gelation, measured with the Cloud Point Test, is the process by which paraffinic fuel components<br />
aggregate and form insoluble particles that can render fuel transfers difficult and compromise engine<br />
efficiency. Similarly, during the summer months, diesel fuel blends are enriched with less volatile<br />
compounds <strong>to</strong> lower vapor pressure and increase <strong>to</strong>tal heat capacity <strong>of</strong> the fuel.<br />
117
It was found that, in general, the density values for diesel vary in greater degrees season <strong>to</strong> season within<br />
the same region than values vary region <strong>to</strong> region within the same season. However, broad variation in<br />
density does exist when comparing region-<strong>to</strong>-region, same season in climate extremes such as Minnesota<br />
versus Arizona. The absolute ranges <strong>of</strong> density values were difficult <strong>to</strong> pinpoint, in large part due <strong>to</strong> the<br />
proprietary nature <strong>of</strong> fuel blending information. Literature searches and discussions with ORNL’s <strong>Fuel</strong>s,<br />
Engines, and Emissions Research Center’s senior fuel scientist Bruce Bunting (formerly <strong>of</strong> Cummins and<br />
Amoco) led <strong>to</strong> a final assessment <strong>of</strong> diesel density variation <strong>of</strong> 2.9% <strong>to</strong> encompass both seasonal and<br />
regional differences.<br />
Finally, it was found that any residual concentrated dye deposited in dead volume or semi-dry metal<br />
surfaces within the tank, preventing the calculated concentration <strong>of</strong> dye from fully mixing with the <strong>to</strong>tal<br />
volume <strong>of</strong> diesel. As was seen in the <strong>Fuel</strong> Loop testing at the test track in East Liberty, Ohio, in April<br />
2011, this type <strong>of</strong> residual undissolved marker creates a situation <strong>of</strong> constant “dosing” within the tanker<br />
and leads <strong>to</strong> an initially false-low marker content reading and an increasing upward drift in the marker<br />
concentration. A precise dosing mechanism for the marker in<strong>to</strong> the fuel is needed. It is not known whether<br />
existing systems for dyeing agricultural diesel could provide adequate precision for dosing the highly<br />
concentrated SiNaph in<strong>to</strong> diesel fuel.<br />
7.3 SENSORS<br />
The valve sensor proved somewhat challenging due <strong>to</strong> the fact that the valve handle had considerable<br />
freedom <strong>to</strong> move as the trailer vibrated in over-the-road operation. To mitigate this variability, the mount<br />
for the valve proximity sensor was designed <strong>to</strong> allow for adjustment in the field. Therefore, a position<br />
could be chosen that minimized the unwanted effects <strong>of</strong> vibration. However, even with this adjustment,<br />
early field testing data showed that when the vehicle was in motion the vibration produced some spurious<br />
and erroneous signals. To correct this issue during testing, the valve handle was taped in position during<br />
transport over the road.<br />
During the field tests, the isolation valve for the pressure transducer was found <strong>to</strong> be mostly unneeded.<br />
The impulse pressure from the transfer pump used at TRC was found <strong>to</strong> produce only mild fluctuations in<br />
fluid pressure. These fluctuations were below the levels required <strong>to</strong> damage the pressure sensor. The<br />
bleed valve, however, was found <strong>to</strong> be useful in certain tests. Because the diesel trapped in the line<br />
between the trailer bot<strong>to</strong>m valve and the “belly” valve experienced changes in pressure as the ambient<br />
temperature varied, it was <strong>of</strong>ten necessary <strong>to</strong> bleed the pressure <strong>to</strong> validate the pressure sensors<br />
operations. Likewise, the cus<strong>to</strong>m sight glass that served as a mount for most <strong>of</strong> the sensors would<br />
experience some level <strong>of</strong> leaking around the bolt holes due <strong>to</strong> pressure build up. In a real-world<br />
application, these components would likely “screen-out” as the liquid level measurement would be made<br />
from within the tank compartment, not in the fuel transfer plumbing.<br />
A number <strong>of</strong> lessons learned were related <strong>to</strong> the instrumentation <strong>of</strong> the truck. First, there were Leak issues<br />
with the 7-bolt (versus 8-bolt) configuration on the sight glass flange. This issue could be avoided with an<br />
alternate optical sensor mounting solution <strong>to</strong> allow all eight flange bolts <strong>to</strong> be utilized.<br />
The <strong>to</strong>rquing <strong>of</strong> the bolts was an issue as well; these originally were not tightened enough by the TRC<br />
technician who did the installation because he was afraid <strong>of</strong> damaging the sight glass. This was corrected<br />
onsite prior <strong>to</strong> testing, and it was later determined that they <strong>to</strong>rqued at about 20 ft-lb. In the future, the<br />
proper <strong>to</strong>rque specifications should be determined prior <strong>to</strong> testing for a proper mounting <strong>of</strong> test items.<br />
Leaks were also a problem with the pressure sensor attachment; the threaded sleeve in<strong>to</strong> sight glass was<br />
not properly sealed and tightened. A TRC technician was able <strong>to</strong> tighten without have <strong>to</strong> remove sight<br />
glass assembly from trailer. A short-term solution could involve mounting the pressure transducer directly<br />
118
<strong>to</strong> the sight glass flange, sealing with Teflon tape. Future pro<strong>to</strong>types will likely have a level sensor in tank<br />
compartment <strong>to</strong> allow level readings at times beyond when the belly valve is open.<br />
Because <strong>of</strong> the location <strong>of</strong> the pressure transducer, the pressure reading was only valid when the belly<br />
valve was open and the valve for fuel loading/unloading was closed. Ideally, the level sensor should be in<br />
the fuel compartment <strong>to</strong> afford more accurate and longer duration readings. The sight glass location was<br />
selected for testing due <strong>to</strong> the requirement not <strong>to</strong> permanently modify the trailer or install sensors in the<br />
fuel compartment. This will not be an issue for real-world systems with an in-tank sensor.<br />
Due <strong>to</strong> the location <strong>of</strong> the pressure transducer and restrictions from tubing/plumbing connections and<br />
trapped air, there was concern over the accuracy <strong>of</strong> the pressure transducer. It was found that when the<br />
fuel temperature changed, the pressure transducers went <strong>of</strong>f scale (for temperature increases) or <strong>to</strong> zero<br />
(for temperature drops). This was due <strong>to</strong> the fuel expanding or contracting in the deadheaded section <strong>of</strong><br />
piping. This issue would also be corrected by using an in-tank level sensor.<br />
In addition <strong>to</strong> the marker sensor noise, the fuel level (pressure sensor) also had a higher-than-expected<br />
noise level. We also assumed that the fuel level will drop <strong>to</strong> zero when the tank is <strong>of</strong>f loaded, but this<br />
appeared <strong>to</strong> be not always the case. This also points <strong>to</strong> the need for use <strong>of</strong> an alternate level sensor and<br />
alternate location (in the tanker compartment).<br />
Apparently, the Air-Weigh self-weighing system was not calibrated when it was installed by the Air-<br />
Weigh technician in Knoxville. This was not identified until the Air-Weigh tech supporting our upfit<br />
noticed it during the installation <strong>of</strong> the new ComLink <strong>to</strong> support the T2TCU signals. We did a calibration<br />
at TRC using their certified scales. We added what weight we could (1000 gal <strong>of</strong> fuel), but the calibration<br />
would have been more accurate across the full range <strong>of</strong> weights encountered in normal operation if we<br />
could have fully loaded the tanker. This and other integration issues would have been determined in a<br />
“test fit” <strong>of</strong> all components and communications paths prior <strong>to</strong> the trip <strong>to</strong> the test track. This was not<br />
possible due <strong>to</strong> the nature <strong>of</strong> the test vehicle’s operation; however, in the future, every effort should be<br />
made <strong>to</strong> coordinate a time for such a test <strong>of</strong> instrumentation prior <strong>to</strong> extended testing. This should include<br />
a full “shakedown” <strong>of</strong> the system and exercising at least one <strong>of</strong> the test scenarios <strong>to</strong> validate full system<br />
functionality and <strong>to</strong> identify flaws in procedures, methods, and assumptions.<br />
The marker sensor was a pro<strong>to</strong>type and was not shielded for noise. Noise was an issue and caused<br />
problems for the Evidential Reasoning Team. Also, the sampling rate <strong>of</strong> the sensor communications<br />
system (1 Hz) was low relative <strong>to</strong> the noise, and thus it was hard <strong>to</strong> determine if a given output was a real<br />
reading <strong>of</strong> the fuel marker concentration or just an abnormal reading attributed <strong>to</strong> noise. A suggested<br />
improvement would involve shielding for RF and perhaps a faster sampling rate in conjunction with onboard<br />
filtering.<br />
The suite <strong>of</strong> marker sensors (three <strong>to</strong>tal, including one spare) did not have the same reading for the same<br />
fuel marker concentrations. The output <strong>of</strong> the marker sensors was relative and not exact for the same fuel<br />
sample. Again, this caused problems for the FTE Upload Data Service s<strong>of</strong>tware. For future work, a design<br />
and/or calibration should be explored that provides more standardization, giving the same output for the<br />
same marker concentration.<br />
In general, the fuel marker sensor performed as expected. However, the noise levels associated with this<br />
sensor during the field testing was higher than those recorded during preparations for the test. Further<br />
investigation <strong>of</strong> the problem showed the radio frequency (RF) interference at the test track was <strong>to</strong> blame<br />
for spurious signals that showed up in the sensor’s output.<br />
119
For the POC test, the sensor’s housing was made <strong>of</strong> plastic because the plastic housing could be easily<br />
fabricated and modified. Because plastic is a poor barrier <strong>to</strong> RF radiation, it was possible for RF signal <strong>to</strong><br />
enter the sensor’s electronics package and produce unwanted signal fluctuations at the IC pho<strong>to</strong>detec<strong>to</strong>rs<br />
and amplifiers. These signals resulted in noise as shown in Fig. 111.<br />
In addition, the plastic housing was poorly suited for waterpro<strong>of</strong>ing the sensor’s electronics. This was<br />
known in advance <strong>of</strong> the field test, but for cost and design reasons, the plastic housing was not replaced<br />
with a metal housing. Although this was a pro<strong>to</strong>type system, we did experience heavy wind and rain<br />
during the field testing. Silicone caulk, tape, and plastic sheeting were used <strong>to</strong> protect the sensors enough<br />
that they functioned well during the 2 days <strong>of</strong> actual testing. Future designs should take bad weather in<strong>to</strong><br />
consideration (even for testing) and not wait until real-world deployment <strong>of</strong> such features.<br />
Ratio<br />
1<br />
0.9<br />
0.8<br />
0.7<br />
0.6<br />
0.5<br />
0.4<br />
0.3<br />
0.2<br />
0.1<br />
0<br />
Signal Noise at 800 PPB<br />
0 200 400 600 800 1000<br />
Samples<br />
Fig. 111. RF-induced noise in pro<strong>to</strong>type fuel marker sensor.<br />
Because <strong>of</strong> the handle design <strong>of</strong> the fuel loading/unloading valve, it was able <strong>to</strong> move during truck<br />
movement, which caused the magnetic switches used on the valves <strong>to</strong> report open or momentary open<br />
conditions during movement. This could be corrected by screening out valve movement during times<br />
when vehicle movement is reported. However, depending on where the valve handle moves, it might<br />
show “open” during a s<strong>to</strong>p even if it is closed. For future work, a new switch mounting solution should be<br />
explored, perhaps one where the switch is in the actual valve stem or other location that is not affected by<br />
the flopping <strong>of</strong> the handle.<br />
120
7.4 COMMUNICATIONS<br />
The decision <strong>to</strong> use the ORNL DAS provided the needed flexibility for data retrieval in this POC stage <strong>of</strong><br />
testing. During the preliminary testing at TRC, it was discovered that the initial data sampling rate <strong>of</strong><br />
0.1 Hz was <strong>to</strong>o low. Because the data retrieval component was under ORNL’s direct control, this could be<br />
altered with a relatively minor s<strong>of</strong>tware change.<br />
Another issue encountered during installation was that the truck battery went dead due <strong>to</strong> the drain<br />
encountered from the truck doors being open and equipment being powered up that was connected<br />
directly <strong>to</strong> the vehicle’s batteries. This is a common problem during an instrumentation upfit; vehicles <strong>of</strong><br />
this type (long operating duty cycles) typically have weak batteries. This caused us <strong>to</strong> lose some data at<br />
the beginning <strong>of</strong> the first test. When the driver attempted <strong>to</strong> start the trac<strong>to</strong>r once we initialized our DAS,<br />
the voltage drop caused the DAS <strong>to</strong> shut down (and we were unaware <strong>of</strong> this for several minutes <strong>of</strong> the<br />
initial testing). For future upfits, shop personnel should be asked <strong>to</strong> charge the truck batteries during<br />
equipment installation; in addition, the DAS should be checked for data transfer at the start <strong>of</strong> each test.<br />
An issue related <strong>to</strong> the T2TCU was the crashing <strong>of</strong> data over the ABS power line (J560 connec<strong>to</strong>r). The<br />
ABS power line is used by the vehicle for communications beyond the FTE data. There were apparent<br />
data conflicts that caused our Air-Weigh T2TCU system <strong>to</strong> slow down as each moment passed <strong>to</strong> the<br />
point that the data that posted data was several minutes old rather than real time. This caused confusion<br />
and delays in getting the system working and ready for testing (about a day and a half <strong>of</strong> delay overall).<br />
This problem was solved by adding a power line (isolated from the truck battery by using an AC inverter<br />
in conjunction with a DC power supply <strong>to</strong> convert back <strong>to</strong> DC) directly from the trailer unit <strong>to</strong> the cab<br />
unit. Such a cable would not be practical in the real world. However, Air-Weigh stated that they have a<br />
filter for such problems but did not send us one because they did not think it would be needed given the<br />
age <strong>of</strong> the test vehicle. This filter would need <strong>to</strong> be tested <strong>to</strong> be sure it corrects this problem for future<br />
systems. This problem was not initially identified in Knoxville because we never actually installed our<br />
equipment on this specific trac<strong>to</strong>r.<br />
The TRC campus has several areas <strong>of</strong> no cellular phone signal. This caused a loss <strong>of</strong> data <strong>to</strong> the back<br />
<strong>of</strong>fice. (A local copy <strong>of</strong> the data was on the DAS, so no data was actually lost. It was just not available in<br />
real time.) This points <strong>to</strong> the need for some on-board processing <strong>of</strong> data and decision making in addition<br />
<strong>to</strong> a communication component <strong>to</strong> resend key data later if a communication link cannot be established.<br />
Otherwise, loss <strong>of</strong> cell signal will render such a system useless during times <strong>of</strong> signal loss, which could be<br />
<strong>of</strong> long duration if they coincided with the vehicle being parked for fuel loading/unloading in a cellular<br />
dead zone. A number <strong>of</strong> fac<strong>to</strong>rs prevented the discovery <strong>of</strong> this communications issue during the<br />
communications testing conducted at TRC several weeks prior. First, the vehicle did not always park in<br />
the exact locations used in the testing, although the general areas (WRC Pad, Building C, etc.) were the<br />
same. Second, the weather during the testing was much worse, hampering both cellular and GPS<br />
reception. Finally, the DAS was placed down inside the cab <strong>of</strong> the truck; during the earlier tests, the DAS<br />
was placed on the seat <strong>of</strong> the passenger car.<br />
7.5 EVIDENTIAL REASONING<br />
With the exception <strong>of</strong> the GPS data, all “sensors’ responses” were simulated using the sensor simulation<br />
unit during the pretest. Thus, for the evidential reasoning team, the purpose <strong>of</strong> this pretest at TRC was<br />
mainly <strong>to</strong> be familiar with the site and its configurations, in terms <strong>of</strong> areas where the tanker would travel<br />
during the field test. An important purpose <strong>of</strong> the pretest was <strong>to</strong> test the coordination and data transfer<br />
between communications team systems and those <strong>of</strong> the evidential reasoning team using the DAS system.<br />
It was discovered after the pretest that certain short durations on the simulated activities had resulted in<br />
missing signal responses from the sensors (i.e., an activity started and finished within the 10 second data<br />
121
interval originally set for the pretest). Thus, the data collection rate was increased from 0.1 Hz <strong>to</strong> 1 Hz for<br />
the actual tanker testing, keeping the 5 min interval <strong>of</strong> transmitting data. This data collection and<br />
transmission rate was used during the field testing. <strong>Based</strong> on information gathered through the field test,<br />
this rate <strong>of</strong> data collection appeared <strong>to</strong> be appropriate. Under real-world conditions, however, this<br />
frequency rate may not be practical. Additional research involving real-world operations would be<br />
necessary <strong>to</strong> determine proper and reasonable data collection and transmission rates.<br />
<strong>Based</strong> on data gathered from the fuel loop testing conducted during the pretest, the team realized that<br />
there were significant noises in the fuel marker measurements, particularly those measurements collected<br />
during the beginning <strong>of</strong> fueling or <strong>of</strong>floading process. The general consensus <strong>of</strong> the team was <strong>to</strong> use<br />
measurement readings obtained from the period immediately prior <strong>to</strong> the valve closure for the evidential<br />
reasoning algorithm. This method was implemented in the analysis <strong>of</strong> data collected from the scenario<br />
testing with the instrumented tanker. As shown in the field test results presented in Sect. 6, appreciable<br />
signal noise also could be seen in data collected during the time period immediately before the valve was<br />
closed. There seemed <strong>to</strong> be a correlation between the noise level <strong>of</strong> the marker concentration signal and<br />
the fuel level; the noise tended <strong>to</strong> be more significant in the marker measurement when the fuel level was<br />
low (typically at the end <strong>of</strong> <strong>of</strong>f-loading fuel). This indicated that data obtained from the end period (i.e.,<br />
period immediately prior <strong>to</strong> the valve closed) was not as stable as originally expected, and thus it might<br />
not provide accurate information for evaluating “evidence” (i.e., examining variations or changes in<br />
sensor readings due <strong>to</strong> a given event). Additional testing would be necessary <strong>to</strong> derive methods for<br />
making the necessary adjustments <strong>to</strong> the data so that measurements collected from the sensors could be<br />
better used as inputs <strong>to</strong> identify abnormalities using evidential reasoning algorithms.<br />
In terms <strong>of</strong> evidential reasoning algorithms, the method employed for the POC evaluated information<br />
regarding the following: scheduled/unscheduled s<strong>to</strong>p, valve opened/closed, hatch opened/closed, fuel<br />
level, and marker concentration. The use <strong>of</strong> weight information from the GPS system as an input should<br />
be further explored. Since the weight was obtained independently from the GPS system and other sensors,<br />
it is expected that this information could improve the evidential reasoning algorithm, particularly in the<br />
event that a sensor is not functioning properly.<br />
Since the evidential reasoning relied heavily on the input data from sensors and GPS systems, it is<br />
important <strong>to</strong> point out that any improvements in the data quality will have a direct impact on the results<br />
generated from the evidential reasoning analysis. The more the noise in data can be reduced, the more<br />
accurate the resulting estimates. Data collected from the TRC field test, in fact, was the first “real” data<br />
set <strong>to</strong> be processed by the evidential reasoning algorithm developed for this project. Thus, without any<br />
prior calibration (not possible due <strong>to</strong> lack <strong>of</strong> access <strong>to</strong> the vehicle), some unfavorable results from the<br />
system (or algorithm) would be expected. A lesson learned from this process highlighted the need for<br />
realistic data <strong>to</strong> ensure the success <strong>of</strong> an algorithm development. As in any model development, data is<br />
needed <strong>to</strong> train the models so that they can behave properly for the intended purposes.<br />
The time sequencing <strong>of</strong> the data collection is also important and will reduce unnecessary data cleaning<br />
effort during the data analysis. From the data analysis point <strong>of</strong> view, each test scenario should be<br />
conducted in a logical sequence without interruptions. For example, when conducting one <strong>of</strong> the test<br />
scenarios at the TRC, after the initial loading, the tanker was moved <strong>to</strong> an unspecified location for a<br />
period <strong>of</strong> break and then returned <strong>to</strong> the initial loading place <strong>to</strong> restart the original sequence in the<br />
scenario. This testing break caused a certain skew in the time sequencing <strong>of</strong> the tests and additional effort<br />
had <strong>to</strong> be spent <strong>to</strong> identify and remove the portion <strong>of</strong> “unneeded” data prior <strong>to</strong> the algorithm operation.<br />
These added “events” (driving <strong>to</strong> an unspecified location, s<strong>to</strong>pped for a period <strong>of</strong> time, and returned back<br />
<strong>to</strong> the original place) also caused some confusion during the examination <strong>of</strong> the GPS data.<br />
122
8.1 RECOMMENDED ARCHITECTURE<br />
8. ARCHITECTURE AND COSTS<br />
The following architecture recommendations for the fuel delivery truck based FTE detection solution are<br />
made as a result <strong>of</strong> information gained in the POC. The architecture described in this section could<br />
facilitate both real-time notification and auditing uses <strong>of</strong> the data collected. Interdiction may be possible<br />
with this architecture depending on how the real-time notifications are handled and the availability <strong>of</strong><br />
enforcement resources. In order <strong>to</strong> conserve bandwidth, this architecture takes an exception-based<br />
approach with much <strong>of</strong> the data processing taking place in the on-board system. This design is based on<br />
the assumption that the dispatch is able <strong>to</strong> provide up-<strong>to</strong>-the-minute delivery instructions in an electronic<br />
form which can be used by an on-board algorithm.<br />
8.1.1 System Components<br />
The recommended architecture for the FTE detection system is based on the information available from<br />
the following sensors installed in each fuel compartment <strong>of</strong> the trailer: fuel level, marker concentration,<br />
valve status, and hatch status. Communications between the trac<strong>to</strong>r and trailer is handled by the trailer-<strong>to</strong>trac<strong>to</strong>r<br />
communications unit (T2TCU). The trailer-side T2TCU moni<strong>to</strong>rs sensors and reports<br />
measurements <strong>to</strong> the trac<strong>to</strong>r-side T2TCU via power line communications (or frequency shift keying).<br />
Upon receipt <strong>of</strong> the messages from the trailer T2TCU, the trac<strong>to</strong>r-side T2TCU posts the messages <strong>to</strong> the<br />
J1939 data bus in the trac<strong>to</strong>r. The telematics device in the cab reads the signals from the data bus and<br />
sends and receives information <strong>to</strong> and from the telematics back <strong>of</strong>fice system and dispatch. The telematics<br />
back <strong>of</strong>fice system (BOS) sends dispatch information (amounts, <strong>of</strong>floading locations, taxed/untaxed) <strong>to</strong><br />
on-board telematics devices. The telematics BOS also receives information from the on-board telematics<br />
device and maintains records including hours <strong>of</strong> service information and loading/<strong>of</strong>floading incidents. In<br />
case <strong>of</strong> apparent fuel theft, an alert is passed <strong>to</strong> the fleet dispatch and may also be passed <strong>to</strong> a command<br />
and control center. The command and control center provides notification <strong>to</strong> enforcement as appropriate<br />
in cases <strong>of</strong> apparent fuel theft. The key components <strong>of</strong> this system are shown in Fig. 112.<br />
8.1.2 Data and Communications<br />
The data flow for the recommended architecture minimizes the amount <strong>of</strong> data transferred <strong>to</strong> the<br />
command and control center and the processing which needs <strong>to</strong> be done there. As such, the majority <strong>of</strong><br />
the data processing takes place on board the vehicle while also balancing the complexity <strong>of</strong> the T2TCU<br />
and electronic on-board recorder (EOBR) processing algorithms.<br />
Each compartment <strong>of</strong> the tanker trailer is instrumented with the following RS485 sensors (where signals<br />
are not directly available from the tanker electronics). The RS485 communication was selected because <strong>of</strong><br />
the flexibility <strong>to</strong> handle a variable number <strong>of</strong> inputs (depending on the number <strong>of</strong> compartments):<br />
• Hatch status (open, closed),<br />
• Valve status (open or closed),<br />
• Marker concentration (in ppb or similar measurement), and<br />
• Compartment fuel level (calibrated <strong>to</strong> provide level estimate in gallons).<br />
The trailer-side T2TCU moni<strong>to</strong>rs all sensors in all compartments at a rate <strong>of</strong> 0.5 Hz (every 2 seconds).<br />
The recommended architecture uses one-way communication from trailer <strong>to</strong> trac<strong>to</strong>r <strong>to</strong> limit complexity<br />
and communication requirements. For normal circumstances when neither loading nor <strong>of</strong>floading is<br />
taking place, the trailer side will report that sensors are functioning properly at a rate <strong>of</strong> 0.1 Hz (every<br />
123
Fig. 112. Data flow for recommended architecture.<br />
10 seconds). Otherwise, the T2TCU will report compartment-specific information (compartment number,<br />
level, marker reading, hatch and valve status) when any <strong>of</strong> the following conditions are met (and continue<br />
<strong>to</strong> provide updates <strong>to</strong> trailer unit at a rate <strong>of</strong> 0.2 Hz as long as these conditions persist):<br />
• any trailer sensor goes <strong>of</strong>fline,<br />
• hatch is open,<br />
• valve is open,<br />
• marker concentration reading changes more than a certain amount (more than the <strong>to</strong>lerance <strong>of</strong> the<br />
sensor), and<br />
• level reading changes more than a certain amount (more than the <strong>to</strong>lerance <strong>of</strong> the sensor). Note<br />
that this condition will typically be redundant with hatch or valve opening.<br />
The trac<strong>to</strong>r-side T2TCU posts messages from the trailer-side T2TCU <strong>to</strong> the vehicle’s J1939 databus upon<br />
receipt. As described previously, a generic “sensors okay” message will be sent at 0.1 Hz (standard<br />
message indicating fuel transfer is not taking place and sensors functioning) or a warning message at<br />
0.5 Hz (compartment-specific messages when conditions warrant additional data transmission as<br />
described previously).<br />
The on-board telematics device contains a GPS unit, enabling it <strong>to</strong> process the received messages from<br />
the trailer (read from the J1939 data bus) in light <strong>of</strong> the dispatch messages <strong>to</strong> determine whether a<br />
potentially suspicious message is part <strong>of</strong> the normal, legal operations or not. The telematics device also<br />
functions as an electronic on-board recorder and may read other signals from the data bus for fleet<br />
management purposes. An application on the telematics device processes the data from the trailer and<br />
makes a determination regarding whether tampering, FTE, or regular legal operations are taking place.<br />
When fuel transfers are taking place, the on-board GPS information is compared <strong>to</strong> electronically<br />
received dispatch information from the telematics BOS. If the algorithm determines the activities are<br />
124
legal, a summary fuel transfer conditions (amount, type <strong>of</strong> fuel, compartment, and drop location) are<br />
s<strong>to</strong>red on-board until the next regular upload period when the data is transferred <strong>to</strong> the BOS.<br />
The algorithm will prompt the telematics device <strong>to</strong> provide immediate notification when the trailer goes<br />
<strong>of</strong>fline during the course <strong>of</strong> regular delivery operations or fuel is being moved in amounts or at locations<br />
different from those received from dispatch. This notification will be sent from the telematics back <strong>of</strong>fice<br />
<strong>to</strong> the fleet dispatch and command and control center (from which it may be sent <strong>to</strong> enforcement as well if<br />
the situation warrants). Also needed is a way <strong>to</strong> handle interrupted communications (e.g., areas <strong>of</strong> poor<br />
cell coverage). The suggested algorithm makes use <strong>of</strong> a non-GIS approach, in which GPS data is only<br />
used <strong>to</strong> determine loading and drop-<strong>of</strong>f locations, not <strong>to</strong> make routing determinations. Should a GIS<br />
approach be desired, it could be incorporated in<strong>to</strong> the on-board functionality <strong>of</strong> the telematics device.<br />
8.2 COST ASSESSMENT<br />
The costs related <strong>to</strong> the implementation <strong>of</strong> the proposed architecture can be divided in<strong>to</strong> five major<br />
groups: (1) sensor costs (including equipment and installation); (2) communications costs (from trailer <strong>to</strong><br />
trac<strong>to</strong>r and from/<strong>to</strong> vehicle); (3) telematics service provider cost; (4) cost <strong>of</strong> fuel marker (including<br />
chemical components and injection in<strong>to</strong> fuel); and (5) cost <strong>of</strong> s<strong>of</strong>tware (including development and<br />
deployment <strong>of</strong> evidentiary reasoning algorithms and GIS databases). Some <strong>of</strong> these costs are incurred<br />
only once during the lifetime <strong>of</strong> the equipment (e.g., sensor costs, s<strong>of</strong>tware development cost), while other<br />
costs are recurrent (e.g., fuel marker, from/<strong>to</strong> vehicle communication costs, telematics service provider<br />
costs).<br />
Table 6 presents a summary <strong>of</strong> these costs for the proposed architecture. In that table, the “from/<strong>to</strong><br />
vehicle” communications costs and the telematics service provider costs are grouped in<strong>to</strong> one item. This<br />
is because the proposed architecture only requires a minimal communication frequency with the<br />
command and control center, and in general this low frequency <strong>of</strong> communication is included in the<br />
telematics provider monthly service fee. For higher communication frequencies (discussed later in this<br />
section for an architecture that relies on a centralized system), the telematics service provider costs and<br />
the communication costs are separated.<br />
In Table 6 the costs are not homogeneous (i.e., some are on a per vehicle basis, and others on a per month<br />
basis, etc.) and therefore cannot be added <strong>to</strong> determine the financial impact that the proposed FTE<br />
architecture could impose on fuel-hailing companies and ultimately on fuel consumers. However,<br />
assumptions can be made <strong>to</strong> compute a <strong>to</strong>tal cost per gallon <strong>of</strong> fuel that a FTE system would impose.<br />
These assumptions are as follows.<br />
1. The life cycle <strong>of</strong> the sensors is 5 years.<br />
2. Each vehicle makes four trips per day with a full tank (8,800 gal <strong>of</strong> fuel).<br />
3. The development cost <strong>of</strong> the Evidentiary Reasoning S<strong>of</strong>tware is $1 million and will be used by<br />
50,000 vehicles.<br />
4. The maintenance cost <strong>of</strong> the Evidentiary Reasoning S<strong>of</strong>tware is negligible.<br />
With these assumptions, the additional cost per gallon <strong>of</strong> fuel would be $0.0702. That is, the impact <strong>of</strong> the<br />
sensor/communications/s<strong>of</strong>tware technology would be only $0.0002 per gallon <strong>of</strong> fuel hauled (i.e.,<br />
$0.0702–$0.07), with the bulk <strong>of</strong> the cost attributed <strong>to</strong> the fuel marker itself (note: even in an extreme<br />
case in which a tanker trailer only hauls a full tank once per week, the cost per gallon <strong>of</strong> fuel would be<br />
$0.0758). The <strong>to</strong>tal annual cost for the fuel transportation company would be $2,651.<br />
125
Discrete sensors<br />
Table 6. Summary <strong>of</strong> FTE-related costs for the proposed architecture<br />
126<br />
# <strong>of</strong> units Cost per unit Total cost<br />
Hatch position sensors 4 $50.00 $200.00<br />
<strong>Fuel</strong> level sensors 4 $1,500.00 $6,000.00<br />
Vehicle weight sensors a<br />
Tanker trailer 1 $125.00 $125.00<br />
Trac<strong>to</strong>r 1 $950.00 $950.00<br />
Valve position sensors 4 $50.00 $200.00<br />
<strong>Fuel</strong> marker sensors 4 $100.00 $400.00<br />
Spatial location sensor (GPS) 1 $0.00 b $0.00<br />
Sensor installation 1 $800.00 $800.00<br />
Communications<br />
Total cost discrete sensors ($/veh) $8,675.00<br />
T2TCU w/sensors 1st compartment 1 $875.00 $875.00<br />
Additional compartments 3 $225.00 $675.00<br />
Telematics service provider<br />
Total cost communications ($/veh) $1,550.00<br />
Includes from/<strong>to</strong> vehicle communications 1 $50.00 $50.00<br />
<strong>Fuel</strong> marker<br />
Total cost telematics service<br />
provider ($/month)<br />
$50.00<br />
<strong>Fuel</strong> marker cost 1 $0.07 c $0.07<br />
S<strong>of</strong>tware<br />
Evidentiary reasoning application<br />
Total cost fuel marker ($/gal) $0.07<br />
Development d 1 $20.00 $20.00<br />
Installation 1 $30.00 $30.00<br />
Total cost s<strong>of</strong>tware ($/veh) $50.00<br />
a Assumes that the T2TCU is installed.<br />
b Included in Telematics Provider’s monthly fee.<br />
c The cost <strong>of</strong> the fuel marker in mass production is as <strong>of</strong> 2011 about $0.72/gal; however, there is a significant<br />
probability that this cost could be reduced by 90%.<br />
d Assumes 50,000 tanker trailers.<br />
8.2.1 Real-time Interdiction System<br />
As described elsewhere in this report, a real-time interdiction system would require that as soon as a<br />
suspicious action by a driver is detected, the dispatcher be alerted. Early detection, in turn, requires the<br />
determination <strong>of</strong> a likely route that the vehicle would follow <strong>to</strong> its assigned fuel distribution destination;<br />
any deviation from that rout would set up an alarm. The Evidentiary Reasoning S<strong>of</strong>tware is capable <strong>of</strong><br />
generating those routes and <strong>of</strong> determining when diversions occur. However, <strong>to</strong> be able <strong>to</strong> accomplish<br />
this, the s<strong>of</strong>tware requires additional information, such as an up-<strong>to</strong>-date GIS database <strong>of</strong> the transportation<br />
network.
The proposed architecture does not consider this capability. However, it could be added at an additional<br />
cost <strong>of</strong> about $150/vehicle/year, which covers the annual costs <strong>of</strong> a GIS database license and some<br />
additional on-board hardware. Notice that all the other costs remain the same as indicated in Table 1,<br />
since it is expected that the need <strong>to</strong> communicate with the dispatcher would only increase slightly or (in<br />
most cases) not at all. In this case, and under the assumptions discussed above, the additional cost per<br />
gallon <strong>of</strong> fuel hauled would be $0.0702/gal (i.e., same as before). In this case, the <strong>to</strong>tal annual cost for the<br />
fuel transportation company would be $2,681.<br />
8.2.2 Centralized System<br />
The architecture proposed here is such that all <strong>of</strong> the evidentiary reasoning <strong>to</strong> identify a FTE event is<br />
performed on-board <strong>of</strong> the vehicle and only alarms are transmitted <strong>to</strong> the dispatcher or other interested<br />
parties. If a centralized system that is a deposi<strong>to</strong>ry <strong>of</strong> all the information collected and that houses the<br />
Evidentiary Reasoning S<strong>of</strong>tware is required, then the frequency with which the vehicle communicates<br />
with the central system would increase significantly. This in turn would increase the telematics providers<br />
fee <strong>to</strong> $100/month or more, depending on how <strong>of</strong>ten the vehicle is required <strong>to</strong> submit the status <strong>of</strong> the onboard<br />
sensors (including spatial location). Under the assumptions discussed above, a centralized system<br />
would increase the cost per gallon <strong>of</strong> fuel hauled by $0.0703/gal. This figure does not include the<br />
operation costs <strong>of</strong> the centralized system. For the fuel transportation company, the <strong>to</strong>tal annual cost would<br />
be $3,251.<br />
8.2.3 <strong>Fuel</strong>-marker Break-even Cost<br />
The U.S. Energy Information Administration Annual Energy Review 2010 (Table 5.13c) 9 indicates that in<br />
2009 the daily consumption <strong>of</strong> diesel fuel and jet fuel in the United States was 2,600,000 and 1,407,000<br />
barrels, respectively. With this information and assuming a tax evasion <strong>of</strong> $1 billion per year, it is<br />
possible <strong>to</strong> estimate the break-even cost <strong>of</strong> the fuel marker (i.e., fuel-marker cost at which the dollar<br />
amount that would be recovered from avoiding tax evasion would be completely spent in adding the fuel<br />
marker <strong>to</strong> the fuel). Considering 42 gal/barrel, in 2009 the United States consumed 61,473M gal <strong>of</strong> fuel,<br />
which gives a break-even cost for the fuel marker <strong>of</strong> $0.016/gal (= $1B/61,473M gal). Therefore, <strong>to</strong> make<br />
economic sense, the fuel marker would have <strong>to</strong> cost much less than $0.016/gal for an annual fuel tax<br />
evasion <strong>of</strong> $1 billion. Conversely, and considering the price <strong>of</strong> fuel marker included in Table 6<br />
(i.e., $0.07/gal), the annual fuel tax evasion figure should be larger than $4.30 billion.<br />
This shows the very large financial impact that the fuel marker has in implementing this technology <strong>to</strong><br />
avoid FTE. A system like the one proposed here (see Proposed Architecture above), but without the fuel<br />
marker component, would still derive most <strong>of</strong> the benefits at a very minimal cost. Such a system will still<br />
have the auditing capabilities; that is, all the fuel loading and unloading events would be registered with<br />
location and time, as well as all the hatch opening events. Therefore, if a hatch or valve vents occurs at an<br />
“un<strong>of</strong>ficial” site, it could be further investigated. This system would also greatly reduce the costs for the<br />
fuel transportation company. For example, it will go from $2,651/year <strong>to</strong> $720/year (= $600/year for the<br />
telematics service fee plus $120/year for the cost and installation <strong>of</strong> the valve and hatch sensors amortized<br />
over a 5 year period), since only valve and hatch sensors would be needed (i.e., fuel level and vehicle<br />
weight sensors would not be a requisite for the system). Additionally, there are variants <strong>of</strong> this reduced<br />
technology scheme (e.g, hatch, valve and vehicle weight; hatch, valve and fuel level).<br />
127
9.1 RECOMMENDATIONS FOR PHASE II<br />
9.1.1 Approach and Methodology<br />
9. FUTURE DIRECTIONS<br />
Real-world testing is needed <strong>to</strong> fully exercise the evidential reasoning algorithm and <strong>to</strong> validate the FTE<br />
concept. Clearly future test efforts must include real-world testing. However, in future phases <strong>of</strong> testing,<br />
the lessons learned from the POC cannot be ignored. Any future system will need <strong>to</strong> be qualified on the<br />
test vehicle(s) and at a test track before being placed in real-world testing.<br />
9.1.2 <strong>Fuel</strong> Marker<br />
Any further work in this area will benefit significantly in both a regula<strong>to</strong>ry and environmental sense from<br />
an engine testing campaign <strong>of</strong> marked diesel fuel emissions and performance in the diesel engine test cells<br />
<strong>of</strong> the <strong>Fuel</strong>s, Engines, and Emissions Research Center at ORNL. This would serve as a necessary<br />
validation <strong>of</strong> literature and mathematical calculation-based affirmations that the addition <strong>of</strong> SiNaph <strong>to</strong><br />
diesel fuel does not compromise engine performance or create problematic emissions or deposits.<br />
Going forward, the greatest challenge and opportunity associated with the fuel marker portion <strong>of</strong> the<br />
project is cost <strong>of</strong> the marker itself. Several approaches can reduce the cost <strong>of</strong> a chemical, and the most<br />
obvious, bulk pricing, was utilized <strong>to</strong> a certain extent in the POC phase <strong>of</strong> this work. By negotiating with<br />
the vendor (Sigma Aldrich, St. Louis, Missouri), the fuel marker team was able <strong>to</strong> reduce the cost <strong>of</strong> the<br />
SiNaph procured for testing by fivefold. However, deeper savings would be realized with the<br />
development <strong>of</strong> a streamlined synthesis and purification strategy that removes large commercial interests<br />
from the equation. SiNaph was pioneered as a complex molecule for pho<strong>to</strong>dynamic therapy in humans, so<br />
the development costs and licensing fee <strong>to</strong> Sigma were commensurate with a pharmaceutical, despite its<br />
being sold as a research chemical. The greatest potential area for cost savings in the synthetic route <strong>to</strong><br />
SiNaph area likely lies in the man-hours required <strong>to</strong> properly purify the synthetic product, removing<br />
unattached cyanine compounds and silicon centers that are not fully complexed. A specialty synthesis<br />
route could be developed and handed over <strong>to</strong> a smaller chemical company more suited <strong>to</strong> the particularity<br />
<strong>of</strong> supplying low (compared <strong>to</strong> the bulk Sigma deals) and mid-range advanced synthetic chemical<br />
processing. This effort would be a collaboration between ORNL that would later be taken up by an<br />
outside entity.<br />
To lay the groundwork for this prospective specialty chemistry research, contact was made and<br />
preliminary costing and feasibility questions were asked <strong>of</strong> a specialty chemicals company (Fig. 113)<br />
about establishing a specific SiNaph fuel marker dye bulk synthesis and purification operation. This route<br />
would only be cost-saving and applicable <strong>to</strong> a marking campaign <strong>of</strong> hundreds <strong>of</strong> thousands <strong>of</strong> gallons <strong>of</strong><br />
diesel were <strong>to</strong> be marked.<br />
A final cost analysis would not be possible until the sensor system’s linear dynamic range had been<br />
decided upon and a more realistic estimate <strong>of</strong> cost added per gallon <strong>of</strong> fuel by the various markers<br />
(SiNaph and sister compounds, whether commercially available or newly synthesized) could be made<br />
based on more advanced instruments’ actual calibrations and limit <strong>of</strong> quantitation data. In the meantime,<br />
some examination was made <strong>of</strong> potential extensions <strong>of</strong> the use <strong>of</strong> the SiNaph dye in more covert scenarios<br />
that still may relate <strong>to</strong> FTE, either with or without on-vehicle, real-time moni<strong>to</strong>ring. The passive<br />
observation <strong>of</strong> SiNaph with light farther in<strong>to</strong> the infrared region would exploit the longer wavelength<br />
excitation <strong>of</strong> the marker in order <strong>to</strong> achieve minimal interference by fuel handlers. Minimal handler<br />
129
Fig. 113. NovaChem capabilities for bulk manufacturing.<br />
interference could facilitate maximized intelligence collection or enforcement because the subjects would<br />
be unaware their activities were being moni<strong>to</strong>red. For instance, such minimally detectable observation<br />
approaches would lead <strong>to</strong> roadside sampling and/or inspection for tax status moni<strong>to</strong>ring that connects a<br />
fuel sample <strong>to</strong> its sourcing locations by use <strong>of</strong> a specific dye undetectable with the unaided eye introduced<br />
in a meaningful fueling location. This utilization <strong>of</strong> the fuel marker could serve as a secondary check <strong>of</strong><br />
either dilution or illegal sourcing after an interdiction has been made, although the sensitivity <strong>of</strong> the lawenforcement-borne<br />
visual detection system would fall well below what the on-board sensor could detect.<br />
9.1.3 Sensors<br />
NovaChem:<br />
CONTRACT MANUFACTURING<br />
SPECIALTY CHEMICAL MANUFACTURING<br />
Nova <strong>of</strong>fers chemical organic synthetic manufacturing services on a <strong>to</strong>ll or contract<br />
basis. Our core expertise is in handling large volumes <strong>of</strong> flammable and corrosive<br />
liquids and is reflected in our facilities and experience. We have significant expertise in<br />
controlling exothermic processes and in conducting reactions at sub-zero temperatures.<br />
Reaction Vessels<br />
Glass-lined and or stainless-jacketed stirred reac<strong>to</strong>rs, capacities from 500 gal <strong>to</strong><br />
4000 gal. Reac<strong>to</strong>rs can be heated up <strong>to</strong> 400ºC or down <strong>to</strong> -15ºC. Our flexible and<br />
multipurposed equipment is designed for rapid deployment.<br />
Solvent Distillation<br />
Distillation columns available are both packed or tray configuration. Can be operated in<br />
full or partial reflux mode.<br />
Blending Service<br />
Nova <strong>of</strong>fers cus<strong>to</strong>m liquid blending and formulation services.<br />
Drumming Service<br />
We <strong>of</strong>fer a bulk solvent drumming and repackaging service. Bulk liquid can be<br />
delivered by rail or road tankers <strong>to</strong> our facility for s<strong>to</strong>rage in our bulk tanks or<br />
packaging in<strong>to</strong> drum or smaller quantities.<br />
Warehousing<br />
Approximately 50,000 sq ft covered warehouse space is available for s<strong>to</strong>rage <strong>of</strong><br />
flammable or hazardous materials.<br />
Environmental Compliance<br />
Our facility’s air emission system is designed <strong>to</strong> contain VOCs and acids. Our<br />
wastewater system is governed by a NPDES permit for specialty organic chemical<br />
manufacturing. In most instances contract work can be undertaken without major<br />
permit modification.<br />
Several improvements <strong>to</strong> the hatch, valve, and level sensors could be envisioned in a Phase II effort. For<br />
the valve sensor, one <strong>of</strong> the following options may prove viable. First, it may prove viable <strong>to</strong> use the<br />
valve mounting holes <strong>to</strong> design a sensor that detects the removal <strong>of</strong> a valve dust cover as opposed <strong>to</strong><br />
handle actuation (Fig. 114).<br />
130
Fig. 114. Valve with dust cover sensing apparatus.<br />
Another option might be <strong>to</strong> replace the valve handle sensor with an emergency valve opening sensor.<br />
Such a sensor would tie in<strong>to</strong> the electronics controlling the emergency valve. Alternatively, it may prove<br />
acceptable <strong>to</strong> instrument the “safety bar” across all four valves in Fig. 46 so all valves are moni<strong>to</strong>red with<br />
one sensor. In the next phase, options should be explored for COTS sensors that are less expensive than<br />
those used in the POC while meeting safety requirements.<br />
Similarly, alternatives for hatch sensing should also be explored. One possibility is <strong>to</strong> put in a “bar”<br />
across all four hatches that will only require one sensor <strong>to</strong> detect motion. This would also reduce the<br />
potential <strong>of</strong> removing an entire hatch <strong>to</strong> defeat the sensor; the hatch assembly itself is attached like a drum<br />
lid and can be removed in whole. Another possibility would be <strong>to</strong> use a pho<strong>to</strong>cell inside compartment<br />
instead <strong>of</strong> a proximity switch <strong>to</strong> determine if the compartment hatch is open.<br />
While several alternative technologies which may prove feasible for level sensing may exist, some<br />
modification will likely be required for this application. Possibilities include going <strong>to</strong> a Petrotape-style<br />
level measurement combined with a tilt sensor or using a submersible differential pressure-based level<br />
sensor that comes down through hatch. A thorough investigation <strong>of</strong> the maximum resolution limits for<br />
pressure-based sensors (or whatever sensor will be used for level detection), in conjunction with the data<br />
bus signal resolution.<br />
One area in which future work should focus is in determining better sensors and/or mounting solution for<br />
switches, preferably coordinating with a manufacturer <strong>of</strong> tanker components <strong>to</strong> explore the possibility <strong>of</strong><br />
getting switches built in<strong>to</strong> the valve and hatch components. In addition, one limitation <strong>of</strong> this research<br />
was that the sensors gave one <strong>of</strong> only two status indica<strong>to</strong>rs: open or shut, with no “error” or<br />
“disconnected” indication. Thus, when problems were experienced, it was difficult <strong>to</strong> determine whether<br />
the issue was with a mounting solution, part failure, cable, PLC, etc. Such an error indica<strong>to</strong>r may also<br />
improve the ability <strong>of</strong> the evidential reasoning system <strong>to</strong> place confidence in the readings.<br />
131
An additional area <strong>of</strong> sensor selection/development needed in future work is in regard <strong>to</strong> the level sensor;<br />
a reliable in-tank system should be identified or developed that can provide values at all times (whether<br />
the valve is open or closed) and provides readings in volume rather than simply pressure. It is anticipated<br />
that this will require some initial sensor calibration based on the compartment geometry, but this should<br />
be transparent <strong>to</strong> the in-cab equipment as it reads signals from the data bus.<br />
The main development effort needed with the <strong>Fuel</strong> Marker sensor involves ruggedizing the sensor such<br />
that it could survive a series <strong>of</strong> rigorous environmental tests. Moving <strong>to</strong> a cast aluminum housing, as<br />
opposed <strong>to</strong> the plastic housing used in the POC test, is clearly a needed improvement that would not only<br />
waterpro<strong>of</strong> the sensor but would also eliminate unwanted RF interference.<br />
Furthermore, <strong>to</strong> better integrate the fuel marker sensor in<strong>to</strong> the operation <strong>of</strong> the tanker vehicle, a mounting<br />
location on the truck that gives more continuous access <strong>to</strong> the s<strong>to</strong>red fuel is desired. For example, if the<br />
fuel marker sensor could be integrated in<strong>to</strong> the vehicle’s tank, then it would be possible <strong>to</strong> moni<strong>to</strong>r the<br />
fuel marker concentration at all times (not just when the valve was open and fuel was flowing). In<br />
addition, locating the sensor in the tank would eliminate possibility that the marker sensor—which was<br />
located at the sight glass for the field test—would interfere with the normal operation <strong>of</strong> the fuel tanker<br />
vehicle.<br />
For Phase II <strong>of</strong> this project, the pro<strong>to</strong>type sensor must be certified <strong>to</strong> permit installation and operation on a<br />
tanker vehicle not being operated on a controlled test track. This means certifying that the sensor is<br />
explosion pro<strong>of</strong> and that it meets other regula<strong>to</strong>ry requirements for operation on a fuel tanker vehicle; this<br />
will not only require a certified sensor but an approved or certified location and mounting method.<br />
Achieving this level <strong>of</strong> sensor maturity would likely require a commercial partner familiar with this<br />
process and willing <strong>to</strong> perform the necessary testing and design improvements required.<br />
9.1.4 Communications<br />
In the interest <strong>of</strong> moving <strong>to</strong>ward standardization, the sensor interfaces may need <strong>to</strong> be reexamined. The<br />
inputs <strong>to</strong> the T2TCU in this phase <strong>of</strong> testing involved digital, analog, and RS485 interfaces with a set<br />
number <strong>of</strong> hard-wired inputs. The T2TCU should ultimately be designed <strong>to</strong> handle multiple<br />
compartments, and it may be that interfaces with the flexibility <strong>to</strong> handle multiple sensors (such as the<br />
RS485 marker interface) would be most appropriate for the final design.<br />
The location <strong>of</strong> messages on the J1939 data bus is governed by Society <strong>of</strong> Au<strong>to</strong>mobile Engineers<br />
standards. Because this was a POC test and no standard message is currently defined for the signals<br />
needed for fuel payload moni<strong>to</strong>ring, the Proprietary A message format was used. While this format was<br />
suitable for this preliminary testing, a fuel-tax-related message(s) must be standardized in order for this<br />
information <strong>to</strong> be readable by other moni<strong>to</strong>ring devices. This will require decisions <strong>to</strong> be made as <strong>to</strong> the<br />
exact signals which may be present and the units and resolution for those signals while maintaining<br />
consistency with existing sensors and standards. The prescribed transmission rate must also be<br />
determined, taking in<strong>to</strong> consideration the capacity <strong>of</strong> power line communications and the vehicle’s J1939<br />
data bus, as well as the required transmission rate <strong>to</strong> support the detection <strong>of</strong> various FTE scenarios. In<br />
addition, the message(s) must support a variable number <strong>of</strong> compartments while maintaining clarity as <strong>to</strong><br />
which compartment(s) the posted readings are from. This effort will require cooperation between the<br />
standards committee(s), industry, and developers <strong>of</strong> the evidential reasoning system.<br />
A next step in both the communications and evidential reasoning areas is the integration <strong>of</strong> a portion <strong>of</strong><br />
the intelligence system in<strong>to</strong> existing on-board telematics devices. Such devices handle vehicle-<strong>to</strong>-back<strong>of</strong>fice<br />
communications throughout the day <strong>to</strong> maintain up-<strong>to</strong>-date log information in a central back <strong>of</strong>fice<br />
132
and provide real-time alerts. The inclusion <strong>of</strong> much <strong>of</strong> this intelligence on board the vehicle would<br />
minimize the vehicle-<strong>to</strong>-BOS communication <strong>of</strong> FTE data <strong>to</strong> be mostly exception or alerts based.<br />
A truck-<strong>to</strong>-BOS communications methodology that does not require constant communication with the<br />
BOS should be tested. This could involve backup satellite communications, moni<strong>to</strong>ring <strong>of</strong> cell signal<br />
strength (with a notification message <strong>to</strong> the BOS as signal begins <strong>to</strong> drop <strong>of</strong>f), and/or the resending <strong>of</strong><br />
information that was not successfully transmitted (upon recovery <strong>of</strong> communications).<br />
9.1.5 Evidential Reasoning<br />
There are developments that need <strong>to</strong> be made in the evidential reasoning area in the second phase <strong>of</strong> this<br />
program. One key component is the implementation <strong>of</strong> a web-based geospatial (i.e., GIS) display <strong>of</strong> the<br />
terminal, retail outlets, and highway routes. This system would be used <strong>to</strong> track and validate vehicle and<br />
fuel locations against information on the shipping document. The GPS tracking device currently used by<br />
the partnering fleets would be used for this project. Second, an interface should be developed between a<br />
communications center and the fleet partner’s shipping documentation system. Third, the evidential<br />
reasoning system should be designed based on the logic developed based on inputs from experts.<br />
Additionally, improvements are needed in methods used in the evaluation <strong>of</strong> marker concentration and<br />
fuel level changes. This effort would be closely linked with the improvement <strong>of</strong> the sensor suite.<br />
For example, an alternative method for calculating the changes such as that <strong>of</strong> the fuel level variation<br />
could be <strong>to</strong> estimate the measurements Xt at the beginning and at the end <strong>of</strong> intervals when the valve is<br />
open, as illustrated in Fig. 115. In this case, the changes in marker concentration and in the fuel level at<br />
each s<strong>to</strong>p are calculated in three steps.<br />
1. Calculate the median <strong>of</strong> two sample <strong>of</strong> data points within a small time period after the valve is<br />
open and right before the valve is closed.<br />
2. Calculate the absolute change for each s<strong>to</strong>p, ∆Xt = Xt2 - Xt1.<br />
3. Calculate the relative change by comparing the current change ∆Xt against the reference value<br />
∆X0, according <strong>to</strong> the following equations A and B.<br />
Fig. 115. Portion <strong>Fuel</strong> Level Pr<strong>of</strong>ile at S<strong>to</strong>p t.<br />
For a non-scheduled s<strong>to</strong>p, the observed change would be<br />
∆X = | ∆Xt |/∆X0<br />
133
For a scheduled s<strong>to</strong>p, the observed change would be<br />
∆X = |∆X0 + ∆Xt |/∆X0<br />
9.2 LONG-TERM EFFORTS AND APPLICATIONS<br />
In the recommended system architecture called out in Sect. 8.1, it is propose <strong>to</strong> deploy a system in which<br />
most <strong>of</strong> the data moni<strong>to</strong>ring and process is done on board the vehicle <strong>to</strong> reduce the data communications<br />
cost and reduce the complexity <strong>of</strong> the central system. This recommended architecture and the associated<br />
onboard electronics would need <strong>to</strong> be tested <strong>to</strong> determine if accurate and responsive exception-based<br />
alerts could be process as well as the validation <strong>of</strong> a localized geolocation system.<br />
There is a need for real-world testing <strong>to</strong> validate the concept, the hardware, and the FTE Upload Data<br />
Service s<strong>of</strong>tware, as well as the usage and acceptance <strong>to</strong> stakeholders. This need must be balanced relative<br />
<strong>to</strong> timing with the need <strong>to</strong> mature the hardware and s<strong>of</strong>tware <strong>to</strong> be able <strong>to</strong> effectively conduct real-world<br />
testing. With this said, an intermediate testing step may be required <strong>to</strong> validate hardware and s<strong>of</strong>tware<br />
maturity as well as trailer hardware and electronics mounting solutions before committing <strong>to</strong> the expense<br />
or real-world testing.<br />
A particularly important component <strong>to</strong> any future FTE research efforts is a cost-benefit analysis. In order<br />
for such any developed system <strong>to</strong> be feasible and accepted by industry and enforcement, there must be a<br />
financial case for such a system. As such, significant incentives will likely be needed for fleet<br />
participation.<br />
An additional area in which research will need <strong>to</strong> be performed along with maturation <strong>of</strong> hardware is use<br />
<strong>of</strong> the data. Part <strong>of</strong> a large-scale deployment such as might be conducted in a field operational test should<br />
include studying how enforcement might make use <strong>of</strong> the data. In addition, there may also be a military<br />
application for fuel transfer <strong>to</strong> be explored. The cost-benefit analysis may show certain applications <strong>to</strong> be<br />
more appropriate than others, and future research should focus on these applications.<br />
Lastly, there are hybrids <strong>of</strong> the proposed system that, while not providing the full complement <strong>of</strong><br />
information, could provide information useful in fuel thief detection and post-fuel-delivery audit. For<br />
example, a hybrid system without the fuel marker component would still register the fuel loading and<br />
unloading events location and time, as well as all the hatch opening events. The benefit <strong>of</strong> these hybrid<br />
systems is cost saving relative <strong>to</strong> vehicle-borne technology as well the cost <strong>to</strong> mark the fuel. The value <strong>of</strong><br />
these hybrid systems should be explored <strong>to</strong> determine if a less complex system is capable <strong>of</strong> providing<br />
similar value <strong>to</strong>wards the prevention and detection <strong>of</strong> FTE.<br />
134
10. REFERENCES<br />
1. Wiley Online Library, Kirk-Othmer Encyclopedia <strong>of</strong> Chemical Technology: Naphthenic Acids,<br />
doi: 10.1002/0471238961, published online December 4, 2000, pp. 1–10.<br />
2. W. Boyes, “First the application, then the product,” ControlGlobal.com [Online], February 1, 2007<br />
[cited: May 29, 2011] http://www.controlglobal.com/articles/2007/022.html.<br />
3. J. Hunter, Civacon Corporation, Kansas City, Missouri, private communication, 2011.<br />
4. “Liquid level moni<strong>to</strong>r uses guided-wave radar,” Bulk Transporter Magazine [Online], April 1, 2003<br />
[cited: November 10, 2010]. .http://bulktransporter.com/mag/transportation_liquid_level_moni<strong>to</strong>r/.<br />
5. ‘Petrotape Level Gauge for Petroleum Products,” JOWA USA, Little<strong>to</strong>n, Mass., November 2009.<br />
6. P. Valin, “Reasoning Frameworks for Fusion <strong>of</strong> Imaging and Non-imaging Sensor Information,” in<br />
Proceedings <strong>of</strong> the Workshop on Estimation, Tracking and Fusion: A Tribute <strong>to</strong> Yaakov Bar-Shalom,<br />
Naval Postgraduate School, Monterey, Calif., May 17, 2001, pp. 269–282.<br />
7. J-B. Yang and D-L. Xu, “On the Evidential Reasoning Algorithm for Multiple Attribute Decision<br />
Analysis under Uncertainty,” IEEE Transactions on Systems, Man, and Cybernetics—Part A: Systems<br />
and Humans, Vol. 32, No. 3, May 2002.<br />
8. Y. Tang and E. Al-shaeer, “Reasoning about Uncertainty for Overlay Fault Diagnosis <strong>Based</strong> on End-<br />
User Observations,” 2009, http://www.arc.uncc.edu/pubs/faultdiag-infocom09.pdf.<br />
9. U.S. Energy Information Administration, Annual Energy Review 2010, www.eia.gov/aer.<br />
135
APPENDIX A. FLUORESCENCE SPECTRA<br />
The following figures show fluorescence spectra collected for pump diesel containing the fielded fuel dye<br />
Solvent Red 26, Sudan Orange II, and Solvent Blue 59 <strong>to</strong> determine whether competing fluorescence in<br />
the wavelength region <strong>of</strong> excitation above 630 nm would pose any significant interference, and none was<br />
noted.<br />
A-1
APPENDIX B. FUEL MARKER SENSOR SCHEMATICS AND LAYOUT<br />
B-1
B-2
B-3
B-4
APPENDIX C. FUEL MARKER SENSOR MECHANICAL DRAWINGS<br />
Fig. C.1. Assembly <strong>of</strong> sensor components.<br />
Fig. C.2. Side view <strong>of</strong> critical dimensions.<br />
C-1
Fig. C.3. Top view <strong>of</strong> critical dimensions.<br />
Fig. C.4. Critical holes and edges on PCB board layout.<br />
C-2
Fig. C.5. Critical PCB component placement (front).<br />
Fig. C.6. Critical PCB component placement (back).<br />
C-3
APPENDIX D. FUEL MARKER SENSOR BILL OF MATERIALS<br />
D-1
APPENDIX E. FUEL MARKER SENSOR FIRMWARE SOURCECODE<br />
/*********************************************************************<br />
FTC_Main.c<br />
Duncan Earl, 2011<br />
This program is for the Rabbit Semiconduc<strong>to</strong>r RCM3400 series controllers And pro<strong>to</strong>type ORNL<br />
<strong>Fuel</strong> Marker Sensor Pro<strong>to</strong>type<br />
Description<br />
===========<br />
This program turns a red and blue LED on and <strong>of</strong>f while acquiring the signal from two filtered<br />
pho<strong>to</strong>detec<strong>to</strong>rs. The LEDs illuminate a sample under test and the fluorescence returns a signal in<br />
two distinct wavelength bands. The ratio <strong>of</strong> the filtered detec<strong>to</strong>r outputs is an indica<strong>to</strong>r <strong>of</strong> a marker<br />
concentration in the sample.<br />
The program communicates over an RS485 serial link <strong>to</strong> relay data and <strong>to</strong> receive instructions from<br />
a host computer.<br />
The programmed pins for all inputs and outputs are shown below:<br />
Blue LED = PA0<br />
Red LED = PA1<br />
----------------<br />
Blue Detec<strong>to</strong>r Input = LN0 (AI0)<br />
Red Detec<strong>to</strong>r Input = LN1 (AI1)<br />
----------------<br />
This program uses TxD (PC0), RxD (PC1) and PD4 for transmit enable.<br />
Version Notes:<br />
v0.01 - First implementation<br />
v0.02 - Added RS232 Communication Capabilities<br />
v0.03 - Converted <strong>to</strong> RS485 Communication Capabilities<br />
v0.04 - Converted <strong>to</strong> RS485 Hardware<br />
v0.05 - Corrected Rx/Tx issue on RS485<br />
*********************************************************************/<br />
#class au<strong>to</strong><br />
#use COM_Commands485.lib // This library contains the RS485 Comm Code<br />
// Define Constants<br />
#define NUMSAMPLES 50 //number <strong>of</strong> samples <strong>to</strong> average<br />
#define STARTCHAN 0<br />
#define ENDCHAN 1<br />
#define GAINSET GAIN_5 //other gain macros<br />
//GAIN_1<br />
//GAIN_2<br />
//GAIN_4<br />
//GAIN_5<br />
//GAIN_8<br />
E-1
GAIN_10<br />
//GAIN_16<br />
//GAIN_20<br />
#define DS1 6 //port D bit 6<br />
#define DS2 7 //port D bit 7<br />
#define ON 0 //state <strong>to</strong> turn on led<br />
#define OFF 1 //state <strong>to</strong> turn <strong>of</strong>f led<br />
#define CH_ESCAPE 27<br />
#define E_BAUDRATE 19200L<br />
// Setup Chip A/D Conversion Resolution<br />
#define ADC_RESOLUTION 12<br />
// RS485 communications<br />
#define ser485open serDopen<br />
#define ser485close serDclose<br />
#define ser485wrFlush serDwrFlush<br />
#define ser485rdFlush serDrdFlush<br />
#define ser485putc serDputc<br />
#define ser485getc serDgetc<br />
///////<br />
// change serial buffer name and size here<br />
// for example: DINBUFSIZE <strong>to</strong> CINBUFSIZE<br />
///////<br />
#define DINBUFSIZE 15<br />
#define DOUTBUFSIZE 15<br />
///////<br />
// change serial baud rate here<br />
///////<br />
#ifndef _485BAUD<br />
#define _485BAUD 19200<br />
#endif<br />
nodebug<br />
void ser485Tx( void )<br />
{<br />
BitWrPortI(PDDR, &PDDRShadow, 1, 4); // set port D bit 4 high<br />
}<br />
/*------------------------------------------------------------------<br />
Disables the RS485 transmitter.<br />
This puts the device in listen mode which allows <strong>to</strong> receive data<br />
from the RS485 interface.<br />
--------------------------------------------------------------------*/<br />
nodebug<br />
void ser485Rx( void )<br />
{<br />
BitWrPortI(PDDR, &PDDRShadow, 0, 4); // set port D bit 4 low<br />
}<br />
E-2
set the STDIO cursor location and display a string<br />
void DispStr(int x, int y, char *s)<br />
{<br />
x += 0x20;<br />
y += 0x20;<br />
printf ("\x1B=%c%c%s", x, y, s);<br />
}<br />
// read the A/D with using the low level driver<br />
//nodebug (unsigned int -> changed <strong>to</strong> float)<br />
double sample_ad(int channel, int num_samples)<br />
{<br />
au<strong>to</strong> unsigned long rawdata;<br />
au<strong>to</strong> unsigned int sample;<br />
au<strong>to</strong> unsigned int cmd;<br />
}<br />
//convert channel and gain <strong>to</strong> ADS7870 format<br />
// in a direct mode<br />
cmd = 0x80|(GAINSET*16+(channel|0x08));<br />
for (rawdata=0, sample=num_samples; sample>0; sample--)<br />
{<br />
// execute low level A/D driver<br />
rawdata += (long) anaInDriver(cmd, ADC_RESOLUTION);<br />
}<br />
return ((double) (rawdata/num_samples));<br />
//changed float <strong>to</strong> double, changed int <strong>to</strong> double<br />
double convert_volt(int channel, double value)<br />
{<br />
//changed au<strong>to</strong> float <strong>to</strong> double<br />
double voltage;<br />
// convert the averaged samples <strong>to</strong> a voltage<br />
voltage = (value -<br />
_adcCalibS[channel][GAINSET].<strong>of</strong>fset)*(_adcCalibS[channel][GAINSET].kconst);<br />
}<br />
return voltage;<br />
///////////////////////////////////////////////////////////<br />
// RED LED on pro<strong>to</strong>type is controlled by port A bit 1<br />
// turns on if state = 1<br />
// turns <strong>of</strong>f if state = 0<br />
///////////////////////////////////////////////////////////<br />
void RedLED(int state)<br />
{<br />
if (state == ON)<br />
{<br />
BitWrPortI(PADR, &PADRShadow, 1, 1); //reversed for use with laser<br />
E-3
}<br />
}<br />
else{<br />
}<br />
BitWrPortI(PADR, &PADRShadow, 0, 1); //reversed for use with laser<br />
///////////////////////////////////////////////////////////<br />
// Blue LED on pro<strong>to</strong>type is controlled by port A bit 0<br />
// turns on if state = 1<br />
// turns <strong>of</strong>f if state = 0<br />
///////////////////////////////////////////////////////////<br />
void BlueLED(int state)<br />
{<br />
if (state == ON)<br />
{<br />
BitWrPortI(PADR, &PADRShadow, 1, 0);<br />
}<br />
else{<br />
BitWrPortI(PADR, &PADRShadow, 0, 0);<br />
}<br />
}<br />
//////////////////////////////////////////////////////////<br />
// Waits for N milliseconds <strong>of</strong> delay<br />
//////////////////////////////////////////////////////////<br />
nodebug<br />
void msDelay(unsigned int delay)<br />
{<br />
au<strong>to</strong> unsigned long done_time;<br />
done_time = MS_TIMER + delay;<br />
while( (long) (MS_TIMER - done_time) < 0 );<br />
}<br />
///////////////////////////////////////////////////////////////////////////<br />
// Main routine controlling sensor operation<br />
///////////////////////////////////////////////////////////////////////////<br />
main ()<br />
{<br />
// Define Local Variables<br />
au<strong>to</strong> int channel;<br />
double avg_sample;<br />
au<strong>to</strong> char s[80];<br />
au<strong>to</strong> char display[80];<br />
double ad_inputs[ENDCHAN+1];<br />
double ad_background[ENDCHAN+1];<br />
double ratio;<br />
double threshhold;<br />
int alarm;<br />
int c;<br />
E-4
au<strong>to</strong> int nIn1;<br />
au<strong>to</strong> char cOut;<br />
//--Initialize RCM3400 Board<br />
brdInit();<br />
//Calls RCM34XX.LIB which has been cus<strong>to</strong>m<br />
//modified <strong>to</strong> properly configure and prepare<br />
E-5<br />
//output and input pins<br />
ser485Rx(); // Disable transmitter, put in<br />
receive mode<br />
ser485open(_485BAUD); //set baud rate first<br />
ser485wrFlush();<br />
ser485rdFlush();<br />
c = 0;<br />
//--Initialize A/D circuits and setup gain<br />
anaIn(0,SINGLE,GAINSET);<br />
anaIn(1,SINGLE,GAINSET);<br />
//--Display Data Header (FOR DEBUG PURPOSED ONLY)<br />
DispStr(1, 1, "\t\t>");<br />
DispStr(1, 3, "\t BKG0\t AIN0\t BKG1\t AIN1\t BLUE\t RED\t Ratio");<br />
DispStr(1, 4, "\t------\t------\t------\t------\t------\t------\t------");<br />
//---------------------------------------<br />
//-- Begin Main Loop for Operating Sensor<br />
//---------------------------------------<br />
while(1)<br />
{<br />
//--Parallel State <strong>to</strong> Handle Incoming RS485 Commands<br />
costate<br />
{<br />
wfd RecCmd(); //Check for incoming RS485 data<br />
}<br />
costate<br />
{<br />
//--Begin Measurement Acquisition<br />
//--Step 1: Acquire Background Levels<br />
BlueLED(OFF); //Turn Off Blue LED<br />
RedLED(OFF); //Turn Off Red LED<br />
waitfor( DelayMs( 100 ) ); //Wait 100 milliseconds <strong>to</strong> allow LEDs <strong>to</strong> adjust<br />
for(channel = STARTCHAN; channel
ackground<br />
avg_sample = sample_ad(channel, NUMSAMPLES);<br />
//Acquire Average Signal<br />
ad_background[channel] = convert_volt(channel, avg_sample); //S<strong>to</strong>re as<br />
}<br />
//--Step 2: Acquire Blue Fluorescence Levels<br />
BlueLED(ON); //Turn On Blue LED<br />
RedLED(OFF); //Turn Off Red LED (Should already be <strong>of</strong>f)<br />
waitfor( DelayMs( 100 ) ); //Wait 100 milliseconds <strong>to</strong> allow LEDs <strong>to</strong> adjust<br />
channel = 0;<br />
avg_sample = sample_ad(channel, NUMSAMPLES); //Acquire average blue detec<strong>to</strong>r voltage<br />
ad_inputs[channel] = convert_volt(channel, avg_sample); //S<strong>to</strong>re signal<br />
BlueLED(OFF); //Turn <strong>of</strong>f Blue LED<br />
RedLED(OFF); //Turn <strong>of</strong>f Red LED<br />
waitfor( DelayMs( 100 ) ); //Wait 100 milliseconds <strong>to</strong> allow LEDs <strong>to</strong> adjust<br />
//--Step 3: Acquire Red Fluorescence Levels<br />
BlueLED(OFF); //Turn <strong>of</strong>f Blue LED<br />
RedLED(ON); //Turn on Red LED<br />
waitfor( DelayMs( 100 ) ); //Wait 100 milliseconds <strong>to</strong> allow LEDs <strong>to</strong> adjust<br />
channel = 1;<br />
avg_sample = sample_ad(channel, NUMSAMPLES);<br />
//Acquire average red detec<strong>to</strong>r voltage<br />
ad_inputs[channel] = convert_volt(channel, avg_sample); //S<strong>to</strong>re signal<br />
//--Step 4: Turn Off LEDs and Compute Results<br />
BlueLED(OFF); //Turn <strong>of</strong>f Blue LED<br />
RedLED(OFF); //Turn <strong>of</strong>f Red LED<br />
if ((ad_inputs[0]-ad_background[0])!=0){<br />
ratio = (ad_inputs[1]-ad_background[1])/(ad_inputs[0]-ad_background[0])/1; //2.523625;<br />
///1.553;<br />
}<br />
else<br />
{<br />
ratio = 0.0;<br />
}<br />
//--Step 5: S<strong>to</strong>re Results<br />
wfd S<strong>to</strong>reVariables(ad_inputs[0]-ad_background[0], ad_inputs[1]-ad_background[1],ratio, 0);<br />
//--Step 6: Display Results (FOR DEBUG PURPOSES ONLY)<br />
display[0] = '\0';<br />
channel = 0;<br />
sprintf(s, "\t%6.3f", ad_background[channel]);<br />
strcat(display, s);<br />
E-6
channel = 0;<br />
sprintf(s, "\t%6.3f", ad_inputs[channel]);<br />
strcat(display, s);<br />
channel = 1;<br />
sprintf(s, "\t%6.3f", ad_background[channel]);<br />
strcat(display, s);<br />
channel = 1;<br />
sprintf(s, "\t%6.3f", ad_inputs[channel]);<br />
strcat(display, s);<br />
channel = 0;<br />
sprintf(s, "\t%6.4f", ad_inputs[channel]-ad_background[channel]);<br />
strcat(display, s);<br />
channel = 1;<br />
sprintf(s, "\t%6.4f", ad_inputs[channel]-ad_background[channel]);<br />
strcat(display, s);<br />
sprintf(s, "\t%6.3f", ratio);<br />
strcat(display, s);<br />
DispStr(1, 5, display);<br />
} //End <strong>of</strong> Main Costate<br />
} //End <strong>of</strong> While Loop<br />
}<br />
serEclose(); //Close COM Port<br />
E-7
*********************************************************************<br />
COM_Commands485.LIB<br />
Duncan Earl, 2011<br />
/*** BeginHeader */<br />
// Include support libraries<br />
#use sscanf.lib<br />
// Define parameters<br />
#define SW_Ver "0.05 " // S<strong>of</strong>tware Version Number<br />
#define COMPARTMENT "1" //Unique identifier that specifies the<br />
// location <strong>of</strong> the sensor on a vehicle<br />
// 1 - Compartment 1 (closest <strong>to</strong> cab)<br />
// 2 - Compartment 2<br />
// 3 - Compartment 3<br />
// 4 - Compartment 4<br />
// 5 - Compartment 5<br />
#define INSTALLED 0 // Tells whether unit has been //configured yet by an<br />
installer.<br />
#define EINBUFSIZE 63 // Serial port E Input Buffer Size<br />
#define EOUTBUFSIZE 63 // Serial Port E Output Buffer Size<br />
#define MAXIN 60 // Maximum input string length<br />
#define TIMEOUT 3000UL // Maximum Timeout for read string<br />
// Processor Specific Definitions<br />
#define TicksPerSecond 244.140625<br />
#define TickDuration 0.004096 // seconds<br />
#define UpdateInterval 1220 // approx. every 5 seconds<br />
#define TicksPerDay 21093750L // processor rti's per ut day<br />
#define TicksPerSiderealDay 21036156L // processor rti's per sidereal day<br />
#define true 0xff<br />
#define false 0x00<br />
// Constants<br />
#define Pi 3.141592654<br />
#define TwoPi 6.283185308<br />
#define PiDiv2 1.570796327<br />
#define tZoneDef 0 // Default time<br />
zone (non DST)<br />
#define delDays 7305.5 // Number <strong>of</strong> days 1/1/80-1/1/2000<br />
#define fac<strong>to</strong>r 206264.8062 // 60*60*180/Pi<br />
#define SmallNum 0.000001 // Use <strong>to</strong> check real<br />
numbers close <strong>to</strong> 0<br />
// Define Variables<br />
//----- Variables Related <strong>to</strong> Timing<br />
unsigned long ulTime; // Time variable (seconds)<br />
struct tm CurTime; // Time variable structure<br />
int getOk; // Status variable for serial input<br />
int status; // Status variable<br />
long CpuTime; // 32 bit time expressed in interrupt ticks<br />
E-8
yte Day; // Curent Day<br />
byte Month; // Current Month<br />
int Year; // Current Year<br />
short Hour; // Curent Hour<br />
short Minute; // Current Minute<br />
short Second; // Current Second<br />
//------ Variables Related <strong>to</strong> String Parsing<br />
char instr[MAXIN+1]; // Input string for RS-232 commands<br />
char out_str[32]; // Output string for RS-232 status<br />
char CmdType; // Command type<br />
char S<strong>to</strong>pFlag; // S<strong>to</strong>p Flag<br />
char QFlag; // Query Flag<br />
char OffSunFlag; // Off-Sun Request <strong>to</strong> Host Flag<br />
char S<strong>to</strong>wFlag; // S<strong>to</strong>w Request <strong>to</strong> Host Flag<br />
long qd_count[2];<br />
char qd_errorflags[2];<br />
char qd_isrflag;<br />
//------- Variables related <strong>to</strong> s<strong>to</strong>red parameters<br />
double local_reddet;<br />
double local_bluedet;<br />
double local_ratio;<br />
int local_alarm;<br />
double init_ratio;<br />
char id[33];<br />
word SerialNumber;<br />
/*** EndHeader */<br />
/*** Beginheader S<strong>to</strong>reVariables */<br />
c<strong>of</strong>unc S<strong>to</strong>reVariables(double sv1, double sv2, double sv3, int sv4);<br />
/*** endheader */<br />
/* START FUNCTION DESCRIPTION ********************************************<br />
S<strong>to</strong>reVariables <br />
SYNTAX: c<strong>of</strong>unc S<strong>to</strong>reVariables(int *ratio, int *alarm);<br />
DESCRIPTION: Receives key variables and s<strong>to</strong>res them.<br />
PARAMETER1: double reddet<br />
PARAMETER2: double bluedet<br />
PARAMETER3: double ratio<br />
PARAMETER1: int alarm<br />
RETURN VALUE: (none)<br />
END DESCRIPTION **********************************************************/<br />
c<strong>of</strong>unc S<strong>to</strong>reVariables(double sv1, double sv2, double sv3, int sv4) // Handle incoming commands<br />
from host<br />
E-9
{<br />
local_bluedet = sv1;<br />
local_reddet = sv2;<br />
local_ratio = sv3;<br />
local_alarm = sv4;<br />
} // End c<strong>of</strong>unction<br />
/*** Beginheader RetrieveVariables */<br />
c<strong>of</strong>unc double RetrieveVariables(void);<br />
/*** endheader */<br />
/* START FUNCTION DESCRIPTION ********************************************<br />
RetrieveVariables <br />
SYNTAX: c<strong>of</strong>unc RetieveVariables( void );<br />
DESCRIPTION: Sends key variables s<strong>to</strong>red in memory.<br />
PARAMETER1: none<br />
RETURN VALUE: double<br />
END DESCRIPTION **********************************************************/<br />
c<strong>of</strong>unc double RetrieveVariables(void) // Handle incoming commands from host<br />
{<br />
return(init_ratio);<br />
} // End c<strong>of</strong>unction<br />
/*** Beginheader RecCmd */<br />
c<strong>of</strong>unc RecCmd( void );<br />
/*** endheader */<br />
/* START FUNCTION DESCRIPTION ********************************************<br />
RecCmd <br />
SYNTAX: c<strong>of</strong>unc RecCmd( void );<br />
DESCRIPTION: Receives tracker commands from host.<br />
PARAMETER1: (none)<br />
RETURN VALUE: (none)<br />
END DESCRIPTION **********************************************************/<br />
c<strong>of</strong>unc RecCmd( void ) // Handle incoming commands from host<br />
{<br />
// yields until getting a null terminated string<br />
wfd getOk = c<strong>of</strong>_serDgets(instr, MAXIN, TIMEOUT);<br />
yield;<br />
E-10
if (!getOk) abort;<br />
yield;<br />
sprintf(&CmdType, "%s",&instr[0]);<br />
yield; // Only allow S<strong>to</strong>p and Pos Cmd while moving<br />
// Send string for parsing<br />
ProcessCommand(instr);<br />
} // End receive commands c<strong>of</strong>unction<br />
/*** BeginHeader msDelay2 */<br />
void msDelay2(unsigned int delay)<br />
{<br />
//////////////////////////////////////////////////////////<br />
// Waits for N milliseconds <strong>of</strong> delay<br />
//////////////////////////////////////////////////////////<br />
au<strong>to</strong> unsigned long done_time;<br />
done_time = MS_TIMER + delay;<br />
while( (long) (MS_TIMER - done_time) < 0 );<br />
}<br />
/*** EndHeader */<br />
/*** BeginHeader ConsoleHelp */<br />
void ConsoleHelp(void);<br />
/*** EndHeader */<br />
//Print help list showing commands<br />
void ConsoleHelp(void) {<br />
// Enable transmitter<br />
BitWrPortI(PDDR, &PDDRShadow, 1, 4); // set port D bit 4 high<br />
sprintf(out_str,"Commands-\r\n");<br />
serDputs(out_str);<br />
sprintf(out_str,"get [ratio|bluedet|reddet] -- print detec<strong>to</strong>r values\r\n");<br />
serDputs(out_str);<br />
sprintf(out_str,"get [date|ut|id|sernum|firmware] -- get setup info\r\n");<br />
serDputs(out_str);<br />
sprintf(out_str,"help -- Print this message\r\n");<br />
serDputs(out_str);<br />
sprintf(out_str,"set date -- set date value\r\n");<br />
serDputs(out_str);<br />
sprintf(out_str,"set ut -- set GMT time value\r\n");<br />
serDputs(out_str);<br />
sprintf(out_str,"set [sernum|id|adr] -- establish new configuration values\r\n");<br />
serDputs(out_str);<br />
// Disable transmitter<br />
msDelay2(500); //Wait 500 milliseconds <strong>to</strong> allow RS485 Signal <strong>to</strong> Complete<br />
BitWrPortI(PDDR, &PDDRShadow, 0, 4); // set port D bit 4 low<br />
}<br />
E-11
*** BeginHeader SetDate */<br />
void SetDate();<br />
/*** EndHeader */<br />
void SetDate ()<br />
{<br />
CurTime.tm_year = Year - 1900; // <strong>of</strong>fset from 1900<br />
CurTime.tm_mon = Month; // 1-12<br />
CurTime.tm_mday = Day; // 1..31<br />
//CurTime.tm_wday = 4; // 0..6<br />
CurTime.tm_hour = Hour; // 0..23<br />
CurTime.tm_min = Minute;<br />
CurTime.tm_sec = Second;<br />
tm_wr(&CurTime); // set clock<br />
mktm(&CurTime, read_rtc());<br />
}<br />
/*** BeginHeader scanreal */<br />
double scanreal(char *ln, int *len);<br />
/*** EndHeader */<br />
double scanreal( char *ln, int *len) {<br />
long l,f;<br />
double divisor;<br />
long fraction;<br />
char sign;<br />
char length;<br />
double d;<br />
char *decimal;<br />
length = 0;<br />
sscanf(ln,"%ld",&l);<br />
while (*ln=='-' || *ln=='+' || (*ln>='0' && *ln
}<br />
decimal=ln;<br />
while (*ln>='0' && *ln
while (*ln==' ') ln++;<br />
if (!strncmp(ln,"help",4) || *ln=='?') {<br />
ConsoleHelp();<br />
return;<br />
}<br />
if (!strncmp(ln,"get",3) && ln[3]==' ') {<br />
while (*ln>' ') ln++;<br />
while (*ln==' ') ln++;<br />
if (!strncmp(ln,"adr",3) && ln[3]
if (!strncmp(ln,"fault",5) && ln[5]
Enable transmitter<br />
BitWrPortI(PDDR, &PDDRShadow, 1, 4); // set port D bit 4 high<br />
serDputs(out_str); // Send Data<br />
// Disable transmitter<br />
msDelay2(50); //Wait 50 milliseconds <strong>to</strong> allow RS485 Signal <strong>to</strong> Complete<br />
BitWrPortI(PDDR, &PDDRShadow, 0, 4); // set port D bit 4 low<br />
return;<br />
}<br />
if (!strncmp(ln,"reddet",6) && ln[6]
UpdateFlashStatus();<br />
// sprintf(out_str,"OK\r\n");<br />
// serEputs(out_str);<br />
// return;<br />
//}<br />
if (!strncmp(ln,"date",4) && ln[4]==' ') {<br />
while (*ln>' ') ln++;<br />
while (*ln==' ') ln++;<br />
sscanf(ln,"%d/%d/%d",&Month,&Day,&Year);<br />
SetDate();<br />
sprintf(out_str,"OK\r\n");<br />
// Enable transmitter<br />
BitWrPortI(PDDR, &PDDRShadow, 1, 4); // set port D bit 4 high<br />
serDputs(out_str); // Send Data<br />
// Disable transmitter<br />
msDelay2(50); //Wait 50 milliseconds <strong>to</strong> allow RS485 Signal <strong>to</strong> Complete<br />
BitWrPortI(PDDR, &PDDRShadow, 0, 4); // set port D bit 4 low<br />
return;<br />
}<br />
if (!strncmp(ln,"id",2) && ln[2]==' ') {<br />
while (*ln>' ') ln++;<br />
while (*ln==' ') ln++;<br />
strcpy(id,ln);<br />
// //UpdateFlashStatus();<br />
sprintf(out_str,"OK\r\n");<br />
// Enable transmitter<br />
BitWrPortI(PDDR, &PDDRShadow, 1, 4); // set port D bit 4 high<br />
serDputs(out_str); // Send Data<br />
// Disable transmitter<br />
msDelay2(50); //Wait 50 milliseconds <strong>to</strong> allow RS485 Signal <strong>to</strong> Complete<br />
BitWrPortI(PDDR, &PDDRShadow, 0, 4); // set port D bit 4 low<br />
return;<br />
}<br />
if (!strncmp(ln,"sernum",6) && ln[6]==' ') {<br />
while (*ln>' ') ln++;<br />
while (*ln==' ') ln++;<br />
sscanf(ln,"%d",&SerialNumber);<br />
// //UpdateFlashStatus();<br />
sprintf(out_str,"OK\r\n");<br />
// Enable transmitter<br />
BitWrPortI(PDDR, &PDDRShadow, 1, 4); // set port D bit 4 high<br />
serDputs(out_str); // Send Data<br />
// Disable transmitter<br />
msDelay2(50); //Wait 50 milliseconds <strong>to</strong> allow RS485 Signal <strong>to</strong> Complete<br />
BitWrPortI(PDDR, &PDDRShadow, 0, 4); // set port D bit 4 low<br />
return;<br />
}<br />
if (!strncmp(ln,"ut",2) && ln[2]==' ') {<br />
while (*ln>' ') ln++;<br />
while (*ln==' ') ln++;<br />
sscanf(ln,"%d:%d:%d",&Hour,&Minute,&Second);<br />
E-17
}<br />
// //UpdateFlashStatus();<br />
SetDate();<br />
sprintf(out_str,"OK\r\n");<br />
// Enable transmitter<br />
BitWrPortI(PDDR, &PDDRShadow, 1, 4); // set port D bit 4 high<br />
serDputs(out_str); // Send Data<br />
// Disable transmitter<br />
msDelay2(50); //Wait 50 milliseconds <strong>to</strong> allow RS485 Signal <strong>to</strong> Complete<br />
BitWrPortI(PDDR, &PDDRShadow, 0, 4); // set port D bit 4 low<br />
return;<br />
}<br />
}<br />
E-18
INTRODUCTION<br />
APPENDIX F. FUEL MARKER SENSOR COMMAND SPECIFICATION<br />
Oak Ridge National Labora<strong>to</strong>ry<br />
<strong>Fuel</strong> Marker Sensor Command Specification<br />
Firmware Version 0.4<br />
01/21/2010<br />
Document Version 1.4<br />
This document describes the RS485 command set used with the ORNL <strong>Fuel</strong> Marker sensor. The<br />
communication pro<strong>to</strong>col is designed so that multiple sensors may be commanded and controlled by either<br />
a knowledgeable opera<strong>to</strong>r with an ASCII terminal device, or via simple control hardware that<br />
communicates using the pro<strong>to</strong>col described in this document.<br />
PHYSICAL LAYER<br />
All communications employ a 3-wire, half-duplex, RS485 physical connection. Communication on the<br />
RS485 is conducted using standard asynchronous start s<strong>to</strong>p pro<strong>to</strong>col at 19200 baud, using 1 s<strong>to</strong>p bit and<br />
no parity.<br />
COMMAND PROTOCOL<br />
The following sections outline the master command syntax and summarize the action <strong>of</strong> units <strong>to</strong> the<br />
commands. In general, all commands follow the same ASCII format shown below:<br />
$ + COMPARTMENT_IDENTIFIER + Command + Carriage Return (ASCII code 0x0D).<br />
There are five COMPARTMENT_IDENTIFIER that identify the position <strong>of</strong> a given sensor in a fuel<br />
compartment on a tanker vehicle. They include:<br />
COMPARTMENT_IDENTIFIER Sensor Position<br />
100 Compartment #1 (Nearest Tanker Cab)<br />
200 Compartment #2<br />
300 Compartment #3<br />
400 Compartment #4<br />
500 Compartment #5 (Furthest from Tanker Cab)<br />
An example <strong>of</strong> a command sent <strong>to</strong> a sensor attached <strong>to</strong> compartment #2 would be: $200help<br />
This format eliminates cross talk among the various sensors. Reply from the sensors will vary, but most<br />
will be composed <strong>of</strong> one or more lines <strong>of</strong> text terminated by a line feed and carriage return (ASCII 0x0A,<br />
0x0D).<br />
F-1
Point-<strong>to</strong>-Point Commands<br />
$get bluedet<br />
Reply:<br />
ddd.ddd<br />
Summary<br />
The connected unit returns a decimal value <strong>of</strong> the measured amount <strong>of</strong> blue fluorescent light<br />
measured with the sensor’s blue filtered detec<strong>to</strong>r.<br />
$get date<br />
Reply:<br />
mm/dd/yyyy<br />
Summary<br />
The connected unit shall return its current UT date.<br />
$help<br />
Reply:<br />
Text list<br />
Summary<br />
Shows help screen.<br />
$get id<br />
Reply:<br />
:-<br />
Summary<br />
Returns a string containing the units address serial number and identity string.<br />
$get ratio<br />
Reply:<br />
d.ddd<br />
Summary<br />
The connected unit returns a decimal value <strong>of</strong> the measured “ratio” between the amount <strong>of</strong><br />
fluorescing blue light versus red light measured with the sensor’s two filtered detec<strong>to</strong>rs.<br />
F-2
$get reddet<br />
Reply:<br />
Summary<br />
ddd.ddd<br />
The connected unit returns a decimal value <strong>of</strong> the measured amount <strong>of</strong> red fluorescent light measured<br />
with the sensor’s red filtered detec<strong>to</strong>r.<br />
$get sernum<br />
Reply:<br />
dddddd<br />
Summary<br />
The connected unit shall return its serial number.<br />
$get ut<br />
Reply:<br />
hh:mm:ss.sss<br />
Summary<br />
The connected unit shall return its current internal time.<br />
$set id ““<br />
Reply:<br />
OK<br />
Summary<br />
The connected unit will s<strong>to</strong>re the id string as its new name. This is the string it will use <strong>to</strong> reply <strong>to</strong><br />
connection requests and during roll calls. This string cannot exceed 32 characters.<br />
$set serialnum <br />
Reply:<br />
OK<br />
Summary<br />
The selected unit’s serial number shall be set <strong>to</strong> the supplied number. The number must be within the<br />
range 1…65535.<br />
F-3
SAMPLE CONFIGURATION SCRIPT<br />
Typical Script for Communicating with Single Sensor (for sensor on compartment 3)<br />
*Commands in Bold<br />
*Responses in Italics<br />
$300get sernum<br />
1001<br />
$300get id<br />
Sample Sensor ID<br />
$300get ratio<br />
1.123<br />
*Ratio value changes with increase or decrease in fuel marker concentrations<br />
F-4
APPENDIX G. CUSTOM SIGHT GLASS DRAWINGS<br />
G-1
Revision<br />
Number<br />
RTDBA POC Final Report Revision Log<br />
Description <strong>of</strong> Change Edi<strong>to</strong>r(s)<br />
Change Effective<br />
Date<br />
0 Initial outline MBL 05 May 2011<br />
1 Draft Chapter 1 SAM 18 May 2011<br />
2 Full report SAM 19 Aug 2011<br />
3<br />
Added recommended architecture and<br />
cost-effectiveness evaluation<br />
MBL 26 Sep 2011


