

Chapter 1 Petroleum - Oak Ridge National Laboratory
Chapter 1 Petroleum - Oak Ridge National Laboratory
Chapter 1 Petroleum - Oak Ridge National Laboratory

Create successful ePaper yourself
Turn your PDF publications into a flip-book with our unique Google optimized e-Paper software.
Source<br />
<strong>Chapter</strong> 1<br />
<strong>Petroleum</strong><br />
Summary Statistics from Tables/Figures in this <strong>Chapter</strong><br />
Table 1.3 World <strong>Petroleum</strong> Production, 2011 (million barrels per day) a 82.59<br />
U.S. Production (million barrels per day) 7.85<br />
U.S. Share 9.5%<br />
Table 1.4 World <strong>Petroleum</strong> Consumption, 2011 (million barrels per day) 87.28<br />
U.S. Consumption (million barrels per day) 18.84<br />
U.S. Share 21.6%<br />
Figure 1.5 Average Refinery Yield, 2011<br />
TRANSPORTATION ENERGY DATA BOOK: EDITION 31—2012<br />
OECD<br />
Europe<br />
North<br />
America<br />
Gasoline 19.3% 42.7%<br />
Diesel oil 39.8% 25.3%<br />
Residual fuel 13.0% 5.8%<br />
Kerosene 6.8% 7.3%<br />
Other<br />
Table 1.13 U.S. transportation petroleum use as a percent of U.S. petroleum<br />
production, 2011<br />
21.1% 18.9%<br />
160.8%<br />
Table 1.13 Net imports as a percentage of U.S. petroleum consumption, 2011 44.8%<br />
Table 1.14 Transportation share of U.S. petroleum consumption, 2011 69.4%<br />
Table 1.17 Highway share of transportation petroleum consumption, 2010 85.9%<br />
Table 1.17 Light vehicle share of transportation petroleum consumption, 2010 63.6%<br />
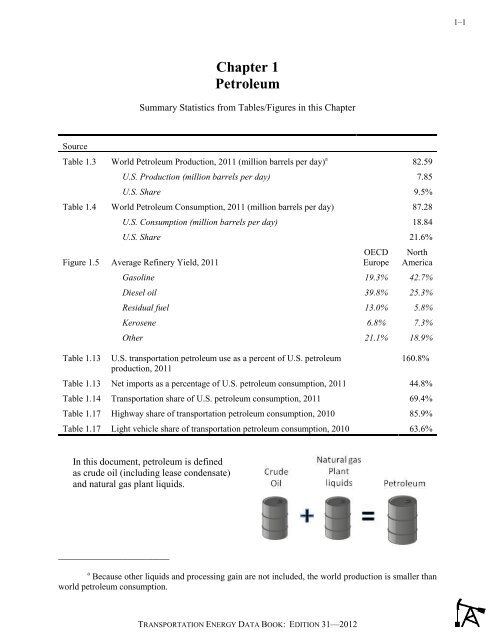
In this document, petroleum is defined<br />
as crude oil (including lease condensate)<br />
and natural gas plant liquids.<br />
_________________________<br />
a Because other liquids and processing gain are not included, the world production is smaller than<br />
world petroleum consumption.<br />
1–1
1–2<br />
Although the world has consumed about 40% of estimated conventional oil resources, the total fossil fuel<br />
potential is huge. Methane hydrates–a potential source of natural gas–are included in the “additional<br />
occurrences” of unconventional natural gas, and constitute the largest resource.<br />
Table 1.1<br />
World Fossil Fuel Potential<br />
(gigatonnes of carbon)<br />
Consumption<br />
Additional<br />
(1860-1998) Reserves Resources occurrences<br />
Oil<br />
Conventional 97 120 121 0<br />
Unconventional<br />
Natural Gas<br />
6 102 305 914<br />
Conventional 36 83 170 0<br />
Unconventional 1 144 364 14,176<br />
Coal 155 533 4,618<br />
a<br />
Source:<br />
Rogner, H.H., World Energy Assessment: Energy and the Challenge of Sustainability, Part II, <strong>Chapter</strong> 5,<br />
2000, p. 149.<br />
a Data are not available.<br />
TRANSPORTATION ENERGY DATA BOOK: EDITION 31—2012
In 2011, the Organization of <strong>Petroleum</strong> Exporting Countries (OPEC) accounted for more than 42% of world oil<br />
production. Responding to low oil prices in early 2000, Mexico, Norway, Russia, and Oman joined OPEC in<br />
cutting production. This group of oil countries, referred to here as OPEC+, account for over 63% of world oil<br />
production.<br />
Table 1.2<br />
World Crude Oil Production, 1960–2011 a<br />
(million barrels per day)<br />
United<br />
Total<br />
Year States U.S. share OPEC b<br />
OPEC<br />
share OPEC + c<br />
OPEC + c<br />
Total nonshare<br />
OPEC World<br />
1960 7.04 33.5% 8.70 41.4% 12.25 58.3% 12.29 20.99<br />
1965 7.80 25.7% 14.35 47.3% 19.83 65.4% 15.98 30.33<br />
1970 9.64 21.0% 23.30 50.8% 31.12 67.8% 22.59 45.89<br />
1975 8.38 15.9% 26.79 50.3% 37.55 71.1% 27.04 52.83<br />
1980 8.60 14.4% 26.38 44.3% 40.80 68.5% 34.18 59.56<br />
1985 8.97 16.6% 15.37 28.5% 30.98 57.4% 38.60 53.97<br />
1986 8.68 15.4% 18.28 32.5% 34.05 60.6% 37.95 56.23<br />
1987 8.35 14.7% 18.52 32.7% 34.72 61.3% 38.15 56.67<br />
1988 8.14 13.9% 20.32 34.6% 36.66 62.4% 38.42 58.74<br />
1989 7.61 12.7% 22.07 36.9% 38.50 64.3% 37.79 59.86<br />
1990 7.36 12.2% 22.49 37.2% 38.34 63.4% 38.00 60.50<br />
1991 7.42 12.3% 23.27 38.7% 38.53 64.1% 36.86 60.13<br />
1992 7.17 11.9% 24.40 40.6% 37.67 62.7% 35.70 60.10<br />
1993 6.85 11.4% 25.12 41.7% 37.65 62.6% 35.05 60.17<br />
1994 6.66 10.9% 25.51 41.7% 37.67 61.6% 35.66 61.17<br />
1995 6.56 10.5% 25.54 40.9% 37.77 60.5% 36.89 62.43<br />
1996 6.47 10.1% 26.02 40.8% 38.70 60.6% 37.80 63.82<br />
1997 6.45 9.8% 27.29 41.5% 40.28 61.2% 38.51 65.81<br />
1998 6.25 9.3% 28.37 42.3% 41.21 61.5% 38.67 67.03<br />
1999 5.88 8.9% 27.22 41.3% 40.14 60.9% 38.74 65.97<br />
2000 5.82 8.5% 28.94 42.2% 42.71 62.3% 39.58 68.52<br />
2001 5.80 8.5% 28.11 41.3% 42.39 62.2% 40.00 68.12<br />
2002 5.75 8.5% 26.44 39.3% 41.13 61.2% 40.83 67.12<br />
2003 5.68 8.2% 27.89 40.2% 43.34 62.4% 41.52 69.40<br />
2004 5.42 7.5% 30.31 41.8% 46.30 63.8% 42.13 72.45<br />
2005 5.18 7.0% 31.77 43.1% 47.70 64.5% 41.91 73.67<br />
2006 5.10 6.9% 31.48 42.9% 47.30 64.0% 41.90 73.38<br />
2007 5.06 6.7% 31.09 42.6% 46.65 64.5% 41.82 72.91<br />
2008 4.95 6.7% 32.36 44.0% 47.50 63.6% 41.23 73.59<br />
2009 5.36 7.4% 30.44 42.2% 45.46 62.9% 41.74 72.18<br />
2010 5.47 7.4% 31.44 42.5% 46.49 62.8% 42.45 73.89<br />
2011 5.67 7.7% 31.73 42.9% 46.73 63.2% 42.24 73.96<br />
1960–2011 -0.4%<br />
2.6%<br />
Average annual percentage change<br />
2.7%<br />
2.5% 2.5%<br />
1970–2011 -1.3%<br />
0.8%<br />
1.0%<br />
1.5% 1.2%<br />
2001–2011 -0.2% 1.2%<br />
1.0%<br />
0.5% 0.8%<br />
Source:<br />
U.S. Department of Energy, Energy Information Administration, International Energy Statistics Website, March<br />
2012. (Additional resources: www.eia.doe.gov)<br />
a Includes lease condensate. Excludes natural gas plant liquids.<br />
b See Glossary for membership.<br />
c OPEC+ includes all OPEC nations plus Russia, Mexico, Norway and Oman.<br />
TRANSPORTATION ENERGY DATA BOOK: EDITION 31—2012<br />
1–3
1–4<br />
This table shows petroleum production, which includes both crude oil and natural gas plant liquids. Because<br />
other liquids and processing gain are not included, the world total is smaller than world petroleum consumption<br />
(Table 1.4). The United States was responsible for 9.5% of the world’s petroleum production in 2011 and 7.7% of<br />
the world’s crude oil production (Table 1.2).<br />
Table 1.3<br />
World <strong>Petroleum</strong> Production, 1973–2011 a<br />
(million barrels per day)<br />
Total Non-<br />
United U.S. Total OPEC non- OPEC<br />
Year States share OPEC b share OPEC share World<br />
1973 10.95 18.7% 29.99 51.3% 28.48 48.7% 58.47<br />
1974 10.44 17.8% 29.67 50.7% 28.84 49.3% 58.51<br />
1975 10.01 18.0% 26.16 47.0% 28.48 51.2% 55.62<br />
1976 9.74 16.2% 29.55 49.1% 30.66 50.9% 60.21<br />
1977 9.86 15.7% 30.06 47.9% 32.64 52.1% 62.69<br />
1978 10.27 16.2% 28.70 45.4% 34.54 54.6% 63.24<br />
1979 10.14 15.4% 29.95 45.4% 36.01 54.6% 65.96<br />
1980 10.17 16.1% 26.05 41.3% 35.77 56.8% 63.00<br />
1981 10.18 17.1% 21.95 36.8% 37.73 63.2% 59.68<br />
1982 10.20 17.9% 18.54 32.5% 38.55 67.5% 57.09<br />
1983 10.25 18.0% 17.26 30.3% 39.64 69.7% 56.89<br />
1984 10.51 18.0% 17.29 29.6% 41.08 70.4% 58.37<br />
1985 10.58 18.3% 16.22 28.0% 40.88 70.6% 57.90<br />
1986 10.23 16.9% 18.40 30.4% 41.17 68.1% 60.49<br />
1987 9.94 16.3% 18.69 30.7% 41.46 68.0% 60.93<br />
1988 9.77 15.5% 20.79 32.9% 41.87 66.3% 63.20<br />
1989 9.16 14.2% 22.51 35.0% 41.18 64.0% 64.31<br />
1990 8.91 13.7% 23.70 36.4% 40.81 62.6% 65.14<br />
1991 9.08 14.0% 23.71 36.5% 40.53 62.4% 64.95<br />
1992 8.87 13.7% 25.03 38.5% 39.37 60.6% 64.95<br />
1993 8.58 13.2% 25.82 39.6% 38.82 59.5% 65.23<br />
1994 8.39 12.6% 26.54 39.9% 39.21 58.9% 66.55<br />
1995 8.32 12.2% 27.23 40.0% 40.21 59.1% 68.01<br />
1996 8.30 11.9% 27.71 39.9% 41.26 59.3% 69.52<br />
1997 8.27 11.5% 29.07 40.6% 42.05 58.7% 71.65<br />
1998 8.01 11.0% 30.21 41.4% 42.35 58.0% 73.04<br />
1999 7.73 10.7% 29.13 40.4% 43.01 59.6% 72.15<br />
2000 7.73 10.3% 30.94 41.3% 43.95 58.7% 74.90<br />
2001 7.67 10.3% 30.34 40.5% 44.47 59.5% 74.81<br />
2002 7.63 10.3% 28.77 38.8% 45.30 61.2% 74.07<br />
2003 7.40 9.7% 30.35 39.7% 46.11 60.3% 76.46<br />
2004 7.23 9.1% 32.92 41.3% 46.81 58.7% 79.73<br />
2005 6.90 8.5% 34.61 42.6% 46.61 57.4% 81.22<br />
2006 6.84 8.4% 34.40 42.4% 46.77 57.6% 81.17<br />
2007 6.85 8.5% 34.05 42.1% 46.75 57.9% 80.80<br />
2008 6.73 8.3% 35.34 43.4% 46.12 56.6% 81.46<br />
2009 7.27 9.1% 33.52 41.8% 46.75 58.2% 80.26<br />
2010 7.54 9.2% 34.72 42.2% 47.63 57.8% 82.35<br />
2011 7.85 9.5% 35.03 42.4% 47.56 57.6% 82.59<br />
Average annual percentage change<br />
1973–2011 -0.9%<br />
0.4%<br />
1.4%<br />
0.9%<br />
2001–2011 0.2% 1.4% 0.7% 1.0%<br />
Source:<br />
U.S. Department of Energy, Energy Information Administration, International Energy Statistics Website, March<br />
2012. (Additional resources: www.eia.doe.gov)<br />
a<br />
Includes natural gas plant liquids, crude oil and lease condensate. Does not account for all inputs or refinery<br />
processing gain.<br />
b<br />
Organization of <strong>Petroleum</strong> Exporting Countries. See Glossary for membership.<br />
TRANSPORTATION ENERGY DATA BOOK: EDITION 31—2012
During the 1980s and 1990s, the United States accounted for about one-quarter of the world’s petroleum<br />
consumption, but since 2000 that share has been decreasing. In 2011 the United States accounted for only 21.6%.<br />
World petroleum consumption decreased in 2009 but rose in 2010. Non-OECD consumption has continued to<br />
increase.<br />
Table 1.4<br />
World <strong>Petroleum</strong> Consumption, 1960–2011<br />
(million barrels per day)<br />
Year United States U.S. share Total OECD a Total non-OECD World<br />
1960 9.80 45.9% 15.78 5.56 21.34<br />
1965 11.51 37.0% 22.81 8.33 31.14<br />
1970 14.70 31.4% 34.69 12.12 46.81<br />
1975 16.32 29.0% 39.14 17.06 56.20<br />
1980 17.06 27.0% 41.87 21.25 63.12<br />
1981 16.06 26.3% 39.60 21.36 60.95<br />
1982 15.30 25.7% 37.87 21.68 59.55<br />
1983 15.23 25.9% 37.00 21.78 58.78<br />
1984 15.73 26.3% 37.77 22.04 59.81<br />
1985 15.73 26.2% 37.56 22.52 60.08<br />
1986 16.28 26.3% 38.68 23.12 61.80<br />
1987 16.67 26.4% 39.43 23.66 63.08<br />
1988 17.28 26.6% 40.75 24.21 64.96<br />
1989 17.33 26.2% 41.44 24.63 66.07<br />
1990 16.99 25.5% 41.59 24.94 66.52<br />
1991 16.71 24.9% 42.06 25.14 67.20<br />
1992 17.03 25.3% 43.02 24.37 67.39<br />
1993 17.24 25.5% 43.44 24.13 67.57<br />
1994 17.72 25.7% 44.64 24.25 68.89<br />
1995 17.72 25.3% 45.12 24.98 70.10<br />
1996 18.31 25.5% 46.25 25.44 71.69<br />
1997 18.62 25.4% 47.01 26.44 73.45<br />
1998 18.92 25.5% 47.21 26.90 74.10<br />
1999 19.52 25.7% 48.23 27.63 75.87<br />
2000 19.70 25.7% 48.21 28.58 76.78<br />
2001 19.65 25.4% 48.25 29.26 77.51<br />
2002 19.76 25.3% 48.22 29.94 78.16<br />
2003 20.03 25.1% 48.90 30.81 79.71<br />
2004 20.73 25.1% 49.75 32.80 82.56<br />
2005 20.80 24.7% 50.10 33.98 84.09<br />
2006 20.69 24.3% 49.82 35.35 85.13<br />
2007 20.68 24.1% 49.53 36.23 85.81<br />
2008 19.50 22.8% 47.92 37.51 85.44<br />
2009 18.77 22.2% 45.91 38.78 84.68<br />
2010 19.18 22.0% 46.40 40.74 87.14<br />
2011 18.84 21.6% 45.83 41.45 87.28<br />
1960–2011 1.3%<br />
Average annual percentage change<br />
2.1% 4.0% 2.8%<br />
1970–2011 0.6%<br />
0.7% 3.0% 1.5%<br />
2001–2011 -0.4%<br />
-0.5% 3.5% 1.2%<br />
Source:<br />
U.S. Department of Energy, Energy Information Administration, International Energy Statistics Website,<br />
May 2012. (Additional resources: www.eia.doe.gov)<br />
a Organization for Economic Cooperation and Development. See Glossary for membership.<br />
TRANSPORTATION ENERGY DATA BOOK: EDITION 31—2012<br />
1–5
1–6<br />
Figure 1.1. World Oil Reserves a , Production and Consumption, 2010<br />
Table 1.5<br />
World Oil Reserves, Production and Consumption, 2010<br />
Crude oil<br />
reserves a<br />
(billion<br />
<strong>Petroleum</strong><br />
production<br />
(million<br />
barrels per<br />
<strong>Petroleum</strong><br />
consumption<br />
(million<br />
barrels per<br />
Reserve<br />
Production<br />
barrels) share day) share day)<br />
United States 20.7 2% 8.6 11% 19.1 22%<br />
OPEC 951 71% 34.8 43% 9.5 11%<br />
Rest of world 370.1 28% 37.0 46% 58.5 67%<br />
TRANSPORTATION ENERGY DATA BOOK: EDITION 31—2012<br />
Consumption<br />
share<br />
Sources:<br />
Reserves – Energy Information Administration, International Energy Statistics, May 2012.<br />
Production – Energy Information Administration, International Energy Statistics, May 2012.<br />
Consumption – Energy Information Administration, International Energy Statistics, May 2012. (Additional<br />
resources: www.eia.doe.gov)<br />
Note: Total consumption is higher than total production due to refinery gains including alcohol and liquid products<br />
produced from coal and other sources. OPEC countries include Venezuela, Iran, Iraq, Kuwait, Qatar, Saudi Arabia,<br />
Angola, United Arab Emirates, Algeria, Libya, Nigeria, Indonesia, Gabon, and Ecuador.<br />
a Reserves are 2009 data.
Figure 1.2. World Natural Gas Reserves a , Production and Consumption, 2010<br />
Table 1.6<br />
World Natural Gas Reserves, Production and Consumption, 2010<br />
(trillion cubic feet)<br />
Natural<br />
gas Reserve Natural gas Production Natural gas Consumption<br />
reserves a share production share consumption share<br />
U.S. 272.5 4% 21.6 19% 24.1 21%<br />
OPEC 3,182.8 51% 20.0 18% 13.8 12%<br />
Rest of world 2,833.8 45% 70.5 63% 75.0 66%<br />
Source:<br />
Energy Information Administration, International Energy Statistics, 2012. (Additional resources: www.eia.doe.gov)<br />
Note: Production data are dry gas production.<br />
a Reserves are 2009 data.<br />
TRANSPORTATION ENERGY DATA BOOK: EDITION 31—2012<br />
1–7
1–8<br />
The share of petroleum imported to the United States can be calculated using total imports or net imports. Net<br />
imports, which are the preferred data, rose to over 50% of U.S. petroleum consumption for the first time in 1998,<br />
while total imports reached 50% for the first time in 1993. OPEC share of net imports has been below 50% since<br />
1993.<br />
Table 1.7<br />
U.S. <strong>Petroleum</strong> Imports, 1960–2011<br />
(million barrels per day)<br />
Net OPEC<br />
Year<br />
a<br />
Net OPEC<br />
imports<br />
a<br />
Net imports as a share<br />
share Net imports of U.S. consumption Total imports<br />
1960 1.31 81.3% 1.61<br />
b<br />
1.82<br />
1965 1.48 64.7% 2.28<br />
b<br />
2.47<br />
1970 1.34 42.5% 3.16<br />
b<br />
3.42<br />
1975 3.60 59.5% 5.89 35.8% 6.06<br />
1980 4.30 62.2% 6.36 37.3% 6.91<br />
1981 3.32 55.4% 5.40 33.6% 6.00<br />
1982 2.15 42.0% 4.30 28.1% 5.11<br />
1983 1.86 36.9% 4.31 28.2% 5.05<br />
1984 2.05 37.7% 4.72 29.9% 5.44<br />
1985 1.83 36.1% 4.29 27.3% 5.07<br />
1986 2.84 45.6% 5.44 33.4% 6.22<br />
1987 3.06 45.8% 5.91 35.4% 6.68<br />
1988 3.52 47.6% 6.59 38.0% 7.40<br />
1989 4.14 51.4% 7.20 41.3% 8.06<br />
1990 4.30 53.6% 7.16 42.2% 8.02<br />
1991 4.09 53.7% 6.63 38.9% 7.63<br />
1992 4.09 51.9% 6.94 40.9% 7.89<br />
1993 4.27 49.6% 7.62 44.9% 8.62<br />
1994 4.25 47.2% 8.05 45.7% 9.00<br />
1995 4.00 45.3% 7.89 44.5% 8.84<br />
1996 4.21 44.4% 8.50 46.4% 9.48<br />
1997 4.57 45.0% 9.16 49.2% 10.16<br />
1998 4.91 45.8% 9.76 51.6% 10.71<br />
1999 4.95 45.6% 9.91 50.8% 10.85<br />
2000 5.20 45.4% 10.42 52.9% 11.46<br />
2001 5.53 46.6% 10.90 55.5% 11.87<br />
2002 4.61 39.9% 10.55 53.4% 11.53<br />
2003 5.16 42.1% 11.24 56.1% 12.26<br />
2004 5.70 43.4% 12.10 58.4% 13.15<br />
2005 5.59 40.7% 12.55 60.3% 13.71<br />
2006 5.52 40.2% 12.39 59.9% 13.71<br />
2007 5.98 44.4% 12.04 58.2% 13.47<br />
2008 5.95 46.1% 11.11 57.0% 12.92<br />
2009 4.78 40.9% 9.67 51.5% 11.69<br />
2010 4.91 41.6% 9.44 49.2% 11.79<br />
2011 4.53 39.9% 8.44 44.8% 11.36<br />
1960–2011 2.5%<br />
Average annual percentage change<br />
3.3%<br />
3.7%<br />
1970–2011 3.0%<br />
2.4%<br />
3.0%<br />
2001–2011 -2.0% -2.5%<br />
-0.4%<br />
Source:<br />
U.S. Department of Energy, Energy Information Administration, Monthly Energy Review, Washington, DC, March<br />
2012, Table 3.3a. (Additional resources: www.eia.gov)<br />
a Organization of <strong>Petroleum</strong> Exporting Countries. See Glossary for membership.<br />
b Data are not available.<br />
TRANSPORTATION ENERGY DATA BOOK: EDITION 31—2012
Just over half of the oil imported to the United States in 2011 was from the western hemisphere. Canada, Mexico,<br />
and Venezuela provided most of the oil from the western hemisphere, along with small amounts from Brazil,<br />
Columbia, Ecuador, and the U.S. Virgin Islands (these countries are not listed separately.<br />
Table 1.8<br />
Imported Crude Oil by Country of Origin, 1973–2011<br />
(million barrels per day)<br />
Other<br />
OPEC a<br />
TRANSPORTATION ENERGY DATA BOOK: EDITION 31—2012<br />
Other<br />
non-<br />
OPEC<br />
Saudi<br />
Total<br />
Year Arabia Venezuela Nigeria countries Canada Mexico Russia countries imports<br />
1973 0.49 1.13 0.46 0.91 1.32 0.02 0.03 1.90 6.26<br />
1975 0.71 0.70 0.76 1.42 0.85 0.07 0.01 1.52 6.06<br />
1980 1.26 0.48 0.86 1.70 0.45 0.53 0.00 1.62 6.91<br />
1981 1.13 0.41 0.62 1.17 0.45 0.52 0.00 1.70 6.00<br />
1982 0.55 0.41 0.51 0.67 0.48 0.68 0.00 1.80 5.11<br />
1983 0.34 0.42 0.30 0.80 0.55 0.83 0.00 1.81 5.05<br />
1984 0.32 0.55 0.22 0.96 0.63 0.75 0.01 2.00 5.44<br />
1985 0.17 0.60 0.29 0.76 0.77 0.82 0.01 1.64 5.07<br />
1986 0.68 0.79 0.44 0.92 0.81 0.70 0.02 1.86 6.22<br />
1987 0.75 0.80 0.53 0.97 0.85 0.65 0.01 2.10 6.68<br />
1988 1.07 0.79 0.62 1.03 1.00 0.75 0.03 2.11 7.40<br />
1989 1.22 0.87 0.82 1.23 0.93 0.77 0.05 2.17 8.06<br />
1990 1.34 1.02 0.80 1.13 0.93 0.76 0.04 1.99 8.02<br />
1991 1.80 1.03 0.70 0.55 1.03 0.81 0.03 1.67 7.63<br />
1992 1.72 1.17 0.68 0.52 1.07 0.83 0.02 1.88 7.89<br />
1993 1.41 1.30 0.74 0.82 1.18 0.92 0.05 2.19 8.62<br />
1994 1.40 1.33 0.64 0.87 1.27 0.98 0.03 2.46 9.00<br />
1995 1.34 1.48 0.63 0.55 1.33 1.07 0.02 2.41 8.83<br />
1996 1.36 1.68 0.62 0.56 1.42 1.24 0.03 2.57 9.48<br />
1997 1.41 1.77 0.70 0.69 1.56 1.39 0.01 2.63 10.16<br />
1998 1.49 1.72 0.70 1.00 1.60 1.35 0.02 2.83 10.71<br />
1999 1.48 1.49 0.66 1.33 1.54 1.32 0.09 2.95 10.85<br />
2000 1.57 1.55 0.90 1.19 1.81 1.37 0.07 3.00 11.46<br />
2001 1.66 1.55 0.89 1.43 1.83 1.44 0.09 2.98 11.87<br />
2002 1.55 1.40 0.62 1.03 1.97 1.55 0.21 3.20 11.53<br />
2003 1.77 1.38 0.87 1.14 2.07 1.62 0.25 3.15 12.26<br />
2004 1.56 1.55 1.14 1.45 2.14 1.66 0.30 3.34 13.15<br />
2005 1.54 1.53 1.17 1.36 2.18 1.66 0.41 3.87 13.71<br />
2006 1.46 1.42 1.11 1.52 2.35 1.71 0.37 3.76 13.71<br />
2007 1.48 1.36 1.13 2.00 2.45 1.53 0.41 3.09 13.47<br />
2008 1.53 1.19 0.99 2.25 2.49 1.30 0.47 2.70 12.92<br />
2009 1.00 1.06 0.81 1.90 2.48 1.21 0.56 2.66 11.69<br />
2010 1.10 0.99 1.02 1.80 2.54 1.28 0.61 2.46 11.79<br />
2011 1.19 0.94 0.82 1.58 2.71 1.20 0.62 2.29 11.36<br />
Sources:<br />
U.S. Department of Energy, Energy Information Administration, Monthly Energy Review, Washington, DC, March<br />
2012, Tables 3.3c and 3.3d. (Additional resources: www.eia.gov)<br />
a Organization of <strong>Petroleum</strong> Exporting Countries. See Glossary for membership.<br />
1–9
1–10<br />
The Strategic <strong>Petroleum</strong> Reserve (SPR) began in October 1977 as a result of the 1975 Energy Policy and<br />
Conservation Act. Its purpose is to provide protection against oil supply disruptions. The U.S. consumed nearly<br />
20 million barrels per day in 2011. At that rate of consumption, the SPR supply would last 37 days if used<br />
exclusively and continuously.<br />
Strategic<br />
<strong>Petroleum</strong><br />
Reserve<br />
Table 1.9<br />
Crude Oil Supplies, 1973-2011<br />
Other<br />
crude oil<br />
stocks a<br />
Year (Million Barrels)<br />
Total<br />
crude oil stocks<br />
U.S. petroleum<br />
consumption<br />
(million barrels per day)<br />
TRANSPORTATION ENERGY DATA BOOK: EDITION 31—2012<br />
Number of days<br />
the SPR would<br />
supply the U.S. b<br />
1973 0.0 242.5 242.5 17.3 0<br />
1977 7.5 340.2 347.7 18.4 0<br />
1978 66.9 309.4 376.3 18.8 4<br />
1979 91.2 339.1 430.3 18.5 5<br />
1980 107.8 358.2 466.0 17.1 6<br />
1981 230.3 363.5 593.8 16.1 14<br />
1982 293.8 349.7 643.6 15.3 19<br />
1983 379.1 343.9 722.9 15.2 25<br />
1984 450.5 345.4 795.9 15.7 29<br />
1985 493.3 320.9 814.2 15.7 31<br />
1986 511.6 331.2 842.8 16.3 31<br />
1987 540.6 349.0 889.6 16.7 32<br />
1988 559.5 330.4 889.9 17.3 32<br />
1989 579.9 341.3 921.1 17.3 33<br />
1990 585.7 322.7 908.4 17.0 34<br />
1991 568.5 324.6 893.1 16.7 34<br />
1992 574.7 318.1 892.9 17.0 34<br />
1993 587.1 335.4 922.5 17.2 34<br />
1994 591.7 337.2 928.9 17.7 33<br />
1995 591.6 303.3 895.0 17.7 33<br />
1996 565.8 283.9 849.7 18.3 31<br />
1997 563.4 304.7 868.1 18.6 30<br />
1998 571.4 323.5 894.9 18.9 30<br />
1999 567.2 284.5 851.7 19.5 29<br />
2000 540.7 285.5 826.2 19.7 27<br />
2001 550.2 312.0 862.2 19.6 28<br />
2002 599.1 277.6 876.7 19.8 30<br />
2003 638.4 268.9 907.3 20.0 32<br />
2004 675.6 285.7 961.3 20.7 33<br />
2005 684.5 323.7 1,008.2 20.8 33<br />
2006 688.6 312.3 1,000.9 20.7 33<br />
2007 696.9 286.1 983.0 20.7 34<br />
2008 701.8 325.8 1,027.7 19.5 36<br />
2009 726.6 325.2 1,051.8 18.8 39<br />
2010 726.5 333.4 1,060.0 19.2 38<br />
2011 696.0 330.9 1,026.8 18.8 37<br />
Sources:<br />
U.S. Department of Energy, Energy Information Administration, Monthly Energy Review, Washington, DC, March<br />
2012, Tables 3.1 and 3.4. (Additional resources: www.eia.gov)<br />
a<br />
Other crude oil stocks include stocks held by petroleum companies, as well as stocks of Alaskan crude oil<br />
in transit.<br />
b<br />
Strategic <strong>Petroleum</strong> Reserves divided by U.S. consumption per day. This would only hold true if the SPR<br />
were the only oil used for that many days.
Major oil price shocks have disrupted world energy markets five times in the past 30 years (1973-74, 1979-80,<br />
1990-91, 1999-2000, 2008). Most of the oil price shocks were followed by an economic recession in the United<br />
States.<br />
Figure 1.3. Oil Price and Economic Growth, 1970–2011<br />
Source:<br />
Greene, D.L. and N. I. Tishchishyna, Costs of Oil Dependence: A 2000 Update, <strong>Oak</strong> <strong>Ridge</strong> <strong>National</strong> <strong>Laboratory</strong>,<br />
ORNL/TM-2000/152, <strong>Oak</strong> <strong>Ridge</strong>, TN, 2000, and data updates, 2011. (Additional resources:<br />
cta.ornl.gov/cta/publications.shtml)<br />
TRANSPORTATION ENERGY DATA BOOK: EDITION 31—2012<br />
1–11
1–12<br />
The United States has long recognized the problem of oil dependence and the economic problems that arise from it.<br />
According to <strong>Oak</strong> <strong>Ridge</strong> <strong>National</strong> <strong>Laboratory</strong> (ORNL) researchers Greene and Hopson, oil dependence is a<br />
combination of four factors: (1) a noncompetitive world oil market strongly influenced by the OPEC cartel, (2) high<br />
levels of U.S. imports, (3) the importance of oil to the U.S. economy, and (4) the lack of economical and readily<br />
available substitutes for oil. ORNL developed a model to estimate the historical cost of oil dependence and analyze<br />
the potential effectiveness of policies on likely future costs. The most recent study using this model shows that the<br />
U.S. economy suffered the greatest losses in 2008 when wealth transfer and GDP losses (combined) amounted to<br />
approximately half a trillion dollars. However, when comparing oil dependence to the size of the economy, the year<br />
1980 is the highest. Oil dependence costs were almost 4.5% of GDP in 1980, but were under 3.5% in 2008. In<br />
2009, the average oil price fell to about $60 per barrel and oil dependence costs fell to about $300 billion for 2009<br />
and 2010.<br />
Figure 1.4. Costs of Oil Dependence to the U.S. Economy, 1970–2010<br />
Source:<br />
Greene, David L., Roderick Lee, and Janet L. Hopson, “OPEC and the Costs to the U.S. Economy of Oil<br />
Dependence: 1970-2010,” <strong>Oak</strong> <strong>Ridge</strong> <strong>National</strong> <strong>Laboratory</strong> Memorandum, 2011.<br />
Notes:<br />
Wealth Transfer is the product of total U.S. oil imports and the difference between the actual market price of oil<br />
(influenced by market power) and what the price would have been in a competitive market.<br />
Dislocation Losses are temporary reductions in GDP as a result of oil price shocks.<br />
Loss of Potential Gross Domestic Product (GDP) results because a basic resource used by the economy to<br />
produce output has become more expensive. As a consequence, with the same endowment of labor, capital, and<br />
other resources, our economy cannot produce quite as much as it could have at a lower oil price.<br />
TRANSPORTATION ENERGY DATA BOOK: EDITION 31—2012
Other parts of the world refine crude oil to produce more diesel fuel and less gasoline than does North America.<br />
The OECD Europe countries produce the lowest share of gasoline in 2011.<br />
Figure 1.5. Refinery Gross Output by World Region, 2001 and 2011<br />
Source:<br />
International Energy Agency, Monthly Oil Survey, January 2012. (Additional resources: www.iea.org)<br />
a Includes jet kerosene and other kerosene.<br />
b Includes motor gasoline, jet gasoline, and aviation gasoline.<br />
c Organization for Economic Cooperation and Development. See Glossary for membership.<br />
TRANSPORTATION ENERGY DATA BOOK: EDITION 31—2012<br />
1–13
1–14<br />
Oxygenate refinery input increased significantly in 1995, most certainly due to the Clean Air Act Amendments of<br />
1990 which mandated the sale of reformulated gasoline in certain areas beginning in January 1995. The use of<br />
MTBE has declined in recent years due to many states banning the additive. The other hydrocarbons and liquids<br />
category includes unfinished oils, motor gasoline blending components and aviation gasoline blending<br />
components. In 2005 the gasoline blending components rose significantly.<br />
Table 1.10<br />
U.S. Refinery Input of Crude Oil and <strong>Petroleum</strong> Products, 1987–2010<br />
(thousand barrels)<br />
Oxygenates Other<br />
Natural gas Fuel<br />
Other hydrocarbons Total input to<br />
Year Crude oil liquids ethanol MTBE a oxygenates b and liquids refineries<br />
1987 4,691,783 280,889<br />
c<br />
c<br />
d<br />
132,720 5,105,392<br />
1988 4,848,175 304,566<br />
c<br />
c<br />
d<br />
105,645 5,258,386<br />
1989 4,891,381 182,109<br />
c<br />
c<br />
d<br />
223,797 5,297,287<br />
1990 4,894,379 170,589<br />
c<br />
c<br />
d<br />
260,108 5,325,076<br />
1991 4,855,016 172,306<br />
c<br />
c<br />
d<br />
280,265 5,307,587<br />
1992 4,908,603 171,701<br />
c<br />
c<br />
d<br />
272,676 5,352,980<br />
1993 4,968,641 179,213 3,351 49,393 1,866 280,074 5,482,538<br />
1994 5,061,111 169,868 3,620 52,937 1,918 193,808 5,483,262<br />
1995 5,100,317 172,026 9,055 79,396 4,122 190,411 5,555,327<br />
1996 5,195,265 164,552 11,156 79,407 3,570 214,282 5,668,232<br />
1997 5,351,466 151,769 11,803 86,240 4,246 201,268 5,806,792<br />
1998 5,434,383 146,921 11,722 89,362 4,038 206,135 5,892,561<br />
1999 5,403,450 135,756 13,735 94,784 4,147 225,779 5,877,651<br />
2000 5,514,395 138,921 15,268 90,288 4,005 201,135 5,964,012<br />
2001 5,521,637 156,479 16,929 87,116 4,544 192,632 5,979,337<br />
2002 5,455,530 155,429 26,320 90,291 2,338 224,567 5,955,475<br />
2003 5,585,875 152,763 55,626 67,592 1,937 163,459 6,027,252<br />
2004 5,663,861 154,356 74,095 47,600 940 194,203 6,135,055<br />
2005 5,555,332 161,037 84,088 39,751 612 295,064 6,135,884<br />
2006 5,563,354 182,924 117,198 11,580 57 322,989 6,198,102<br />
2007 5,532,097 184,383 136,603 1,610 0 349,807 6,204,500<br />
2008 5,361,287 177,559 190,084 480 0 548,843 6,277,893<br />
2009 5,232,656 177,194 240,955 90 0 518,998 6,169,893<br />
2010 5,374,094 161,479 285,883 901 0 523,015 6,345,372<br />
Average annual percentage change<br />
1987–2010 0.6% -2.4%<br />
d<br />
d<br />
d<br />
6.1% 0.9%<br />
2000–2010 -0.3% 1.5% 34.0% -36.9% -100.0% 10.0% 0.6%<br />
Source:<br />
U.S. Department of Energy, Energy Information Administration, <strong>Petroleum</strong> Supply Annual 2010, Vol. 1, July 2011,<br />
Table 15, and annual. (Additional resources: www.eia.doe.gov)<br />
a Methyl tertiary butyl ether (MTBE).<br />
b Includes methanol and other oxygenates.<br />
c Reported in “Other” category in this year.<br />
d Data are not available.<br />
TRANSPORTATION ENERGY DATA BOOK: EDITION 31—2012
When crude oil and other hydrocarbons are processed into products that are, on average, less dense than the<br />
input, a processing volume gain occurs. Due to this gain, the product yield from a barrel of crude oil is more<br />
than 100%. The processing volume gain has been growing over the years.<br />
Table 1.11<br />
Refinery Yield of <strong>Petroleum</strong> Products from a Barrel of Crude Oil, 1978–2011<br />
(percentage)<br />
Motor Distillate<br />
Liquefied<br />
Year gasoline fuel oil Jet fuel petroleum gas Other a Total b<br />
1978 44.1 21.4 6.6 2.3 29.6 104.0<br />
1979 43.0 21.5 6.9 2.3 30.3 104.0<br />
1980 44.5 19.7 7.4 2.4 30.0 104.0<br />
1981 44.8 20.5 7.6 2.4 28.7 104.0<br />
1982 46.4 21.5 8.1 2.2 26.2 104.4<br />
1983 47.6 20.5 8.5 2.7 24.8 104.1<br />
1984 46.7 21.5 9.1 2.9 24.2 104.4<br />
1985 45.6 21.6 9.6 3.1 24.6 104.5<br />
1986 45.7 21.2 9.8 3.2 24.8 104.7<br />
1987 46.4 20.5 10.0 3.4 24.5 104.8<br />
1988 46.0 20.8 10.0 3.6 24.4 104.8<br />
1989 45.7 20.8 10.1 4.0 24.2 104.8<br />
1990 45.6 20.9 10.7 3.6 24.1 104.9<br />
1991 45.7 21.3 10.3 3.8 24.1 105.2<br />
1992 46.0 21.2 9.9 4.3 24.0 105.4<br />
1993 46.1 21.9 9.2 4.1 23.3 104.6<br />
1994 45.5 22.3 9.8 4.2 23.2 105.0<br />
1995 46.4 21.8 9.7 4.5 22.8 105.2<br />
1996 45.7 22.7 10.4 4.5 22.4 105.7<br />
1997 45.7 22.5 10.3 4.6 22.4 105.5<br />
1998 46.2 22.3 9.9 4.4 22.9 105.7<br />
1999 46.5 22.3 10.2 4.5 22.4 105.9<br />
2000 46.2 23.1 10.3 4.5 22.0 106.1<br />
2001 46.2 23.8 9.8 4.3 21.6 105.7<br />
2002 47.3 23.2 9.8 4.3 21.5 106.1<br />
2003 46.9 23.7 9.5 4.2 22.1 106.4<br />
2004 46.8 23.9 9.7 4.0 22.2 106.6<br />
2005 46.2 25.0 9.8 3.6 21.6 106.2<br />
2006 45.8 25.4 9.3 3.9 21.7 106.1<br />
2007 45.5 26.1 9.1 4.1 21.5 106.3<br />
2008 44.2 27.8 9.7 4.1 20.7 106.5<br />
2009 46.1 26.9 9.3 4.1 20.2 106.6<br />
2010 45.7 27.5 9.3 4.3 20.3 107.1<br />
2011 45.0 28.9 9.4 4.0 19.8 107.1<br />
Source:<br />
Department of Energy, Energy Information Administration, <strong>Petroleum</strong> Supply Navigator, April 2012. (Additional<br />
resources: www.eia.doe.gov)<br />
a Includes aviation gasoline (0.1%), kerosene (0.1%), residual fuel oil (4.0%), naphtha and other oils for<br />
petrochemical feedstock use (1.0%), other oils for petrochemical feedstock use (1.0%), special naphthas (0.2%),<br />
lubricants (1.0%), waxes (0.1%), petroleum coke (5.3%) asphalt and road oil (2.4%), still gas (4.3%), and<br />
miscellaneous products (0.5%).<br />
b Products sum greater than 100% due to processing gain. The processing gain for years 1978 to 1980 is<br />
assumed to be 4 percent.<br />
TRANSPORTATION ENERGY DATA BOOK: EDITION 31—2012<br />
1–15
1–16<br />
Domestic petroleum production increased in 2009 for the first time in 20 years and has continued to increase.<br />
Most of the petroleum imported by the United States is in the form of crude oil. The United States does export<br />
small amounts of petroleum, mainly refined petroleum products which go to Canada and Mexico.<br />
Table 1.12<br />
United States <strong>Petroleum</strong> Production, Imports and Exports, 1950–2011<br />
(million barrels per day)<br />
Domestic production<br />
Natural<br />
gas<br />
Net imports<br />
Exports<br />
Crude plant<br />
Crude <strong>Petroleum</strong><br />
Crude <strong>Petroleum</strong><br />
oil liquids Total a<br />
oil products Total oil products Total<br />
1950 5.41 0.50 5.91 0.49 0.36 0.85 0.10 0.21 0.31<br />
1955 6.81 0.77 7.58 0.78 0.47 1.25 0.03 0.34 0.37<br />
1960 7.05 0.93 7.98 1.02 0.80 1.82 0.01 0.19 0.20<br />
1965 7.80 1.21 9.01 1.24 1.23 2.47 0.00 0.18 0.19<br />
1970 9.64 1.66 11.30 1.32 2.10 3.42 0.01 0.25 0.26<br />
1975 8.38 1.63 10.01 4.11 1.95 6.06 0.01 0.20 0.21<br />
1980 8.60 1.57 10.17 5.26 1.65 6.91 0.29 0.26 0.54<br />
1985 8.97 1.61 10.58 3.20 1.87 5.07 0.20 0.58 0.78<br />
1986 8.68 1.55 10.23 4.18 2.04 6.22 0.15 0.63 0.79<br />
1987 8.35 1.60 9.95 4.67 2.01 6.68 0.15 0.61 0.76<br />
1988 8.16 1.63 9.97 5.11 2.29 7.40 0.16 0.66 0.82<br />
1989 7.61 1.55 9.16 5.84 2.22 8.06 0.14 0.72 0.86<br />
1990 7.36 1.56 8.91 5.89 2.13 8.02 0.11 0.75 0.86<br />
1991 7.42 1.66 9.08 5.78 1.85 7.63 0.12 0.89 1.00<br />
1992 7.18 1.70 8.88 6.08 1.81 7.89 0.09 0.86 0.95<br />
1993 6.85 1.74 8.59 6.79 1.83 8.62 0.10 0.90 1.00<br />
1994 6.66 1.73 8.39 7.06 1.94 9.00 0.10 0.84 0.94<br />
1995 6.56 1.76 8.32 7.23 1.61 8.84 0.10 0.86 0.95<br />
1996 6.47 1.83 8.30 7.51 1.97 9.48 0.11 0.87 0.98<br />
1997 6.45 1.82 8.27 8.23 1.93 10.16 0.11 0.90 1.00<br />
1998 6.25 1.76 8.01 8.71 2.00 10.71 0.11 0.84 0.95<br />
1999 5.88 1.85 7.73 8.73 2.12 10.85 0.12 0.82 0.94<br />
2000 5.82 1.91 7.73 9.07 2.39 11.46 0.05 0.99 1.04<br />
2001 5.80 1.87 7.67 9.33 2.54 11.87 0.02 0.95 0.97<br />
2002 5.75 1.88 7.63 9.14 2.39 11.53 0.01 0.98 0.98<br />
2003 5.68 1.72 7.40 9.67 2.59 12.26 0.01 1.01 1.03<br />
2004 5.42 1.81 7.23 10.09 3.06 13.15 0.03 1.02 1.05<br />
2005 5.18 1.72 6.90 10.13 3.58 13.71 0.03 1.13 1.17<br />
2006 5.10 1.74 6.84 10.12 3.59 13.71 0.03 1.29 1.32<br />
2007 5.06 1.78 6.85 10.03 3.44 13.47 0.03 1.41 1.43<br />
2008 4.95 1.78 6.73 9.78 3.13 12.92 0.03 1.77 1.80<br />
2009 5.36 1.91 7.27 9.01 2.68 11.69 0.04 1.98 2.02<br />
2010 5.47 2.07 7.55 9.21 2.58 11.79 0.04 2.31 2.35<br />
2011 5.67 2.18 7.86 8.92 2.44 11.36 0.05 2.88 2.92<br />
Average annual percentage change<br />
1950–2011 0.1% 2.4% 0.5% 4.9% 3.2% 4.3% -1.1% 4.4% 3.7%<br />
1970–2011 -1.3% 0.7% 0.9% 4.8% 0.4% 3.0% 4.0% 6.1% 6.1%<br />
2001–2011 -0.3% 1.3% 0.2% -0.2% 0.2% -0.1% 0.0% 11.3% 10.9%<br />
Source:<br />
U.S. Department of Energy, Energy Information Administration, Monthly Energy Review, March 2012, Tables 3.1<br />
and 3.3b. (Additional resources: www.eia.gov)<br />
a Total domestic production includes crude oil, natural gas plant liquids and small amounts of other liquids.<br />
TRANSPORTATION ENERGY DATA BOOK: EDITION 31—2012
The U.S. is responsible for 22% of the world’s petroleum consumption. The United States relies heavily on<br />
imported petroleum. Imports accounted for nearly 45% of U.S. petroleum consumption in 2011.<br />
Table 1.13<br />
<strong>Petroleum</strong> Production and Transportation <strong>Petroleum</strong> Consumption in Context, 1950–2011<br />
Domestic<br />
petroleum<br />
production a<br />
Net Transportation U.S. World Net imports<br />
Transportation<br />
U.S. petroleum petroleum use as<br />
petroleum petroleum petroleum petroleum as a share of consumption as a share of<br />
imports consumption consumption consumption U.S. a share of world domestic<br />
(million barrels per day) consumption consumption production<br />
1950 5.91 0.55 3.36 6.46<br />
b<br />
8.4%<br />
b<br />
56.8%<br />
1955 7.58 0.88 4.46 8.46<br />
b<br />
10.4%<br />
b<br />
58.8%<br />
1960 7.99 1.62 5.15 9.82 21.34 16.5% 46.0% 64.5%<br />
1965 9.01 2.28 6.04 11.51 31.14 19.8% 37.0% 67.0%<br />
1970 11.30 3.16 7.78 14.70 46.81 21.5% 31.4% 68.9%<br />
1975 10.01 5.85 8.95 16.32 56.20 35.8% 29.0% 89.4%<br />
1980 10.17 6.36 9.57 17.06 63.11 37.3% 27.0% 94.1%<br />
1985 10.58 4.29 9.84 15.73 60.08 27.3% 26.2% 93.0%<br />
1986 10.23 5.44 10.19 16.28 61.80 33.4% 26.3% 99.6%<br />
1987 9.94 5.91 10.50 16.67 63.08 35.5% 26.4% 105.7%<br />
1988 9.76 6.59 10.88 17.28 64.96 38.1% 26.6% 111.4%<br />
1989 9.16 7.20 10.94 17.33 66.07 41.6% 26.2% 119.4%<br />
1990 8.91 7.16 10.89 16.99 66.52 42.2% 25.5% 122.2%<br />
1991 9.08 6.63 10.76 16.71 67.20 39.6% 24.9% 118.5%<br />
1992 8.87 6.94 10.91 17.03 67.39 40.8% 25.3% 123.0%<br />
1993 8.58 7.62 11.12 17.24 67.57 44.2% 25.5% 129.7%<br />
1994 8.39 8.05 11.13 17.72 68.89 45.5% 25.7% 132.6%<br />
1995 8.32 7.89 11.61 17.73 70.10 44.5% 25.3% 139.5%<br />
1996 8.30 8.50 11.91 18.31 71.69 46.4% 25.5% 143.5%<br />
1997 8.27 9.16 12.05 18.62 73.45 49.2% 25.4% 145.7%<br />
1998 8.01 9.76 12.36 18.92 74.10 51.6% 25.5% 154.3%<br />
1999 7.73 9.91 12.70 19.52 75.87 50.8% 25.7% 164.3%<br />
2000 7.73 10.42 12.98 19.70 76.78 52.9% 25.7% 167.9%<br />
2001 7.67 10.90 12.86 19.65 77.51 55.5% 25.4% 167.7%<br />
2002 7.63 10.55 13.12 19.76 78.16 53.4% 25.3% 172.0%<br />
2003 7.40 11.24 13.20 20.03 79.71 56.1% 25.1% 178.4%<br />
2004 7.23 12.10 13.61 20.73 82.56 58.4% 25.1% 188.2%<br />
2005 6.90 12.55 13.79 20.80 84.09 60.3% 24.7% 199.9%<br />
2006 6.84 12.39 13.95 20.69 85.13 59.9% 24.3% 203.9%<br />
2007 6.85 12.04 14.00 20.68 85.81 58.2% 24.1% 204.4%<br />
2008 6.73 11.11 13.33 19.50 85.44 57.0% 22.8% 198.0%<br />
2009 7.27 9.67 12.82 18.77 84.68 51.5% 22.2% 176.4%<br />
2010 7.55 9.44 12.94 19.18 87.14 49.2% 22.0% 171.4%<br />
2011 7.89 8.44 12.68 18.84 87.28 44.8% 21.6% 160.8%<br />
Average annual percentage change<br />
1950–2011 0.5% 4.6% 2.2% 1.8%<br />
b<br />
1970–2011 -0.9% 2.4% 1.2% 0.6% 1.5%<br />
2001–2011 0.1% -0.6% 0.0% -0.1% 0.3%<br />
Sources:<br />
U.S. Department of Energy, Energy Information Administration, Monthly Energy Review, March 2012, Tables 2.5, 3.1, and A3.<br />
(Pre-1973 data from the Annual Energy Review). World petroleum consumption - U.S. Department of Energy, Energy<br />
Information Administration, International Energy Statistics Website, May 2012. (Additional resources: www.eia.doe.gov)<br />
a Total domestic production includes crude oil, natural gas plant liquids and small amounts of other liquids.<br />
b Data are not available.<br />
TRANSPORTATION ENERGY DATA BOOK: EDITION 31—2012<br />
1–17
1–18<br />
Before 1989 the U.S. produced enough petroleum to meet the needs of the transportation sector, but was still<br />
short of meeting the petroleum needs of all the sectors, including industrial, residential and commercial, and<br />
electric utilities. In 1973 the gap between what the U.S. produced and what was consumed was 5.6 million<br />
barrels per day. By 2035, the gap is expected to be at least 8.0 million barrels per day if all sources of petroleum<br />
are included or 11.1 million barrels per day if only conventional petroleum sources are used.<br />
Figure 1.6. United States <strong>Petroleum</strong> Production and Consumption – All Sectors, 1973–2035<br />
Source:<br />
See Tables 1.12 and 2.7. Projections are from the Energy Information Administration, Annual Energy Outlook<br />
2012, January 2012.<br />
Notes: The U.S. Production has two lines after 2010. The solid line is conventional sources of petroleum, including<br />
crude oil, natural gas plant liquids, and refinery gains. The dashed line adds in other non-petroleum sources,<br />
including ethanol, biomass, liquids from coal, other blending components, other hydrocarbons, and ethers.<br />
The sharp increase in values between 2006 and 2007 is the result of the FHWA’s methodology change. The<br />
data change from historical to projected values occurs between 2010 and 2011.<br />
TRANSPORTATION ENERGY DATA BOOK: EDITION 31—2012
In 1989 the transportation sector petroleum consumption surpassed U.S. petroleum production for the first time,<br />
creating a gap that must be met with imports of petroleum. By the year 2035, transportation petroleum<br />
consumption is expected to grow to more than 15 million barrels per day; at that time, the gap between U.S.<br />
production and transportation consumption will be about 2.5 million barrels per day (when including the nonpetroleum<br />
sources).<br />
Figure 1.7. United States <strong>Petroleum</strong> Production, and Transportation Consumption, 1970–2035<br />
Source:<br />
See Tables 1.12 and 2.7. Projections are from the Energy Information Administration, Annual Energy Outlook<br />
2012, January 2012.<br />
Notes: The U.S. Production has two lines after 2010. The solid line is conventional sources of petroleum, including<br />
crude oil, natural gas plant liquids, and refinery gains. The dashed line adds in other non-petroleum sources,<br />
including ethanol, biomass, liquids from coal, other blending components, other hydrocarbons, and ethers.<br />
The sharp increase in values between 2010 and 2011 are caused by the data change from historical to projected<br />
values. The sharp increase in the value for heavy trucks between 2006 and 2007 is the result of the FHWA’s<br />
methodology change.<br />
TRANSPORTATION ENERGY DATA BOOK: EDITION 31—2012<br />
1–19
1–20<br />
Transportation accounted for almost 70% of the U.S. petroleum use in 2010 and 2011. Total petroleum<br />
consumption reached more than 20 million barrels per day from 2004 to 2007, but has been below that level from<br />
2008 through present. Though petroleum consumption increased slightly from 2009 to 2010, it declined again in<br />
2011.<br />
Table 1.14<br />
Consumption of <strong>Petroleum</strong> by End-Use Sector, 1973–2011<br />
(million barrels per day)<br />
Year Transportation Percentage Residential Commercial Industrial<br />
Electric<br />
utilities Total<br />
1973 9.05 52.3% 1.46 0.77 4.48 1.54 17.31<br />
1974 8.84 53.1% 1.33 0.70 4.30 1.48 16.65<br />
1975 8.95 54.8% 1.29 0.65 4.04 1.39 16.32<br />
1976 9.40 53.7% 1.40 0.72 4.46 1.52 17.51<br />
1977 9.76 53.0% 1.39 0.75 4.82 1.71 18.43<br />
1978 10.16 53.9% 1.35 0.72 4.87 1.75 18.84<br />
1979 10.00 54.0% 1.07 0.65 5.34 1.44 18.51<br />
1980 9.57 56.0% 0.89 0.63 4.86 1.15 17.10<br />
1981 9.49 59.1% 0.79 0.54 4.27 0.96 16.06<br />
1982 9.31 60.8% 0.75 0.50 4.06 0.69 15.30<br />
1983 9.41 61.8% 0.72 0.57 3.85 0.68 15.23<br />
1984 9.62 61.0% 0.79 0.60 4.20 0.56 15.78<br />
1985 9.84 62.6% 0.81 0.53 4.07 0.48 15.72<br />
1986 10.19 62.6% 0.80 0.57 4.09 0.64 16.29<br />
1987 10.51 63.0% 0.85 0.55 4.21 0.55 16.67<br />
1988 10.88 62.7% 0.87 0.54 4.36 0.69 17.34<br />
1989 10.94 62.8% 0.88 0.51 4.33 0.75 17.40<br />
1990 10.89 64.7% 0.74 0.49 4.15 0.57 16.84<br />
1991 10.76 63.2% 0.74 0.46 4.53 0.53 17.03<br />
1992 10.91 64.2% 0.76 0.44 4.45 0.44 16.99<br />
1993 11.08 63.7% 0.77 0.41 4.64 0.50 17.39<br />
1994 11.36 64.7% 0.76 0.41 4.57 0.47 17.57<br />
1995 11.61 64.9% 0.74 0.38 4.83 0.33 17.90<br />
1996 11.91 64.6% 0.81 0.40 4.96 0.36 18.44<br />
1997 12.05 65.2% 0.78 0.38 4.86 0.41 18.47<br />
1998 12.36 65.6% 0.72 0.36 4.84 0.58 18.86<br />
1999 12.70 65.3% 0.82 0.37 5.03 0.53 19.46<br />
2000 12.98 65.9% 0.87 0.42 4.92 0.51 19.68<br />
2001 12.86 65.7% 0.85 0.41 4.89 0.56 19.57<br />
2002 13.12 66.7% 0.82 0.38 4.93 0.43 19.67<br />
2003 13.20 66.3% 0.85 0.43 4.90 0.53 19.91<br />
2004 13.61 65.9% 0.84 0.42 5.23 0.54 20.63<br />
2005 13.79 66.8% 0.81 0.39 5.10 0.55 20.63<br />
2006 13.95 68.2% 0.69 0.34 5.19 0.29 20.45<br />
2007 14.00 68.7% 0.71 0.34 5.05 0.29 20.38<br />
2008 13.33 69.7% 0.72 0.34 4.53 0.21 19.14<br />
2009 12.82 70.0% 0.69 0.36 4.27 0.17 18.31<br />
2010 12.94 69.4% 0.67 0.36 4.51 0.17 18.64<br />
2011 12.68 69.4% 0.67 0.36 4.45 0.13 18.28<br />
Average annual percentage change<br />
1973–2011 1.0%<br />
-2.0% -2.0% 0.0% -6.3% 0.1%<br />
2001–2011 -0.1%<br />
-2.4% -1.3% -0.9% -13.6% -0.7%<br />
Source:<br />
U.S. Department of Energy, Energy Information Administration, Monthly Energy Review, March 2012, Tables 2.2–<br />
2.6. Converted to million barrels per day using Table A3. (Additional resources: www.eia.doe.gov)<br />
TRANSPORTATION ENERGY DATA BOOK: EDITION 31—2012
Light trucks include pick-ups, minivans, sport-utility vehicles, and vans. See Table 2.7 for highway energy use in<br />
trillion Btu.<br />
Table 1.15<br />
Highway Transportation <strong>Petroleum</strong> Consumption by Mode, 1970–2010 a<br />
(thousand barrels per day)<br />
Light<br />
vehicle<br />
Class<br />
3-6<br />
Class<br />
7-8<br />
Heavy<br />
Trucks<br />
Light<br />
Motor-<br />
Highway Total<br />
Year Cars trucks subtotal cycles Buses trucks trucks subtotal subtotal transportation b<br />
1970 4,424 803 5,227 4 62 140 598 738 6,031 7,333<br />
1971 4,654 880 5,534 5 60 146 624 771 6,369 7,654<br />
1972 4,954 988 5,942 6 59 161 685 846 6,852 8,179<br />
1973 5,103 1,098 6,201 7 58 177 757 934 7,200 8,601<br />
1974 4,842 1,087 5,929 7 57 178 758 935 6,928 8,310<br />
1975 4,836 1,245 6,081 7 58 181 771 952 7,099 8,472<br />
1976 5,107 1,359 6,466 8 63 191 814 1,005 7,542 8,969<br />
1977 5,157 1,460 6,617 8 65 212 903 1,114 7,805 9,314<br />
1978 5,261 1,576 6,837 9 66 237 1,010 1,247 8,160 9,793<br />
1979 4,996 1,595 6,591 11 68 247 1,052 1,299 7,969 9,725<br />
1980 4,565 1,552 6,117 13 68 247 1,055 1,302 7,500 9,118<br />
1981 4,508 1,546 6,054 14 69 253 1,077 1,329 7,466 9,175<br />
1982 4,509 1,481 5,989 13 71 253 1,077 1,330 7,403 8,944<br />
1983 4,587 1,562 6,149 11 72 257 1,097 1,354 7,586 9,077<br />
1984 4,609 1,670 6,280 11 69 266 1,132 1,398 7,758 9,364<br />
1985 4,665 1,785 6,450 12 72 265 1,131 1,396 7,930 9,537<br />
1986 4,773 1,897 6,670 12 76 271 1,155 1,426 8,184 9,896<br />
1987 4,782 1,996 6,778 12 77 279 1,190 1,469 8,336 10,111<br />
1988 4,784 2,130 6,914 13 80 284 1,211 1,495 8,503 10,343<br />
1989 4,821 2,170 6,992 14 79 291 1,242 1,534 8,618 10,505<br />
1990 4,538 2,323 6,861 12 78 304 1,294 1,597 8,549 10,425<br />
1991 4,196 2,493 6,688 12 83 310 1,320 1,630 8,413 10,246<br />
1992 4,268 2,670 6,938 12 87 315 1,345 1,660 8,698 10,583<br />
1993 4,374 2,795 7,169 13 86 325 1,386 1,711 8,979 10,820<br />
1994 4,428 2,878 7,305 13 86 343 1,463 1,806 9,211 11,091<br />
1995 4,440 2,975 7,415 13 87 357 1,523 1,881 9,396 11,346<br />
1996 4,515 3,089 7,604 13 88 367 1,564 1,931 9,636 11,601<br />
1997 4,559 3,222 7,781 13 91 370 1,579 1,949 9,834 11,776<br />
1998 4,677 3,292 7,969 13 93 382 1,630 2,012 10,086 12,014<br />
1999 4,780 3,448 8,228 14 96 420 1,792 2,212 10,550 12,644<br />
2000 4,766 3,453 8,219 14 98 437 1,861 2,298 10,630 12,794<br />
2001 4,798 3,491 8,290 13 93 436 1,859 2,295 10,690 12,665<br />
2002 4,923 3,602 8,525 12 91 456 1,944 2,401 11,029 12,945<br />
2003 4,866 3,963 8,829 12 90 443 1,890 2,334 11,265 13,128<br />
2004 4,919 4,137 9,055 13 92 411 1,752 2,162 11,323 13,395<br />
2005 5,050 3,840 8,890 12 93 461 1,965 2,426 11,422 13,563<br />
2006 4,893 3,959 8,852 14 94 470 2,006 2,476<br />
c<br />
11,436 13,604<br />
2007 4,852 4,034 8,885 31 92 585 2,495 3,080 12,089 14,295<br />
2008 4,492 4,082 8,574 32 95 591 2,521 3,112 11,813 13,863<br />
2009 4,451 4,120 8,571 31 95 549 2,341 2,890 11,587 13,419<br />
2010 4,395 4,193 8,588 28 90 557 2,375 2,933 11,639 13,548<br />
Average annual percentage change<br />
1970–2010 0.0% 4.2% 1.2% 5.0% 0.9% 3.5% 3.5% 3.5% 1.7% 1.5%<br />
2000–2010 -0.8% 2.0% 0.4% 7.2% -0.8% 2.5% 2.5% 2.5% 0.9% 0.6%<br />
Source:<br />
See Appendix A for Highway Energy Use.<br />
a Each gallon of petroleum product was assumed to equal one gallon of crude oil. The oil used to produce<br />
electricity is also estimated. See Appendix A, p. 18 for details.<br />
b Total transportation figures do not include military and off-highway energy use and may not include all<br />
possible uses of fuel for transportation (e.g., snowmobiles).<br />
c Due to changes in the FHWA fuel use methodology, motorcycle, bus, and heavy truck data are not<br />
comparable with data before the year 2007.<br />
TRANSPORTATION ENERGY DATA BOOK: EDITION 31—2012<br />
1–21
1–22<br />
Although about 18% of transportation energy use is for nonhighway modes, only 14% of transportation<br />
petroleum use is for nonhighway. This is because some nonhighway modes, such as pipelines and transit rail, use<br />
electricity. An estimate for the petroleum used to make electricity is included in the data. See Table 2.8 for<br />
nonhighway transportation energy use in trillion Btu.<br />
Table 1.16<br />
Nonhighway Transportation <strong>Petroleum</strong> Consumption by Mode, 1970–2010 a<br />
(thousand barrels per day)<br />
Nonhighway Total<br />
Year Air Water Pipeline Rail subtotal transportation b<br />
1970 625 381 43 253 1,302 7,333<br />
1975 651 423 50 249 1,373 8,472<br />
1980 697 625 35 262 1,618 9,118<br />
1981 706 722 29 253 1,709 9,175<br />
1982 701 604 21 214 1,541 8,944<br />
1983 699 561 20 212 1,491 9,077<br />
1984 781 577 16 232 1,606 9,364<br />
1985 814 564 13 216 1,606 9,537<br />
1986 884 601 17 210 1,712 9,896<br />
1987 920 626 15 213 1,775 10,111<br />
1988 958 644 18 220 1,840 10,343<br />
1989 960 688 18 221 1,887 10,505<br />
1990 991 655 14 216 1,876 10,425<br />
1991 928 690 12 202 1,833 10,246<br />
1992 942 724 10 208 1,885 10,583<br />
1993 961 653 11 215 1,841 10,820<br />
1994 1,004 635 11 230 1,880 11,091<br />
1995 1,036 668 7 239 1,950 11,346<br />
1996 1,068 644 8 245 1,965 11,601<br />
1997 1,113 574 9 246 1,942 11,776<br />
1998 1,102 566 12 248 1,927 12,014<br />
1999 1,202 625 11 257 2,095 12,644<br />
2000 1,236 662 10 256 2,164 12,794<br />
2001 1,161 546 11 257 1,975 12,665<br />
2002 1,079 572 8 257 1,917 12,945<br />
2003 1,094 496 10 263 1,863 13,128<br />
2004 1,188 596 10 278 2,073 13,395<br />
2005 1,226 625 10 281 2,142 13,563<br />
2006 1,216 661 5 286 2,168 13,604<br />
2007 1,215 709 5 277 2,206 14,295<br />
2008 1,160 621 4 265 2,050 13,863<br />
2009 1,029 579 3 220 1,832 13,419<br />
2010 1,040 626 3 240 1,909 13,548<br />
Average annual percentage change<br />
1970–2009 1.3% 1.2% -6.4% -0.1% 1.0% 1.5%<br />
1999–2009 -1.7% -0.6% -11.3% -0.6% -1.2% 0.6%<br />
Source:<br />
See Appendix A for Nonhighway Energy Use.<br />
a Each gallon of petroleum product was assumed to equal one gallon of crude oil. The oil used to produce<br />
electricity is also estimated. See Appendix A, p. 18 for details.<br />
b Total transportation figures do not include military and off-highway energy use and may not include all<br />
possible uses of fuel for transportation (e.g., snowmobiles).<br />
TRANSPORTATION ENERGY DATA BOOK: EDITION 31—2012
Highway vehicles were responsible for 85.9% of all transportation petroleum use in 2010. See Table 2.7 for<br />
transportation energy use in trillion Btu.<br />
Table 1.17<br />
Transportation <strong>Petroleum</strong> Use by Mode, 2009–2010 a<br />
Thousand barrels<br />
Percentage of total U.S.<br />
per day Percentage of total petroleum consumption<br />
2009 2010 2009 2010 2009 2010<br />
HIGHWAY 11,586.6 11,639.0 86.3% 85.9% 61.7% 60.7%<br />
Light vehicles 8,602.0 8,616.1 64.1% 63.6% 45.8% 44.9%<br />
Cars 4,450.6 4,395.2 33.2% 32.4% 23.7% 22.9%<br />
Light trucks b 4,120.0 4,193.1 30.7% 31.0% 21.9% 21.9%<br />
Motorcycles 31.5 27.8 0.2% 0.2% 0.2% 0.1%<br />
Buses 94.6 90.3 0.7% 0.7% 0.5% 0.5%<br />
Transit 43.7 41.5 0.3% 0.3% 0.2% 0.2%<br />
Intercity 14.6 14.0 0.1% 0.1% 0.1% 0.1%<br />
School 36.3 34.8 0.3% 0.3% 0.2% 0.2%<br />
Medium/heavy trucks 2,890.0 2,932.6 21.5% 21.6% 15.4% 15.3%<br />
Class 3-6 549.1 557.2 4.1% 4.1% 2.9% 2.9%<br />
Class 7-8 2,340.9 2,375.4 17.4% 17.5% 12.5% 12.4%<br />
NONHIGHWAY 1,832.2 1,908.5 13.7% 14.1% 9.8% 10.0%<br />
Air 1,029.5 1,039.7 7.7% 7.7% 5.5% 5.4%<br />
General aviation 103.2 108.8 0.8% 0.8% 0.5% 0.6%<br />
Domestic air carriers 739.7 734.2 5.5% 5.4% 3.9% 3.8%<br />
International air carriers 186.6 196.6 1.4% 1.5% 1.0% 1.0%<br />
Water 579.1 625.9 4.3% 4.6% 3.1% 3.3%<br />
Freight 453.3 500.4 3.4% 3.7% 2.4% 2.6%<br />
Recreational 125.8 125.5 0.9% 0.9% 0.7% 0.7%<br />
Pipeline 3.4 3.2 0.0% 0.0% 0.0% 0.0%<br />
Rail 220.3 239.8 1.6% 1.8% 1.2% 1.3%<br />
Freight (Class I) 210.0 229.6 1.6% 1.7% 1.1% 1.2%<br />
Passenger 10.2 10.2 0.1% 0.1% 0.1% 0.1%<br />
Transit 0.0 0.0 0.0% 0.0% 0.0% 0.0%<br />
Commuter 6.2 6.1 0.0% 0.0% 0.0% 0.0%<br />
Intercity 4.0 4.1 0.0% 0.0% 0.0% 0.0%<br />
HWY & NONHWY TOTAL c 13,418.9 13,547.5 100.0% 100.0% 71.5% 70.6%<br />
Off-Highway 999.5 1,018.2<br />
Source:<br />
See Appendix A for Energy Use Sources.<br />
a Each gallon of petroleum product was assumed to equal one gallon of crude oil. The oil used to produce<br />
electricity is also estimated. See Appendix A, p. 18 for details.<br />
b Two-axle, four-tire trucks.<br />
c Civilian consumption only. Totals may not include all possible uses of fuels for transportation (e.g.,<br />
snowmobiles).<br />
TRANSPORTATION ENERGY DATA BOOK: EDITION 31—2012<br />
1–23
1–24<br />
TRANSPORTATION ENERGY DATA BOOK: EDITION 31—2012


