Solaris Application Programming, 1/e - Chapter 4 - Parent Directory
Solaris Application Programming, 1/e - Chapter 4 - Parent Directory
Solaris Application Programming, 1/e - Chapter 4 - Parent Directory

You also want an ePaper? Increase the reach of your titles
YUMPU automatically turns print PDFs into web optimized ePapers that Google loves.
56 <strong>Chapter</strong> 4 Informational Tools<br />
4.3.2 Reporting Virtual Memory Utilization (vmstat)<br />
vmstat is a very useful tool that ships with <strong>Solaris</strong> and reports the system’s virtual<br />
memory and processor utilization. The information is aggregated over all the<br />
tasks of all the users of the system. Example 4.11 shows sample output from<br />
vmstat.<br />
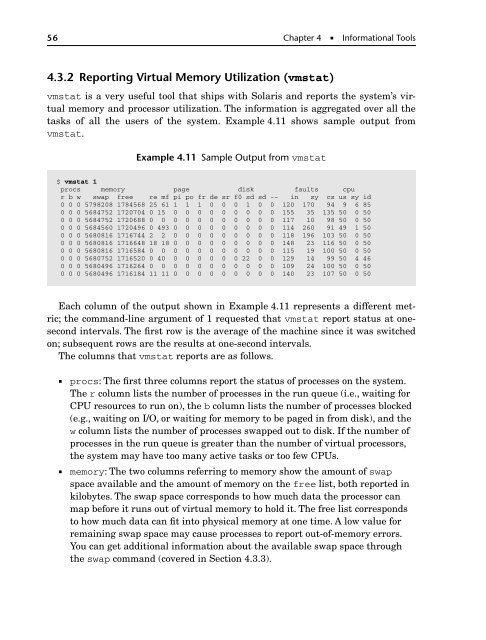
Example 4.11 Sample Output from vmstat<br />
$ vmstat 1<br />
procs memory page disk faults cpu<br />
r b w swap free re mf pi po fr de sr f0 sd sd -- in sy cs us sy id<br />
0 0 0 5798208 1784568 25 61 1 1 1 0 0 0 1 0 0 120 170 94 9 6 85<br />
0 0 0 5684752 1720704 0 15 0 0 0 0 0 0 0 0 0 155 35 135 50 0 50<br />
0 0 0 5684752 1720688 0 0 0 0 0 0 0 0 0 0 0 117 10 98 50 0 50<br />
0 0 0 5684560 1720496 0 493 0 0 0 0 0 0 0 0 0 114 260 91 49 1 50<br />
0 0 0 5680816 1716744 2 2 0 0 0 0 0 0 0 0 0 118 196 103 50 0 50<br />
0 0 0 5680816 1716648 18 18 0 0 0 0 0 0 0 0 0 148 23 116 50 0 50<br />
0 0 0 5680816 1716584 0 0 0 0 0 0 0 0 0 0 0 115 19 100 50 0 50<br />
0 0 0 5680752 1716520 0 40 0 0 0 0 0 0 22 0 0 129 14 99 50 4 46<br />
0 0 0 5680496 1716264 0 0 0 0 0 0 0 0 0 0 0 109 24 100 50 0 50<br />
0 0 0 5680496 1716184 11 11 0 0 0 0 0 0 0 0 0 140 23 107 50 0 50<br />
Each column of the output shown in Example 4.11 represents a different metric;<br />
the command-line argument of 1 requested that vmstat report status at onesecond<br />
intervals. The first row is the average of the machine since it was switched<br />
on; subsequent rows are the results at one-second intervals.<br />
The columns that vmstat reports are as follows.<br />
procs: The first three columns report the status of processes on the system.<br />
The r column lists the number of processes in the run queue (i.e., waiting for<br />
CPU resources to run on), the b column lists the number of processes blocked<br />
(e.g., waiting on I/O, or waiting for memory to be paged in from disk), and the<br />
w column lists the number of processes swapped out to disk. If the number of<br />
processes in the run queue is greater than the number of virtual processors,<br />
the system may have too many active tasks or too few CPUs.<br />
memory: The two columns referring to memory show the amount of swap<br />
space available and the amount of memory on the free list, both reported in<br />
kilobytes. The swap space corresponds to how much data the processor can<br />
map before it runs out of virtual memory to hold it. The free list corresponds<br />
to how much data can fit into physical memory at one time. A low value for<br />
remaining swap space may cause processes to report out-of-memory errors.<br />
You can get additional information about the available swap space through<br />
the swap command (covered in Section 4.3.3).