Solaris Application Programming, 1/e - Chapter 4 - Parent Directory
Solaris Application Programming, 1/e - Chapter 4 - Parent Directory
Solaris Application Programming, 1/e - Chapter 4 - Parent Directory

Create successful ePaper yourself
Turn your PDF publications into a flip-book with our unique Google optimized e-Paper software.
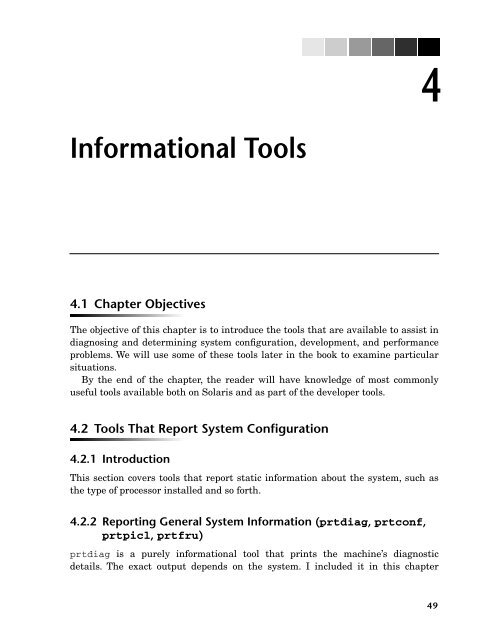
Informational Tools<br />
4.1 <strong>Chapter</strong> Objectives<br />
4<br />
The objective of this chapter is to introduce the tools that are available to assist in<br />
diagnosing and determining system configuration, development, and performance<br />
problems. We will use some of these tools later in the book to examine particular<br />
situations.<br />
By the end of the chapter, the reader will have knowledge of most commonly<br />
useful tools available both on <strong>Solaris</strong> and as part of the developer tools.<br />
4.2 Tools That Report System Configuration<br />
4.2.1 Introduction<br />
This section covers tools that report static information about the system, such as<br />
the type of processor installed and so forth.<br />
4.2.2 Reporting General System Information (prtdiag, prtconf,<br />
prtpicl, prtfru)<br />
prtdiag is a purely informational tool that prints the machine’s diagnostic<br />
details. The exact output depends on the system. I included it in this chapter<br />
49
50 <strong>Chapter</strong> 4 Informational Tools<br />
because it can be a source of useful information about the setup of the machine. It<br />
is located in /usr/sbin. The tool is often the first place to look for information on<br />
the processors and memory that are installed in the system, as well as general system<br />
configuration.<br />
Output from prtdiag on a two-CPU UltraSPARC IIICu system is shown in<br />
Example 4.1. The output identifies the processors and the system clock speed,<br />
together with the amount of memory installed and in which memory slots it is<br />
installed. The output refers to the UltraSPARC IIICu processor as the UltraS-<br />
PARC III+, and further abbreviates this to US-3+.<br />
Example 4.1 Sample Output from prtdiag<br />
$ /usr/sbin/prtdiag<br />
System Configuration: Sun Microsystems sun4u SUNW,Sun-Blade-1000 (2xUltraSPARC III+)<br />
System clock frequency: 150 MHZ<br />
Memory size: 2GB<br />
============================== CPUs ===================================<br />
E$ CPU CPU Temperature<br />
CPU Freq Size Impl. Mask Die Ambient<br />
--- -------- ---------- ------ ---- -------- --------<br />
0 900 MHz 8MB US-III+ 2.2 75 C 25 C<br />
1 900 MHz 8MB US-III+ 2.2 75 C 24 C<br />
=============================== IO Devices ============================<br />
Bus Freq<br />
Brd Type MHz Slot Name Model<br />
--- ---- ---- ---- -------------------------------- --------------<br />
0 pci 33 1 SUNW,m64B (display) SUNW,370-4362<br />
0 pci 66 4 SUNW,qlc-pci1077,2200.5 (scsi-fc+<br />
0 pci 33 5 ebus/parallel-ns87317-ecpp (para+<br />
0 pci 33 5 ebus/serial-sab82532 (serial)<br />
0 pci 33 5 network-pci108e,1101.1 (network) SUNW,pci-eri<br />
0 pci 33 5 firewire-pci108e,1102.1001 (fire+<br />
0 pci 33 6 scsi-pci1000,f.37 (scsi-2)<br />
0 pci 33 6 scsi-pci1000,f.37 (scsi-2)<br />
======================= Memory Configuration ==========================<br />
Segment Table:<br />
-----------------------------------------------------------------------<br />
Base Address Size Interleave Factor Contains<br />
-----------------------------------------------------------------------<br />
0x0 2GB 4 BankIDs 0,1,2,3<br />
Bank Table:<br />
-----------------------------------------------------------<br />
Physical Location<br />
ID ControllerID GroupID Size Interleave Way<br />
-----------------------------------------------------------<br />
0 0 0 512MB 0<br />
1 0 1 512MB 1<br />
2 0 0 512MB 2<br />
3 0 1 512MB 3<br />
Memory Module Groups:<br />
--------------------------------------------------<br />
ControllerID GroupID Labels<br />
--------------------------------------------------<br />
0 0 J0100,J0202,J0304,J0406<br />
0 1 J0101,J0203,J0305,J0407
4.2 TOOLS THAT REPORT SYSTEM CONFIGURATION 51<br />
Other tools exist that provide system information at various levels of detail. The<br />
tools prtconf, prtpicl, and prtfru produce long lists of system configuration<br />
information, the contents of which depend on the details available on the particular<br />
platform.<br />
4.2.3 Enabling Virtual Processors (psrinfo and psradm)<br />
psrinfo is a tool that will report whether the virtual processors are enabled.<br />
Sample output from psrinfo, run on a system with two 900MHz processors, is<br />
shown in Example 4.2. You can obtain more detailed output using psrinfo -v.<br />
Example 4.2 Sample Output from psrinfo and psrinfo -v<br />
$ psrinfo<br />
0 on-line since 11/20/2003 11:18:59<br />
1 on-line since 11/20/2003 11:19:00<br />
$ psrinfo -v<br />
Status of virtual processor 0 as of: 10/23/2006 21:47:30<br />
on-line since 11/20/2003 11:19:00.<br />
The sparcv9 processor operates at 900 MHz,<br />
and has a sparcv9 floating-point processor.<br />
Status of virtual processor 1 as of: 10/23/2006 21:47:30<br />
on-line since 11/20/2003 11:19:00.<br />
The sparcv9 processor operates at 900 MHz,<br />
and has a sparcv9 floating-point processor.<br />
<strong>Solaris</strong> 10 introduced the -p option to psrinfo that reports on the physical<br />
processors in the system. Example 4.3 shows the output from a system that has a<br />
single UltraSPARC T1 physical processor with 32 virtual processors.<br />
Example 4.3 Output from psrinfo -pv from an UltraSPARC T1 System<br />
$ psrinfo -pv<br />
The physical processor has 32 virtual processors (0, 1, 2, 3, 4, 5, 6, 7, 8, 9, 10, 11,<br />
12, 13, 14, 15, 16, 17, 18, 19, 20, 21, 22, 23, 24, 25, 26, 27, 28, 29, 30, 31)<br />
UltraSPARC T1 (cpuid 0 clock 1200 MHz)<br />
You can enable or disable the virtual processors using the psradm tool. The -f<br />
flag will disable a processor and the -n flag will enable it. This tool is available<br />
only with superuser permissions.<br />
The -i flag for psradm excludes CPUs from handling interrupts; this may be of<br />
use when partitioning the workload over multiple CPUs. Example 4.4 shows the<br />
command for excluding CPU number 1 from the CPUs that are available to handle<br />
interrupts.
52 <strong>Chapter</strong> 4 Informational Tools<br />
$ psradm -i 1<br />
$<br />
Example 4.4 Excluding a CPU from Interrupt Handling<br />
4.2.4 Controlling the Use of Processors through Processor Sets or<br />
Binding (psrset and pbind)<br />
It is possible to configure systems so that the processors are kept in discrete sets.<br />
This will partition compute resources so that particular applications run on particular<br />
sets of processors. The command to do this is psrset, and it is available only<br />
with superuser permissions. Example 4.5 illustrates the use of processor sets.<br />
Example 4.5 Example of the psrset Command<br />
# psrset -c 1<br />
created processor set 1<br />
processor 1: was not assigned, now 1<br />
# psrset<br />
user processor set 1: processor 1<br />
# psrset -e 1 sleep 1<br />
# psrset -d 1<br />
removed processor set 1<br />
The code in Example 4.5 first shows the creation of a processor set using the<br />
psrset -c option, which takes a list of processor IDs and binds those processors<br />
into a set. The command returns the id of the set that has just been created. The<br />
command psrset with no options reports the processor sets that are currently in<br />
existence, and the processors that belong to those sets. It is possible to run a particular<br />
process on a given set using the psrset -e option, which takes both the<br />
processor set to use and the command to execute on that set. Finally, the psrset<br />
-d option deletes the processor set that is specified.<br />
You must be careful when using processor sets (or any partitioning of the processor<br />
resources). Using processor sets, it is possible to introduce load imbalance,<br />
in which a set of processors is oversubscribed while another set is idle. You need to<br />
consider the allocation of processors to sets at the level of the entire machine,<br />
which is why the command requires superuser privileges.<br />
It is a good practice to check for both the number of enabled virtual processors<br />
(using psrinfo) and the existence of processor sets whenever the system’s performance<br />
is being investigated. On systems where processor sets are used regularly,<br />
or processors are often switched off, they can be a common reason for the system<br />
not providing the expected performance.
4.2 TOOLS THAT REPORT SYSTEM CONFIGURATION 53<br />
It is also possible to bind a single process to a particular processor using the<br />
pbind command, which takes the -b flag together with the pid and the processor<br />
ID as inputs when binding a process to a processor, and the -u flag together with<br />
the pid to unbind the process. Unlike processor sets that exclude other processes<br />
from running on a given group of processors, processor binding ensures that a particular<br />
process will run on a particular processor, but it does not ensure that other<br />
processes will not also run there.<br />
4.2.5 Reporting Instruction Sets Supported by Hardware (isalist)<br />
isalist is a <strong>Solaris</strong> tool that outputs the instruction sets architectures (ISAs) the<br />
processor supports. This can be useful for picking the appropriate compiler options<br />
(this will be covered in Section 5.6.5 of <strong>Chapter</strong> 5). It is also useful in determining the<br />
particular variant of CPU that the system contains. Example 4.6 shows output from<br />
the isalist command on an UltraSPARC III-based system. It shows that there is a<br />
SPARC processor in the system, and that this can handle SPARC V7, V8, and V9<br />
binaries. The processor can also handle the VIS 2.0 instruction set extensions.<br />
Example 4.6 Sample Output from the isalist Command<br />
$ isalist<br />
sparcv9+vis2 sparcv9+vis sparcv9 sparcv8plus+vis sparcv8plus sparcv8<br />
sparcv8-fsmuld sparcv7 sparc<br />
4.2.6 Reporting TLB Page Sizes Supported by Hardware<br />
(pagesize)<br />
In Section 1.9.2 of <strong>Chapter</strong> 1 we discussed the Translation Lookaside Buffer (TLB),<br />
which the processor uses to map virtual memory addresses to physical memory<br />
addesses. Different processors are able to support different page sizes. The advantage<br />
of larger page sizes is that they let the TLB map more physical memory using<br />
a fixed number of TLB entries. For example, a TLB with 64 entries can map<br />
8KB*64=512KB when each entry is an 8KB page, but can map 4MB*64=256MB<br />
when each entry holds a 4MB page. The number of different page sizes that can be<br />
supported simultaneously is hardware-dependent. Even if the hardware supports<br />
large page sizes, there is no guarantee that an application will recieve large pages<br />
if it requests them. The number of available large pages depends on the amount of<br />
memory in the system and the degree to which contiguous memory is available.<br />
The pagesize command prints out the different TLB page sizes that the processor<br />
can support. If no flags are specified, the utility will print the default page size. If<br />
the flag -a is used, it will report all the available page sizes (see Example 4.7).
54 <strong>Chapter</strong> 4 Informational Tools<br />
$ pagesize -a<br />
8192<br />
65536<br />
524288<br />
4194304<br />
Example 4.7 Sample Output from the pagesize Command<br />
The pmap command (covered in Section 4.4.7) reports the page sizes that an<br />
application has been allocated.<br />
It is possible to change the page sizes that an application requests. You can do<br />
this in several ways.<br />
At compile time, you can use the -xpagesize compiler flag documented in<br />
Section 5.8.6 of <strong>Chapter</strong> 5.<br />
You can preload the Multiple PageSize Selection (mpss.so.1) library, which<br />
uses environment variables to set the page sizes. We will cover preloading in<br />
more detail in Section 7.2.10 of <strong>Chapter</strong> 7. An example of using preloading to<br />
set the page size for an application appears in Example 4.8. In this example,<br />
the environment is being set up to request 4MB pages for both the application<br />
stack and the heap.<br />
Example 4.8 Using mpss.so.1 to Set the Page Size for an <strong>Application</strong><br />
$ setenv MPSSHEAP 4M<br />
$ setenv MPSSSTACK 4M<br />
$ setenv LD_PRELOAD mpss.so.1<br />
$ a.out<br />
You can set the preferred page size for a command or for an already running<br />
application through the ppgsz utility. This utility takes a set of page sizes<br />
plus either a command to be run with those page sizes, or a pid for those<br />
page sizes to be applied to. Example 4.9 shows examples of using the ppgsz<br />
command.<br />
% ppgsz -o heap=4M a.out<br />
% ppgsz -o heap=64K -p <br />
Example 4.9 Using the ppgsz Command<br />
Table 4.1 shows the supported page sizes for various processors.
4.3 TOOLS THAT REPORT CURRENT SYSTEM STATUS 55<br />
4.2.7 Reporting a Summary of SPARC Hardware Characteristics<br />
(fpversion)<br />
fpversion is a tool that ships with the SPARC compiler and is not available on<br />
x86 architectures. The tool will output a summary of the processor’s capabilities.<br />
The most important part of the output from fpversion is that it displays the<br />
options the compiler will use when it is told to optimize for the native platform (see<br />
-xtarget=native in Section 5.6.4 of <strong>Chapter</strong> 5).<br />
Example 4.10 shows output from fpversion from an UltraSPARC IIICu-based<br />
system.<br />
4.3 Tools That Report Current System Status<br />
4.3.1 Introduction<br />
Table 4.1 Page Sizes Supported by Various Processor Types<br />
Processor 4KB 8KB 64KB 512KB 2MB 4MB 32MB 256MB<br />
UltraSPARC IIICu ✓ ✓ ✓ ✓<br />
UltraSPARC IV ✓ ✓ ✓ ✓<br />
UltraSPARC IV+ ✓ ✓ ✓ ✓ ✓ ✓<br />
UltraSPARC T1 ✓ ✓ ✓ ✓<br />
UltraSPARC T2 ✓ ✓ ✓ ✓<br />
SPARC64 VI ✓ ✓ ✓ ✓ ✓ ✓<br />
x64 ✓ ✓<br />
Example 4.10 Output from fpversion on an UltraSPARC IIICu Based System<br />
$ fpversion<br />
A SPARC-based CPU is available.<br />
Kernel says CPU's clock rate is 1050.0 MHz.<br />
Kernel says main memory's clock rate is 150.0 MHz.<br />
Sun-4 floating-point controller version 0 found.<br />
An UltraSPARC chip is available.<br />
Use "-xtarget=ultra3cu -xcache=64/32/4:8192/512/2" code-generation option.<br />
Hostid = 0x83xxxxxx.<br />
This section covers tools that report system-wide information, such as what processes<br />
are being run and how much the disk is being utilized.
56 <strong>Chapter</strong> 4 Informational Tools<br />
4.3.2 Reporting Virtual Memory Utilization (vmstat)<br />
vmstat is a very useful tool that ships with <strong>Solaris</strong> and reports the system’s virtual<br />
memory and processor utilization. The information is aggregated over all the<br />
tasks of all the users of the system. Example 4.11 shows sample output from<br />
vmstat.<br />
Example 4.11 Sample Output from vmstat<br />
$ vmstat 1<br />
procs memory page disk faults cpu<br />
r b w swap free re mf pi po fr de sr f0 sd sd -- in sy cs us sy id<br />
0 0 0 5798208 1784568 25 61 1 1 1 0 0 0 1 0 0 120 170 94 9 6 85<br />
0 0 0 5684752 1720704 0 15 0 0 0 0 0 0 0 0 0 155 35 135 50 0 50<br />
0 0 0 5684752 1720688 0 0 0 0 0 0 0 0 0 0 0 117 10 98 50 0 50<br />
0 0 0 5684560 1720496 0 493 0 0 0 0 0 0 0 0 0 114 260 91 49 1 50<br />
0 0 0 5680816 1716744 2 2 0 0 0 0 0 0 0 0 0 118 196 103 50 0 50<br />
0 0 0 5680816 1716648 18 18 0 0 0 0 0 0 0 0 0 148 23 116 50 0 50<br />
0 0 0 5680816 1716584 0 0 0 0 0 0 0 0 0 0 0 115 19 100 50 0 50<br />
0 0 0 5680752 1716520 0 40 0 0 0 0 0 0 22 0 0 129 14 99 50 4 46<br />
0 0 0 5680496 1716264 0 0 0 0 0 0 0 0 0 0 0 109 24 100 50 0 50<br />
0 0 0 5680496 1716184 11 11 0 0 0 0 0 0 0 0 0 140 23 107 50 0 50<br />
Each column of the output shown in Example 4.11 represents a different metric;<br />
the command-line argument of 1 requested that vmstat report status at onesecond<br />
intervals. The first row is the average of the machine since it was switched<br />
on; subsequent rows are the results at one-second intervals.<br />
The columns that vmstat reports are as follows.<br />
procs: The first three columns report the status of processes on the system.<br />
The r column lists the number of processes in the run queue (i.e., waiting for<br />
CPU resources to run on), the b column lists the number of processes blocked<br />
(e.g., waiting on I/O, or waiting for memory to be paged in from disk), and the<br />
w column lists the number of processes swapped out to disk. If the number of<br />
processes in the run queue is greater than the number of virtual processors,<br />
the system may have too many active tasks or too few CPUs.<br />
memory: The two columns referring to memory show the amount of swap<br />
space available and the amount of memory on the free list, both reported in<br />
kilobytes. The swap space corresponds to how much data the processor can<br />
map before it runs out of virtual memory to hold it. The free list corresponds<br />
to how much data can fit into physical memory at one time. A low value for<br />
remaining swap space may cause processes to report out-of-memory errors.<br />
You can get additional information about the available swap space through<br />
the swap command (covered in Section 4.3.3).
4.3 TOOLS THAT REPORT CURRENT SYSTEM STATUS 57<br />
page: The columns labeled re to sr refer to paging information. The re column<br />
lists the number of pages containing data from files, either executables<br />
or data, that have been accessed again and therefore reclaimed from the list<br />
of free pages. The mf column lists the number of minor page faults, in which a<br />
page was mapped into the process that needed it. The pi column lists the<br />
number of kilobytes paged in from disk and the po column lists the number of<br />
kilobytes paged out to disk. The de column lists the anticipated short-term<br />
memory shortfall in kilobytes, which gives the page scanner a target number<br />
of pages to free up. The sr column lists the number of pages scanned per second.<br />
A high scan rate (sr) is also an indication of low memory, and that the<br />
machine is having to search through memory to find pages to send to disk.<br />
The solution is to either run fewer applications or put more memory into the<br />
machine. Continuously high values of pi and po indicate significant disk<br />
activity, due to either a high volume of I/O or to paging of data to and from<br />
disk when the system runs low on memory.<br />
disk: There is space to report on up to four disk drives, and these columns<br />
show the number of disk operations per second for each of the four drives.<br />
faults: There are three columns on faults (i.e., traps and interrupts). The in<br />
column lists the number of interrupts; these are used for tasks such as handling<br />
a packet of data from the network interface card. The sy column lists<br />
the number of system calls; these are calls into the kernel for the system to<br />
perform a task. The cs column lists the number of context switches, whereby<br />
one thread leaves the CPU and another is placed on the CPU.<br />
cpu: The final three columns are the percentage of user, system, and idle<br />
time. This is an aggregate over all the processors. Example 4.11 shows output<br />
from a two-CPU machine. With an idle time of 50%, this can mean that<br />
both CPUs are busy, but each only half the time, or that only one of the two<br />
CPUs is busy. In an ideal world, most of the time should be spent in user<br />
code, performing computations, rather than in the system, managing<br />
resources. Of course, this does not mean that the time in user code is being<br />
spent efficiently, just that the time isn’t spent in the kernel or being idle.<br />
High levels of system time mean something is wrong, or the application is<br />
making many system calls. Investigating the cause of high system time is<br />
always worthwhile.<br />
4.3.3 Reporting Swap File Usage (swap)<br />
Swap space is disk space reserved for anonymous data (data that is not otherwise<br />
held on a filesystem). You can use the swap command to add and delete swap space<br />
from a system. It can also list the locations of swap space using the -l flag, and
58 <strong>Chapter</strong> 4 Informational Tools<br />
report a summary of swap space usage under the -s flag. Examples of output from<br />
both of these flags is shown in Example 4.12.<br />
4.3.4 Reporting Process Resource Utilization (prstat)<br />
prstat was a very useful addition to <strong>Solaris</strong> 8. It prints out a list of the processes<br />
that are consuming the most processor time, which can be helpful in identifying<br />
processes that are consuming excessive amounts of CPU resources. It also reports<br />
useful values, such as the amount of memory used.<br />
Example 4.13 shows the first few lines of output from prstat. It reports a<br />
screen of information, each line representing a particular process. By default, the<br />
processes are listed starting with the one that is consuming the most CPU time.<br />
The columns are as follows.<br />
Example 4.12 Output from the swap Command<br />
% swap -l<br />
swapfile dev swaplo blocks free<br />
/dev/dsk/c1t0d0s1 118,33 16 25175408 25175408<br />
% swap -s<br />
total: 2062392k bytes allocated + 1655952k reserved = 3718344k used, 36500448k available<br />
Example 4.13 Sample Output from prstat<br />
PID USERNAME SIZE RSS STATE PRI NICE TIME CPU PROCESS/NLWP<br />
29013 martin 4904K 1944K cpu0 40 0 0:01:15 44% myapplication/1<br />
210 root 4504K 2008K sleep 59 0 0:27:34 0.1% automountd/2<br />
29029 martin 4544K 4256K cpu1 59 0 0:00:00 0.1% prstat/1<br />
261 root 2072K 0K sleep 59 0 0:00:00 0.0% smcboot/1<br />
...<br />
PID: The process ID (PID), which is a unique number assigned to identify a<br />
particular process.<br />
USERNAME: The ID of the user owning the process.<br />
SIZE: The total size of the process. This is a measure of how much virtual<br />
address space has been allocated to the process. It does not measure how<br />
much physical memory the process is currently using.<br />
RSS: The resident set size (RSS) of the process, that is, how much of the process<br />
is actually in memory. The RSS of an application can fluctuate depending<br />
on how much data the application is currently using, and how much of the<br />
application has been swapped out to disk.
4.3 TOOLS THAT REPORT CURRENT SYSTEM STATUS 59<br />
STATE: The state of the process, that is, whether it is sleeping, on a CPU (as<br />
the two processes for “martin” are in the example), or waiting for a processor<br />
to run on.<br />
PRI: The priority of the process, which is a measure of how important it is for<br />
CPU time to be allocated to a particular process. The higher the priority, the<br />
more time the kernel will allow the process to be on a CPU.<br />
NICE: The nice value for the process, which allows the user to reduce the priority<br />
of an application to allow other applications to run. The higher the nice<br />
value, the less CPU time will be allocated to it.<br />
TIME: The CPU time that the process has accumulated since it started.<br />
CPU: The percentage of the CPU that the process has recently consumed.<br />
PROCESS/NLWP: The name of the executable, together with the number of<br />
lightweight processes (LWPs) in the process. From <strong>Solaris</strong> 9 onward, LWPs<br />
are equivalent to threads. prstat can also report activity on a per-thread<br />
basis using the -L flag.<br />
You can obtain a more accurate view of system utilization by using the prstat<br />
command with the -m flag. This flag reports processor utilization using microstate<br />
accounting information. Microstate accounting is a more accurate breakdown of<br />
where the process spends its time. <strong>Solaris</strong> 10 collects microstate accounting data<br />
by default. Example 4.14 shows example output from this command.<br />
The columns in Example 4.14 are as follows.<br />
PID: The PID of the process.<br />
Example 4.14 Output from prstat -m<br />
PID USERNAME USR SYS TRP TFL DFL LCK SLP LAT VCX ICX SCL SIG PROCESS/NLWP<br />
1946 martin 0.1 0.3 0.0 0.0 0.0 0.0 100 0.0 23 0 280 0 prstat/1<br />
5063 martin 0.2 0.0 0.0 0.0 0.0 0.0 100 0.0 24 0 95 0 gnome-panel/1<br />
5065 martin 0.2 0.0 0.0 0.0 0.0 0.0 100 0.0 13 0 22 0 nautilus/3<br />
7743 martin 0.1 0.0 0.0 0.0 0.0 0.0 100 0.0 61 0 76 0 soffice1.bin/6<br />
5202 martin 0.0 0.0 0.0 0.0 0.0 0.0 100 0.0 24 2 40 0 gnome-termin/1<br />
...<br />
Total: 115 processes, 207 lwps, load averages: 0.00, 0.01, 0.02<br />
USERNAME: The User ID of the process owner.<br />
USR to LAT: The percentage of time spent by the process in the various modes:<br />
user mode (USR), system mode (SYS), system traps (TRP), text (i.e., program<br />
instruction) page faults (TFL), data page faults (DFL), user locks (LCK),<br />
sleeping (SLP), and waiting for the CPU (LAT).
60 <strong>Chapter</strong> 4 Informational Tools<br />
VCX and ICX: The number of context switches, voluntary (VCX) and involuntary<br />
(ICX). A voluntary context switch is one in which the process either completes<br />
its task and yields the CPU, or enters a wait state (such as waiting for<br />
data from disk). An involuntary context switch is one in which another<br />
higher-priority task is assigned to the CPU, or the process uses up its allocation<br />
of time on the CPU.<br />
SCL: The number of system calls.<br />
SIG: The number of signals received.<br />
PROCESS/NLWP: The name of the process (PROCESS) and the number of<br />
LWPs (NLWP).<br />
It is possible to use the flag -s to sort by a particular column. In<br />
Example 4.15, this is used to sort the processes by RSS.<br />
4.3.5 Listing Processes (ps)<br />
Example 4.15 Output from prstat Sorted by RSS<br />
$ prstat -s rss<br />
PID USERNAME SIZE RSS STATE PRI NICE TIME CPU PROCESS/NLWP<br />
8453 root 403M 222M sleep 49 0 13:17:50 0.0% Xsun/1<br />
28059 robin 218M 133M sleep 49 0 0:06:04 0.1% soffice2.bin/5<br />
28182 robin 193M 88M sleep 49 0 0:00:54 0.0% soffice1.bin/7<br />
26704 robin 87M 72M sleep 49 0 0:06:35 0.0% firefox-bin/4<br />
...<br />
ps displays a list of all the processes in the system. It is a very flexible tool and has<br />
many options. The output in Example 4.16 shows one example of what ps can<br />
report.<br />
Example 4.16 Sample Output from ps<br />
$ ps -ef<br />
UID PID PPID C STIME TTY TIME CMD<br />
root 0 0 0 Jul 06 ? 0:00 sched<br />
root 1 0 0 Jul 06 ? 0:01 /etc/init -<br />
root 2 0 0 Jul 06 ? 0:13 pageout<br />
...<br />
The options passed to the ps command in Example 4.16 are -e, to list all the<br />
processes; and -f, to give a “full” listing, which is a particular set of columns (in<br />
particular, it gives more information about how the application was invoked than<br />
the alternative -l “long” listing).
4.3 TOOLS THAT REPORT CURRENT SYSTEM STATUS 61<br />
The columns in the output are as follows.<br />
UID: The UID of the user who owns the process. A large number of processes<br />
are going to be owned by root.<br />
PID: The PID of the process.<br />
PPID: The PID of the parent process.<br />
C: This column is obsolete. It used to report processor utilization used in<br />
scheduling.<br />
STIME: The start date/time of the application.<br />
TTY: The controlling terminal for the process (where the commands that go to<br />
the process are being typed). A question mark indicates that the process does<br />
not have a controlling terminal.<br />
TIME: The accumulated CPU time of the process.<br />
CMD: The command being executed (truncated to 80 characters). Under the -f<br />
flag, the arguments are printed as well, which can be useful for distinguishing<br />
between two processes of the same name.<br />
One of the most useful columns is the total accumulated CPU time for a process,<br />
which is the amount of time it has been running on a CPU since it started.<br />
This column is worth watching to check that the critical programs are not being<br />
starved of time by the noncritical programs.<br />
Most of the time it is best to pipe the output of ps to some other utility (e.g.,<br />
grep), because even on an idle system there can be many processes.<br />
4.3.6 Locating the Process ID of an <strong>Application</strong> (pgrep)<br />
It is often necessary to find out the PID of a process to examine the process further.<br />
It is possible to do this using the ps command, but it is often more convenient<br />
to use the pgrep command. This command returns processes with names<br />
that match a given text string, or processes that are owned by a given user.<br />
Example 4.17 shows two examples of the use of this command. The first example<br />
shows the tool being used to match the name of an executable. In the example, the<br />
-l flag specifies that the long output format should be generated, which includes<br />
the name of the program. The second example shows the -U flag, which takes a<br />
username and returns a list of processes owned by that particular user—in this<br />
case, the processes owned by root.
62 <strong>Chapter</strong> 4 Informational Tools<br />
% pgrep -l soff<br />
28059 soffice2.bin<br />
28182 soffice1.bin<br />
% pgrep -lU root<br />
0 sched<br />
1 init<br />
2 pageout<br />
3 fsflush<br />
760 sac<br />
...<br />
Example 4.17 Output from pgrep<br />
4.3.7 Reporting Activity for All Processors (mpstat)<br />
The mpstat tool reports activity on a per-processor basis. It reports a number of<br />
useful measures of activity that may indicate issues at the system level. Like<br />
vmstat, mpstat takes an interval parameter that specifies how frequently the<br />
data should be reported. The first lines of output reported give the data since boot<br />
time; the rates are reported in events per second. Sample output from mpstat is<br />
shown in Example 4.18.<br />
Example 4.18 Sample Output from mpstat<br />
$ mpstat 1<br />
CPU minf mjf xcal intr ithr csw icsw migr smtx srw syscl usr sys wt idl<br />
0 29 1 38 214 108 288 10 6 14 0 562 36 2 0 62<br />
1 27 1 27 44 29 177 9 6 67 0 516 33 2 0 65<br />
CPU minf mjf xcal intr ithr csw icsw migr smtx srw syscl usr sys wt idl<br />
0 7 0 11 207 103 64 9 10 0 0 7 39 1 0 60<br />
1 0 0 4 14 2 54 11 11 0 0 5 61 0 0 39<br />
CPU minf mjf xcal intr ithr csw icsw migr smtx srw syscl usr sys wt idl<br />
0 0 0 6 208 106 60 7 8 0 0 14 47 0 0 53<br />
1 0 0 65 16 9 46 6 7 0 0 4 53 2 0 45<br />
CPU minf mjf xcal intr ithr csw icsw migr smtx srw syscl usr sys wt idl<br />
0 0 0 6 204 103 36 6 3 0 0 5 68 0 0 32<br />
1 0 0 1 9 2 64 6 7 0 0 5 32 0 0 68<br />
CPU minf mjf xcal intr ithr csw icsw migr smtx srw syscl usr sys wt idl<br />
0 0 0 2 205 104 14 10 2 0 0 4 98 0 0 2<br />
1 0 0 1 34 31 93 2 2 0 0 15 2 0 0 98<br />
CPU minf mjf xcal intr ithr csw icsw migr smtx srw syscl usr sys wt idl<br />
0 0 0 8 204 104 40 2 6 0 0 5 51 0 0 49<br />
1 0 0 0 11 2 58 8 6 0 0 5 49 0 0 51<br />
....<br />
Each line of output corresponds to a particular CPU for the previous second.<br />
The columns in the mpstat output are as follows.<br />
CPU: The ID of the CPU to which the data belongs. Data is reported on a per-<br />
CPU basis.
4.3 TOOLS THAT REPORT CURRENT SYSTEM STATUS 63<br />
minf: The number of minor page faults per second. These occur when a page<br />
of memory is mapped into a process.<br />
mjf: The number of major page faults per second. These occur when the<br />
requested page of data has to be brought in from disk.<br />
xcal: The number of interprocess cross-calls per second. This occurs when a<br />
process on one CPU requests action from another. An example of this is<br />
where memory is unmapped through a call to munmap. The munmap call will<br />
use a cross call to ensure that other CPUs also remove the mapping to the<br />
target memory range from their TLB.<br />
intr: The number of interrupts per second.<br />
ithr: The number of interrupt threads per second, not counting the clock<br />
interrupt. These are lower-priority interrupts that are handled by threads<br />
that are scheduled onto the processor to handle the interrupt event.<br />
csw: The number of context switches per second, where the process either voluntarily<br />
yields its time on the processor before the end of its allocated slot or<br />
is involuntarily displaced by a higher-priority process.<br />
icsw: The number of involuntary context switches per second, where the process<br />
is removed from the processor either to make way for a higher-priority<br />
thread or because it has fully utilized its time slot.<br />
migr: The number of thread migrations to another processor per second. Usually,<br />
best performance is obtained if the operating system keeps the process<br />
on the same CPU. In some instances, this may not be possible and the process<br />
is migrated to a different CPU.<br />
smtx: The number of times a mutex lock was not acquired on the first try.<br />
srw: The number of times a read/write lock was not acquired on the first try.<br />
syscl: The number of system calls per second.<br />
usr: The percentage of time spent in user code.<br />
sys: The percentage of time spent in system code.<br />
wt: The percentage of time spent waiting on I/O. From <strong>Solaris</strong> 10 onward, this<br />
will report zero because the method of calculating wait time has changed.<br />
idl: The percentage of time spent idle.<br />
In the code in Example 4.18, the two processors are spending about 50% of their<br />
time in user code and 50% of their time idle. In fact, just a single process is running.<br />
What is interesting is that this process is migrating between the two processors<br />
(you can see this in the migrations per second). It is also apparent that<br />
processor 0 is handling most of the interrupts.
64 <strong>Chapter</strong> 4 Informational Tools<br />
4.3.8 Reporting Kernel Statistics (kstat)<br />
kstat is a very powerful tool for returning information about the kernel. The<br />
counts it produces are the number of events since the processor was switched on.<br />
So, to determine the number of events that an application causes, it is necessary to<br />
run kstat before and after the application, and determine the difference between<br />
the two values. Of course, this is accurate only if just one process is running on the<br />
system. Otherwise, the other processes can change the numbers.<br />
One of the metrics that kstat reports is the number of emulated floating-point<br />
instructions. Not all floating-point operations are performed in hardware; some<br />
have been left to software. Obviously, software is more flexible, but it is slower<br />
than hardware, so determining whether an application is doing any floating-point<br />
operations in software can be useful. An example of checking for unfinished floating-point<br />
traps is shown in Example 4.19. The -p option tells kstat to report statistics<br />
in a parsable format; the -s option selects the statistic of interest.<br />
Example 4.19 Using kstat to Check for Unfinished Floating-Point Traps<br />
$ kstat -p -s 'fpu_unfinished_traps'<br />
unix:0:fpu_traps:fpu_unfinished_traps 32044940<br />
$ a.out<br />
$ kstat -p -s 'fpu_unfinished_traps'<br />
unix:0:fpu_traps:fpu_unfinished_traps 32044991<br />
Example 4.19 shows the number of unfinished floating-point operations reported<br />
by kstat before the application ran, and the number afterward. The difference<br />
between the two values is 51, which means that 51 unfinished floating-point operations<br />
were handled by trapping to software between the two calls to kstat. It is<br />
likely that these traps were caused by the application a.out, but if there was other<br />
activity on the system, these traps cannot be confidently attributed to any one particular<br />
process. To have some degree of confidence in the number of traps on a busy<br />
system, it is best to repeat the measurement several times, and to measure the number<br />
of traps that occur when the application is not running.<br />
4.3.9 Generating a Report of System Activity (sar)<br />
The sar utility records system activity over a period of time into an archive for<br />
later analysis. It is possible to select which aspects of system performance are<br />
recorded. Once an archive of data has been recorded, sar is also used to extract<br />
the particular activities of interest.<br />
To record a sar data file it is necessary to specify which system events should<br />
be recorded, the name of the file in which to record the events, the interval
4.3 TOOLS THAT REPORT CURRENT SYSTEM STATUS 65<br />
between samples, and the number of samples you want. An example command line<br />
for sar is shown in Example 4.20.<br />
$ sar -A -o /tmp/sar.dat 5 10<br />
Example 4.20 Example Command Line for sar<br />
This instructs sar to do the following.<br />
1. Record all types of events (-A).<br />
2. Store the events in the file /tmp/sar.dat.<br />
3. Record a sample at 5-second intervals.<br />
4. Record a total of 10 samples.<br />
When sar runs it will output data to the screen as well as to the data file, as<br />
shown in Example 4.21.<br />
$ sar -A -o /tmp/sar.dat 5 10<br />
Example 4.21 Output from sar as It Runs<br />
SunOS machinename 5.9 Generic_112233-01 sun4u 08/26/2003<br />
21:07:39 %usr %sys %wio %idle<br />
device %busy avque r+w/s blks/s avwait avserv<br />
runq-sz %runocc swpq-sz %swpocc<br />
bread/s lread/s %rcache bwrit/s lwrit/s %wcache pread/s pwrit/s<br />
swpin/s bswin/s swpot/s bswot/s pswch/s<br />
scall/s sread/s swrit/s fork/s exec/s rchar/s wchar/s<br />
iget/s namei/s dirbk/s<br />
rawch/s canch/s outch/s rcvin/s xmtin/s mdmin/s<br />
proc-sz ov inod-sz ov file-sz ov lock-sz<br />
msg/s sema/s<br />
atch/s pgin/s ppgin/s pflt/s vflt/s slock/s<br />
pgout/s ppgout/s pgfree/s pgscan/s %ufs_ipf<br />
freemem freeswap<br />
sml_mem alloc fail lg_mem alloc fail ovsz_alloc fail<br />
21:07:44 50 1 0 50<br />
fd0 0 0.0 0 0 0.0 0.0<br />
ssd0 0 0.0 0 0 0.0 0.0<br />
ssd0,a 0 0.0 0 0 0.0 0.0<br />
ssd0,b 0 0.0 0 0 0.0 0.0<br />
ssd0,c 0 0.0 0 0 0.0 0.0<br />
ssd0,h 0 0.0 0 0 0.0 0.0<br />
ssd1 0 0.0 0 0 0.0 0.0<br />
ssd1,a 0 0.0 0 0 0.0 0.0<br />
continues
66 <strong>Chapter</strong> 4 Informational Tools<br />
Example 4.21 Output from sar as It Runs (continued )<br />
ssd1,b 0 0.0 0 0 0.0 0.0<br />
ssd1,c 0 0.0 0 0 0.0 0.0<br />
ssd1,h 0 0.0 0 0 0.0 0.0<br />
0.0 0 0.0 0<br />
0 0 100 0 0 100 0 0<br />
0.00 0.0 0.00 0.0 99<br />
76 6 14 0.00 0.00 1550 2850<br />
0 0 0<br />
0 0 161 0 0 0<br />
65/30000 0 157574/157574 0 0/0 0 0/0<br />
0.00 0.00<br />
0.00 0.00 0.00 0.60 2.20 0.00<br />
0.00 0.00 0.00 0.00 0.00<br />
247682 17041644<br />
0 0 0 0 0 0 17858560 0<br />
Example 4.21 presents a lot of information. The text at the beginning supplies a<br />
template that indicates what the counters represent. The information is as follows.<br />
First it reports the time the system spent in user (%usr), system (%sys), waiting<br />
for block I/O (%wio), and idle (%idle).<br />
Next is a section for each device that reports the device name, percentage of<br />
time busy (%busy), average queue length while the device was busy (avque),<br />
number of reads and writes per second (r+w/s), number of 512-byte blocks<br />
transferred per second (blk/s), average wait time in ms (avwait), and average<br />
service time in ms (avserv).<br />
The length of the queue of runnable processes (runq_sz) and the percentage<br />
of time occupied (%runocc) are listed next. The fields swpq-sz and %swpocc<br />
no longer have values reported for them.<br />
Next is the number of transfers per second of buffers to disk or other block<br />
devices. Read transfers per second (bread/s), reads of system buffers<br />
(lread/s), cache hit rate for reads (%rcache), write transfers per second<br />
(bwrit/s), writes of system buffers (lwrit/s), cache hit rate for writes<br />
(%wcache), raw physical device reads (pread/s), and raw physical device<br />
writes (pwrit/s) are included.<br />
Swapping activity is recorded as the number of swap-ins per second (swpin/<br />
s), number of blocks of 512 bytes swapped in (bswin/s), number of swap-outs<br />
per second (swpot/s), number of 512-byte blocks swapped out (bswot/s),<br />
and number of process switches per second (pswch/s). The number of 512byte<br />
blocks transfered includes the loading of programs.<br />
System calls are reported as the total number of system calls per second<br />
(scall/s), number of read calls per second (sread/s), number of write calls
4.3 TOOLS THAT REPORT CURRENT SYSTEM STATUS 67<br />
per second (swrit/s), number of forks per second (fork/s), number of execs<br />
per second (exec/s), number of characters transferred by read (rchar/s),<br />
and number of characters transferred by write (wchar/s).<br />
Next is a report of file access system routines called per second. The number<br />
of files located by inode entry (iget/s), number of file system pathname<br />
searchs (namei/s), and number of directory block reads (dirbk/s) are<br />
included.<br />
TTY I/O reports stats on character I/O to the controlling terminal. This<br />
includes raw character rate (rawch/s), processed character rate (canch/s),<br />
output character rate (outch/s), receive rate (rcvin/s), transmit rate<br />
(xmtin/s), and modem interrupts per second (mdmin/s).<br />
Process, inode, file, and lock table sizes are reported as proc-sz, inod-sz,<br />
file-sz, and lock_sz. The associated overflow (ov) fields report the overflows<br />
that occur between samples for each table.<br />
The number of messages and semaphores per second is reported as msg/s<br />
and sema/s.<br />
Paging to memory is reported as the number of page faults per second that<br />
were satisfied by reclaiming a page from memory (atch/s), the number of<br />
page-in requests per second (pgin/s), the number of page-ins per second<br />
(ppgin/s), the number of copy on write page faults per second (pflt/s),<br />
the number of page not in memory faults per second (vflt/s), and the<br />
number of faults per second caused by software locks requiring physical I/O<br />
(slock/s).<br />
Paging to disk is reported as the number of requested page-outs per second<br />
(pgout/s), the number of page-outs per second (ppgout/s), the number of<br />
pages placed on the free list per second (pgfree/s), the number of pages<br />
scanned per second (pgscan/s), and the percentage of igets that required a<br />
page flush (%ufs_ipf).<br />
Free memory is reported as the average number of pages available to user<br />
processes (freemem), and the number of disk blocks available for swapping<br />
(freeswap).<br />
Kernel memory allocation is reported as a small memory pool of free memory<br />
(sml_mem), the number of bytes allocated from the small memory pool<br />
(alloc), and the number of requests for small memory that failed (fail).<br />
Similar counters exist for the large pool (lg_mem, alloc, fail). The amount<br />
of memory allocated for oversize requests is reported as ovsz_alloc, and the<br />
number of times this failed as fail.
68 <strong>Chapter</strong> 4 Informational Tools<br />
The command to read an existing sar output file is shown in Example 4.22.<br />
Example 4.22 Command Line to Instruct sar to Read an Existing Data File<br />
$ sar -A -f /tmp/sar.dat<br />
This asks sar to output all (-A) the information from the sar archive (/tmp/<br />
sar.dat). It is possible to request that sar output only a subset of counters.<br />
In the sar output shown in Example 4.21, it is apparent that the CPU is 50%<br />
busy (in fact, it is a two-CPU system, and one CPU is busy compiling an application),<br />
and that there is some character output and some read and write system<br />
calls. It is reasonably apparent that the system is CPU-bound, although it has<br />
additional CPU resources which could potentially be used to do more work.<br />
4.3.10 Reporting I/O Activity (iostat)<br />
The iostat utility is very similar to vmstat, except that it reports I/O activity<br />
rather than memory statistics.<br />
The first line of output from iostat is the activity since boot. Subsequent lines<br />
represent the activity over the time interval between reports. Example output<br />
from iostat is shown in Example 4.23.<br />
The information is as follows.<br />
Example 4.23 Example of iostat Output<br />
% iostat 1<br />
tty ssd0 ssd1 nfs1 nfs58 cpu<br />
tin tout kps tps serv kps tps serv kps tps serv kps tps serv us sy wt id<br />
0 2 17 1 90 22 1 45 0 0 0 0 0 27 20 1 0 79<br />
0 234 0 0 0 8 1 6 0 0 0 0 0 0 50 2 0 48<br />
0 80 0 0 0 0 0 0 0 0 0 0 0 0 50 0 0 50<br />
0 80 0 0 0 560 4 16 0 0 0 0 0 0 46 2 1 50<br />
0 80 0 0 0 352 4 13 0 0 0 0 0 0 48 8 0 44<br />
0 80 0 0 0 560 15 13 0 0 0 0 0 0 42 6 2 50<br />
The first two columns give the number of characters read (tin) and written<br />
(tout) for the tty devices.<br />
The next four sets of three columns give information for four disks. The kps<br />
column lists the number of kilobytes per second, tps the number of transfers<br />
per second, and serv the average service time in ms.<br />
CPU time is reported as a percentage in user (us), system (sy), waiting for I/O<br />
(wt), and idle (id).
4.3 TOOLS THAT REPORT CURRENT SYSTEM STATUS 69<br />
Another view of I/O statistics is provided by passing the -Cnx option to<br />
iostat. Output from this is shown in Example 4.24.<br />
In Example 4.24, each disk gets a separate row in the output. The output comprises<br />
the following columns:<br />
r/s: Reads per second<br />
w/s: Writes per second<br />
Example 4.24 Output from iostat -Cnx 1<br />
$ iostat -Cnx 1<br />
....<br />
extended device statistics<br />
r/s w/s kr/s kw/s wait actv wsvc_t asvc_t %w %b device<br />
0.0 25.0 0.0 594.0 0.0 0.3 0.0 12.7 0 4 c0<br />
0.0 0.0 0.0 0.0 0.0 0.0 0.0 0.0 0 0 c1<br />
0.0 0.0 0.0 0.0 0.0 0.0 0.0 0.0 0 0 c0t0d0<br />
0.0 25.0 0.0 594.0 0.0 0.3 0.0 12.7 0 8 c0t1d0<br />
0.0 0.0 0.0 0.0 0.0 0.0 0.0 0.0 0 0 c1t2d0<br />
...<br />
kr/s: Kilobytes read per second<br />
kw/s: Kilobytes written per second<br />
wait: Average number of transactions waiting for service<br />
actv: Average number of transactions actively being serviced<br />
wsvc_t: Average service time in wait queue, in milliseconds<br />
asvc_t: Average time actively being serviced, in milliseconds<br />
%w: Percentage of time the waiting queue is nonempty<br />
%b: Percentage of time the disk is busy<br />
device: The device that this applies to<br />
In the example shown in Example 4.24, the busy device is c0t1d0, which is<br />
writing out about 600KB/s from 25 writes (about 24KB/write), each write taking<br />
about 13 ms. The device is busy about 8% of the time and has an average of about<br />
0.3 writes going on at any one time.<br />
If a disk is continuously busy more than about 20% of the time, it is worth<br />
checking the average service time, or the time spent waiting in the queue, to<br />
ensure that these are low. Once the disk starts to become busy, the service times<br />
may increase significantly. If this is the case, it may be worth investigating<br />
whether to spread file activity over multiple disks. The iostat options -e and -E<br />
will report the errors that have occurred for each device since boot.
70 <strong>Chapter</strong> 4 Informational Tools<br />
4.3.11 Reporting Network Activity (netstat)<br />
netstat can provide a variety of different reports. The -s flag shows statistics per<br />
protocol. A sample of the output showing the statistics for the IPv4 protocol is<br />
shown in Example 4.25.<br />
Example 4.25 Example of netstat -s Output<br />
% netstat -s<br />
...<br />
IPv4 ipForwarding = 2 ipDefaultTTL = 255<br />
ipInReceives =8332869 ipInHdrErrors = 0<br />
ipInAddrErrors = 0 ipInCksumErrs = 0<br />
ipForwDatagrams = 0 ipForwProhibits = 0<br />
ipInUnknownProtos = 2 ipInDiscards = 0<br />
ipInDelivers =8316558 ipOutRequests =13089344<br />
ipOutDiscards = 0 ipOutNoRoutes = 0<br />
ipReasmTimeout = 60 ipReasmReqds = 0<br />
ipReasmOKs = 0 ipReasmFails = 0<br />
ipReasmDuplicates = 0 ipReasmPartDups = 0<br />
ipFragOKs = 0 ipFragFails = 0<br />
ipFragCreates = 0 ipRoutingDiscards = 0<br />
tcpInErrs = 0 udpNoPorts = 17125<br />
udpInCksumErrs = 0 udpInOverflows = 0<br />
rawipInOverflows = 0 ipsecInSucceeded = 0<br />
ipsecInFailed = 0 ipInIPv6 = 0<br />
ipOutIPv6 = 0 ipOutSwitchIPv6 = 213<br />
...<br />
You can obtain a report showing input and output from netstat -i; an example<br />
is shown in Example 4.26. This output shows the number of packets sent and<br />
received, the number of errors, and finally the number of collisions.<br />
Example 4.26 Example of netstat -i Output<br />
% netstat -i 1<br />
input eri0 output input (Total) output<br />
packets errs packets errs colls packets errs packets errs colls<br />
486408174 5 499073054 3 0 530744745 5 543409625 3 0<br />
5 0 9 0 0 12 0 16 0 0<br />
6 0 10 0 0 13 0 17 0 0<br />
6 0 10 0 0 14 0 18 0 0<br />
The collision rate is the number of collisions divided by the number of output<br />
packets. A value greater than about 5% to 10% may indicate a problem. Similarly,<br />
you can calculate error rates by dividing the number of errors by the total input or<br />
output packets. An error rate greater than about one-fourth of a percent may indicate<br />
a problem.
4.3 TOOLS THAT REPORT CURRENT SYSTEM STATUS 71<br />
4.3.12 The snoop command<br />
The snoop command, which you must run with superuser privileges, gathers<br />
information on the packets that are passed over the network. It is a very powerful<br />
way of examining what the network is doing, and consequently the command has a<br />
large number of options. In “promiscuous” mode, it gathers all packets that the<br />
local machine can see. In nonpromiscuous mode (enabled using the -P flag), it only<br />
gathers information on packages that are addressed to the local machine. It is also<br />
possible to gather a trace of the packets (using the -o flag) for later processing by<br />
the snoop command (using the -i flag). The packets collected (or examined) can<br />
be filtered in various ways, perhaps most usefully by the machines communicating,<br />
alternatively individual packets can be printed out. An example of the output<br />
from the snoop command is shown in Example 4.27.<br />
Example 4.27 Output from the snoop Command<br />
$ snoop<br />
Using device /dev/eri (promiscuous mode)<br />
here -> mc1 TCP D=1460 S=5901 Ack=2068723218 Seq=3477475694 Len=0 Win=50400<br />
here -> mc2 TCP D=2049 S=809 Ack=3715747853 Seq=3916150345 Len=0 Win=49640<br />
mc1 -> here TCP D=22 S=1451 Ack=3432082168 Seq=2253017191 Len=0 Win=33078<br />
...<br />
Note that snoop can capture and display unencrypted data being passed over<br />
the network. As such, use of this tool may have privacy, policy, or legal issues in<br />
some domains.<br />
4.3.13 Reporting Disk Space Utilization (df)<br />
The df command reports the amount of space used on the disk drives. Example<br />
output from the df command in shown in Example 4.28.<br />
Example 4.28 Example Output from the df Command<br />
% df -kl<br />
Filesystem kbytes used avail capacity Mounted on<br />
/dev/dsk/c0t1d0s0 3096423 1172450 1862045 39% /<br />
/proc 0 0 0 0% /proc<br />
mnttab 0 0 0 0% /etc/mnttab<br />
fd 0 0 0 0% /dev/fd<br />
swap 9475568 48 9475520 1% /var/run<br />
swap 9738072 262552 9475520 3% /tmp<br />
/dev/dsk/c0t1d0s7 28358357 26823065 1251709 96% /data<br />
/dev/dsk/c0t2d0s7 28814842 23970250 4556444 85% /export/home
72 <strong>Chapter</strong> 4 Informational Tools<br />
The -kl option tells df to report disk space in kilobytes (rather than as the number<br />
of 512-byte blocks), and to only report data for local drives. The columns are<br />
reasonably self-explanatory and include the name of the disk, the size, the amount<br />
used, the amount remaining, and the percentage amount used. The final column<br />
shows the mount point. In this example, both the /data and the /export/home<br />
file systems are running low on available space. On <strong>Solaris</strong> 9 and later there is a -h<br />
option to produce the output in a more human-readable format.<br />
4.3.14 Reporting Disk Space Used by Files (du)<br />
The du utility reports the disk space used by a given directory and its subdirectories.<br />
Once again, there is a -k option to report usage in kilobytes. On <strong>Solaris</strong> 9 and<br />
later, there is also a -h option to report in a human-readable format. Example output<br />
from the du command is shown in Example 4.29.<br />
% du -k<br />
8 ./.X11-unix<br />
8 ./.X11-pipe<br />
3704 .<br />
% du -h<br />
8K ./.X11-unix<br />
8K ./.X11-pipe<br />
3.6M .<br />
The du command in Example 4.29 reported that two directories consume 8KB<br />
each, and there is about 3.6MB of other data in the current directory.<br />
4.4 Process- and Processor-Specific Tools<br />
4.4.1 Introduction<br />
Example 4.29 Example of Output from the du Command<br />
This section covers tools that report the status of a particular process, or the<br />
events encountered by a particular processor.<br />
4.4.2 Timing Process Execution (time, timex, and ptime)<br />
The commands time, timex, and ptime all report the amount of time that a process<br />
uses. They all have the same syntax, as shown in Example 4.30. All three<br />
tools produce output showing the time a process spends in user code and system<br />
code, as well as reporting the elapsed time, or wall time, for the process. The wall
4.4 PROCESS- AND PROCESSOR-SPECIFIC TOOLS 73<br />
time is the time between when the process started and when it completed. A multithreaded<br />
process will typically report a combined user and system time that is<br />
greater than the wall time. The tools do differ in output format. The tool timex<br />
can be passed additional options that will cause it to report more information.<br />
% time <br />
Example 4.30 Syntax of the time Command<br />
4.4.3 Reporting System-Wide Hardware Counter Activity (cpustat)<br />
cpustat first shipped with <strong>Solaris</strong> 8. It is a tool for inspecting the hardware performance<br />
counters on all the processors in a system. The performance counters<br />
report events that occur to the processor. For example, one counter may be incremented<br />
every time data is fetched from memory, and another counter may be<br />
incremented every time an instruction is executed. The events that can be counted,<br />
and the number of events that can be counted simultaneously, are hardwaredependent.<br />
Opteron processors can typically count four different event types at the<br />
same time, whereas UltraSPARC processors typically only count two. We will discuss<br />
hardware performance counters in greater depth in <strong>Chapter</strong> 10.<br />
cpustat reports the number of performance counter events on a system-wide<br />
basis, hence it requires superuser permissions to run. So, if multiple programs are<br />
running, the reported values will represent the events encountered by all programs.<br />
If the system is running a mix of workloads, this information may not be of<br />
great value, but if the system is performing a single job, it is quite possible that<br />
this level of aggregation of data will provide useful information.<br />
Assume that the system is dedicated to a single task—the program of interest—and<br />
the program is in some kind of steady state (e.g., it is a Web server that<br />
is dealing with many incoming requests). The command line for cpustat, shown<br />
in Example 4.31, is appropriate for an UltraSPARC IIICu-based system. The output<br />
is a way of determining which performance counters are worth further investigation.<br />
Example 4.31 Sample Command Line for cpustat to Collect System-Wide Stats<br />
$ cpustat -c pic0=Dispatch0_IC_miss,pic1=Dispatch0_mispred,sys \<br />
-c pic0=Rstall_storeQ,pic1=Re_DC_miss,sys \<br />
-c pic0=EC_rd_miss,pic1=Re_EC_miss,sys \<br />
-c pic0=Rstall_IU_use,pic1=Rstall_FP_use,sys \<br />
-c pic0=Cycle_cnt,pic1=Re_PC_miss,sys \<br />
-c pic0=Instr_cnt,pic1=DTLB_miss,sys \<br />
-c pic0=Cycle_cnt,pic1=Re_RAW_miss,sys
74 <strong>Chapter</strong> 4 Informational Tools<br />
When the -c flag is passed to cpustat (and cputrack) it provides a pair of<br />
counters on which to collect. These are referred to as pic0 and pic1. More than 60<br />
event types are available to select from on the UltraSPARC IIICu processor, and<br />
two can be selected at once. Some of the event types are available on only one of<br />
the counters, so not every pairing is possible. The ,sys appended at the end of the<br />
pair of counter descriptions indicates that the counters should also be collected<br />
during system time. The counters are collected in rotation, so each pair of counters<br />
is collected for a short period of time. The default interval is five seconds.<br />
If the program is not in a steady state—suppose it reads some data from memory<br />
and then spends the next few seconds in intensive floating-point operations—it<br />
is quite possible that the coarse sampling used earlier will miss the interesting<br />
points (e.g., looking for cache misses during the floating-point-intensive code, and<br />
looking for floating-point operations when the data is being fetched from memory).<br />
Example 4.32 shows the command line for cputrack to rotate through a selection<br />
of performance counters, and partial output from the command.<br />
Example 4.32 Example of cpustat Output<br />
$ cpustat -c pic0=Rstall_storeQ,pic1=Re_DC_miss,sys \<br />
> -c pic0=EC_rd_miss,pic1=Re_EC_miss,sys \<br />
> -c pic0=Rstall_IU_use,pic1=Rstall_FP_use,sys \<br />
> -c pic0=Cycle_cnt,pic1=Re_PC_miss,sys \<br />
> -c pic0=Instr_cnt,pic1=DTLB_miss,sys \<br />
> -c pic0=Cycle_cnt,pic1=Re_RAW_miss,sys<br />
time cpu event pic0 pic1<br />
5.005 0 tick 294199 1036736 # pic0=Rstall_storeQ,pic1=Re_DC_miss,sys<br />
5.005 1 tick 163596 12604317 # pic0=Rstall_storeQ,pic1=Re_DC_miss,sys<br />
10.005 0 tick 5485 965974 # pic0=EC_rd_miss,pic1=Re_EC_miss,sys<br />
10.005 1 tick 76669 11598139 # pic0=EC_rd_miss,pic1=Re_EC_miss,sys<br />
...<br />
The columns of cpustat output shown in Example 4.32 are as follows.<br />
The first column reports the time of the sample. In this example, the samples<br />
are being taken every five seconds.<br />
The next column lists the CPU identifier. The samples are taken and reported<br />
for each CPU.<br />
The next column lists the type of event. For cpustat, the type of event is<br />
only going to be a tick.<br />
The next two columns list the counts for performance counters pic0 and<br />
pic1 since the last tick event.<br />
Finally, if cpustat is rotating through counters, the names of the counters<br />
are reported after the # sign.
4.4 PROCESS- AND PROCESSOR-SPECIFIC TOOLS 75<br />
4.4.4 Reporting Hardware Performance Counter Activity for a<br />
Single Process (cputrack)<br />
cputrack first shipped with <strong>Solaris</strong> 8. It is another tool that reports the number<br />
of performance counter events. However, cputrack has the advantages of collecting<br />
events only for the process of interest and reporting the total number of such<br />
events at the end of the run. This makes it very useful for situations in which the<br />
application starts, does something, and then exits.<br />
The script in Example 4.33 shows one way that cputrack might be invoked on<br />
a process.<br />
Example 4.33 Script for Invoking cputrack on an <strong>Application</strong><br />
$ cputrack -c pic0=Dispatch0_IC_miss,pic1=Dispatch0_mispred,sys \<br />
-c pic0=Rstall_storeQ,pic1=Re_DC_miss,sys \<br />
-c pic0=EC_rd_miss,pic1=Re_EC_miss,sys \<br />
-c pic0=Rstall_IU_use,pic1=Rstall_FP_use,sys \<br />
-c pic0=Cycle_cnt,pic1=Re_PC_miss,sys \<br />
-c pic0=Instr_cnt,pic1=DTLB_miss,sys \<br />
-c pic0=Cycle_cnt,pic1=Re_RAW_miss,sys \<br />
-o \<br />
<br />
The script in Example 4.33 demonstrates how to use cputrack to rotate<br />
through the counters and capture data about the run of an application. The same<br />
caveat applies as for cpustat: Rotating through counters may miss the events of<br />
interest. An alternative way to invoke cputrack is to give it just a single pair of<br />
counters. The example in Example 4.34 shows this.<br />
Example 4.34 Example of cputrack on a Single Pair of Counters<br />
$ cputrack -c pic0=Cycle_cnt,pic1=Re_DC_miss testcode<br />
time lwp event pic0 pic1<br />
1.118 1 tick 663243149 14353162<br />
2.128 1 tick 899742583 9706444<br />
3.118 1 tick 885525398 7786122<br />
3.440 1 exit 2735203660 33964190<br />
The output in Example 4.34 shows a short program that runs for three seconds.<br />
cputrack has counted the number of processor cycles consumed by the application<br />
using counter 0, and the number of data-cache miss events using counter 1;<br />
both numbers are per second, except for the line marked “exit,” which contains the<br />
total counts over the entire run. The columns in the output are as follows.
76 <strong>Chapter</strong> 4 Informational Tools<br />
time: The time at which the sample was taken. In this case, the samples<br />
were taken at one-second intervals.<br />
lwp: The LWP that is being sampled. If the -f option is passed to cputrack,<br />
it will follow child processes. In this mode, data from other LWPs will be<br />
interleaved.<br />
event: The event type, such as ticks or the exit line. Each tick event is the<br />
number of events since the last tick. The exit line occurs when a process exits,<br />
and it reports the total number of events that occurred over the duration of the<br />
run. The event line also reports data at points where the process forks or joins.<br />
pic0 and pic1: The last two columns report the number of events for the<br />
two performance counters. If cputrack were rotating through performance<br />
counters, the names of the performance counters would be reported<br />
after a # sign.<br />
It is also possible to attach cputrack to a running process. The option for this is<br />
-p , and cputrack will report the events for that process.<br />
4.4.5 Reporting Bus Activity (busstat)<br />
The busstat tool reports performance counter events for the system bus. The<br />
available performance counters are system-dependent. The -l option lists the<br />
devices that have performance counter statistics available. The -e option will<br />
query what events are available on a particular device.<br />
The currently set performance counters can be read using the -r option. To<br />
select particular performance counters it is necessary to use the -w option, but this<br />
requires superuser privileges. An example of using busstat to measure memory<br />
activity on an UltraSPARC T1-based system is shown in Example 4.35.<br />
Example 4.35 Using busstat to Query Memory Activity on an UltraSPARC T1<br />
# busstat -l<br />
Busstat Device(s):<br />
dram0 dram1 dram2 dram3 jbus0<br />
# busstat -e dram0<br />
pic0<br />
mem_reads<br />
mem_writes<br />
....<br />
pic1<br />
mem_reads<br />
mem_writes<br />
...<br />
# busstat -w dram0,pic0=mem_reads,pic1=mem_writes<br />
time dev event0 pic0 event1 pic1<br />
1 dram0 mem_reads 45697 mem_writes 8775<br />
2 dram0 mem_reads 37827 mem_writes 3767
4.4 PROCESS- AND PROCESSOR-SPECIFIC TOOLS 77<br />
4.4.6 Reporting on Trap Activity (trapstat)<br />
trapstat is a SPARC-only tool that first shipped with <strong>Solaris</strong> 9 and enables you<br />
to look at the number of traps the kernel is handling. It counts the number of traps<br />
on a system-wide basis, hence it requires superuser privileges. For example, it is a<br />
very useful tool for looking at TLB misses on the UltraSPARC II. Example 4.36<br />
shows output from trapstat.<br />
vct name | cpu0<br />
------------------------+---------<br />
20 fp-disabled | 6<br />
24 cleanwin | 31<br />
41 level-1 | 4<br />
44 level-4 | 0<br />
46 level-6 | 2<br />
49 level-9 | 1<br />
4a level-10 | 100<br />
4e level-14 | 101<br />
60 int-vec | 3<br />
64 itlb-miss | 3<br />
68 dtlb-miss | 144621<br />
6c dtlb-prot | 0<br />
84 spill-user-32 | 0<br />
8c spill-user-32-cln | 0<br />
98 spill-kern-64 | 612<br />
a4 spill-asuser-32 | 0<br />
ac spill-asuser-32-cln | 199<br />
c4 fill-user-32 | 0<br />
cc fill-user-32-cln | 70<br />
d8 fill-kern-64 | 604<br />
108 syscall-32 | 26<br />
Example 4.36 Sample Output from trapstat<br />
In the output shown in Example 4.36, a number of data TLB traps are occurring.<br />
This is the number per second, and 144,000 per second is not an unusually<br />
high number. Each trap takes perhaps 100 ns, so this corresponds to a few milliseconds<br />
of real time. We discussed TLB misses in greater detail in Section 4.2.6.<br />
A high rate of any trap is a cause for concern. The traps that most often have<br />
high rates are TLB misses (either instruction [itlb-miss] or data [dtlb-miss]),<br />
and spill and fill traps.<br />
Spill and fill traps indicate that the code is making many calls to routines, and<br />
each call may make further subcalls before returning (think of the program having<br />
to run up and then down a flight of stairs for each function call and its corresponding<br />
return). Each time the processor makes a call, it needs a fresh register<br />
window. When no register window is available, the processor will trap so that the<br />
operating system can provide one. I discussed register windows in Section 2.3.3 of<br />
<strong>Chapter</strong> 2. It may be possible to avoid this by either compiling with crossfile optimizations<br />
enabled (as discussed in Section 5.7.2 of <strong>Chapter</strong> 5), or restructuring the<br />
code so that each call will do more work.
78 <strong>Chapter</strong> 4 Informational Tools<br />
It is possible to make trapstat run on a single process. The command line for<br />
this is shown in Example 4.37.<br />
Example 4.37 Command Line to Run trapstat on a Single Program<br />
# trapstat <br />
At the end of the run of the process, this will report the number of traps that the<br />
single process caused. The figures will be reported (by default) as the number of<br />
traps per second.<br />
4.4.7 Reporting Virtual Memory Mapping Information for a<br />
Process (pmap)<br />
The pmap utility returns information about the address space of a given process.<br />
Possibly the most useful information the utility returns is information about the<br />
page size mapping returned under the -s option.<br />
Example 4.38 shows a sample of output from the pmap utility under the -s<br />
option. The output is useful in that it shows where the code and data are located in<br />
memory, as well as where the libraries are located in memory. For each memory<br />
range, a page size is listed in the Pgsz column. In this case, all the memory has<br />
been allocated on 8KB pages (I discussed page sizes in Section 1.9.2 of <strong>Chapter</strong> 1).<br />
Output from pmap is the best way to determine whether an application has successfully<br />
obtained large pages.<br />
Example 4.38 pmap -s Output<br />
% pmap -s 7962<br />
7962: ./myapp params<br />
Address Kbytes Pgsz Mode Mapped File<br />
00010000 272K 8K r-x-- /export/home/myapp<br />
00054000 80K - r-x-- /export/home/myapp<br />
00068000 32K 8K r-x-- /export/home/myapp<br />
0007E000 48K 8K rwx-- /export/home/myapp<br />
...<br />
000D2000 2952K 8K rwx-- [ heap ]<br />
...<br />
004D4000 1984K 8K rwx-- [ heap ]<br />
006C4000 8K - rwx-- [ heap ]<br />
006C6000 50944K 8K rwx-- [ heap ]<br />
...<br />
FF210000 8K 8K r-x-- /usr/platform/sun4u-us3/lib/libc_psr.so.1<br />
FF220000 32K 8K r-x-- /opt/SUNWspro/prod/usr/lib/libCrun.so.1<br />
...
4.4 PROCESS- AND PROCESSOR-SPECIFIC TOOLS 79<br />
The page size for an application can be controlled at runtime (see Section 4.2.6)<br />
or at compile time (see Section 5.8.6 of <strong>Chapter</strong> 5).<br />
4.4.8 Examining Command-Line Arguments Passed to<br />
Process (pargs)<br />
The pargs command reports the arguments passed to a process. The command<br />
takes either a pid or a core file. An example of this command is shown in<br />
Example 4.39.<br />
$ sleep 60&<br />
[1] 18267<br />
$ pargs 18267<br />
18267: sleep 60<br />
argv[0]: sleep<br />
argv[1]: 60<br />
Example 4.39 Example of pargs<br />
4.4.9 Reporting the Files Held Open by a Process (pfiles)<br />
The pfiles utility reports the files that a given pid has currently opened,<br />
together with information about the file’s attributes. An example of the output<br />
from this command is shown in Example 4.40.<br />
Example 4.40 Output from pfiles<br />
% pfiles 7093<br />
7093: -csh<br />
Current rlimit: 256 file descriptors<br />
0: S_IFCHR mode:0666 dev:118,32 ino:3422 uid:0 gid:3 rdev:13,2<br />
O_RDONLY|O_LARGEFILE<br />
1: S_IFCHR mode:0666 dev:118,32 ino:3422 uid:0 gid:3 rdev:13,2<br />
O_RDONLY|O_LARGEFILE<br />
2: S_IFCHR mode:0666 dev:118,32 ino:3422 uid:0 gid:3 rdev:13,2<br />
O_RDONLY|O_LARGEFILE<br />
...<br />
4.4.10 Examining the Current Stack of Process (pstack)<br />
The pstack tool prints out the stack dump from either a running process or a core<br />
file. An example of using this tool to print the stack of the sleep command is<br />
shown in Example 4.41. This tool is often useful in determining whether an application<br />
is still doing useful computation or whether it has hit a point where it is<br />
making no further progress.
80 <strong>Chapter</strong> 4 Informational Tools<br />
Example 4.41 Output from pstack<br />
% sleep 10 &<br />
[1] 4556<br />
% pstack 4556<br />
4556: sleep 10<br />
ff31f448 sigsuspend (ffbffaa8)<br />
00010a28 main (2, ffbffbdc, ffbffbe8, 20c00, 0, 0) + 120<br />
000108f0 _start (0, 0, 0, 0, 0, 0) + 108<br />
4.4.11 Tracing <strong>Application</strong> Execution (truss)<br />
truss is a useful utility for looking at the calls from an application to the operating<br />
system, calls to libraries, or even calls within an application. Example 4.42<br />
shows an example of running the application ls under the truss command.<br />
Example 4.42 Output of the truss Command Running on ls<br />
$ truss ls<br />
execve("/usr/bin/ls", 0xFFBFFBE4, 0xFFBFFBEC) argc = 1<br />
mmap(0x00000000, 8192, PROT_READ|PROT_WRITE|PROT_EXEC,<br />
MAP_PRIVATE|MAP_ANON, -1, 0) = 0xFF3B0000<br />
resolvepath("/usr/bin/ls", "/usr/bin/ls", 1023) = 11<br />
resolvepath("/usr/lib/ld.so.1", "/usr/lib/ld.so.1", 1023) = 16<br />
stat("/usr/bin/ls", 0xFFBFF9C8) = 0<br />
open("/var/ld/ld.config", O_RDONLY) Err#2 ENOENT<br />
open("/usr/lib/libc.so.1", O_RDONLY) = 3<br />
fstat(3, 0xFFBFF304) = 0<br />
....<br />
When an application is run under truss the tool reports every call the operating<br />
system made. This can be very useful when trying to determine what an application<br />
is doing. The -f flag will cause truss to follow forked processes.<br />
When truss is run with the -c flag it will provide a count of the number of<br />
calls made, as well as the total time accounted for by these calls. Example 4.43<br />
shows the same ls command run, but this time only the count of the number of<br />
calls is collected.<br />
Example 4.43 Call Count for the ls Command Using truss<br />
$ truss -c ls<br />
syscall seconds calls errors<br />
_exit .000 1<br />
write .000 35<br />
open .000 7 3<br />
close .000 4<br />
time .000 1<br />
brk .000 10
4.4 PROCESS- AND PROCESSOR-SPECIFIC TOOLS 81<br />
Example 4.43 Call Count for the ls Command Using truss (continued )<br />
stat .000 1<br />
fstat .000 3<br />
ioctl .000 3<br />
execve .000 1<br />
fcntl .000 1<br />
mmap .000 7<br />
munmap .000 1<br />
memcntl .000 1<br />
resolvepath .000 5<br />
getdents64 .000 3<br />
lstat64 .000 1<br />
fstat64 .000 2<br />
-------- ------ ---sys<br />
totals: .002 87 3<br />
usr time: .001<br />
elapsed: .020<br />
It is also possible to run truss on an existing process. This will generate the same<br />
output as invoking truss on the process initially. This is useful for checking whether<br />
a process is still doing something. Example 4.44 shows the command line to do this.<br />
$ truss -p <br />
Example 4.44 Attaching truss to an Existing Process<br />
It is also possible to use truss to print out the calls within an application. The -u<br />
flag takes the names of the libraries of interest, or a.out to represent the application.<br />
The tool will then report calls made by these modules, as shown in Example 4.45.<br />
Example 4.45 truss Used to Show Calls Made within an <strong>Application</strong><br />
% truss -u a.out bzip2<br />
execve("bzip2", 0xFFBFFB84, 0xFFBFFB8C) argc = 1<br />
-> atexit(0x2be04, 0x44800, 0x0, 0x0)<br />
-> mutex_lock(0x456e8, 0x0, 0x0, 0x0)<br />
-> _return_zero(0x456e8, 0x0, 0x0, 0x0)<br />
mutex_unlock(0x456e8, 0x1, 0x0, 0x0)<br />
-> _return_zero(0x456e8, 0x1, 0x0, 0x0)<br />
_check_threaded(0x44a68, 0x0, 0x0, 0x0)<br />
-> thr_main(0x0, 0x0, 0x0, 0x0)<br />
-> _return_negone(0x0, 0x0, 0x0, 0x0)<br />
82 <strong>Chapter</strong> 4 Informational Tools<br />
4.4.12 Exploring User Code and Kernel Activity with dtrace<br />
The dtrace utility is part of <strong>Solaris</strong> 10, and it offers an unprecedented view into the<br />
behavior of user code and system code. Using dtrace, it is possible to count the<br />
number of times a routine gets called, time how long a routine takes, examine the<br />
parameters that are passed into a routine, and even find out what a routine was<br />
doing when a given event happened. All of this makes it a very powerful tool, but to<br />
describe it in sufficient detail is beyond the scope of this book. A simple example of<br />
the use of dtrace is shown in Example 4.46. This script counts the number of calls<br />
to malloc, and for each call it records the size of the memory requested.<br />
Example 4.46 dtrace Script to Count the Calls to malloc<br />
#!/usr/sbin/dtrace -s<br />
pid$target:libc.so:malloc:entry<br />
{<br />
@proc[probefunc]=count();<br />
@array[probefunc]=quantize(arg0);<br />
}<br />
END<br />
{<br />
printa(@proc);<br />
printa(@array);<br />
}<br />
The output from this script, when run on the command ls, is shown in<br />
Example 4.47. The output shows that malloc is called 15 times, and displays a<br />
histogram of the requested memory sizes.<br />
Example 4.47 Number and Size of Calls to malloc by ls<br />
# ./malloc.d -c ls<br />
dtrace: script './malloc.d' matched 2 probes<br />
...<br />
dtrace: pid 3645 has exited<br />
CPU ID FUNCTION:NAME<br />
16 2 :END<br />
malloc 15<br />
malloc<br />
value ------------- Distribution ------------- count<br />
4 | 0<br />
8 |@@@@@ 2<br />
16 |@@@@@@@@@@@@@@@@ 6<br />
32 |@@@ 1<br />
64 |@@@@@@@@ 3<br />
128 | 0
4.4 PROCESS- AND PROCESSOR-SPECIFIC TOOLS 83<br />
Example 4.47 Number and Size of Calls to malloc by ls (continued )<br />
256 |@@@@@ 2<br />
512 | 0<br />
1024 | 0<br />
2048 | 0<br />
4096 | 0<br />
8192 | 0<br />
16384 | 0<br />
32768 |@@@ 1<br />
65536 | 0<br />
Once the sizes of the memory requests have been determined, it may also be<br />
interesting to find out where the memory requests are being made. The script<br />
shown in Example 4.48 captures the call stack for the calls to malloc.<br />
Example 4.48 Capturing the User Call Stack for Calls to malloc<br />
#!/usr/sbin/dtrace -s<br />
pid$target:libc.so:malloc:entry<br />
{<br />
@stack[ustack(5)]=count();<br />
@array[probefunc]=quantize(arg0);<br />
}<br />
END<br />
{<br />
printa(@stack);<br />
printa(@array);<br />
}<br />
An example of running the script to capture the call stack of calls to malloc is<br />
shown in Example 4.49.<br />
Example 4.49 Call Stack for malloc Requests Made by the Compiler<br />
# ./malloc_stack.d -c "cc -O an.c"<br />
dtrace: script './malloc_stack.d' matched 2 probes<br />
dtrace: pid 4063 has exited<br />
CPU ID FUNCTION:NAME<br />
6 2 :END<br />
...<br />
cc`malloc<br />
libc.so.1`calloc+0x58<br />
cc`stralloc+0x8<br />
cc`str_newcopy+0xc<br />
cc`addopt+0x88<br />
154<br />
continues
84 <strong>Chapter</strong> 4 Informational Tools<br />
Example 4.49 Call Stack for malloc Requests Made by the Compiler (continued )<br />
malloc<br />
value ------------- Distribution ------------- count<br />
0 | 0<br />
1 | 2<br />
2 |@@@ 21<br />
4 |@@@@@@ 52<br />
8 |@@@@@@@@@@@ 88<br />
16 |@@@@@@@@ 65<br />
32 |@@@@@@ 52<br />
64 |@@@@@ 44<br />
128 |@ 5<br />
256 | 2<br />
512 | 1<br />
1024 | 0<br />
4.5 Information about <strong>Application</strong>s<br />
4.5.1 Reporting Library Linkage (ldd)<br />
The ldd utility reports the shared libraries that are linked into an application.<br />
This is useful for acquiring information, but it should not have any effect on performance<br />
(unless the wrong version of a library is selected somehow).<br />
The output in Example 4.50 shows the library the application is searching for on<br />
the left, and the library that has been located on the right.<br />
Example 4.50 Output from ldd Showing the Linking of a Particular <strong>Application</strong><br />
$ ldd ap27<br />
libm.so.1 => /usr/lib/libm.so.1<br />
libc.so.1 => /usr/lib/libc.so.1<br />
/usr/platform/SUNW,Sun-Blade-2500/lib/libc_psr.so.1<br />
Passing the -r option to ldd will cause it to check both the objects that are<br />
linked into the application and the particular function calls that are required. It<br />
will report whether the application is missing a library, and it will report the functions<br />
that are missing.<br />
The output shown in Example 4.51 is from the -r option passed to ldd. There<br />
are two items of interest. First, ldd reports that it is unable to locate the libsunmath<br />
library, which is Sun’s library of additional mathematical functions. Under<br />
this option, ldd reports the two function calls that it is unable to locate, and these<br />
function calls correspond to square root calls for single-precision floating-point,<br />
and for long integers.
4.5 INFORMATION ABOUT APPLICATIONS 85<br />
Example 4.51 The -r Option for ldd<br />
$ ldd -r someapp<br />
libdl.so.1 => /usr/lib/libdl.so.1<br />
libnsl.so.1 => /usr/lib/libnsl.so.1<br />
libgen.so.1 => /usr/lib/libgen.so.1<br />
libm.so.1 => /usr/lib/libm.so.1<br />
libc.so.1 => /usr/lib/libc.so.1<br />
libsocket.so.1 => /usr/lib/libsocket.so.1<br />
libsunmath.so.1 => (file not found)<br />
libelf.so.1 => /usr/lib/libelf.so.1<br />
libmp.so.2 => /usr/lib/libmp.so.2<br />
/usr/platform/SUNW,Sun-Blade-1000/lib/libc_psr.so.1<br />
symbol not found: sqrtf<br />
(someapp)<br />
symbol not found: sqrtl<br />
(someapp)<br />
The paths where libraries are located are hard-coded into the application at link<br />
time. I will cover the procedure for doing this in more detail in Section 7.2.6 of<br />
<strong>Chapter</strong> 7. At runtime, it is possible to use the LD_LIBRARY_PATH environment<br />
variable to override where the application finds libraries, or to assist the application<br />
in locating a particular library. So, for the case in Example 4.51, if the LD_<br />
LIBRARY_PATH variable were set to point to a directory containing libsunmath.so,<br />
ldd would report that the application used that version of the library.<br />
Example 4.52 shows an example of setting the LD_LIBRARY_PATH environment<br />
variable under csh. Of course, you can use the same environment variable to<br />
change where the application loads all its libraries from, so be careful when setting<br />
it and do not rely on it as the default mechanism to enable an application<br />
locating its libraries at deployment.<br />
Example 4.52 Example of Setting the LD_LIBRARY_PATH Variable<br />
$ setenv LD_LIBRARY_PATH /export/home/my_libraries/<br />
The LD_LIBRARY_PATH environment variable will override the search path for<br />
both 32-bit and 64-bit applications. To explicitly set search paths for these two<br />
application types you can use the environment variables LD_LIBRARY_PATH_32<br />
and LD_LIBRARY_PATH_64.<br />
It is also possible to set the LD_PRELOAD environment variable to specify a<br />
library that is to be loaded before the application. This enables the use of a different<br />
library in addition to the one shipped with the application. This can be a useful<br />
way to debug the application’s interactions with libraries. I will cover this in<br />
more detail in Section 7.2.10 of <strong>Chapter</strong> 7.
86 <strong>Chapter</strong> 4 Informational Tools<br />
The -u option will request that ldd report any libraries that are linked to the<br />
application but not used. In Example 4.53, both libm (the math library) and<br />
libsocket (the sockets library) are linked into the application but not actually<br />
used.<br />
Example 4.53 Example of ldd -u to Check for Unused Libraries<br />
$ ldd -u ./myapp<br />
libdl.so.1 => /usr/lib/libdl.so.1<br />
libnsl.so.1 => /usr/lib/libnsl.so.1<br />
libm.so.1 => /usr/lib/libm.so.1<br />
libc.so.1 => /usr/lib/libc.so.1<br />
libsocket.so.1 => /usr/lib/libsocket.so.1<br />
/usr/platform/SUNW,Sun-Blade-1000/lib/libc_psr.so.1<br />
unused object=/usr/lib/libm.so.1<br />
unused object=/usr/lib/libsocket.so.1<br />
Another useful option for ldd is the -i flag. This requests that ldd report the<br />
order in which the libraries will be initialized. The output from ldd shown in<br />
Example 4.54 indicates that libc is initialized first, and libsocket is initialized<br />
last.<br />
Example 4.54 Example of ldd -i Output<br />
$ ldd -i ./thisapp<br />
libdl.so.1 => /usr/lib/libdl.so.1<br />
libnsl.so.1 => /usr/lib/libnsl.so.1<br />
libm.so.1 => /usr/lib/libm.so.1<br />
libc.so.1 => /usr/lib/libc.so.1<br />
libsocket.so.1 => /usr/lib/libsocket.so.1<br />
libmp.so.2 => /usr/lib/libmp.so.2<br />
/usr/platform/SUNW,Sun-Blade-1000/lib/libc_psr.so.1<br />
init object=/usr/lib/libc.so.1<br />
init object=/usr/lib/libmp.so.2<br />
init object=/usr/lib/libnsl.so.1<br />
init object=/usr/lib/libsocket.so.1<br />
4.5.2 Reporting the Type of Contents Held in a File (file)<br />
The file tool reports on the type of a particular file. It can be useful for situations<br />
when it is necessary to check whether a particular application is a script<br />
wrapper for the actual real application, or the real application. Another way this<br />
tool can help is in determining on what type of processor a given application will<br />
run. Recall that the isalist tool from Section 4.2.5 reported the processor’s architecture;<br />
the file tool will report the architecture an application requires. For a
4.5 INFORMATION ABOUT APPLICATIONS 87<br />
given application to run on a particular machine, the processor needs to support<br />
the application’s architecture.<br />
Example 4.55 shows file being run on an application. The binary is 32-bit and<br />
requires at least a v8plus architecture to run.<br />
Example 4.55 Example of Running file on an <strong>Application</strong><br />
$ file a.out<br />
a.out: ELF 32-bit MSB executable SPARC32PLUS Version 1, V8+ Required, dynamically<br />
linked, not stripped<br />
The file command is often useful when examining files or libraries to determine<br />
why linking failed with an error reporting an attempt to link 32-bit and 64bit<br />
objects.<br />
4.5.3 Reporting Symbols in a File (nm)<br />
The nm tool reports the symbols defined inside a library, object file, or executable.<br />
Typically, this tool will dump out a lot of information. The useful information is<br />
usually the names of routines defined in the file, and the names of routines the file<br />
requires. If the file has been stripped (using the strip utility), no information is<br />
reported. A snippet of example output from nm is shown in Example 4.56.<br />
Example 4.56 Short Sample of Output from nm<br />
$ nm a.out<br />
a.out:<br />
[Index] Value Size Type Bind Other Shndx Name<br />
[45] | 133144| 4|OBJT |WEAK |0 |15 |environ<br />
[60] | 132880| 0|FUNC |GLOB |0 |UNDEF |exit<br />
[37] | 67164| 40|FUNC |LOCL |0 |8 |foo<br />
[53] | 67204| 48|FUNC |GLOB |0 |8 |main<br />
[42] | 132904| 0|FUNC |GLOB |0 |UNDEF |printf<br />
...<br />
The output from nm shown in Example 4.56 indicates that a.out defines a couple<br />
of routines, such as main and foo, but depends on libraries to provide the routines<br />
exit and printf.<br />
4.5.4 Reporting Library Version Information (pvs)<br />
It is possible to define multiple versions of a library in a single library file. This<br />
is an important mechanism to allow older applications to run with newer versions
88 <strong>Chapter</strong> 4 Informational Tools<br />
of a library. The older library API is still available, and the older applications<br />
will link to these versions. The newer API is also present, and the newer applications<br />
will link to this.<br />
The pvs utility prints out information about the functions and versions of those<br />
functions that a library exports, or the library versions that a library or executable<br />
requires. By default, pvs will report both the definitions in the library and the<br />
requirements of the library.<br />
Example 4.57 shows pvs reporting the versions of the libraries that the ls executable<br />
requires.<br />
Example 4.57 Libraries Required by the ls Command<br />
% pvs /bin/ls<br />
libc.so.1 (SUNW_1.19, SUNWprivate_1.1);<br />
The -r option, for displaying only the requirements of the file, can be used to<br />
show that libc.so.1 requires libdl.so.1, as demonstrated in Example 4.58.<br />
Example 4.58 Requirements of libc.so.1<br />
% pvs -r /usr/lib/libc.so.1<br />
libdl.so.1 (SUNW_1.4, SUNWprivate_1.1);<br />
The -d option shows the versions defined in the library. Example 4.59 shows<br />
part of the output of the versions defined in libc.so.1.<br />
% pvs -d /usr/lib/libc.so.1<br />
libc.so.1;<br />
SUNW_1.21.2;<br />
SUNW_1.21.1;<br />
SUNW_1.21;<br />
SUNW_1.20.4;<br />
....<br />
Example 4.59 Versions Defined in libc.so.1
4.5 INFORMATION ABOUT APPLICATIONS 89<br />
It is also possible to list the symbols defined in a library using the -s flag. Part<br />
of the output of this for libdl.so.1 is shown in Example 4.60.<br />
Example 4.60 Versions of Functions Exported by libdl.so.1<br />
$ pvs -ds /usr/lib/libdl.so.1<br />
libdl.so.1:<br />
_DYNAMIC;<br />
_edata;<br />
_etext;<br />
_end;<br />
_PROCEDURE_LINKAGE_TABLE_;<br />
SUNW_1.4:<br />
dladdr1;<br />
SUNW_1.3:<br />
SUNW_1.2:<br />
SUNW_1.1:<br />
dlmopen;<br />
dldump;<br />
dlinfo;<br />
...<br />
4.5.5 Examining the Disassembly of an <strong>Application</strong>, Library, or<br />
Object (dis)<br />
The dis utility will disassemble libraries, applications, and object files. An example<br />
of this is shown in Example 4.61.<br />
$ /usr/ccs/bin/dis a.out<br />
**** DISASSEMBLER ****<br />
disassembly for a.out<br />
Example 4.61 Example of Using dis<br />
section .text<br />
_start()<br />
10694: bc 10 20 00 clr %fp<br />
10698: e0 03 a0 40 ld [%sp + 0x40], %l0<br />
1069c: 13 00 00 83 sethi %hi(0x20c00), %o1<br />
106a0: e0 22 61 8c st %l0, [%o1 + 0x18c]<br />
106a4: a2 03 a0 44 add %sp, 0x44, %l1<br />
...
90 <strong>Chapter</strong> 4 Informational Tools<br />
4.5.6 Reporting the Size of the Various Segments in an <strong>Application</strong>,<br />
Library, or Object (size)<br />
The size utility prints the size in bytes of the various segments in an application,<br />
library, or object file. When used without parameters the command reports the size<br />
of the text (executable code), data (initialized data), and bss (uninitialized data).<br />
The -f flag reports the name of each allocatable segment together with its size in<br />
bytes. The -n flag also reports the nonloadable segments (these segments contain<br />
metadata such as debug information). An example is shown in Example 4.62.<br />
Example 4.62 Using the size Command<br />
% size a.out<br />
3104 + 360 + 8 = 3472<br />
% size -fn a.out<br />
17(.interp) + 304(.hash) + 592(.dynsym) + 423(.dynstr) + 48(.SUNW_version) +<br />
12(.rela.data) + 72(.rela.plt) + 1388(.text) + 16(.init) + 12(.fini) + 4(.rodata) +<br />
4(.got) + 124(.plt) + 184(.dynamic) + 48(.data) + 8(.bss) + 1152(.symtab) +<br />
525(.strtab) + 248(.debug_info) + 53(.debug_line) + 26(.debug_abbrev) + 650(.comment) +<br />
184(.shstrtab) = 6094<br />
4.5.7 Reporting Metadata Held in a File (dumpstabs, dwarfdump,<br />
elfdump, dump, and mcs)<br />
It is possible to extract information about how an application was built using the<br />
dumpstabs utility, which is shipped with the compiler. This utility reports a lot of<br />
information, but the most useful is the command line that was passed to the compiler.<br />
Two other utilities serve a similar purpose: dwarfdump, which reports the<br />
data for applications built with the dwarf debug format, and elfdump which<br />
reports similar information for object files. All three utilities can take various flags<br />
to specify the level of detail, but by default, dumpstabs and elfdump print out all<br />
information, whereas dwarfdump does not report anything for versions earlier<br />
than Sun Studio 11 (in these cases, use the -a flag to print all the information).<br />
<strong>Application</strong>s built with the Sun Studio 10 compiler (and earlier) default to the<br />
stabs format, so dumpstabs is the appropriate command to use. In Sun Studio 11,<br />
the C compiler switched to using dwarf format. In Sun Studio 12, all the compilers<br />
default to using dwarf format.<br />
Example 4.63 shows an example of building a file using Sun Studio 10, and then<br />
using dumpstabs and grep to extract the compile line used to build the file. In<br />
general, a lot of information is reported by dumpstabs, so passing the output<br />
through grep and searching for either the name of the file or the CMDLINE marker<br />
will reduce the output substantially.
4.5 INFORMATION ABOUT APPLICATIONS 91<br />
Example 4.63 Example of Searching for the Command Line for a Compiler<br />
Using Sun Studio 10<br />
$ cc -fast -o test test.c<br />
$ dumpstabs test | grep test.c<br />
36: test.c 00000000 00000000 LOCAL FILE ABS<br />
0: .stabs "test.c",N_UNDF,0x0,0x3,0xb8<br />
2: .stabs "/export/home; /opt/SUNWspro/prod/bin/cc -fast -c test.c",N_CMD-<br />
LINE,0x0,0x0,0x0<br />
A similar set of actions for Sun Studio 11 and dwarfdump is shown in<br />
Example 4.64.<br />
Example 4.64 Example of Searching for the Command Line for a Compiler<br />
Using Sun Studio 11<br />
$ cc -fast -o test test.c<br />
$ dwarfdump test | grep command_line<br />
DW_AT_SUN_command_line /opt/SUNWspro/prod/bin/cc -fast -c test.c<br />
< 13> DW_AT_SUN_command_line DW_FORM_string<br />
It is also possible to use the dump command with the -sv option to extract most<br />
of the information from an executable. This will dump all the sections in an executable,<br />
printing those that are text in text format and the other sections as hexadecimal.<br />
An example of the output from dump is shown in Example 4.65. The actual<br />
output from the command runs to a number of pages, and Example 4.65 shows<br />
only a small part of this output.<br />
$ dump -sv a.out<br />
a.out:<br />
Example 4.65 Example of Output from dump<br />
.interp:<br />
2f 75 73 72 2f 6c 69 62 2f 6c 64 2e 73 6f 2e 31 00<br />
.hash:<br />
00 00 00 95 00 00 00 8e 00 00 00 00 00 00 00 00 00 00 00<br />
....<br />
**** STRING TABLE INFORMATION ****<br />
continues
92 <strong>Chapter</strong> 4 Informational Tools<br />
.strtab:<br />
Name<br />
<br />
a.out<br />
crti.s<br />
crt1.s<br />
__get_exit_frame_monitor_ptr<br />
...<br />
.stab.indexstr:<br />
Name<br />
/tmp/;/opt/SUNWspro/prod/bin/f90 -g -qoption f90comp -<br />
h.XAzwWCA01y4\$DCK. test.f90<br />
...<br />
The mcs tool, which is shipped with <strong>Solaris</strong>, manipulates the comments section<br />
in elf files. The -p option will print the comments. It is possible to delete the comments<br />
section using -d, or append more strings using -a. The comments section<br />
often holds details of the compiler version used and the header files included. An<br />
example of manipulating the comments section is shown in Example 4.66. The initial<br />
comments section shows the version information for the compiler, together<br />
with details of the header files included at compile time. Using the mcs flag -a, it<br />
is possible to append another comment to the file.<br />
$ cc -O code.c<br />
$ mcs -p a.out<br />
a.out:<br />
Example 4.65 Example of Output from dump (continued )<br />
Example 4.66 Manipulating the Comments Section Using mcs<br />
cg: Sun Compiler Common 11 2005/10/13<br />
cg: Sun Compiler Common 11 2005/10/13<br />
@(#)stdio.h 1.84 04/09/28 SMI<br />
@(#)feature_tests.h 1.25 07/02/02 SMI<br />
...<br />
ld: Software Generation Utilities - <strong>Solaris</strong> Link Editors: 5.10-1.486<br />
$ mcs -a "Hello" a.out<br />
$ mcs -p a.out<br />
a.out:<br />
...<br />
ld: Software Generation Utilities - <strong>Solaris</strong> Link Editors: 5.10-1.486<br />
Hello