Mapping seagrass in the Swan-Canning Estuary using - Centre for ...
Mapping seagrass in the Swan-Canning Estuary using - Centre for ...
Mapping seagrass in the Swan-Canning Estuary using - Centre for ...

Create successful ePaper yourself
Turn your PDF publications into a flip-book with our unique Google optimized e-Paper software.
Proceed<strong>in</strong>gs of <strong>the</strong> SUT Annual Conference 2009<br />
Perth, Western Australia<br />
<strong>Mapp<strong>in</strong>g</strong> <strong>seagrass</strong> <strong>in</strong> <strong>the</strong> <strong>Swan</strong>-Cann<strong>in</strong>g <strong>Estuary</strong> us<strong>in</strong>g sidescan sonar<br />
Ia<strong>in</strong> M. Parnum 1 and Alexander Gavrilov 1<br />
1. <strong>Centre</strong> <strong>for</strong> Mar<strong>in</strong>e Science and Technology, Curt<strong>in</strong> University of Technology, Perth,<br />
Australia<br />
Seagrass distribution and o<strong>the</strong>r measures of <strong>seagrass</strong> condition have been used as broad<br />
scale biological <strong>in</strong>dicators of mar<strong>in</strong>e and estuar<strong>in</strong>e health. To date <strong>the</strong> distribution of<br />
<strong>seagrass</strong> <strong>in</strong> <strong>the</strong> <strong>Swan</strong>-Cann<strong>in</strong>g <strong>Estuary</strong> has been assessed based on aerial photographs,<br />
which is <strong>in</strong>effective <strong>in</strong> deep, turbid waters. Sidescan sonar systems (SSS) provide acceptable<br />
results <strong>in</strong> a much wider range of environmental conditions, particularly as <strong>the</strong>y are not<br />
affected by <strong>the</strong> turbidity or water depth of <strong>the</strong> river. A SSS was successfully used to collect<br />
backscatter data from 10 survey areas <strong>in</strong> <strong>the</strong> <strong>Swan</strong>-Cann<strong>in</strong>g <strong>Estuary</strong> rang<strong>in</strong>g from 0.5 – 15m<br />
<strong>in</strong> depth. The SSS was able to dist<strong>in</strong>guish areas of <strong>seagrass</strong> from bare sediment. A simple<br />
threshold classification method was used to produce geo-referenced habitat maps from each<br />
of <strong>the</strong> 10 areas show<strong>in</strong>g <strong>the</strong> predicted distribution of low and high density <strong>seagrass</strong>, sand,<br />
mud and rock. The SSS is considered cost-effective and efficient <strong>for</strong> similar studies <strong>in</strong> o<strong>the</strong>r<br />
shallow water estuaries provided it is conducted <strong>in</strong> conjunction with ground-truth<strong>in</strong>g at<br />
selected reference po<strong>in</strong>ts.<br />
Keywords: <strong>Swan</strong> River, <strong>seagrass</strong>, mapp<strong>in</strong>g sidescan sonar.<br />
Introduction<br />
Seagrass distribution and o<strong>the</strong>r measures of <strong>seagrass</strong> condition have been used as broad<br />
scale biological <strong>in</strong>dicators of mar<strong>in</strong>e and estuar<strong>in</strong>e health. To date <strong>the</strong> distribution of<br />
<strong>seagrass</strong> <strong>in</strong> <strong>the</strong> <strong>Swan</strong>-Cann<strong>in</strong>g <strong>Estuary</strong> has relied on aerial photographs (e.g. Hillman et al.,<br />
1995) but with little or no ground-truth<strong>in</strong>g to verify <strong>the</strong> images. Aerial images are prone to<br />
several errors due to various factors, which <strong>in</strong>clude sun glitter, turbidity (particularly <strong>in</strong><br />
estuaries), variations <strong>in</strong> depth, and obscur<strong>in</strong>g features such as float<strong>in</strong>g macroalgae above <strong>the</strong><br />
<strong>seagrass</strong>. Ground-truth<strong>in</strong>g is labour <strong>in</strong>tensive, expensive <strong>in</strong> terms of time and resources,<br />
difficult to repeat and also prone to error because of subjective <strong>in</strong>terpretation and <strong>the</strong><br />
necessity <strong>for</strong> large scale averag<strong>in</strong>g between surveyed areas.<br />
In order to use changes <strong>in</strong> <strong>seagrass</strong> distribution over time as an <strong>in</strong>dicator of condition <strong>in</strong> <strong>the</strong><br />
<strong>Swan</strong>-Cann<strong>in</strong>g <strong>Estuary</strong> and potentially <strong>in</strong> o<strong>the</strong>r estuaries along <strong>the</strong> West Australian coastl<strong>in</strong>e,<br />
a quantitative, reproducible method <strong>for</strong> determ<strong>in</strong><strong>in</strong>g <strong>seagrass</strong> distribution needs to be<br />
developed. Acoustic remote sens<strong>in</strong>g us<strong>in</strong>g sidescan sonar (SSS) offers a cost-effective<br />
method and has been shown to be be effective <strong>in</strong> mapp<strong>in</strong>g <strong>seagrass</strong> distribution (Pasqual<strong>in</strong>ia<br />
et al., 1998; Mulhearn, 2001; Bickers, 2003). However, <strong>the</strong> shallow water limit of sidescan<br />
sonars <strong>for</strong> habitat mapp<strong>in</strong>g is not well understood. The scientific challenge is to m<strong>in</strong>imise <strong>the</strong><br />
depth at which SSS results are still valid.<br />
The objectives of this work were to:<br />
1. Determ<strong>in</strong>e <strong>the</strong> spatial extent of <strong>seagrass</strong> <strong>in</strong> selected regions of <strong>the</strong> <strong>Swan</strong> River us<strong>in</strong>g<br />
sidescan.<br />
2. Assess <strong>the</strong> ability and relative merits of sidescan sonar <strong>for</strong> mapp<strong>in</strong>g <strong>seagrass</strong> <strong>in</strong> <strong>the</strong><br />
<strong>Swan</strong> River.<br />
Page 1
Proceed<strong>in</strong>gs of <strong>the</strong> SUT Annual Conference 2009<br />
Perth, Western Australia<br />
This paper presents <strong>the</strong> sidescan sonar data acquisition, process<strong>in</strong>g and classification<br />
methods and some example results.<br />
Study Areas<br />
Ten study areas <strong>for</strong> mapp<strong>in</strong>g <strong>seagrass</strong> <strong>in</strong> <strong>the</strong> <strong>Swan</strong> and Cann<strong>in</strong>g estuaries were identified<br />
based on previous data by Hillman et al. (1995). These sites were Rocky Bay, Po<strong>in</strong>t Walter,<br />
Freshwater Bay, Attadale Foreshore, Lucky Bay, Waylen Bay, Como Beach, Matilda Bay,<br />
Pelican Po<strong>in</strong>t and Armstrong Spit.<br />
Methods<br />
Data were collected dur<strong>in</strong>g <strong>the</strong> period from 20/4/08 to 3/5/08, us<strong>in</strong>g high tides to cover <strong>the</strong><br />
shallower areas. W<strong>in</strong>d speed varied from flat calm to 20kn, at which po<strong>in</strong>t measurement<br />
quality degraded unacceptably. Water visibility was generally less than 1m. For <strong>the</strong> majority<br />
of data collection <strong>the</strong>re was negligible current.<br />
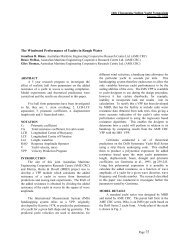
An EdgeTech TM 4200 MP SSS was used to collect backscatter data (Figure 1). The tow-fish<br />
was fixed-mounted to <strong>the</strong> vessel to improve geo-referenc<strong>in</strong>g of data. Backscatter was<br />
collected at 250 kHz at <strong>the</strong> maximum range of 75 m ei<strong>the</strong>r side of <strong>the</strong> tow-fish (i.e. a total<br />
swath of 150 m). The range was set to 75m because this was <strong>the</strong> fur<strong>the</strong>st distance <strong>for</strong> which<br />
data could be obta<strong>in</strong>ed <strong>in</strong> <strong>the</strong> very shallow water areas <strong>in</strong> this study (typically < 2 m).<br />
Although a higher range was possible <strong>in</strong> deeper water, it was kept at 75m <strong>for</strong> consistency<br />
and <strong>for</strong> ease of comparison. OmniSTAR TM 8200HP DGPS was used to provide position<br />
<strong>in</strong><strong>for</strong>mation.<br />
Figure 1: EdgeTech 4200 sidescan sonar system.<br />
Process<strong>in</strong>g sidescan data entailed apply<strong>in</strong>g two types of correction:<br />
geometric<br />
radiometric<br />
Page 2
Proceed<strong>in</strong>gs of <strong>the</strong> SUT Annual Conference 2009<br />
Perth, Western Australia<br />
Geometric corrections are <strong>the</strong> calculation of <strong>the</strong> X-Y position <strong>for</strong> each data po<strong>in</strong>t. As <strong>the</strong><br />
EdgeTech 4200 measures motion and head<strong>in</strong>g, <strong>the</strong> X-Y position was corrected <strong>for</strong> roll, pitch<br />
and yaw.<br />
Radiometric corrections of backscatter data compensate <strong>for</strong> transmission loss, <strong>in</strong>sonification<br />
area and <strong>in</strong>cidence angle (Medw<strong>in</strong> and Clay, 1998). To aid <strong>in</strong> classification, a wavelet<br />
speckle filter (Yu and Acton, 2002) was applied be<strong>for</strong>e classification. Data were divided <strong>in</strong>to<br />
five classes: mud, sand, low-medium density <strong>seagrass</strong>, medium-high density <strong>seagrass</strong> and<br />
rock and us<strong>in</strong>g ground-truth <strong>in</strong><strong>for</strong>mation, distributions of backscatter values <strong>for</strong> <strong>the</strong> different<br />
classes were calculated. Then all <strong>the</strong> backscatter data were assigned one of <strong>the</strong> five classes.<br />
The classified data were comb<strong>in</strong>ed <strong>in</strong>to a map gridded with a 2m cell size. Each cell<br />
conta<strong>in</strong>ed several classified po<strong>in</strong>ts, <strong>the</strong> most frequent class based on a 5 x 5 pixel Gaussian<br />
weighted mov<strong>in</strong>g w<strong>in</strong>dow (to allow contextual <strong>in</strong><strong>for</strong>mation) was assigned to <strong>the</strong> cell.<br />
Results<br />
The SSS was successfully used to collect backscatter data over 4.4 km 2 <strong>in</strong> 8 survey days<br />
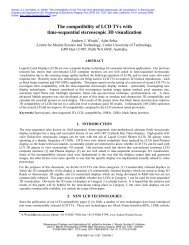
from 10 survey areas <strong>in</strong> <strong>the</strong> <strong>Swan</strong> River. An example of a s<strong>in</strong>gle track of processed<br />
backscatter data is shown <strong>in</strong> Figure 2 (a). Ground-truth <strong>in</strong><strong>for</strong>mation (ga<strong>the</strong>red from<br />
snorkellers) is shown to confirm <strong>the</strong> identification of <strong>seagrass</strong> and <strong>the</strong> sand and mud classes.<br />
The distributions of backscatter values <strong>for</strong> <strong>the</strong> different classes are shown <strong>in</strong> Figure 2 (b).<br />
Although <strong>the</strong> density of <strong>seagrass</strong> does correlate with <strong>the</strong> result<strong>in</strong>g backscatter <strong>in</strong>tensity, it is<br />
not a l<strong>in</strong>ear relationship.<br />
(a) (b)<br />
Probability density<br />
100<br />
90<br />
80<br />
70<br />
60<br />
50<br />
40<br />
30<br />
20<br />
10<br />
Mud<br />
Sand<br />
Seagrass - Low to Medium density<br />
Seagrass - Medium to High density<br />
0<br />
0.35 0.4 0.45 0.5 0.55 0.6 0.65 0.7<br />
Normalised backscatter level<br />
Figure 2: (a) Processed backscatter strength (as <strong>in</strong>dicated by <strong>the</strong> colour bar) with groundtruth<br />
<strong>in</strong><strong>for</strong>mation <strong>in</strong>dicated by <strong>the</strong> follow<strong>in</strong>g symbols: <strong>seagrass</strong> cover: o 50%; sand (●), sandy mud (●) and mud (●); and (b), distributions of backscatter values <strong>for</strong><br />
<strong>the</strong> different habitat classes.<br />
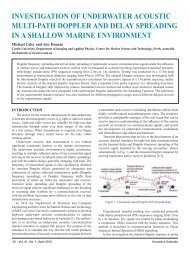
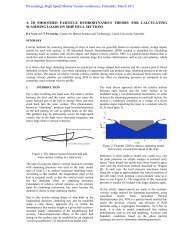
Figure 3 shows <strong>the</strong> f<strong>in</strong>al habitat map <strong>for</strong> Armstrong Spit (a) along with <strong>the</strong> track plots over <strong>the</strong><br />
chart from <strong>the</strong> survey area (b). Overall <strong>the</strong>re is good agreement with <strong>the</strong> maps of <strong>seagrass</strong><br />
distribution produced by Hillman et al. (1995). The depth range of <strong>the</strong> <strong>seagrass</strong> <strong>in</strong> some sites<br />
exceeds maximum depth of <strong>the</strong> detection <strong>in</strong> aerial photography studies. Although <strong>the</strong>re was<br />
not enough <strong>in</strong><strong>for</strong>mation available to per<strong>for</strong>m an accuracy assessment of <strong>the</strong> classification,<br />
comparison of <strong>the</strong> results with ground-truth data, such as <strong>in</strong> Figure 2, give good confidence<br />
<strong>in</strong> this mapp<strong>in</strong>g technique.<br />
Conclusions<br />
Page 3
Proceed<strong>in</strong>gs of <strong>the</strong> SUT Annual Conference 2009<br />
Perth, Western Australia<br />
SSS was effective and efficient at mapp<strong>in</strong>g broad scale habitats of an estuary <strong>in</strong> depths 0.5-<br />
15 m. Even <strong>in</strong> depths of less than 1m of water a total swath width of 150 m was achieved. A<br />
simple threshold classification method was used to produce habitat maps from each of <strong>the</strong><br />
sites show<strong>in</strong>g <strong>the</strong> predicted distribution of <strong>seagrass</strong>, sand, mud and rock. Although SSS was<br />
successful at identify<strong>in</strong>g <strong>seagrass</strong>, determ<strong>in</strong><strong>in</strong>g <strong>the</strong> relative density of <strong>seagrass</strong> from SSS<br />
data is still an area requir<strong>in</strong>g fur<strong>the</strong>r research. However, <strong>for</strong> mapp<strong>in</strong>g <strong>the</strong> presence of<br />
<strong>seagrass</strong>, SSS has shown to be effective <strong>in</strong> at greater depths than aerial photography. We<br />
conclude that SSS is a useful tool <strong>for</strong> habitat mapp<strong>in</strong>g <strong>in</strong> an estuar<strong>in</strong>e environment.<br />
(a)<br />
(b)<br />
Figure 3: Results from Armstrong Spit: (a) Track plot over <strong>the</strong> chart, and (b) habitat map – 1<br />
= Mud/Sandy mud, 2 = Sand, 3 = Seagrass (low to medium density), 4 = Seagrass (medium<br />
to high density) and 5 = Rock/Coastl<strong>in</strong>e.<br />
Acknowledgments<br />
This work was funded by <strong>the</strong> WA Department of Water. The authors would like to thank Dr<br />
Frances D’Souza and Dr Vanessa Forbes (WA Department of Water); Dr Thomas Wernberg,<br />
Dr Mads Thomsen and Dr Kathryn McMahon (Edith Cowan University, Western Australia) <strong>for</strong><br />
ground-truth <strong>in</strong><strong>for</strong>mation; Darren Wal<strong>for</strong>d (OmniSTAR) <strong>for</strong> provid<strong>in</strong>g GPS support; and Mal<br />
Perry (CMST) <strong>for</strong> technical support<br />
References<br />
Bickers, A.N. (2003), Cost Effective Mar<strong>in</strong>e Habitat <strong>Mapp<strong>in</strong>g</strong> from Small Vessels us<strong>in</strong>g GIS, SSS and<br />
Video. Coastal GIS, Wollongong, Australia.<br />
Hillman, K., McComb A.J, Walker, D.I. (1995). The distribution, biomass and primary production of <strong>the</strong><br />
<strong>seagrass</strong> Halophila ovalis <strong>in</strong> <strong>the</strong> <strong>Swan</strong>/Cann<strong>in</strong>g <strong>Estuary</strong>, Western Australia. Aquatic Botany, 51,<br />
pp 1-54.<br />
Medw<strong>in</strong>, H. and Clay, C.S. (1998). Fundamentals of Acoustical Oceanography, 1st edn, Academic<br />
Press, U.S., pp. 712.<br />
Mulhearn, P.J. (2001). <strong>Mapp<strong>in</strong>g</strong> seabed vegetation with SSS, Defence Science and Technology<br />
Organisation, Sydney, Australia. DSTO-TN-0381.<br />
Pasqual<strong>in</strong>ia, V., Pergent-Mart<strong>in</strong>ia, C., Clabautb, P. and Pergenta, G. (1998). <strong>Mapp<strong>in</strong>g</strong> of Posidonia<br />
oceanica us<strong>in</strong>g Aerial Photographs and Side Scan Sonar: Application off <strong>the</strong> Island of Corsica<br />
(France), Estuar<strong>in</strong>e, Coastal and Shelf Science, 47, pp. 359-67.<br />
Page 4
Proceed<strong>in</strong>gs of <strong>the</strong> SUT Annual Conference 2009<br />
Perth, Western Australia<br />
Yu Y. and Acton S.T. (2002). Speckle reduc<strong>in</strong>g anisotropic diffusion. IEEE Transactions on Image<br />
Process<strong>in</strong>g, 11, 1260-1270.<br />
Page 5