Blue whale calling in the Rottnest trench-2000, Western ... - ANP
Blue whale calling in the Rottnest trench-2000, Western ... - ANP
Blue whale calling in the Rottnest trench-2000, Western ... - ANP

You also want an ePaper? Increase the reach of your titles
YUMPU automatically turns print PDFs into web optimized ePapers that Google loves.
strong downward refraction below <strong>the</strong> base, where <strong>the</strong> sound speed dropped sharply. This effect<br />
can be illustrated <strong>in</strong> a ray plot. This type of analysis treats <strong>the</strong> sound waves leav<strong>in</strong>g a source as a<br />
series of closely spaced rays, <strong>the</strong>n calculates <strong>the</strong> trajectory and refraction of each ray as it passes<br />
through layers of water with different sound speeds, tak<strong>in</strong>g <strong>in</strong>to account reflections off <strong>the</strong><br />
surface or bottom An example of <strong>the</strong> ray trajectories near <strong>the</strong> bluey logger site for a 200 m deep<br />
Leeuw<strong>in</strong> current (as for Figure 4, bottom plot), a source at 40 m depth (<strong>the</strong> commonly reported<br />
depth of a <strong>call<strong>in</strong>g</strong> blue <strong>whale</strong>, Thode et al <strong>2000</strong>, D'Spa<strong>in</strong> et al 1995), <strong>in</strong> a constant 450 m water<br />
depth, out to 20 km, are shown on Figure 15. For simplicity <strong>the</strong> bottom reflected rays are not<br />
shown. This figure shows strong downward refraction just below <strong>the</strong> Leeuw<strong>in</strong> current such that<br />
of <strong>the</strong> rays plotted, none are evident below 100 m depth from 11 km outwards. In reality signal<br />
energy would occur <strong>in</strong> this shadow zone due to sound energy reflect<strong>in</strong>g off <strong>the</strong> seabed or<br />
enter<strong>in</strong>g <strong>the</strong> seabed and later be<strong>in</strong>g refracted or reflected out of it back <strong>in</strong>to <strong>the</strong> water.<br />
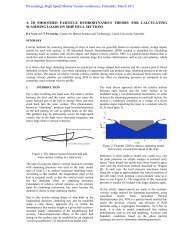
Figure 15: Ray trace for a 20 Hz source at 40 m depth <strong>in</strong> a constant 450 m water depth us<strong>in</strong>g <strong>the</strong> sound speed profile<br />
of Figure 4-bottom (200 m deep Leeuw<strong>in</strong> current) extrapolated as for Figure 5. Strong downward refraction is<br />
evident. Made us<strong>in</strong>g <strong>the</strong> 'Bellhop' program (Porter, 1994), with only surface reflections <strong>in</strong>cluded.<br />
The <strong>in</strong>teraction of sound waves with <strong>the</strong> seafloor is vitally important for <strong>the</strong> propagation of<br />
sound <strong>in</strong> shallow water (cont<strong>in</strong>ental shelf and slope, waters). Sound energy may reflect off <strong>the</strong><br />
seafloor, be scattered off <strong>the</strong> seafloor or may enter <strong>the</strong> seafloor, travel through it, <strong>the</strong>n be<br />
reflected or refracted back <strong>in</strong>to <strong>the</strong> water column. There are several ma<strong>the</strong>matical approaches for<br />
calculat<strong>in</strong>g how imp<strong>in</strong>g<strong>in</strong>g sound waves <strong>in</strong>teract and refract <strong>in</strong> <strong>the</strong> sea floor. These are<br />
implemented <strong>in</strong> specialised programs which also <strong>in</strong>clude <strong>the</strong> surface reflection <strong>in</strong>teraction and<br />
water column sound speed variations. Each of <strong>the</strong>se programs has its own set of limitations and<br />
peculiarities necessary for successfully runn<strong>in</strong>g and <strong>in</strong>terpret<strong>in</strong>g <strong>the</strong> outputs. All require detailed<br />
geological <strong>in</strong>formation on <strong>the</strong> seafloor properties. No geological <strong>in</strong>formation on <strong>the</strong> seafloor<br />
characteristics appropriate for sound propagation studies were available to <strong>the</strong> author for <strong>the</strong><br />
<strong>trench</strong> region. Based on sound propagation modell<strong>in</strong>g by Hoffman et al <strong>2000</strong> and Jones et al<br />
<strong>2000</strong>, a set of sediment properties for <strong>the</strong> shelf above <strong>the</strong> 200 m contour, west of <strong>Rottnest</strong> was<br />
extrapolated to encompass <strong>the</strong> whole <strong>trench</strong> region. The parameters used are given <strong>in</strong> Table 2.<br />
These parameters were used for all water depths < 200 m. For water depths > 200 m <strong>the</strong> depth of<br />
18