ORNL-4191 - the Molten Salt Energy Technologies Web Site
ORNL-4191 - the Molten Salt Energy Technologies Web Site ORNL-4191 - the Molten Salt Energy Technologies Web Site
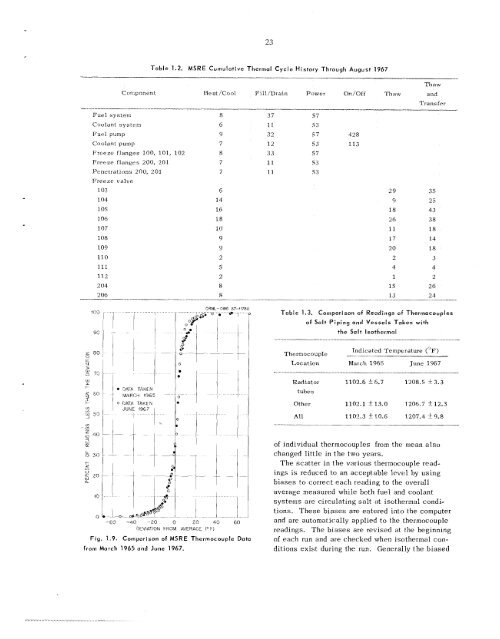
etween runs contain enough uncertainty that an error of this magnitude could be lost. Thus the shift in rod position cannot he assigned to either the beginning or end of run 12. Even with this uncertainty in residual reactivity, the zero-power results fall within a very narrow band, whicii derrionstrates the continuing good performance of both the reactor system and the reactivity-balance calcitlation. MAL EFFECTS OF OPERATION C. H. Gabbard Radiation Heating Reactor Vessel. - The temperature differences between certain thermocouples on the reactor vessel and the reactor inlet temperature are monitored by the computer io determine whether there is any evidence of a sedimentation buildup in the lower head or on the core support flange. In the previous semiannual report,' it was stated that these temperature differences had increased. Fullpower data were reviewed from runs 6 through 12, and it now appears that the increase reported is within the data scatter. The average temperature differences for run 6 were 2.11 and 1.51°F/Mw for the core support flange and the lower head, respectively, and were 2.205 and P.5S°F/Mw for run 12. Fuel Pump Tank. - An unexplained downward shift in the temperature of the upper pump-tank surface was inentioned in the previous semiannual report. Past data for the pump-tank temperature and for the heat removal by the oil system were reviewed to determine if a better thermal coupling could have developed between the pump tank and the shield-plug oil cooler. No evidence of increased heat removal by the oil system was found. The temperature distribution remained essentially the same throughout run 11, with pump operation continuing without cooling air. When the reactor was taken to power in run 12, the full-power temperature distribution had shifted downward another 15 to 30°F, and the pump tank continued through 'MSX Program Semiann. Progr. Rept. Feb. 28; 1967, ORNL-4119, p. 19. 'Ibid., p. 18. 22 the run at the lower temperatures. The tempera- tures at zero power were consistent with the run 11 zero-power data. This would seein to indicate that less fission product activity was being re- leased in the pump tank. The lower temperatures are not detrimental to the operation or to the life of the pump tank, Thermal Cycle History The accumulated thermal cycle history of the various components sensitive to thermal cycle damage is shown in Table 1.2. Approximately 63% of the design therinal cycle life of the fuel system freeze flanges has been used to date; 54% had been used at the time of the previous semiannual report. Temperature Meosurernent Sa It Systems. -- Approxiinately 330 thermocouples are used to tne'asure the temperatiire at various locations on the fuel and coolant circulating salt systems. Only two thermocouple wells are pro- vided, one each in the coolant radiator inlet and outlet pipes. The remaining thermocouples are attached to the pipe or vessel walls. The thermo- couples on the radiator tubes are insulated to pro- tect them from the effects of the high-velocity air that flows over them during power operation; the others are not insulated and thus are subject to error because of exposure to heater shine aild to thermal convection flow of the cell atmosphere within the heater insulation. In March 1965, with the fuel and coolant systems circulating salt at isothermal conditions, a complete set of readings was taken from all the thermocouples that should read the temperature of the circulating salt. A similar set of data was taken in June 1967 at the start of run 12. The results of the two sets of measurements are shown in 'Table 1.3. Compari- son of the standard deviations for the radiator thermocouples with those for the other thermo- couples shows the effect of insulation on reducing the scatter. Comparison of the sets of data taken ovei two years apart shows very little change, certainly no greater scatter. Figure 1.9 shows that the statistical distribution of the deviations 31bid., p. 20.
II_- - 23 Table 1.2. MSRE Cumulotive Thermal Cycle History Through August 1967 - CotiLponent IIeat/Cool Fill/Drain Power On/Off Thaw a d Fuel system a Coolant system 6 Fuel pump 9 Coolant pump 7 Freeze flanges 100, 101, 102 8 Freeze flanges 200, 201 7 Penetrations 200, 201 7 Freeze valve 103 6 104 14 1 05 16 106 18 107 10 108 9 109 9 110 2 111 5 112 2 2 01 8 2 06 .--. ~ Fig. 1.9. Comparison of MSRE Thermocouple Data from Morch 1965 and June 1967. 8 -_ 3 7 57 11 53 32 57 428 12 53 I13 3 3 57 11 53 11 5 '4 - - - Thaw Trans fer 29 35 4 25 18 43 26 38 11 18 17 14 20 15 2 3 4 4 1 2 15 26 Table 1.3. Comparison of Readings of Thermocouples of Salt Piping and Vessels Taken with 1.3 the Salt lsothermol Indicated Temperature ("F) Thermocouple _______ Location March 1965 June 1967 Radiator 1102.6 56.7 1208.5 *3.3 tubes Other 1102.1 113.0 1206.7 k12.3 All 1102.3 t 10.6 1207.4 f9.8 of individual thermocouples from the mean also changed little in the two years. 'The scatter in the various thermocouple read- ings is reduced to an acceptable level by using biases to correct each reading to the overall average measured while both fuel and coolant systems are circulating salt at isothermal condi- tions. These biases are entered into the computer and arc automatically applied to the thermocouple readings. The biases are revised at the beginning of each run and are checked when isothermal con- ditions exist during the run. Generally the biased 24 ___
- Page 3 and 4: c c c Contract No. W-.740 5-eng- 26
- Page 5 and 6: , INTRODUCTION ....................
- Page 7 and 8: 7 . SYSTEMS AND COMPONENTS DEVELOPM
- Page 9 and 10: . 15.7 Oxygen Analysis ............
- Page 11 and 12: i The objective of the Molten-Salt
- Page 13 and 14: PART 1. MOLTEN-SALT REACTOR EXPERIM
- Page 15 and 16: PART 2. MSBR DESlGN AND DEVELOPMENT
- Page 17 and 18: especially when the system is stabi
- Page 19 and 20: generated species in molten fluorid
- Page 21 and 22: cold leg. The second loop, of Naste
- Page 23 and 24: Part 1. Molten-Salt Reactor Experim
- Page 25 and 26: was at full power continuously exce
- Page 27 and 28: Analysis and details of operations
- Page 29 and 30: 1.2 REACTlVlTY BALANCE J. R. Engel
- Page 31: alance results during this time sho
- Page 35 and 36: 4 2 5 10 20 transient that followed
- Page 37 and 38: 27 Fig. 1.13. Motor of Reactor Cell
- Page 39 and 40: personnel access to the area where
- Page 41 and 42: accumulation rate at present indica
- Page 43 and 44: The retrieval of the sample latch w
- Page 45 and 46: The moisture condensed from the cel
- Page 47 and 48: MSRE, details of some of the equipm
- Page 49 and 50: 39 Fig. 2.2. General View of Latch
- Page 51 and 52: c 41 Table 2.1. Radiation Levels Fo
- Page 53 and 54: significantly, indicating clearly t
- Page 55 and 56: 2.5 PUMPS P. G. Smith A. G. Grindel
- Page 57 and 58: 3.1 MSRE OPERATING EXPE RI ENCE C.
- Page 59 and 60: The rate-of-fill interlocks, includ
- Page 61 and 62: 16 15 44 (3 42 I1 9 51 LLETHARGY 8
- Page 63 and 64: shown as solid points in Fig. 4.1 (
- Page 65 and 66: These are the results of two-dimens
- Page 67 and 68: . r. ~ ~ ~ Fig. 4.8. Axiol Distribu
- Page 69 and 70: . 59 Fig. 4.10. Axial Distribution
- Page 71 and 72: - 12 0.0 $ 04 Lo ... z ? I- ;s -04
- Page 73 and 74: Part 2. MSBR Design and Development
- Page 75 and 76: ather than just the core and to pro
- Page 77 and 78: A . 9.
- Page 79 and 80: 0 2 4 6810 LLLLLLU 1 INCHES COOLING
- Page 81 and 82: however, electric heaters are provi
II_- -<br />
23<br />
Table 1.2. MSRE Cumulotive Thermal Cycle History Through August 1967<br />
-<br />
CotiLponent IIeat/Cool Fill/Drain Power On/Off Thaw a d<br />
Fuel system a<br />
Coolant system 6<br />
Fuel pump 9<br />
Coolant pump 7<br />
Freeze flanges 100, 101, 102 8<br />
Freeze flanges 200, 201 7<br />
Penetrations 200, 201 7<br />
Freeze valve<br />
103 6<br />
104 14<br />
1 05 16<br />
106 18<br />
107 10<br />
108 9<br />
109 9<br />
110 2<br />
111 5<br />
112 2<br />
2 01 8<br />
2 06<br />
.--. ~<br />
Fig. 1.9. Comparison of MSRE Thermocouple Data<br />
from Morch 1965 and June 1967.<br />
8<br />
-_<br />
3 7 57<br />
11 53<br />
32 57 428<br />
12 53 I13<br />
3 3 57<br />
11 53<br />
11 5 '4<br />
- - -<br />
Thaw<br />
Trans fer<br />
29 35<br />
4 25<br />
18 43<br />
26 38<br />
11 18<br />
17 14<br />
20 15<br />
2 3<br />
4 4<br />
1 2<br />
15 26<br />
Table 1.3. Comparison of Readings of Thermocouples<br />
of <strong>Salt</strong> Piping and Vessels Taken with<br />
1.3<br />
<strong>the</strong> <strong>Salt</strong> lso<strong>the</strong>rmol<br />
Indicated Temperature ("F)<br />
Thermocouple _______<br />
Location March 1965 June 1967<br />
Radiator 1102.6 56.7 1208.5 *3.3<br />
tubes<br />
O<strong>the</strong>r 1102.1 113.0 1206.7 k12.3<br />
All 1102.3 t 10.6 1207.4 f9.8<br />
of individual <strong>the</strong>rmocouples from <strong>the</strong> mean also<br />
changed little in <strong>the</strong> two years.<br />
'The scatter in <strong>the</strong> various <strong>the</strong>rmocouple read-<br />
ings is reduced to an acceptable level by using<br />
biases to correct each reading to <strong>the</strong> overall<br />
average measured while both fuel and coolant<br />
systems are circulating salt at iso<strong>the</strong>rmal condi-<br />
tions. These biases are entered into <strong>the</strong> computer<br />
and arc automatically applied to <strong>the</strong> <strong>the</strong>rmocouple<br />
readings. The biases are revised at <strong>the</strong> beginning<br />
of each run and are checked when iso<strong>the</strong>rmal con-<br />
ditions exist during <strong>the</strong> run. Generally <strong>the</strong> biased<br />
24<br />
___


