ORNL-1816 - the Molten Salt Energy Technologies Web Site
ORNL-1816 - the Molten Salt Energy Technologies Web Site
ORNL-1816 - the Molten Salt Energy Technologies Web Site

Create successful ePaper yourself
Turn your PDF publications into a flip-book with our unique Google optimized e-Paper software.
ANP QUARTERLY PROGRESS REPORT<br />
- 5<br />
4900<br />
v) 4800<br />
w<br />
a<br />
I- 3<br />
d t700<br />
W<br />
0<br />
B<br />
I- 4600<br />
W<br />
m<br />
I- 3<br />
-I<br />
I-<br />
T3<br />
0<br />
4500<br />
1400<br />
n<br />
z<br />
a<br />
5 4300<br />
5<br />
K<br />
0<br />
9<br />
K<br />
4200<br />
4100<br />
1000<br />
-<br />
<strong>ORNL</strong>-LR-DWG 3946<br />
404 100 96 92 88 84 80 76 72 68 64 60 56 52 48 44 40 36 32 28 24 20 16 12 8 4 0<br />
TIME (min)<br />
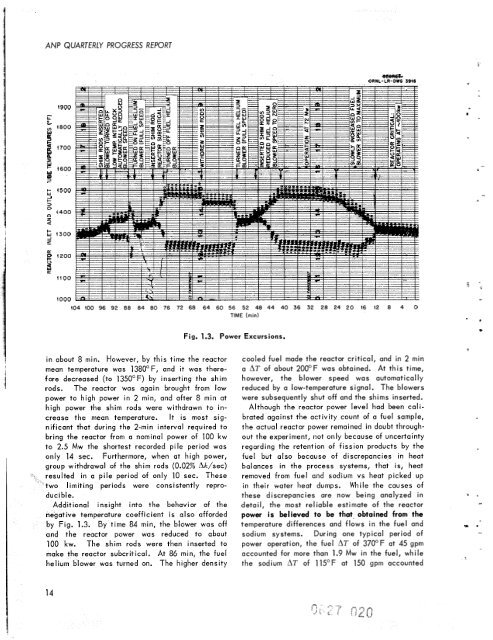
in about 8 min. However, by this time <strong>the</strong> reactor<br />
mean temperature was 138OoF, and it was <strong>the</strong>re-<br />
fore decreased (to 1350°F) by inserting <strong>the</strong> shim<br />
rods. The reactor was again brought from low<br />
power to high power in 2 min, and after 8 min at<br />
high power <strong>the</strong> shim rods were withdrawn to in-<br />
crease <strong>the</strong> mean temperature. It is most sig-<br />
nificant that during <strong>the</strong> 2-min interval required to<br />
bring <strong>the</strong> reactor from a nominal power of 100 kw<br />
to 2.5 Mw <strong>the</strong> shortest recorded pile period was<br />
only 14 sec. Fur<strong>the</strong>rmore, when at high power,<br />
group withdrawal of <strong>the</strong> shim rods (0.02% Ak/sec)<br />
resulted in a pile period of only 10 sec. These<br />
two limiting periods were consistently repro-<br />
ducible.<br />
Additional insight into <strong>the</strong> behavior of <strong>the</strong><br />
negative temperature coefficient is also afforded<br />
by Fig. 1.3. By time 84 min, <strong>the</strong> blower was off<br />
and <strong>the</strong> reactor power was reduced to about<br />
100 kw. The shim rods were <strong>the</strong>n inserted to<br />
make <strong>the</strong> reactor subcritical. At 86 min, <strong>the</strong> fuel<br />
helium blower was turned on. The higher density<br />
14<br />
Fig. 1.3. Power Excursions.<br />
cooled fuel made <strong>the</strong> reactor critical, and in 2 min<br />
a AT of about 200°F was obtained. At this time,<br />
however, <strong>the</strong> blower speed was automatically<br />
reduced by a low-temperature signal. The blowers<br />
were subsequently shut off and <strong>the</strong> shims inserted.<br />
Although <strong>the</strong> reactor power level had been cali-<br />
'.<br />
brated against <strong>the</strong> activity count of a fuel sample,<br />
<strong>the</strong> actual reactor power remained in doubt through-<br />
out <strong>the</strong> experiment, not only because of uncertainty<br />
regarding <strong>the</strong> retention of fission products by <strong>the</strong><br />
fuel but also because of discrepancies in heat<br />
balances in <strong>the</strong> process systems, that is, heat<br />
removed from fuel and sodium vs heat picked up<br />
in <strong>the</strong>ir water heat dumps. While <strong>the</strong> causes of<br />
<strong>the</strong>se discrepancies are now being analyzed in 1 -<br />
detail, <strong>the</strong> most reliable estimate of <strong>the</strong> reactor F<br />
power is believed to be that obtained from <strong>the</strong><br />
temperature differences and flows in <strong>the</strong> fuel and<br />
sodium systems. During one typical period of<br />
power operation, <strong>the</strong> fuel AT of 370°F at 45 gpm<br />
accounted for more than 1.9 Mw in <strong>the</strong> fuel, while<br />
<strong>the</strong> sodium AT of 115°F at 150 gpm accounted<br />
- 7<br />
-<br />
0
![Review of Molten Salt Reactor Physics Calculations [Disc 2]](https://img.yumpu.com/21979492/1/190x247/review-of-molten-salt-reactor-physics-calculations-disc-2.jpg?quality=85)