ORNL-1771 - Oak Ridge National Laboratory
ORNL-1771 - Oak Ridge National Laboratory
ORNL-1771 - Oak Ridge National Laboratory

You also want an ePaper? Increase the reach of your titles
YUMPU automatically turns print PDFs into web optimized ePapers that Google loves.
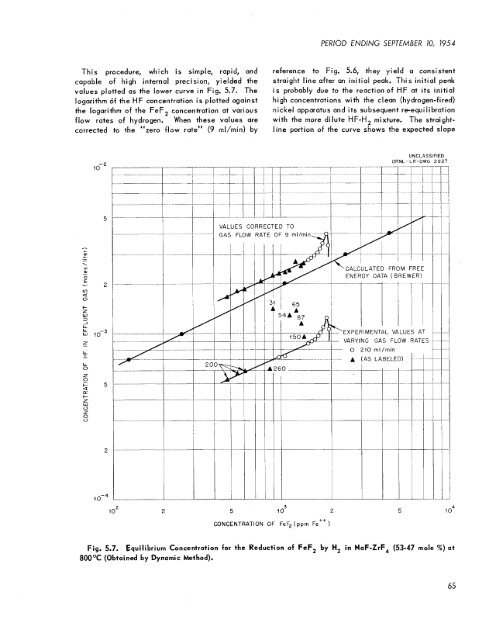
This procedure, which is simple, rapid, and<br />
capable of high internal precision, yielded the<br />
values plotted as the lower curve in Fig. 5.7. The<br />
logarithm df the HF concentration is plotted against<br />
the logarithm of the FeF, concentration at various<br />
flow rates of hydrogen. When these values are<br />
corrected to the “zero flow rate” (9 rnl/min) by<br />
io2 2 5 4 o3 2<br />
CONCENTRATION OF FeFz (ppm Fetf)<br />
PERIOD ENDING SEPTEMBER 70, 1954<br />
reference to Fig. 5.6, they yield a consistent<br />
straight line after an initial peak. This initial peak<br />
is probably due to the reaction of HF at its initial<br />
high concentrations with the clean (hydrogen-fired)<br />
nickel apparatus and its subsequent re-equilibration<br />
with the more dilute HF-H, mixture. The straight-<br />
line portion of the curve shows the expected slope<br />
UNCLASSIFIED<br />
<strong>ORNL</strong>-.LR-DWG 2927<br />
5 1 o4<br />
Fig. 5.7. Equilibrium Concentration for the Reduction of FeF, by H, in NaF-ZrF, (53-47 mole %) at<br />
800°C (Obtained by Dynamic hethod).<br />
65
![Review of Molten Salt Reactor Physics Calculations [Disc 2]](https://img.yumpu.com/21979492/1/190x247/review-of-molten-salt-reactor-physics-calculations-disc-2.jpg?quality=85)