ORNL-2106 - the Molten Salt Energy Technologies Web Site
ORNL-2106 - the Molten Salt Energy Technologies Web Site ORNL-2106 - the Molten Salt Energy Technologies Web Site
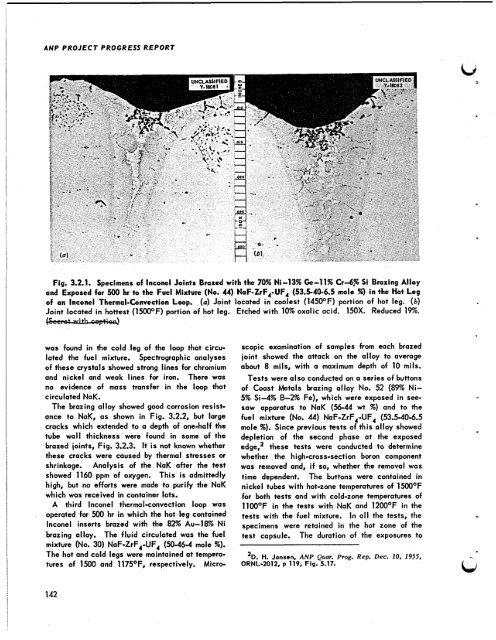
ANP PROJECT PROGRESS REPORT Fig. 3.2.1. Specimens of lnconel Joints Brazed with the 70% Ni-13% Ge-11% Crd% Si Brazing Alloy and Exposed for 500 hr to the Fuel Mixture (No. 44) NaF-ZrF,-UF, (53.5-40-6.5 mole se) in the Hot Leg of an lnconel Thermal-Convection Loop. (a) Joint located in coolest (145OOF) portion of hot leg. (b) I Joint located in hottest (1500OF) portion of hot leg. Etched with 10% oxalic acid: 150X. Reduced 19%. was found in the cold leg of the loop that circu- lated the fuel mixture. Spectrographic analyses of these crystals showed strong lines for chromium and nickel and weak lines for iron. There was no evidence of mass transfer in the loop that circulated NaK. The brazing alloy showed good corrosion resist- ance to NaK, as shown in Fig. 3.2.2, but large cracks which extended to a depth of one-half the tube wall thickness were found in some of the brazed joints, Fig. 3.2.3. It is not known whether these cracks were caused by thermal stresses or shrinkage. Analysis of the NaK after the test showed 1160 ppm of oxygen. This is admittedly high, but no efforts were made to purify the NaK which was received in container lots. A third lnconel thermal-convection loop was operated for 500 hr in which the hot leg contained lnconel inserts brazed with the 82% Au-18% Ni brazing alloy. The fluid circulated was the fuel mixture (No. 30) NaF-ZrF,-UF, (50-46-4 mole %). The hot and cold legs were maintained at tempera- tures of 1500 and 1175OF, respectively. Micro- 142 scopic examination of samples from each brazed joint showed the attack on the QIIOY to average about 8 mils, with a maximum depth of 10 mils. Tests were also conducted on a series of buttons of Coast Metals brazing alloy No. 52 (89% Ni- 5% Si-4% 8-294 Fe), which were exposed in see- saw apparatus to NaK (56-44 wt %) and to the fuel mixture (No. 44) NaF-ZrF,-UF, (53.5-40-6.5 mole %). Since previous tests of this alloy showed depletion of the second phase at the exposed edge,l these tests were conducted to determine whether the high-cross-section boron component was removed and, if so, whether the removal was time dependent. The buttons were contained in nickel tubes with hot-zone temperatures of 1500OF for both tests and with cold-zone temperatures of llOO°F in the tests with NaK and 120OOF in the tests with the fuel mixture. In a11 the tests, the specimens were retained in the hot zone of the test capsule. The duration of the exposures to lD. H. Jansen. ANP Qum. Prog. Rep. Dec. 10, 1955. ORNL-2012, p 119. Fig. 5.17.
PERIOD ENDING JUNE 10, 1956 NaK were 100 and 350 hr, and the exposures to fuel mixture for 500 hr showed that the concen- the fuel mixture were of 100 and 500 hr duration. tration of boron was less than 1% from the surface The results of the tests are presented in Table to a depth of 8 mils. The boron content then rose 3.2.2. Boron was found only in very small quan- sharply to its normal value (4%) and stayed there tities in the areas depleted of the second phase for the remainder of the traverse. Samples of the by exposure to NaK and to the fuel mixture. A depleted area, obtained by microdrilling, were microspark traverse on the sample exposed to the analyzed and were found to contain 0.6% boron. Fig. 3.2.2. Specimens of lnconel Joints Brazed with the 70% Ni-13% Ge-11% 04% Si Brazing Alloy and Exposed for 500 hr to NaK at 1500°F in the Hot Leg of an lnconel Thermal-Convection Loop. These two specimens, No. 2 and No. 6, illustrations (a) and (b), respectively, were the only samples examined that did not have large cracks in the brazing alloy. Etched with 10% oxalic acid. 150X. Reduced 8%. TABLE 3.22 RESULTS OF SEESAW CORROSION TESTS OF COAST METALS BRAZING ALLOY No. 52 (89% Ni-5% Si-4% 84% Fe) Weight Loss of Depth of Edge Depleted Specimen of Second Phase 100 0.07 0.5 350 0.23 4 500 0.34 6 3 143
- Page 77 and 78: THE SYSTEM MgF2-CaF2 L. M. Bratcher
- Page 79 and 80: 2.2. CHEMICAL REACTIONS IN MOLTEN S
- Page 81 and 82: I id PERIOD ENDING JUNE 10, 1956 an
- Page 83 and 84: PERIOD ENDlNG JUNE 10, 1956 V which
- Page 85 and 86: u the salt-metal interface, and the
- Page 87 and 88: of this reaction will be made at th
- Page 89 and 90: +- + z 6 e 6 5 3 3 > k i m 3 2 2 1
- Page 91 and 92: FeF,. The FeF, saturation points we
- Page 93 and 94: UNIF, = yN should be unity (a pure
- Page 95 and 96: Although it appears that the solubi
- Page 97 and 98: , . 2.3. PHYSICAL PROPERTIES OF MOL
- Page 99 and 100: -0 a rn u) u) DO2 oot c ;o rn OS g
- Page 101 and 102: IL, - PERIOD ENDING JUNE 70, 7956 O
- Page 103 and 104: 8 00 700 600 - 0 0, w 500 a 3 I- U
- Page 105 and 106: supporting plaque is loaded into th
- Page 107 and 108: u 2.4. PRODUCTION OF FUELS c G. J.
- Page 109 and 110: half of fiscal year 1957. This esti
- Page 111 and 112: 2.5. COMPATIBILITY OF MATERIALS AT
- Page 113 and 114: volume of 1 M tartaric acid solutio
- Page 115 and 116: After the trap has been opened, bot
- Page 117 and 118: \ Part 3 METALLURGY W. D. Manly
- Page 119 and 120: FLUORIDE FUEL MIXTURES IN INCONEL F
- Page 121 and 122: PERIOD ENDING JUNE 10, 1956 TABLE 3
- Page 123 and 124: Fig.3.1.3. Region of Maximum Attack
- Page 125 and 126: (d . terminated after 1217 and 1339
- Page 127: - . LJ BRAZING ALLOYS IN LIQUID MET
- Page 131 and 132: I PERIOD ENDING JUNE 10, 1956 I Fig
- Page 133 and 134: 0. PERIOD ENDING JUNE 10, 1956 Fig.
- Page 135 and 136: Fig. 3.2.10. Apparatus for Studying
- Page 137 and 138: STATIC TESTS OF INCONEL CASTINGS R.
- Page 139 and 140: t (JnOOSll 3n918-3NOt IOH (JoOOSI)
- Page 141 and 142: after the l00hr test. The extent of
- Page 143 and 144: tests of the Lindsay Mix specimens,
- Page 145 and 146: LJ DEVELOPMENT OF NICKEL-MOLYBDENUM
- Page 147 and 148: LJ PERIOD ENDING JUNE 10, 1956 Fig.
- Page 149 and 150: 2. Canning of the billets with '/,-
- Page 151 and 152: 165 . c, e . c3 a PERIOD ENDING JUN
- Page 153 and 154: u allow the billet to start through
- Page 155 and 156: NEUTRON SHIELD MATERIAL FOR HIGH-TE
- Page 157 and 158: PERIOD ENDfNG JUNE 10, 7956 Fig. 3.
- Page 159 and 160: wrought plate used as base material
- Page 161 and 162: J point. A mixture of 50-50 vol % L
- Page 163 and 164: WELDING PROCEDURE: VERTICAL FIXED,
- Page 165 and 166: 4 2 t 4 2 in. t 2 WCLASSFKO ORNL-LR
- Page 167 and 168: FABRICATION OF JOINTS BETWEEN PUMP
- Page 169 and 170: * h WELDING PROCEDURE PERlOD ENDING
- Page 171 and 172: 1 1 6 in. PUMP BARREL t SECTION AA
- Page 173 and 174: '4 x 6 x 20-in. INCONEL PLATES (/*-
- Page 175 and 176: UNCLASSIFIED PHOTO 17248 Fig. 3.4.1
- Page 177 and 178: through the radiator by passing col
ANP PROJECT PROGRESS REPORT<br />
Fig. 3.2.1. Specimens of lnconel Joints Brazed with <strong>the</strong> 70% Ni-13% Ge-11% Crd% Si Brazing Alloy<br />
and Exposed for 500 hr to <strong>the</strong> Fuel Mixture (No. 44) NaF-ZrF,-UF, (53.5-40-6.5 mole se) in <strong>the</strong> Hot Leg<br />
of an lnconel Thermal-Convection Loop. (a) Joint located in coolest (145OOF) portion of hot leg. (b)<br />
I<br />
Joint located in hottest (1500OF) portion of hot leg. Etched with 10% oxalic acid: 150X. Reduced 19%.<br />
was found in <strong>the</strong> cold leg of <strong>the</strong> loop that circu-<br />
lated <strong>the</strong> fuel mixture. Spectrographic analyses<br />
of <strong>the</strong>se crystals showed strong lines for chromium<br />
and nickel and weak lines for iron. There was<br />
no evidence of mass transfer in <strong>the</strong> loop that<br />
circulated NaK.<br />
The brazing alloy showed good corrosion resist-<br />
ance to NaK, as shown in Fig. 3.2.2, but large<br />
cracks which extended to a depth of one-half <strong>the</strong><br />
tube wall thickness were found in some of <strong>the</strong><br />
brazed joints, Fig. 3.2.3. It is not known whe<strong>the</strong>r<br />
<strong>the</strong>se cracks were caused by <strong>the</strong>rmal stresses or<br />
shrinkage. Analysis of <strong>the</strong> NaK after <strong>the</strong> test<br />
showed 1160 ppm of oxygen. This is admittedly<br />
high, but no efforts were made to purify <strong>the</strong> NaK<br />
which was received in container lots.<br />
A third lnconel <strong>the</strong>rmal-convection loop was<br />
operated for 500 hr in which <strong>the</strong> hot leg contained<br />
lnconel inserts brazed with <strong>the</strong> 82% Au-18% Ni<br />
brazing alloy. The fluid circulated was <strong>the</strong> fuel<br />
mixture (No. 30) NaF-ZrF,-UF, (50-46-4 mole %).<br />
The hot and cold legs were maintained at tempera-<br />
tures of 1500 and 1175OF, respectively. Micro-<br />
142<br />
scopic examination of samples from each brazed<br />
joint showed <strong>the</strong> attack on <strong>the</strong> QIIOY to average<br />
about 8 mils, with a maximum depth of 10 mils.<br />
Tests were also conducted on a series of buttons<br />
of Coast Metals brazing alloy No. 52 (89% Ni-<br />
5% Si-4% 8-294 Fe), which were exposed in see-<br />
saw apparatus to NaK (56-44 wt %) and to <strong>the</strong><br />
fuel mixture (No. 44) NaF-ZrF,-UF, (53.5-40-6.5<br />
mole %). Since previous tests of this alloy showed<br />
depletion of <strong>the</strong> second phase at <strong>the</strong> exposed<br />
edge,l <strong>the</strong>se tests were conducted to determine<br />
whe<strong>the</strong>r <strong>the</strong> high-cross-section boron component<br />
was removed and, if so, whe<strong>the</strong>r <strong>the</strong> removal was<br />
time dependent. The buttons were contained in<br />
nickel tubes with hot-zone temperatures of 1500OF<br />
for both tests and with cold-zone temperatures of<br />
llOO°F in <strong>the</strong> tests with NaK and 120OOF in <strong>the</strong><br />
tests with <strong>the</strong> fuel mixture. In a11 <strong>the</strong> tests, <strong>the</strong><br />
specimens were retained in <strong>the</strong> hot zone of <strong>the</strong><br />
test capsule. The duration of <strong>the</strong> exposures to<br />
lD. H. Jansen. ANP Qum. Prog. Rep. Dec. 10, 1955.<br />
<strong>ORNL</strong>-2012, p 119. Fig. 5.17.


