STUDIES OF ENERGY RECOVERY LINACS AT ... - CASA
STUDIES OF ENERGY RECOVERY LINACS AT ... - CASA
STUDIES OF ENERGY RECOVERY LINACS AT ... - CASA

You also want an ePaper? Increase the reach of your titles
YUMPU automatically turns print PDFs into web optimized ePapers that Google loves.
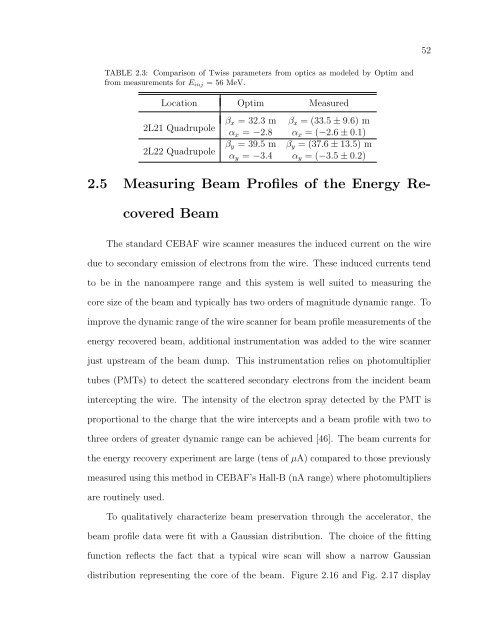
TABLE 2.3: Comparison of Twiss parameters from optics as modeled by Optim and<br />
from measurements for Einj = 56 MeV.<br />
Location Optim Measured<br />
2L21 Quadrupole<br />
2L22 Quadrupole<br />
βx = 32.3 m βx = (33.5 ± 9.6) m<br />
αx = −2.8 αx = (−2.6 ± 0.1)<br />
βy = 39.5 m βy = (37.6 ± 13.5) m<br />
αy = −3.4 αy = (−3.5 ± 0.2)<br />
2.5 Measuring Beam Profiles of the Energy Re-<br />
covered Beam<br />
The standard CEBAF wire scanner measures the induced current on the wire<br />
due to secondary emission of electrons from the wire. These induced currents tend<br />
to be in the nanoampere range and this system is well suited to measuring the<br />
core size of the beam and typically has two orders of magnitude dynamic range. To<br />
improve the dynamic range of the wire scanner for beam profile measurements of the<br />
energy recovered beam, additional instrumentation was added to the wire scanner<br />
just upstream of the beam dump. This instrumentation relies on photomultiplier<br />
tubes (PMTs) to detect the scattered secondary electrons from the incident beam<br />
intercepting the wire. The intensity of the electron spray detected by the PMT is<br />
proportional to the charge that the wire intercepts and a beam profile with two to<br />
three orders of greater dynamic range can be achieved [46]. The beam currents for<br />
the energy recovery experiment are large (tens of µA) compared to those previously<br />
measured using this method in CEBAF’s Hall-B (nA range) where photomultipliers<br />
are routinely used.<br />
To qualitatively characterize beam preservation through the accelerator, the<br />
beam profile data were fit with a Gaussian distribution. The choice of the fitting<br />
function reflects the fact that a typical wire scan will show a narrow Gaussian<br />
distribution representing the core of the beam. Figure 2.16 and Fig. 2.17 display<br />
52