- Page 1 and 2:
STUDIES OF ENERGY RECOVERY LINACS A
- Page 3 and 4:
DEDICATION To my wife Danielle and
- Page 5 and 6:
2 CEBAF with Energy Recovery . . .
- Page 7 and 8:
5.2 HOM Power . . . . . . . . . . .
- Page 9 and 10: ACKNOWLEDGMENTS First and foremost
- Page 11 and 12: 6.1 Summary of the measured effects
- Page 13 and 14: 2.10 Illustration of quadrupole sca
- Page 15 and 16: 5.1 Successive frames in time (prog
- Page 17 and 18: 6.8 A plot of 1/Qeff versus average
- Page 19 and 20: ABSTRACT An energy recovering linac
- Page 21 and 22: CHAPTER 1 Introduction An increasin
- Page 23 and 24: FIG. 1.1: Schematic of a generic li
- Page 25 and 26: FIG. 1.2: A CEBAF 5-cell cavity wit
- Page 27 and 28: The solution to Eq. (1.3) is U(t) =
- Page 29 and 30: y reducing the impedance of HOMs, a
- Page 31 and 32: Despite its success, this method of
- Page 33 and 34: design parameters, most notably ach
- Page 35 and 36: 1.4.2 Machine Optics The second cat
- Page 37 and 38: analytic model elucidates many impo
- Page 39 and 40: CHAPTER 2 CEBAF with Energy Recover
- Page 41 and 42: FIG. 2.1: Energy versus average cur
- Page 43 and 44: FIG. 2.3: Additional hardware insta
- Page 45 and 46: FIG. 2.4: A picture of the energy r
- Page 47 and 48: dipoles and beam diagnostics such a
- Page 49 and 50: FIG. 2.7: Horizontal (red) and vert
- Page 51 and 52: FIG. 2.8: Illustration of the cryom
- Page 53 and 54: linac and θNL is the RF phase. The
- Page 55 and 56: 2.4 Transverse Emittance One of the
- Page 57 and 58: where σ2 is the rms beam size meas
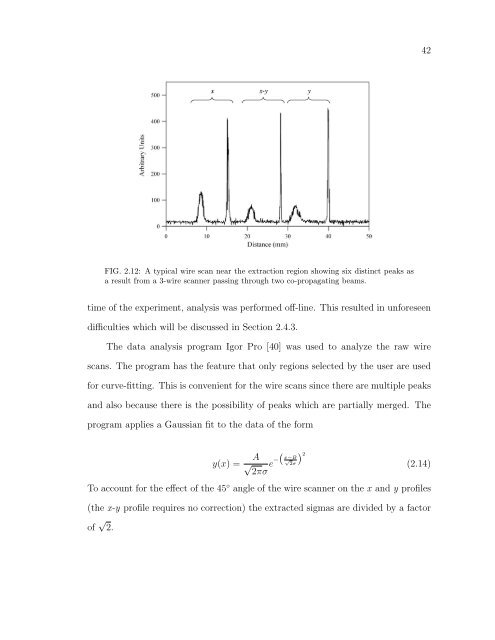
- Page 59: eams. The effects of varying the qu
- Page 63 and 64: quadratic fit and a multiple regres
- Page 65 and 66: ting the data is difficult. Without
- Page 67 and 68: primary source of error is measurin
- Page 69 and 70: identified, although the phase dela
- Page 71 and 72: TABLE 2.3: Comparison of Twiss para
- Page 73 and 74: the results of the fits. The vertic
- Page 75 and 76: FIG. 2.18: Schematic illustrating t
- Page 77 and 78: FIG. 2.19: The GASK signal measured
- Page 79 and 80: FIG. 2.20: The measured normalized
- Page 81 and 82: CHAPTER 3 The Jefferson Laboratory
- Page 83 and 84: FIG. 3.1: Schematic of the 10 kW FE
- Page 85 and 86: FIG. 3.2: Layout of the DC photocat
- Page 87 and 88: accelerating gradient at the front
- Page 89 and 90: eason for making the endloops achro
- Page 91 and 92: FIG. 3.7: Illustration of path leng
- Page 93 and 94: 3.5 Longitudinal Dynamics This sect
- Page 95 and 96: FIG. 3.9: The effect of a thin focu
- Page 97 and 98: Under the constraint that each orde
- Page 99 and 100: form of beam breakup not only occur
- Page 101 and 102: 4.1 The Pillbox Cavity Although the
- Page 103 and 104: FIG. 4.2: Electric field (red) and
- Page 105 and 106: where the full 4×4 transfer matrix
- Page 107 and 108: The threshold is inversely proporti
- Page 109 and 110: 4.3 BBU Simulation Codes: Particle
- Page 111 and 112:
6. The second pass beam bunch then
- Page 113 and 114:
which excites it. The BBU instabili
- Page 115 and 116:
Equation (4.41) is a dispersion rel
- Page 117 and 118:
FIG. 4.4: Output from MATBBU showin
- Page 119 and 120:
FIG. 4.5: Setup for measuring cavit
- Page 121 and 122:
Consequently, depending on the exte
- Page 123 and 124:
The projection of the beam displace
- Page 125 and 126:
TABLE 4.1: Experimental measurement
- Page 127 and 128:
FIG. 4.10: A plot showing the effec
- Page 129 and 130:
these cryomodules. Modes from these
- Page 131 and 132:
CHAPTER 5 Experimental Measurements
- Page 133 and 134:
threshold current - preferably with
- Page 135 and 136:
occurred at approximately 2 mA of a
- Page 137 and 138:
FIG. 5.5: FFT of a pure 2106.007 MH
- Page 139 and 140:
FIG. 5.6: Illustration to show the
- Page 141 and 142:
5.4 Measuring the Threshold Current
- Page 143 and 144:
for the HOM-beam system and is deri
- Page 145 and 146:
FIG. 5.10: Schematic of the experim
- Page 147 and 148:
FIG. 5.12: A plot of 1/Qeff versus
- Page 149 and 150:
measured HOMs in zone 3, a BTF meas
- Page 151 and 152:
FIG. 5.16: HOM voltage measured fro
- Page 153 and 154:
FIG. 5.18: A plot of the three valu
- Page 155 and 156:
the beam’s response in regions wh
- Page 157 and 158:
CHAPTER 6 BBU Suppression: Beam Opt
- Page 159 and 160:
FIG. 6.1: Schematic of a FODO cell
- Page 161 and 162:
plane [85]. Equations (6.7) and (6.
- Page 163 and 164:
6.2.3 Discussion The method of poin
- Page 165 and 166:
FIG. 6.3: Beam envelopes (horizonta
- Page 167 and 168:
FIG. 6.6: Beam position monitor rea
- Page 169 and 170:
FIG. 6.8: A plot of 1/Qeff versus a
- Page 171 and 172:
⎛ ⎞ ⎜ ⎝ 0 0 0 0 0 −1/K 0
- Page 173 and 174:
FIG. 6.11: A plot of 1/Qeff versus
- Page 175 and 176:
FIG. 6.12: Threshold current for no
- Page 177 and 178:
FIG. 6.14: Threshold current utiliz
- Page 179 and 180:
TABLE 6.1: Summary of the measured
- Page 181 and 182:
CHAPTER 7 BBU Suppression: Feedback
- Page 183 and 184:
FIG. 7.1: A schematic of the feedba
- Page 185 and 186:
FIG. 7.4: A coaxial 3-stub tuner us
- Page 187 and 188:
All of these considerations are con
- Page 189 and 190:
FIG. 7.6: Generic layout for a feed
- Page 191 and 192:
in Section 4.2.1, however, in the p
- Page 193 and 194:
FIG. 7.7: The threshold current as
- Page 195 and 196:
FIG. 7.8: Threshold current versus
- Page 197 and 198:
FIG. 7.10: The threshold current as
- Page 199 and 200:
CHAPTER 8 Conclusions The work pres
- Page 201 and 202:
le were experimentally measured. Du
- Page 203 and 204:
APPENDIX A The Pillbox Cavity Start
- Page 205 and 206:
FIG. A.1: A pillbox cavity exhibiti
- Page 207 and 208:
Ez(ρ, φ) = ψ(ρ, φ) = E0Jm(γρ
- Page 209 and 210:
FIG. B.1: Relationship of the S-par
- Page 211 and 212:
FIG. C.1: Impedance and frequency o
- Page 213 and 214:
FIG. C.5: Impedance and frequency o
- Page 215 and 216:
BIBLIOGRAPHY [1] M. Tigner, Nuovo C
- Page 217 and 218:
[22] L. Merminga, in Proceedings of
- Page 219 and 220:
[50] C. Hernandez-Garcia et al., in
- Page 221 and 222:
[79] L. Merminga et al., in Proceed
- Page 223 and 224:
VITA Christopher D. Tennant Christo