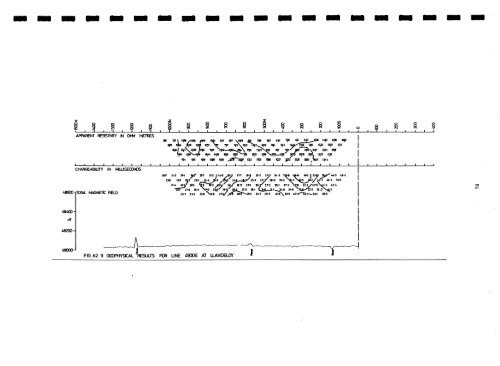
z ~ l $ l l l l l ~ l l ~ l l l l ~ l ~ l , l ~ l & APF%iRENT RESlSTMTY IN OHM MEfRES I 48600 TOTAL MbljNmC FIl3.D 1 48000 .A -- . - - - - - - - ------\ -*I-*-- FIG A2.9 G8XWSlCAL L Ts FOR UNE 4900E AT UANDEU)Y I! I
APPENDIX 3 GEOPHYSICAL RESULTS FROM THE MIDDLE MILL AREA The results are displayed on figures A3.1 to A3.6, line numbers refer to Fig. 16. As in Appendix 2, a subjective interpretation of the pseudosections has been made. Line 150W Severe artificial interference was encountered on this line, and many readings were completely unobtainable. There are two zones of high chargeability, both apparently artificial is origin. At its northern end, the line runs close to a road <strong>for</strong> 400 m, giving a complex pattern of very high, low and even negative chargeabilities. At the southern end of the line very high chargeabilities arise from dipole positions <strong>near</strong> buildings and a water pipe. The apparent resistivity also shows interference. Values are generally 600-900 ohm metres but slightly lower values obtained at lOON and higher values at about 350-450N may be significant above noise. The magnetic profile shows only man-made anomalies. Line 150E On this traverse artificial interference was a severe problem again, making many readings unobtainable. The chargeability pseudosection shows one feature which is probably due to bedrock geology, values to the south of about 150s being generally higher than those to the north. Two strong IP anomalies are almost certainly due to artificial sources: the high along the roadside at the north of the line and the narrow high across a farm lane and buried services at about 150s. The negative IP effect occurring just north of the baseline has no obvious artificial source. Resistivity, like chargeability , is higher south of about 150s than on the rest of the line. A broad resistivity low extends northwards from 150s to about 200N, where values become somewhat higher. The magnetic profile has minor peaks (about 50nT amplitude) in the area of the low resistivities and negative IP effects. Line 450E This traverse also suffers from artificial interference, Chargeabilities are generally 7 to 17 ms, with a minor high lying at the south end of the line giving values up to 25 ms. Otherwise high chargeability occurs only in areas of interference: the airfield perimeter at the northern end of the line and the farmyard at 150-300s. Variations on the resistivity pseudosec tion probably reflect bedrock variations. High resistivity occurs at 800N-500N; low values at 500N to SON, with a minimum at about 100- 200N: moderately high values recur between 50N and ZOOS, and values are again low from 200s to the housing estate at 500s. Other than aritificial anomalies there is little structure on the magnetic profile. Line 750E Line 750E had to be offset 100 m to the west at its northern end to avoid the quarry (Fig. 16). For most of its length it runs along or close to the steep slope of the Solfach river gorge, The line has three chargeability anomalies, of which two are likely to be artificial in origin. A minor IP high occurs at about 100N, where it may be related to a small intrusion. The main feature on this line is a double anomaly centred at 700-850N on the offset part of the line, immediately west of the quarry, where chargeability rises to 60 ms. In pseudosection, the anomaly has a core of low values, indicative either of an artificial conductor at about 725N or of a shallow flat- lying slab-like source less than 100 m wide. The absence of a coincident low resistivity anomaly tends to support a geological origin <strong>for</strong> this feature, but its position, between the quarry and the end of the airfield where strong anomalies were obtained on the previous line, strongly suggest an artificial source. A resistivity feature of interest on this traverse is the low at about 400N, where a fault has been mapped. Line 1050E Three chargeability anomalies occur, of which one is probably due to electrical noise from Middle Mill village at about 600N, and another to a large watermain at 700s. The third anomaly is the weakest but probably has a geological source. It is a diffuse <strong>near</strong>-surface feature on the baseline, Resistivity varies considerably, with narrow lows at about 2758 and 500N. The magnetic profile shows nothing of interest. Line 1350E AZ four chargeability anomalies on this line are probably artificial in origin, the sources being farms at 400s and 600N, cables 2 900~ and fences at 1150N. The first three also give low resistivity anomalies. The last could have a geological source, however. All but the weakest magnetic anomalies are artificial.
- Page 1:
Natural Environment Research Counci
- Page 5:
Report No. 78 @ Crown copyright 198
- Page 9 and 10:
SUMMARY REGIONAL STUDIES Intrusive
- Page 11 and 12:
SUMMARY Geological, geochemical and
- Page 13 and 14:
concluded that except for Zn the re
- Page 15 and 16:
The only rock containing evidence o
- Page 17 and 18:
Table 3 Analyses of miscellaneous r
- Page 19:
- 28 St. Brides Bay -
- Page 22 and 23:
Hercynian orogenies (M. 3. Arthur,
- Page 24 and 25:
Figure 14 Location of soil anomalie
- Page 26 and 27:
producing a very limited dispersion
- Page 28 and 29:
-1 00- Contours of VLF horizontal i
- Page 30 and 31:
area and periglacial and glacial de
- Page 32 and 33:
the Brunel Beds or the Tetragraptus
- Page 34 and 35:
contains sparse subhedral plagiocla
- Page 36 and 37: There is some variation in the alte
- Page 38 and 39: The cause of other isolated weak Cu
- Page 40 and 41: j Table 9 Summary of analyses of in
- Page 42 and 43: increase the Zr content. The divisi
- Page 44 and 45: variation between pu8M microdioritn
- Page 46 and 47: T/I~~/~~IPYS openjoi~~tcd limestone
- Page 48 and 49: Table 13 Summary statistics for sed
- Page 50 and 51: than average values quoted for sand
- Page 52 and 53: Introduction The main geophysical m
- Page 54 and 55: Figure 42 Contour map of apparent r
- Page 56 and 57: Figure 45 Contour map of tow magnet
- Page 58 and 59: Pigum? 47 Cumulative f reguency plo
- Page 60 and 61: it to this late propylitic alterati
- Page 62 and 63: HOLWSTER, V.F. 1974. An appraisal o
- Page 64 and 65: APPENDIX 1 ABBREWATEI) BOREHOLB LOG
- Page 66 and 67: BOREHOLE 2 Registration Number STvI
- Page 68 and 69: BOREHOLE 3B Registration Number SM
- Page 70 and 71: BOREHOLE 5 Registration Number SM 8
- Page 72 and 73: BOREHOLE 6 Registration Number SM 8
- Page 74 and 75: BOREHOLE 8 Registration Number SM 8
- Page 76 and 77: SANDSTONE: as above CLAY GOUGE: SAN
- Page 78 and 79: --- APPARENT ESISTIVITY pa IN OHM M
- Page 80 and 81: APPARENT ESISTMTY H Bbs ys 06 q6 CH
- Page 82 and 83: z ~ l ~ ~ ~ l ~ l . ~ l ~ , ~ l l A
- Page 84 and 85: z ~ 1 ~ 1 ~ 1 ~ 1 ~ 1 APPARENT FEJS
- Page 88 and 89: MAGNETIC FELD IN NAFTESLA Y /-*-.-.
- Page 90 and 91: !IN@ a 8 g e s s I! s F N : , S ? I
- Page 92 and 93: ~ N & E e 8 g B 8 8 7 a F N . S ~ 9
- Page 94 and 95: PHYSICAL PROPERTY MEASUREMENTS ON B
- Page 96 and 97: Borehole 8 (diameters of core 9-72
- Page 98 and 99: APPENDIX 5 COMPUTER MODELLING OF AE
- Page 101 and 102: RMS RESID - 6.53 FLU. PT ELEV ORS n
- Page 103 and 104: MRGNET I C: TIJTERF'HFTAT 1014 . .
- Page 105 and 106: ANU.YSB OF BOLPROLB CORE& TRACE ELE
- Page 107 and 108: . Sample BH , Depthv ,(m); -, - . ~
- Page 109: . , I , . . . . .. . , . , '," . ',
- Page 112 and 113: Fig.7 Aeromagnetic anomaly map of t
- Page 115 and 116: \ Fig.13. Compilation map of resist
- Page 117 and 118: Q Q E C E CCt C E Ct C Q Ct CtQ C Q
- Page 119 and 120: !2 CO N A 4 ul o ~n o ul 0 DEPTH IN
- Page 121 and 122: Fig.25 BOREHOLE 5 C C C C Ct C E K
- Page 123 and 124: Fig.27 BOREHOLE 7 E Q C Q E C 0 Q E
- Page 125: 81 82 83 84 Fig.30. : Location of c