Electric and Magnetic Field Galvanic Distortion ... - MTNet
Electric and Magnetic Field Galvanic Distortion ... - MTNet
Electric and Magnetic Field Galvanic Distortion ... - MTNet

Create successful ePaper yourself
Turn your PDF publications into a flip-book with our unique Google optimized e-Paper software.
J. Geomag. Geoelectr., 49, 767-789, 1997<br />
<strong>Electric</strong> <strong>and</strong> <strong>Magnetic</strong> <strong>Field</strong> <strong>Galvanic</strong> <strong>Distortion</strong> Decomposition of B087 Data<br />
Alan D. CHAVE 1 <strong>and</strong> Alan G. JONES 2<br />
1 Woods Hole Oceanographic Institu.tion, Woods Hole, MA 02543, USA<br />
2 Geological Su.rvey of Canada, 1 Observatory Crescent, Ottawa, Ontario K1A OY3, Canada<br />
(Received April 11, 1995; Revised January 26, 1996; Accepted January 29, 1996)<br />
The BC87 magnetotelluric data exhibit distortions due to three-dimensional structures<br />
at all scale sizes, from very local to regional. Previous work has shown that these distortions<br />
can sometimes, but not always, be described by an electric field galvanic distortion model,<br />
<strong>and</strong> hence can be removed using a tensor decomposition approach. This work extends the<br />
analysis to include galvanic distortion of the magnetic field, <strong>and</strong> shows its importance for<br />
many of the BC87 sites. However, even a combined electric <strong>and</strong> magnetic field galvanic<br />
distortion approach fails for quite a few of the sites studied. This is pervasive for periods<br />
shorter than 10 s, suggesting local 3D inductive effects, but model inadequacy at longer<br />
periods may indicate a breakdown of the model assumptions, particularly the requirement<br />
that the regional electric field be both uniform across the distorting body <strong>and</strong> comparable<br />
to that at the observation point.<br />
1. Introduction<br />
In recent years, it has become apparent that many magnetotelluric (MT) data sets can<br />
be described by a background two-dimensional (2D) regional structure coupled with local threedimensional<br />
(3D) non-inductive (usually called galvanic) distortion of the electric <strong>and</strong>/or magnetic<br />
fields. Relevant studies include Chakridi et al. (1992), Jones <strong>and</strong> Dumas (1993), Eisel <strong>and</strong> Bahr<br />
(1993), Jones et al. (1993), Kurtz et al. (1993), Ogawa et al. (1994), Marquis et al. (1995), Boerner<br />
et al. (1995), <strong>and</strong> Gupta <strong>and</strong> Jones (1995). Physically, the 3D galvanic distortion is caused by the<br />
presence of electric charges along discontinuities or gradients in electrical conductivity associated<br />
with small-scale (relative to the background inductive scale length) surface structures. Such<br />
charges alter the electric field quasi-statically at all periods, <strong>and</strong> may also influence the observed<br />
magnetic field when the charges deflect regional electric currents. The 3D surface structures<br />
cause the observed MT response function elements to be location-dependent mixtures of the 2D<br />
regional responses, <strong>and</strong> distort both their magnitudes <strong>and</strong> phases.<br />
Quantitative 2D modelling of MT data requires prior identification of regional geoelectric<br />
strike <strong>and</strong> correction of the observed response tensors for galvanic distortion. The most practical<br />
approach to date is based on a physical distortion model with decomposition of the MT response<br />
into the product of a set of distortion tensors <strong>and</strong> a 2D regional response tensor. Possibly the<br />
most widely applied galvanic distortion tensor parameterization is due to Groom <strong>and</strong> Bailey<br />
(1989), who presented a physical model for galvanic distortion of the electric field which leads to<br />
a tensor decomposition written as the product of twist, shear, <strong>and</strong> anisotropy tensors scaled by a<br />
real constant, as described below. The advantage of this parameterization over other approaches<br />
is that it isolates the unresolvable shift terms (Le., the scale factor <strong>and</strong> anisotropy tensor), <strong>and</strong><br />
separates the phase effects into resolvable twist <strong>and</strong> shear tensors. It always exists, since it is<br />
derived from a Pauli spin matrix basis which spans a space larger than required for the model<br />
(Groom, 1988), <strong>and</strong> is numerically stable. Other approaches (e.g., Bahr, 1988; Smith, 1995) mix<br />
the resolvable <strong>and</strong> unresolvable terms together, leading to problems in interpretation. Groom<br />
<strong>and</strong> Bailey (1989) further showed that their approach correctly recovers the regional strike <strong>and</strong><br />
767
768 A. D. CHAVE <strong>and</strong> A. G. JONES<br />
the two principal regional response functions, except for a static shift on each. Jones <strong>and</strong> Groom<br />
(1993) demonstrated that estimation of the regional strike in the presence of electric field galvanic<br />
distortion is inherently unstable, <strong>and</strong> encouraged the use of some type of tensor decomposition<br />
as a routine step in MT data analysis. More recently, Chave <strong>and</strong> Smith (1994) re-examined<br />
the galvanic distortion problem from first principles <strong>and</strong> derived a set of physical conditions<br />
under which a tensor decomposition approach is applicable. They also extended the Groom<br />
Bailey method to include galvanic distortion of the magnetic, as well as the electric field, <strong>and</strong><br />
demonstrated that magnetic field galvanic distortion can be important to very long periods in<br />
some MT data sets.<br />
As the scales of the regional structure <strong>and</strong> local distorting bodies cover a very wide range, it<br />
is not feasible to model galvanic distortion using presently available numerical algorithms. Consequently,<br />
it is not possible to use artificial data from numerical models to test electric <strong>and</strong> magnetic<br />
distortion tensor decomposition approaches. As a result, further advances in our underst<strong>and</strong>ing<br />
of galvanic distortion <strong>and</strong> its removal must be based on detailed, systematic examination of real<br />
data. In this paper, MT data from ten representative locations from the 150 km-Iong, east-west<br />
British Columbia Lithoprobe (BC87) transect (Jones, 1993) are re-analyzed from the raw time<br />
series, <strong>and</strong> then decomposed using both an electric <strong>and</strong> the full electric <strong>and</strong> magnetic field distortion<br />
model of Chave <strong>and</strong> Smith (1994). These BC87 responses display complex effects due<br />
to both 3D induction <strong>and</strong> galvanic distortion over scales ranging from that of an electrode array<br />
«50 m) to that of a 150 km by 50 km batholith traversed by the profile (Jones et al., 1993), <strong>and</strong><br />
hence serve as a challenging test for galvanic distortion decomposition approaches. The results<br />
indicate that electric <strong>and</strong> magnetic field galvanic distortion is present at some, but not all, sites<br />
at periods in excess of around 10 s, but that other types of distortion are prevalent at shorter<br />
periods that cannot be described using a tensor decomposition approach. For some sites, tensor<br />
decomposition fails at all periods, suggesting either (i) large-scale 3D effects, (ii) a breakdown of<br />
the conditions under which a tensor decomposition is applicable, or (iii) systematically low error<br />
estimates.<br />
2. <strong>Galvanic</strong> <strong>Distortion</strong> Tensor Decomposition<br />
The importance of galvanic distortion of both the electric <strong>and</strong> magnetic fields was apparently<br />
first recognized by the Russians. The first English-language papers dealing with the subject<br />
(Berdichevsky <strong>and</strong> Dmitriev, 1976a, b) outlined the problem, but they were not really fully<br />
appreciated by the West until much later. Larsen (1977) also briefly stated the electric <strong>and</strong><br />
magnetic field distortion problem in a theoretical sense, <strong>and</strong> Larsen (1975) derived a method for<br />
removing electric field galvanic effects in the weak distortion limit. An electric-field only tensor<br />
approach to galvanic distortion description for a 2D regional Earth was first proposed by Bahr<br />
(1984, 1985), <strong>and</strong> was taken up by Zhang et al. (1987), <strong>and</strong> Groom <strong>and</strong> Bailey (1989; see also<br />
Groom, 1988). These latter two applied a tensor decomposition to the MT impedance tensor<br />
which differed from many tensor decompositions proposed in the 1980s in that it is based on a<br />
physical model of distortion.<br />
The theory of galvanic distortion tensor decomposition is described by Groom <strong>and</strong> Bailey<br />
(1989), Groom <strong>and</strong> Bahr (1992), <strong>and</strong> Chave <strong>and</strong> Smith (1994). In the latter paper, the form<br />
of the decomposition describing distortion of the electric <strong>and</strong> magnetic fields is derived directly<br />
from the integral equation defining their scattering by surface conductivity heterogeneities. If<br />
the distortion model is applicable, the relation between the observed 2 x 2 complex MT response<br />
tensor Z <strong>and</strong> the purely anti-diagonal scaled regional response tensor Z2 at a particular frequency<br />
is<br />
(1)
770 A. D. CHAVE <strong>and</strong> A. G. JONES<br />
angle. Both of these results mean that ancillary information on the distorting body is required<br />
for structural interpretation of the galvanic distortion parameters themselves.<br />
The nonlinear set Eqs. (2)-(5) may be solved numerically using st<strong>and</strong>ard methods, either<br />
for individual MT sites or, at the penalty of a much larger computational load, simultaneously<br />
for a large number of sites under the assumption of a common regional azimuth. They also<br />
may be solved frequency-by-frequency or by imposing frequency independence on the distortion<br />
parameters at each site.<br />
Chave <strong>and</strong> Smith (1994) determined the conditions under which a tensor decomposition can<br />
be derived from the underlying integral equation which describes the physics of electromagnetic<br />
scattering. A tensor decomposition like Eq. (1) is an appropriate description of the distortion<br />
only if the background electric field is uniform across the distorting inhomogeneity <strong>and</strong> can be<br />
approximated at the inhomogeneity by its value at the observation point. The first condition, also<br />
discussed in Groom <strong>and</strong> Bahr (1992), is equivalent to requiring that the inductive scale length<br />
in the background medium <strong>and</strong> the source field scale be substantially larger than the maximum<br />
dimension of the distorting body. The second condition is more stringent, <strong>and</strong> depends in a<br />
complex way on the background <strong>and</strong> distorting electrical structures. Note that the cited conditions<br />
can be expected to vary considerably with location. For example, the regional field gradient will<br />
be much larger very close to a contact in a 2D structure compared to distant points, <strong>and</strong> the size<br />
of distorting inhomogeneities that can be treated, <strong>and</strong> the frequency range over which they can<br />
be modeled using a tensor decomposition, will differ accordingly. Since the physical dimensions<br />
of the inhomogeneity are rarely known a priori, these conditions cannot normally be applied<br />
directly, but their violation may explain some instances where tensor decompositions fail.<br />
The galvanic distortion model implicit in Eq. (1) will not be appropriate in all circumstances,<br />
<strong>and</strong> hence tests for the adequacy of the model must be devised. There are two basic approaches<br />
to model assessment: heuristic approaches, <strong>and</strong> those based on statistics. The former includes<br />
ad hoc measures of the dimensionality of the regional structure like the phase sensitive skew<br />
introduced by Bahr (1988) <strong>and</strong> used by Eisel <strong>and</strong> Bahr (1993). Another example is examination<br />
of the frequency dependence of the distortion parameters, as advocated by Groom <strong>and</strong> Bailey<br />
(1989) <strong>and</strong> Chave <strong>and</strong> Smith (1994). This is based on the premise that the distortion model<br />
is realistic when the decomposition parameters are constant over a range of frequencies. For<br />
example, it would not be surprising for a local structure to display inductive effects at high<br />
frequencies, depending on the actual geometry, conductivity, <strong>and</strong> nature of the coupling between<br />
the surface <strong>and</strong> regional structures. However, a tensor decomposition might well apply at low<br />
frequencies where the anomaly is responding non-inductively. This is most easily tested by first<br />
computing the decomposition frequency-by-frequency <strong>and</strong> then forcing frequency independence<br />
over those b<strong>and</strong>s where it seems appropriate, testing the result for statistical goodness-of-fit.<br />
Groom <strong>and</strong> Bailey (1989), Groom <strong>and</strong> Bahr (1992), Jones <strong>and</strong> Dumas (1993), <strong>and</strong> Groom et al.<br />
(1993) present illustrative examples.<br />
The most widely used statistical goodness-of-fit measure for tensor decompositions is the<br />
st<strong>and</strong>ard X 2 test between the observed <strong>and</strong> modeled response values. The conditions for this<br />
test include errors in Z that are normally distributed, <strong>and</strong> hence it depends critically on the<br />
accuracy of the error estimates for the observed response tensor. Both of these requirements are<br />
approximately met, <strong>and</strong> reliable results achieved, if the data are processed robustly (e.g., Chave<br />
<strong>and</strong> Thomson, 1989) <strong>and</strong> the errors are computed using the nonparametric jackknife (Thomson<br />
<strong>and</strong> Chave, 1991). The X 2 test has the advantage that critical values are easily estimated given<br />
the equivalent degrees of freedom, <strong>and</strong> hence st<strong>and</strong>ard tests of significance may be utilized. The<br />
details depend on the manner in which the tensor decomposition is applied. There are 8 degrees<br />
of freedom in the observed MT response tensor at each frequency. For electric field galvanic<br />
distortion, there are 7 parameters to be fit if the decomposition is applied frequency-by-frequency,<br />
so that the X2 test with 1 degree of freedom is appropriate, yielding an expected value for X 2
<strong>Electric</strong> <strong>and</strong> <strong>Magnetic</strong> <strong>Field</strong> <strong>Galvanic</strong> <strong>Distortion</strong> Decomposition of BC87 Data 771<br />
of 1 <strong>and</strong> a 95% level of 3.84. If the decomposition is applied over broad frequency b<strong>and</strong>s, then<br />
each frequency has 4 degrees of freedom minus those for the 3 telluric distortion parameters<br />
distributed across the b<strong>and</strong>. The expected value of X 2 is then approximately 4 <strong>and</strong> the 95% level<br />
is about 9.49. However, if the magnetic distortion parameters are included <strong>and</strong> the decomposition<br />
is applied frequency-by-frequency, there are 9 parameters to be fit by 8 data, <strong>and</strong> the problem is<br />
formally underdetermined. Thus, electric <strong>and</strong> magnetic galvanic distortion decompositions can<br />
only be applied over frequency b<strong>and</strong>s. For sufficiently wide b<strong>and</strong>s, <strong>and</strong> assuming the response<br />
estimates are independent, each frequency will have 4 degrees of freedom with a slight reduction<br />
due to the 5 distortion parameters which are again assumed to be distributed evenly across the<br />
b<strong>and</strong>. This situation can be assessed as for the frequency-independent electric field distortion<br />
case.<br />
Groom et al. (1993) <strong>and</strong> Jones et al. (1993) use a normalized misfit measure in which the<br />
ordinary X 2 statistic is divided by 4. This can easily be assessed for comparison purposes by<br />
dividing the above critical values by 4. However, Groom et al. (1993) assert that an acceptable<br />
fit is obtained when the normalized misfit is smaller than 4, corresponding to a X 2 of 16. This<br />
is approximately the 95% value for 8 degrees-of-freedom, <strong>and</strong> does not correctly account for the<br />
reduction in degrees-of-freedom when parameters are being fit to the data. As noted above, the<br />
proper 95% X2 value for frequency-independent parameters is 9.49, not 16, so a normalized misfit<br />
should be smaller than 2.5 rather than 4. It is recommended that the correct misfit criterion<br />
be adopted, suitably normalized when necessary. However, a single misfit statistic can be an<br />
inadequate description of how well the model fits the data; Groom et al. (1993) strongly advocate<br />
inspection of the fit of the model parameters to the data to ensure that significant features in<br />
them are being described.<br />
Finally, for the tensor decomposition Eq. (1) to be useful, it is essential not only to correct<br />
the response function estimates themselves, but also to derive meaningful confidence limits on the<br />
resulting regional responses. This is not a simple matter when the transformation is nonlinear,<br />
as in Eqs. (2)-(5). Parametric approaches are hopeless because the distributions of the elements<br />
of Eq. (1) are unknown, <strong>and</strong> probably not analytically derivable. The bootstrap-like approach<br />
of Groom et al. (1993), using realizations generated from the mean values of the estimates <strong>and</strong><br />
their variances under a Gaussian distribution assumption, is one nonparametric solution, but may<br />
fail if normality is violated. The jackknife makes no distributional assumptions whatsoever, <strong>and</strong><br />
is easily implemented, being based on successive resampling with replacement of the available<br />
data. However, use of the jackknife does require that the raw time series, or at least spectra,<br />
are available. Chave <strong>and</strong> Smith (1994) describe the implementation of the jackknife for tensor<br />
decompositions using delete-one estimates of the observed MT response tensor as will be applied<br />
in this paper.<br />
3. The BC87 Data<br />
As a component of the Lithoprobe Southern Cordilleran project, twenty-seven wideb<strong>and</strong> MT<br />
sites were collected along a 150 km long reflection seismic line in southeastern British Columbia in<br />
1987. The tectonic setting of the resulting BC87 transect is described by Jones (1993). Figure 1<br />
shows a simplified geological map of the region together with the ten BC87 MT sites selected for<br />
the present study. These ten stations were chosen to span the different geological provinces, <strong>and</strong><br />
hence presumably represent the range of distorting structures. All the sites were either 7 -channel<br />
remote-referenced, or collected as ten channel (2 times 2 electric, plus 3 magnetic) pairs in close<br />
proximity (typically 1 km apart).<br />
At the west end of the transect, sites 901/902 are a closely spaced ten channel pair situated<br />
on the Valhalla gneiss complex, a Cretaceous to early Tertiary metamorphic core complex, <strong>and</strong><br />
approximately 15 km west of the Slocan Lake Fault, a crustal-scale Eocene normal fault. Site 000
772<br />
Quaternary sediments<br />
Early Tertiary Intrusives<br />
Mid-Jurassic Intrusives<br />
A. D. CHAVE <strong>and</strong> A. G. JONES<br />
116()<br />
Metamorphic rocks (undivided)<br />
@ u. Proterozoic-Paleozoic & U. Trlasslc-L. Jurassic volcanics<br />
@ Rocky Mountain Cambrian-Devonian continental margin sedis<br />
U. Proterozolc-L. Cambrian continental margin sediments<br />
Mid-Cretaceous Intrusives @ Mid-Proterozoic Purcell continental margin sediments<br />
Fig. 1. Simplified geologic map of the BC87 region showing the locations of the MT sites used in this study<br />
(numbers in circles). Overlapping circles indicate local/remote 10-channei pairs. The patterns in the bottom<br />
panel define the surface geology, while the major geological features are defined in the top panel.<br />
is located in the Slocan Valley on the surface expression of the Slocan Lake Fault <strong>and</strong> immediately<br />
to the east of the Nelson batholith, a mid-Jurassic intrusion into the accreted terranes west of the<br />
Kootenay Arc. Site 004 is located close to the centre of the Nelson batholith. Site 006 is located<br />
just off <strong>and</strong> to the east of the batholith. Sites 009 <strong>and</strong> 007 are located on upper Proterozoic<br />
to lower Cambrian continental margin sediments associated with the Kootenay Arc. Site 008 is<br />
immediately to the east of 007 (for which it constitutes half of a ten channel pair) <strong>and</strong> on the<br />
mid-Proterozoic Purcell continental margin sediments. Sites 016 <strong>and</strong> 019 are further to the east<br />
on the Purcell Anticlinorium. (For a geological description of the Purcell Anticlinorium, <strong>and</strong> an<br />
analysis <strong>and</strong> interpretation of over 200 MT sites recorded on it, see Gupta <strong>and</strong> Jones, 1995.)<br />
The major features of the BC87 dataset are described by Jones et al. (1988). In particular,<br />
those authors stress the presence of large scale 3D distortion at many of the sites, as evident<br />
by out-of-quadrant phases for the TM mode near <strong>and</strong> on the Nelson batholith, <strong>and</strong> pervasive<br />
small scale distortion. <strong>Distortion</strong> effects <strong>and</strong> their removal from some of the data can be found<br />
. in Groom <strong>and</strong> Bahr (1992) (sites 000, 017, <strong>and</strong> 902), Groom et al. (1993) (sites 902 <strong>and</strong> 000),<br />
<strong>and</strong> Jones <strong>and</strong> Groom (1993) (sites 007 <strong>and</strong> 008). Jones et al. (1993) give a more comprehensive<br />
analysis of the distortion in the BC87 data <strong>and</strong> its removal by decomposition.
<strong>Electric</strong> <strong>and</strong> <strong>Magnetic</strong> <strong>Field</strong> <strong>Galvanic</strong> <strong>Distortion</strong> Decomposition of BC87 Data 773<br />
4. Comparison of Phoenix <strong>and</strong> Robust Estimates<br />
For each of the ten sites, the raw time series recorded at a 12 Hz rate (Phoenix "low-range"<br />
continuous data) were re-processed using an extension of the robust remote reference method<br />
of Chave <strong>and</strong> Thomson (1989), yielding the tensor MT response over the range 0.667-1820 s.<br />
The BC87 data sampled at higher rates were not used. The major improvements to the Chave<br />
<strong>and</strong> Thomson approach include automatic use of variable section sizes such that the frequency of<br />
interest is always of order the inverse section length, complete implementation of nonparametric<br />
jackknife error estimates (Thomson <strong>and</strong> Chave, 1991), <strong>and</strong> a new method for automatically<br />
controlling leverage by anomalous magnetic field values in addition to robust removal of outliers<br />
in the electric field. The use of short data sections has empirically been shown to facilitate<br />
detection of electric field outliers, especially the most common form which occurs in correlated<br />
clumps rather than as a rare isolated anomalous point. Leverage control based on the size of<br />
the hat matrix diagonal elements has been described by Chave <strong>and</strong> Thomson (1992) <strong>and</strong> will<br />
be elaborated on elsewhere. Leveraging is quite significant in the BC87 data, especially at the<br />
shortest periods. For each of the time series, the MT responses were computed at exactly the<br />
same frequencies used in the original Phoenix Geophysics processing to simplify application of the<br />
system response corrections, <strong>and</strong> the delete-one values were saved for later application to tensor<br />
decomposition as described earlier.<br />
Phoenix processing of these "low-range" data consisted of real-time cascade decimation using<br />
the Wight <strong>and</strong> Bostick (1980) scheme coupled with weighted averaging of the spectral estimates<br />
from the various substacks of the data; this is similar to method 4 described by Jones et al. (1989).<br />
The weight on each substack of eight spectral estimates was based on a parametric estimate of<br />
the variances of the two off-diagonal elements of the MT impedance tensor (Zxy <strong>and</strong> Zyx) with<br />
rejection of substacks whose weight fell below a threshold value.<br />
Despite the different approaches to MT response estimation, the Phoenix <strong>and</strong> robust remote<br />
reference controlled leverage MT tensor estimates generally compare quite favourably in the midb<strong>and</strong><br />
(5-500 s). At longer periods, the robust results are generally smoother <strong>and</strong> more consistent<br />
from frequency-to-frequency, whereas at shorter periods, the Phoenix results appear superior. The<br />
former is due to better control of leverage <strong>and</strong> outlier effects by the robust controlled leverage<br />
algorithm. The Phoenix processing utilizes thresholding to discard noisy data segments, <strong>and</strong><br />
hence its better performance at short periods might be due to the absence of data with low signalto-noise<br />
ratio near the MT "dead b<strong>and</strong>" around 1 s. When such noisy segments are pervasive,<br />
a robust program might, in fact, discard the infrequent good (Le., high SNR) segments rather<br />
than the bad ones. To test this hypothesis, coherence thresholding using the multiple coherence<br />
between the electric <strong>and</strong> two horizontal magnetic channels was implemented as a preliminary<br />
stage in robust controlled leverage processing. This had no effect except to widen the error bars<br />
as the coherence threshold <strong>and</strong> hence the number of discarded sections rose. It is possible that use<br />
of the partial, rather than multiple, coherence would yield a better result, especially if there is a<br />
polarization bias associated with low SNR data segments that is obscured by multiple coherence<br />
thresholding, but further work is required to ascertain this.<br />
However, there is a substantial discrepancy between the error estimates from the Phoenix<br />
parametric approach <strong>and</strong> the nonparametric jackknife results from the robust algodthm. Thomson<br />
<strong>and</strong> Chave (1991) demonstrated the reliability <strong>and</strong> accuracy of the jackknife approach through<br />
simulation over a variety of error distributions, as well as the concomitant unreliability of parametric<br />
approaches. Better consistency of the jackknife, as compared to the parametric errors, is<br />
demonstrated in Fig. 2, which compares the Phoenix <strong>and</strong> robust controlled leverage estimates for<br />
Zxx <strong>and</strong> Zxy at site 902 in normalized (Studentized) form. In the upper panel, the difference between<br />
the two estimates normalized by the jackknife st<strong>and</strong>ard error is shown, while at the bottom,<br />
the same quantity is normalized by the parametric st<strong>and</strong>ard error from the Phoenix processing.
Fig. 7. The X 2 misfit (top panel) <strong>and</strong> electric field distortion parameters (bottom panel) plotted against period<br />
for an electric <strong>and</strong> magnetic field galvanic distortion decomposition of the MT response at site 000 computed<br />
over running average b<strong>and</strong>s 3 frequencies wide. The dashed horizontal line in the top panel denotes the 95%<br />
critical value for 3 degrees of freedom. The three quantities shown in the bottom panel are twist (circles),<br />
shear (squares), <strong>and</strong> regional azimuth (triangles).<br />
also influence the data.<br />
However, the resulting principal apparent resistivities <strong>and</strong> phases are not consistent with<br />
a 2D structure (Fig. 8); the phase of the b direction (0 = 75.1°) is in excess of 90° <strong>and</strong> hence<br />
out-of-quadrant. Similar analysis on site 004 yields comparable frequency-independent distortion<br />
parameters to those at site 000. The principle apparent resistivities <strong>and</strong> phases are different
782 A. D. CHAVE <strong>and</strong> A. G. JONES<br />
phases were observed by Jones et al. (1993) for all sites located on the batholith. Given the<br />
complex geometry of the Nelson batholith, this is perhaps not too surprising. It must be concluded<br />
that either 3D non-galvanic effects are dominant, or that the tensor decomposition model is not<br />
applicable, or that the minimum solutions found are not necessarily the best ones for a physical<br />
description of the regional responses. As emphasized in the remarks on decomposition (Section 2),<br />
the solution is sought which tries to minimize a complex set of parameters to the model. Most of<br />
the time this has the effect of minimizing the diagonal components, thus attempting to make the<br />
description of the regional response anti-diagonal; no other physical constraints are applied. The<br />
solution found may be the one that yields the minimum misfit, but, given the error distribution,<br />
there may exist other acceptable solutions which yield a 2D regional response but which do not<br />
necessarily lead to a minimum misfit. For these data, rotation of the impedance tensor shows<br />
that it is possible to find a strike angle that constrains the two phases to lie in the first quadrant,<br />
<strong>and</strong> that angle is between 31 0 -61 0 for periods up to 250 s.<br />
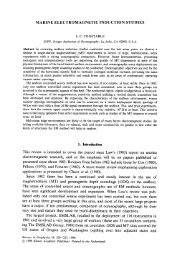
5.3 Off-Nelson batholith response (Site 006)<br />
Site 006 is located east of the Nelson batholith <strong>and</strong> near the boundary between a volcanic<br />
province <strong>and</strong> a slice of the Purcell continental margin sediments (Fig. 1). The raw MT response<br />
tensor is qualitatively similar in morphology <strong>and</strong> magnitude to the Nelson batholith response at<br />
site 004. Figure 9 shows the X 2 misfit <strong>and</strong> electric distortion parameters for an electric-only tensor<br />
decomposition of these data. The misfit is unacceptable under a 95% criterion at periods shorter<br />
than 100 s, <strong>and</strong> rises rapidly as period decreases below that point. The distortion parameters are<br />
increasingly frequency-dependent as period decreases. Attempts to force a frequency-independent<br />
fit for periods longer than 20 s, where the parameters are relatively constant, fails; the misfit<br />
remains large at periods under 10 s. Figure 10 shows the fit of a frequency-independent model to<br />
the data; in particular the Re(Zxx) <strong>and</strong> Im(Zxy) are badly fit.<br />
However, inclusion of magnetic field galvanic distortion in the model leads to an acceptable<br />
fit at periods longer than 10 s. The resulting electric distortion parameters are very similar to<br />
those in Fig. 9 except that the azimuth shows more scatter, <strong>and</strong> the magnetic field distortion<br />
parameters are quite frequency-independent. It is possible to fit a frequency-independent electric<br />
<strong>and</strong> magnetic field distortion model for periods longer than 20 s. The resulting twist, shear, <strong>and</strong><br />
azimuth are 21.3 0 , 9.8 0 , <strong>and</strong> -37.9 0 , respectively, while the magnetic distortion parameters 'Y<br />
<strong>and</strong> € are 0.025 <strong>and</strong> -0.023. Figure 11 shows the principal apparent resistivities <strong>and</strong> phases from<br />
the decomposition. The b component at an azimuth of 52° is poorly determined at periods over<br />
1000 s so that its phase is practically meaningless, reflecting the much smaller magnitude of the<br />
response in that direction. However, the phase does remain in quadrant <strong>and</strong> the MT response is<br />
interpretable in a 2D sense, unlike the Nelson batholith responses at sites 000 <strong>and</strong> 004, which are<br />
certainly close in an inductive sense at periods in excess of 100 s.<br />
5.4 Kootenay Arc response (Sites 009 <strong>and</strong> 007)<br />
Sites 009 <strong>and</strong> 007 are located on upper Proterozoic to lower Cambrian continental margin<br />
sediments, <strong>and</strong> both display strongly E-W polarized electric fields such that the ZyX <strong>and</strong> Zyy<br />
components are 5-10 times larger than the Zxx <strong>and</strong> Zxy components. Note also that sites 007<br />
<strong>and</strong>.008 were collected as a ten channel pair, but the site 008 response is markedly different than<br />
that at site 007 (Jones <strong>and</strong> Groom, 1993).<br />
A frequency-by-frequency electric-only decomposition of the site 007 data yields an acceptable<br />
fit at periods longer than 10 s, <strong>and</strong> increasing misfit at shorter periods. However, the resulting<br />
twist <strong>and</strong> regional azimuth are widely scattered, although the shear remains relatively constant<br />
across period. Inclusion of magnetic distortion improves the fit only slightly. Site 009 shows very<br />
similar characteristics except that the electric distortion fit is less acceptable, <strong>and</strong> the addition of
<strong>Electric</strong> <strong>and</strong> <strong>Magnetic</strong> <strong>Field</strong> <strong>Galvanic</strong> <strong>Distortion</strong> Decomposition of BC87 Data<br />
10- 1<br />
60f-<br />
40<br />
-40<br />
-60<br />
•<br />
•<br />
• • •<br />
• • • .... .<br />
• • •<br />
-------------------------.---------------<br />
•<br />
t 0 1 10 2<br />
Period (s)<br />
III<br />
t 0 1 10 2<br />
Period (s)<br />
• •<br />
••<br />
-.<br />
• •<br />
, 1111 I I 111111<br />
Fig. 9. The X? misfit (top panel) <strong>and</strong> electric field distortion parameters (bottom panel) plotted against period<br />
for a frequency-by-frequency electric field galvanic distortion decomposition of the MT response at site 006.<br />
The dashed horizontal line in the top panel denotes the 95% critical value for 1 degree of freedom. The three<br />
quantities shown in the bottom panel are twist (circles), shear (squares), <strong>and</strong> regional azimuth (triangles).<br />
magnetic field distortion results in overfitting at periods longer than 10 s, with X 2 values always<br />
under 2 using 3-frequency-wide running average b<strong>and</strong>s.<br />
A frequency-independent electric field only distortion model can be fit under a 95% criterion<br />
to the site 007 data for periods longer than 10 s. The twist, shear, <strong>and</strong> regional azimuth are,<br />
respectively, 38.3°, -43.0°, <strong>and</strong> -66.0°. The twist <strong>and</strong> shear approach 45°, indicating very strong<br />
surface galvanic distortion; this is the singular decomposition regime of Groom et al. (1993) <strong>and</strong><br />
783
788 A. D. CHAVE <strong>and</strong> A. G. JONES<br />
only) distortion model at periods longer than 50 s; the resulting principal responses are 2D in<br />
form. It is not possible to fit a frequency-independent model of either type at sites 016 or 019.<br />
6. Conclusions<br />
Models of the Earth based on MT data are, at best, only as good as the quality of the regional<br />
responses derived, <strong>and</strong> are functionally dependent on knowing the class of the underlying regional<br />
structure (e.g., 2D versus 3D) gleaned from the raw impedance tensor estimates. We have shown<br />
that superior estimates, particularly of errors, can be determined from MT data, <strong>and</strong> that careful<br />
study of these data for distortion effects can indicate period b<strong>and</strong>s appropriate for adopting an<br />
electric-only distortion model, or an electric <strong>and</strong> magnetic field distortion model.<br />
The re-processed data from the BC87 sites show that local 3D distortion of a 2D regional<br />
conductivity structure is a poor universal description of the responses, but does serve well for<br />
some sites over fairly broad period b<strong>and</strong>s. The failure of that model probably results from a<br />
breakdown of the basic assumptions that control its validity. In particular, for all sites on the<br />
Nelson batholith there is a change in regime at around the period of the inductive scale size of the<br />
body, or around 3-5 s for the 50 by 150 km body of 15,000 nm resistivity. It is unlikely that the<br />
background electric field will be uniform over such a large 3D body embedded in a regional 2D<br />
earth. The inadequacy of a distortion model to describe the large-scale batholith effects is most<br />
apparent by comparing the on-batholith responses (000 <strong>and</strong> 004) with the off-batholith one (006).<br />
At sufficiently long periods the responses should be the same, <strong>and</strong> they are decidedly not. In<br />
addition, as noted by Jones (1993), early studies suggest that the regional conductivity structure<br />
is 3D rather than 2D.<br />
An important use of, <strong>and</strong> advantage from, applying decomposition methodology to the data<br />
is that one obtains a guide to suggest the level of misfit when modelling the regional responses by<br />
a 2D code. If the decomposition model only fits the data to a X 2 of say 100, <strong>and</strong> the typical phase<br />
error is 1 0 , then the decomposition model is fitting the data to 4-5 0 on average. Accordingly,<br />
there is little sense fitting a 2D model to any smaller level of misfit, as one is then probably fitting<br />
artifacts of the 2D parameterization of the 3D real Earth, rather than real 2D structure.<br />
One note of caution that this study reinforces is that clearly one should not routinely apply<br />
decomposition analysis without thought. Care must be taken to assess the fit not only in statistical<br />
terms but also visually (e.g., Figs. 4 <strong>and</strong> 8) to ensure that all significant features of the data are<br />
described by the model.<br />
The BC87 data were acquired by Phoenix Geophysics Ltd.; Gerry Graham <strong>and</strong> George Elliot ensured<br />
as high a data quality as possible. This work was supported at WHOI by the Office of Basic Energy<br />
Sciences, US Department of Energy. This is Woods Hole Oceanographic Institution contribution 9165,<br />
Geological Survey of Canada contribution number 28195, <strong>and</strong> Lithoprobe publication number 730.<br />
REFERENCES<br />
Babr, K., Elimination of local 3D distortion of the magnetotelluric tensor impedance allowing for two different<br />
phases, Contributed paper at "Seventh Workshop on Electromagnetic Induction in the Earth <strong>and</strong> Moon" , held<br />
in IIe-Ife, Nigeria, on August 15-22, 1984.<br />
Bahr, K., Magnetotellurische messung des elektrischen widerst<strong>and</strong>es der erdkruste und des oberen mantels in<br />
gebieten mit lokalen und regionalen leiWihigkeitsanomalien, Ph.D. thesis, Univ. Gottingen, 1985 (in German).<br />
Bahr, K., Interpretation of the magnetotelluric impedance tensor: regional induction <strong>and</strong> local telluric distortion,<br />
J. Geophys., 62, 119-127, 1988.<br />
Berdichevsky, M. N. <strong>and</strong> V. I. Dmitriev, <strong>Distortion</strong> of magnetic <strong>and</strong> electric fields by near-surface lateral inhomogeneities,<br />
Acta Geodaet., Geophys. et Montanist. Acad. Sci. Hung., 11,447-483, 1976a.<br />
Berdichevsky, M. N. <strong>and</strong> V. I. Dmitriev, Basic principles of interpretation of magnetotelluric sounding curves, in<br />
Geoelectric <strong>and</strong> Geothermal Studies, edited by A. Adam, KAPG Geophysical Monograph, Akademiai Kiad6,<br />
165-221, 1976b.
<strong>Electric</strong> <strong>and</strong> <strong>Magnetic</strong> <strong>Field</strong> <strong>Galvanic</strong> <strong>Distortion</strong> Decomposition of BC87 Data 789<br />
Boerner, D. E., R. D. Kurtz, J. A. Craven, S. Rondenay, <strong>and</strong> W. Qian, A buried Proterozoic foredeep under the<br />
Western Canada sedimentary basin?, Geology, 23, 297-300, 1995.<br />
Chakridi, R., M. Chouteau, <strong>and</strong> M. Mareschal, A simple technique for analysing <strong>and</strong> partly removing galvanic<br />
distortion from the magnetotelluric impedance tensor: application to. Abitibi <strong>and</strong> Kapuskasing data (Canada),<br />
Geophys. J. Int., 108, 917-929, 1992.<br />
Chave, A. D. <strong>and</strong> D. J. Thomson, Some comments on magnetotelluric response function estimation, J. Geophys.<br />
Res., 94, 14,215-14,225, 1989.<br />
Chave, A. D. <strong>and</strong> D. J. Thomson, Robust, controlled leverage estimation of magnetotelluric response functions,<br />
Contributed paper at "11th Workshop on Electromagnetic Induction", held in Wellington, New Zeal<strong>and</strong>, on<br />
26 August-2 September, 1992.<br />
Chave, A. D. <strong>and</strong> J. T. Smith, On electric <strong>and</strong> magnetic galvanic distortion tensor decompositions, J. Geophys.<br />
Res., 99, 4669-4682, 1994.<br />
Eisel, M. <strong>and</strong> K. Bahr, <strong>Electric</strong>al anisotropy in the lower crust of British Columbia: an interpretation of a magnetotelluric<br />
profile after tensor decomposition, J. Geomag. Geoelectr., 45, 1115-1126, 1993.<br />
Groom, R. W., The effects of inhomogeneities on magnetotellurlcs, Ph.D. Thesis, Univ. Toronto, 212 pp., 1988.<br />
Groom, R. W. <strong>and</strong> R. C. Bailey, Decomposition of magnetotelluric impedance tensors in the presence of local<br />
three-dimensional galvanic distortion, J. Geophys. Res., 94, 1913-1925, 1989.<br />
Groom, R. W. <strong>and</strong> K. Bahr, Corrections for near surface effects: decomposition of the magnetotelluric impedance<br />
tensor <strong>and</strong> scaling corrections for regional resistivities: a tutorial, Surv. Geophys., 13, 341- 380, 1992.<br />
Groom, R. W., R. D. Kurtz, A. G. Jones, <strong>and</strong> D. E. Boerner, A quantitative methodology for determining the<br />
dimensionality of conductive structure from magnetotelluric data, Geophys. J. Int., 115, 1095-1118, 1993.<br />
Gupta, J. C. <strong>and</strong> A. G. Jones, <strong>Electric</strong>al conductivity structure of the Purcell Anticlinorium in southeast British<br />
Columbia <strong>and</strong> northwest Montana, Can. J. Earth Sci., 32, 1564-1583, 1995.<br />
Jones, A. G., The BC87 dataset: tectonic setting, previous EM results, <strong>and</strong> recorded MT data, J. Geomag.<br />
Geoelectr., 45, 1089-1105, 1993.<br />
Jones, A. G. <strong>and</strong> I. Dumas, Electromagnetic images of a volcanic zone, Phys. Earth Planet. Int., 81, 289-314,<br />
1993.<br />
Jones, A. G. <strong>and</strong> R. W. Groom, Strike angle determination from the magnetotelluric tensor in the presence of<br />
noise <strong>and</strong> local distortion: rotate at your peril!, Geophys. J. Int., 113, 524-534, 1993.<br />
Jones, A. G., R. D. Kurtz, D. W. Oldenburg, D. E. Boerner, <strong>and</strong> R. Ellis, Magnetotelluric observations along the<br />
LITHOPROBE southeastern Canadian Cordilleran transect, Geophys. Res. Lett., 15, 677-680, 1988.<br />
Jones, A. G., A. D. Chave, G. Egbert, D. Auld, <strong>and</strong> K. Bahr, A comparison of techniques for magnetotelluric<br />
response function estimation, J. Geophys. Res., 94, 14,201-14,213, 1989.<br />
Jones, A. G., R. W. Groom, <strong>and</strong> R. D. Kurtz, Decomposition <strong>and</strong> modelling of the Be87 dataset, J. Geomag.<br />
Geoelectr., 45, 1127-1150, 1993.<br />
Kurtz, R. D., J. A. Craven, E. R. Niblett, <strong>and</strong> R. A. Stevens, The conductivity of the crust <strong>and</strong> mantle beneath<br />
the Kapuskasing Uplift: electrical anisotropy in the upper mantle, Geophys. J. Int., 113, 483-498, 1993.<br />
Larsen, J. C., Low frequency (0.1--6.0 cpd) electromagnetic study of deep mantle electrical conductivity beneath<br />
the Hawaiian isl<strong>and</strong>s, Geophys. J. Royal Astron. Soc., 43, 17-46, 1975.<br />
Larsen, J. C., Removal of local surface conductivity effects from low frequency mantle response curves, Acta<br />
Geodaet., Geophys. et Montanist. Acad. Sci. Hung., 12, 183-186, 1977.<br />
Marquis, G., A. G. Jones, <strong>and</strong> R. D. Hyndman, Coincident conductive <strong>and</strong> reflective lower crust across a thermal<br />
boundary in southern British Columbia, Canada) Geophys. J. Int., 120, 111-131, 1995.<br />
Ogawa, Y., Y. Nishida, <strong>and</strong> M. Makino, A collision boundary imaged by magnetotellurics, Hidaka Mountains,<br />
central Hokkaido, Japan, J. Geophys. Res., 99, 22,373-22,388,1994.<br />
Smith, J. T., Underst<strong>and</strong>ing telluric distortion matrices, Geophys. J. Int., 122, 219-226, 1995.<br />
Thomson, D. J. <strong>and</strong> A. D. Chave, Jackknifed error estimates for spectra, coherences, <strong>and</strong> transfer functions, in<br />
Advances in Spectrum Analysis <strong>and</strong> Array Processing, Vol. 1, edited by S. Haykin, pp. 58-113, Prentice-Hall,<br />
Englewood Cliffs, NJ, 1991.<br />
Vozoff, K., (ed.), Magnetotelluric Methods, Soc. Expl. Geophys. Reprint Ser. No.5, Publ. by Soc. Expl. Geophys.,<br />
Tulsa, Oklahoma, ISBN 0-931830-36-2, 1986.<br />
Wight, D. E. <strong>and</strong> F. X. Bostick, Cascade decimation-a technique for real time estimation of power spectra,<br />
Contributed paper at "Proc. IEEE Intl. Conf. on Acoust., Speech, Signal Proc., 626--629", held in Denver,<br />
CO, on April 9-11, 1980, Reprinted in Vozoff, 1986.<br />
Zhang, P., R. G. Roberts, <strong>and</strong> L. B. Pedersen, Magnetotelluric strike rules, Geophys., 52, 267-278, 1987.