- Page 1:
Multidimensional isotropic and anis
- Page 4 and 5:
Contents 2.3. Deviation from plane
- Page 6 and 7:
Contents 8.3. Inversion of 3D model
- Page 9 and 10:
List of Figures 2.1. Amplitude of t
- Page 11 and 12:
List of Figures 4.17. Visual repres
- Page 13 and 14:
List of Figures 8.2. Ambient noise
- Page 15 and 16:
List of Figures 10.10.RMS misfit va
- Page 17:
List of Figures A.15.Result of anis
- Page 20 and 21:
List of Tables xviii 5.5. Parameter
- Page 22 and 23:
List of Acronyms FE finite element
- Page 25 and 26:
List of Symbols Below is a list of
- Page 27 and 28:
Symbol SI unit Denotation φ · pha
- Page 29:
Abstract The Tajo Basin and Betic C
- Page 32 and 33:
Publications Poster presentations x
- Page 34 and 35:
Acknowledgements Team, namely Colin
- Page 37 and 38:
Introduction 1 The Iberian Peninsul
- Page 39 and 40:
ections from enhanced one-dimension
- Page 41:
Part I Theoretical background of ma
- Page 44 and 45:
2. Sources for magnetotelluric reco
- Page 46 and 47:
2. Sources for magnetotelluric reco
- Page 48 and 49:
2. Sources for magnetotelluric reco
- Page 50 and 51:
2. Sources for magnetotelluric reco
- Page 52 and 53:
2. Sources for magnetotelluric reco
- Page 54 and 55:
2. Sources for magnetotelluric reco
- Page 56 and 57:
2. Sources for magnetotelluric reco
- Page 58 and 59:
2. Sources for magnetotelluric reco
- Page 60 and 61:
2. Sources for magnetotelluric reco
- Page 62 and 63:
2. Sources for magnetotelluric reco
- Page 64 and 65:
2. Sources for magnetotelluric reco
- Page 67 and 68:
Mathematical description of electro
- Page 69 and 70:
yields 3.2. Deriving magnetotelluri
- Page 71 and 72:
3.2. Deriving magnetotelluric param
- Page 73 and 74:
3.3. Magnetotelluric induction area
- Page 75 and 76:
Depth d s d 1 d 2 d n-2 d n-1 t 1 t
- Page 77 and 78:
3.4. Boundary conditions materials
- Page 79 and 80:
3.5. The influence of electric perm
- Page 81 and 82:
3.5. The influence of electric perm
- Page 83 and 84:
3.5. The influence of electric perm
- Page 85 and 86:
Distortion of magnetotelluric data
- Page 87 and 88:
4.1. Types of distortion Fig. 4.1.:
- Page 89 and 90:
4.1. Types of distortion Fig. 4.3.:
- Page 91 and 92:
J s 0 s 0 4.1. Types of distortion
- Page 93 and 94:
4.1. Types of distortion Fig. 4.7.:
- Page 95 and 96:
Scale Type Terminology Example Atom
- Page 97 and 98:
4.1. Types of distortion the use of
- Page 99 and 100:
4.2. Dimensionality Fig. 4.12.: The
- Page 101 and 102:
1D 2D local 3D/1D 3D/2D regional 4.
- Page 103 and 104:
4.3. General mathematical represent
- Page 105 and 106:
4.4. Removal of distortion effects
- Page 107 and 108:
Parameter Geoelectrical application
- Page 109 and 110:
4.4. Removal of distortion effects
- Page 111 and 112:
4.4.5. Caldwell-Bibby-Brown phase t
- Page 113 and 114:
4.4. Removal of distortion effects
- Page 115:
Method Applicability Swift angle 2D
- Page 118 and 119:
5. Earth’s properties observable
- Page 120 and 121:
5. Earth’s properties observable
- Page 122 and 123:
5. Earth’s properties observable
- Page 124 and 125:
5. Earth’s properties observable
- Page 126 and 127:
5. Earth’s properties observable
- Page 128 and 129:
5. Earth’s properties observable
- Page 130 and 131:
5. Earth’s properties observable
- Page 132 and 133:
5. Earth’s properties observable
- Page 134 and 135:
5. Earth’s properties observable
- Page 136 and 137:
5. Earth’s properties observable
- Page 138 and 139:
5. Earth’s properties observable
- Page 140 and 141:
5. Earth’s properties observable
- Page 142 and 143:
6. Using magnetotellurics to gain i
- Page 144 and 145:
6. Using magnetotellurics to gain i
- Page 146 and 147:
6. Using magnetotellurics to gain i
- Page 148 and 149:
6. Using magnetotellurics to gain i
- Page 150 and 151:
6. Using magnetotellurics to gain i
- Page 152 and 153:
6. Using magnetotellurics to gain i
- Page 154 and 155:
6. Using magnetotellurics to gain i
- Page 156 and 157:
6. Using magnetotellurics to gain i
- Page 158 and 159:
6. Using magnetotellurics to gain i
- Page 160 and 161:
6. Using magnetotellurics to gain i
- Page 162 and 163:
6. Using magnetotellurics to gain i
- Page 164 and 165:
6. Using magnetotellurics to gain i
- Page 168 and 169:
Part II Geology of the study area I
- Page 170 and 171:
7. Geology of the Iberian Peninsula
- Page 172 and 173:
7. Geology of the Iberian Peninsula
- Page 174 and 175:
7. Geology of the Iberian Peninsula
- Page 176 and 177:
7. Geology of the Iberian Peninsula
- Page 178 and 179:
7. Geology of the Iberian Peninsula
- Page 180 and 181:
7. Geology of the Iberian Peninsula
- Page 182 and 183:
7. Geology of the Iberian Peninsula
- Page 184 and 185:
7. Geology of the Iberian Peninsula
- Page 186 and 187:
7. Geology of the Iberian Peninsula
- Page 188 and 189:
7. Geology of the Iberian Peninsula
- Page 190 and 191:
7. Geology of the Iberian Peninsula
- Page 192 and 193:
7. Geology of the Iberian Peninsula
- Page 194 and 195:
7. Geology of the Iberian Peninsula
- Page 196 and 197:
7. Geology of the Iberian Peninsula
- Page 198 and 199:
7. Geology of the Iberian Peninsula
- Page 200 and 201:
7. Geology of the Iberian Peninsula
- Page 202 and 203:
7. Geology of the Iberian Peninsula
- Page 205 and 206:
Recovering a synthetic 3D subsurfac
- Page 207 and 208:
direction direction Depth: 12 - 30
- Page 209 and 210:
8.2. Generating synthetic 3D model
- Page 211 and 212:
Distance from the centre of the mes
- Page 213 and 214:
3D N45W 3D-crust TE Rho TE Phi Peri
- Page 215 and 216:
8.3. Inversion of 3D model data sch
- Page 217 and 218:
Model variation RMS misfit Optimal
- Page 219 and 220:
Profile: 3D-crust (TM-only) Depth (
- Page 221 and 222:
Parameter Value 8.3. Inversion of 3
- Page 223 and 224:
Depth (km) 10 -2 10 -1 10 0 10 1 10
- Page 225 and 226:
Depth (km) 10 -2 10 -1 10 0 10 1 10
- Page 227 and 228:
Step 1: Isotropic 2D inversion Step
- Page 229 and 230:
8.3. Inversion of 3D model data par
- Page 231 and 232:
8.4. Summary and conclusions bution
- Page 233 and 234:
Regularisation order Smoothing para
- Page 235 and 236:
S N 1% 0 Depth (km) 3% Depth (km) 1
- Page 237 and 238:
9.1. Profile location Data collecti
- Page 239 and 240:
Location (degrees) Recording period
- Page 241 and 242:
Geological region Stations Geologic
- Page 243 and 244:
9.4. Segregation of data acquired w
- Page 245 and 246:
Phase (degrees) 135 90 45 0 Z xy -4
- Page 247 and 248:
0 km 10 km 30 km 100 km 300 km Dept
- Page 249 and 250:
0 km 10 km 30 km 100 km 300 km Dept
- Page 251 and 252:
0 km 10 km 30 km 100 km 300 km Dept
- Page 253 and 254:
0 km 10 km 30 km 100 km 300 km Dept
- Page 255 and 256:
Pseudo-sections crustal strike dire
- Page 257 and 258:
9.8. Analysis of vertical magnetic
- Page 259:
9.8. Analysis of vertical magnetic
- Page 262 and 263:
10. Data inversion WinGLink softwar
- Page 264 and 265:
a (horizontal smoothing) 10. Data i
- Page 266 and 267:
10. Data inversion Short period ran
- Page 268 and 269:
10. Data inversion TM+TE Depth (km)
- Page 270 and 271:
10. Data inversion (a) Constrained
- Page 272 and 273:
10. Data inversion the model into u
- Page 274 and 275:
10. Data inversion Depth (km) S N 0
- Page 276 and 277:
Depth (km) 10. Data inversion S N 0
- Page 278 and 279:
10. Data inversion Group velocity m
- Page 280 and 281:
10. Data inversion ductivity of thi
- Page 282 and 283:
10. Data inversion Shtrikman upper
- Page 284 and 285:
10. Data inversion TM+TE Depth (km)
- Page 286 and 287: 10. Data inversion TM+TE Depth (km)
- Page 288 and 289: 10. Data inversion in the lithosphe
- Page 290 and 291: 10. Data inversion isotropic 2D lay
- Page 292 and 293: 10. Data inversion Depth (km) Depth
- Page 294 and 295: 10. Data inversion Depth (km) Depth
- Page 296 and 297: 10. Data inversion Depth (km) Depth
- Page 298 and 299: 10. Data inversion tigation is usua
- Page 300 and 301: Depth (km) Depth (km) 10. Data inve
- Page 302 and 303: Modelled Observed Modelled Observed
- Page 304 and 305: Depth (km) 10. Data inversion 0 30
- Page 306 and 307: 10. Data inversion Depth off LAB (k
- Page 308 and 309: 10. Data inversion Depth (km) S 0 5
- Page 310 and 311: 10. Data inversion 10.3. Summary an
- Page 312 and 313: 10. Data inversion owing to availab
- Page 315 and 316: 11 Summary and conclusions The key
- Page 317 and 318: 11.2. PICASSO Phase I investigation
- Page 319 and 320: 11.2. PICASSO Phase I investigation
- Page 321: 11.2. PICASSO Phase I investigation
- Page 324 and 325: A. Appendix Eocene 54 Ma 42 Ma 36 M
- Page 326 and 327: A. Appendix A.2. Auxiliary informat
- Page 328 and 329: A. Appendix 292 Fig. A.3.: Issues i
- Page 330 and 331: A. Appendix A.2.4. Computation time
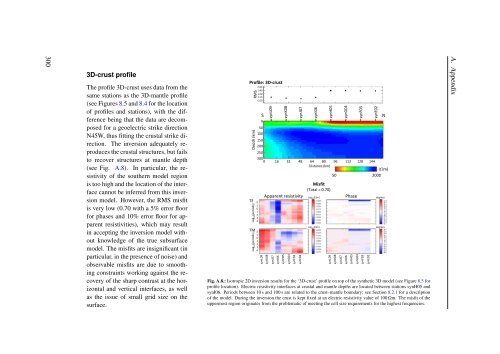
- Page 332 and 333: 296 3D-mantle profile Inversion res
- Page 334 and 335: 298 07-centre profile The profile 0
- Page 338 and 339: 302 J-centre profile The J-centre p
- Page 340 and 341: A. Appendix Anisotropy Resistivity
- Page 342 and 343: A. Appendix Anisotropy Resistivity
- Page 344 and 345: A. Appendix Anisotropy Resistivity
- Page 346 and 347: A. Appendix Anisotropy Resistivity
- Page 348 and 349: A. Appendix A.4. Auxiliary figures
- Page 350 and 351: A. Appendix 314 ρ TE(Ω−m) φ T
- Page 352 and 353: A. Appendix 316 ρ TE(Ω−m) φ T
- Page 354 and 355: A. Appendix 318 ρ TE(Ω−m) φ T
- Page 356 and 357: A. Appendix 320 pic003 (off-diagona
- Page 358 and 359: A. Appendix 322 pic013 (off-diagona
- Page 361 and 362: Bibliography Abalos, B., J. Carrera
- Page 363 and 364: Bibliography Artemieva, I. M. (2006
- Page 365 and 366: Bibliography Berdichevsky, M., V. D
- Page 367 and 368: Bibliography Cebriá, J.-M., and J.
- Page 369 and 370: Bibliography de Vicente, G., J. Gin
- Page 371 and 372: Bibliography Egbert, G. D., and J.
- Page 373 and 374: Bibliography Ganapathy, R., and E.
- Page 375 and 376: Bibliography Haak, V., and R. Hutto
- Page 377 and 378: Bibliography Hutton, R. (1972), Som
- Page 379 and 380: Bibliography Jones, A. G., and R. W
- Page 381 and 382: Bibliography Kurtz, R. D., J. A. Cr
- Page 383 and 384: Bibliography Lviv Centre of Institu
- Page 385 and 386: Bibliography Merrill, R. T., and M.
- Page 387 and 388:
Bibliography Newman, G., and G. Hoh
- Page 389 and 390:
Bibliography Pádua, M. B., A. L. P
- Page 391 and 392:
Bibliography Prácser, E., and L. S
- Page 393 and 394:
Bibliography Ritter, J. R. R., M. J
- Page 395 and 396:
Bibliography Serson, P. H. (1973),
- Page 397 and 398:
Bibliography Spitzer, K. (2006), Ma
- Page 399 and 400:
Bibliography Tikhonov, A. N., and V
- Page 401 and 402:
Bibliography Wanamaker, B. J., and
- Page 403 and 404:
Bibliography Xu, Y., C. McCammon, a