P. Schmoldt, PhD - MTNet - DIAS
P. Schmoldt, PhD - MTNet - DIAS P. Schmoldt, PhD - MTNet - DIAS
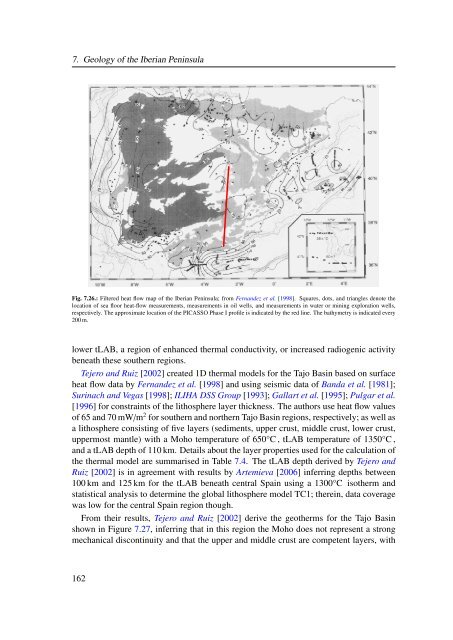
7. Geology of the Iberian Peninsula Fig. 7.26.: Filtered heat flow map of the Iberian Peninsula; from Fernandez et al. [1998]. Squares, dots, and triangles denote the location of sea floor heat-flow measurements, measurements in oil wells, and measurements in water or mining exploration wells, respectively. The approximate location of the PICASSO Phase I profile is indicated by the red line. The bathymetry is indicated every 200 m. lower tLAB, a region of enhanced thermal conductivity, or increased radiogenic activity beneath these southern regions. Tejero and Ruiz [2002] created 1D thermal models for the Tajo Basin based on surface heat flow data by Fernandez et al. [1998] and using seismic data of Banda et al. [1981]; Surinach and Vegas [1998]; ILIHA DSS Group [1993]; Gallart et al. [1995]; Pulgar et al. [1996] for constraints of the lithosphere layer thickness. The authors use heat flow values of 65 and 70 mW/m 2 for southern and northern Tajo Basin regions, respectively; as well as a lithosphere consisting of five layers (sediments, upper crust, middle crust, lower crust, uppermost mantle) with a Moho temperature of 650°C , tLAB temperature of 1350°C , and a tLAB depth of 110 km. Details about the layer properties used for the calculation of the thermal model are summarised in Table 7.4. The tLAB depth derived by Tejero and Ruiz [2002] is in agreement with results by Artemieva [2006] inferring depths between 100 km and 125 km for the tLAB beneath central Spain using a 1300°C isotherm and statistical analysis to determine the global lithosphere model TC1; therein, data coverage was low for the central Spain region though. From their results, Tejero and Ruiz [2002] derive the geotherms for the Tajo Basin shown in Figure 7.27, inferring that in this region the Moho does not represent a strong mechanical discontinuity and that the upper and middle crust are competent layers, with 162
Layer Density Thermal conductivity 7.3. Tajo Basin and central Spain Thickness Heat production North South North South (kg m −3 ) (W m −1 K −1 ) (km) (µW m −3 ) Sediment layer 2400 2.5 2 1 2.5 2.5 Upper crust 2700 2.5 12 13 3.3 2.5 Middle crust 2850 2.5 9 Lower crust 2900 2.1 8 0.8 Tab. 7.4.: Parameters of the thermal model for the Tajo Basin, assuming the thermal conductivity of the lithospheric-mantle to be 3.4 Wm −1 K −1 ; after Tejero and Ruiz [2002]. Fig. 7.27.: Geotherms of the Tajo Basin calculated for the parameters given in Table 7.4; modified from Tejero and Ruiz [2002]. the lower crust acting as an incompetent layer (Fig. 7.28). The concept of a weak lower crust, as proposed by Tejero and Ruiz [2002], is in agreement with the observed seismicity in this region, exhibiting no events in the lower crust of central Spain [Instituto Geografico Nacional, 2010] (cf. earthquake locations depict in Figure 7.22). The seismic–aseismic boundary is accordingly related to the brittle–ductile boundary of the crust; observed events are assumed to be transmitted through inherit fault zones and flexural bounding stresses from regional compression [Tejero and Ruiz, 2002]. However, the assumption of an exponential decay of heat production with depth used by the authors for the calculation of their model is questionable (cf. Vilà et al. [2010]), and the obtained thermal structure could be significantly different for the case of a constant heat production within each layer. Recently European scale models of the lithosphere’s thermal and rheological proper- 163
- Page 148 and 149: 6. Using magnetotellurics to gain i
- Page 150 and 151: 6. Using magnetotellurics to gain i
- Page 152 and 153: 6. Using magnetotellurics to gain i
- Page 154 and 155: 6. Using magnetotellurics to gain i
- Page 156 and 157: 6. Using magnetotellurics to gain i
- Page 158 and 159: 6. Using magnetotellurics to gain i
- Page 160 and 161: 6. Using magnetotellurics to gain i
- Page 162 and 163: 6. Using magnetotellurics to gain i
- Page 164 and 165: 6. Using magnetotellurics to gain i
- Page 168 and 169: Part II Geology of the study area I
- Page 170 and 171: 7. Geology of the Iberian Peninsula
- Page 172 and 173: 7. Geology of the Iberian Peninsula
- Page 174 and 175: 7. Geology of the Iberian Peninsula
- Page 176 and 177: 7. Geology of the Iberian Peninsula
- Page 178 and 179: 7. Geology of the Iberian Peninsula
- Page 180 and 181: 7. Geology of the Iberian Peninsula
- Page 182 and 183: 7. Geology of the Iberian Peninsula
- Page 184 and 185: 7. Geology of the Iberian Peninsula
- Page 186 and 187: 7. Geology of the Iberian Peninsula
- Page 188 and 189: 7. Geology of the Iberian Peninsula
- Page 190 and 191: 7. Geology of the Iberian Peninsula
- Page 192 and 193: 7. Geology of the Iberian Peninsula
- Page 194 and 195: 7. Geology of the Iberian Peninsula
- Page 196 and 197: 7. Geology of the Iberian Peninsula
- Page 200 and 201: 7. Geology of the Iberian Peninsula
- Page 202 and 203: 7. Geology of the Iberian Peninsula
- Page 205 and 206: Recovering a synthetic 3D subsurfac
- Page 207 and 208: direction direction Depth: 12 - 30
- Page 209 and 210: 8.2. Generating synthetic 3D model
- Page 211 and 212: Distance from the centre of the mes
- Page 213 and 214: 3D N45W 3D-crust TE Rho TE Phi Peri
- Page 215 and 216: 8.3. Inversion of 3D model data sch
- Page 217 and 218: Model variation RMS misfit Optimal
- Page 219 and 220: Profile: 3D-crust (TM-only) Depth (
- Page 221 and 222: Parameter Value 8.3. Inversion of 3
- Page 223 and 224: Depth (km) 10 -2 10 -1 10 0 10 1 10
- Page 225 and 226: Depth (km) 10 -2 10 -1 10 0 10 1 10
- Page 227 and 228: Step 1: Isotropic 2D inversion Step
- Page 229 and 230: 8.3. Inversion of 3D model data par
- Page 231 and 232: 8.4. Summary and conclusions bution
- Page 233 and 234: Regularisation order Smoothing para
- Page 235 and 236: S N 1% 0 Depth (km) 3% Depth (km) 1
- Page 237 and 238: 9.1. Profile location Data collecti
- Page 239 and 240: Location (degrees) Recording period
- Page 241 and 242: Geological region Stations Geologic
- Page 243 and 244: 9.4. Segregation of data acquired w
- Page 245 and 246: Phase (degrees) 135 90 45 0 Z xy -4
- Page 247 and 248: 0 km 10 km 30 km 100 km 300 km Dept
7. Geology of the Iberian Peninsula<br />
Fig. 7.26.: Filtered heat flow map of the Iberian Peninsula; from Fernandez et al. [1998]. Squares, dots, and triangles denote the<br />
location of sea floor heat-flow measurements, measurements in oil wells, and measurements in water or mining exploration wells,<br />
respectively. The approximate location of the PICASSO Phase I profile is indicated by the red line. The bathymetry is indicated every<br />
200 m.<br />
lower tLAB, a region of enhanced thermal conductivity, or increased radiogenic activity<br />
beneath these southern regions.<br />
Tejero and Ruiz [2002] created 1D thermal models for the Tajo Basin based on surface<br />
heat flow data by Fernandez et al. [1998] and using seismic data of Banda et al. [1981];<br />
Surinach and Vegas [1998]; ILIHA DSS Group [1993]; Gallart et al. [1995]; Pulgar et al.<br />
[1996] for constraints of the lithosphere layer thickness. The authors use heat flow values<br />
of 65 and 70 mW/m 2 for southern and northern Tajo Basin regions, respectively; as well as<br />
a lithosphere consisting of five layers (sediments, upper crust, middle crust, lower crust,<br />
uppermost mantle) with a Moho temperature of 650°C , tLAB temperature of 1350°C ,<br />
and a tLAB depth of 110 km. Details about the layer properties used for the calculation of<br />
the thermal model are summarised in Table 7.4. The tLAB depth derived by Tejero and<br />
Ruiz [2002] is in agreement with results by Artemieva [2006] inferring depths between<br />
100 km and 125 km for the tLAB beneath central Spain using a 1300°C isotherm and<br />
statistical analysis to determine the global lithosphere model TC1; therein, data coverage<br />
was low for the central Spain region though.<br />
From their results, Tejero and Ruiz [2002] derive the geotherms for the Tajo Basin<br />
shown in Figure 7.27, inferring that in this region the Moho does not represent a strong<br />
mechanical discontinuity and that the upper and middle crust are competent layers, with<br />
162


