P. Schmoldt, PhD - MTNet - DIAS
P. Schmoldt, PhD - MTNet - DIAS P. Schmoldt, PhD - MTNet - DIAS
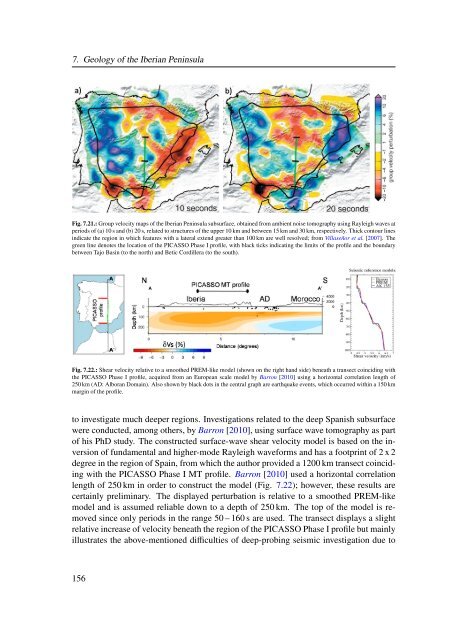
7. Geology of the Iberian Peninsula Fig. 7.21.: Group velocity maps of the Iberian Peninsula subsurface, obtained from ambient noise tomography using Rayleigh waves at periods of (a) 10 s and (b) 20 s, related to structures of the upper 10 km and between 15 km and 30 km, respectively. Thick contour lines indicate the region in which features with a lateral extend greater than 100 km are well resolved; from Villaseñor et al. [2007]. The green line denotes the location of the PICASSO Phase I profile, with black ticks indicating the limits of the profile and the boundary between Tajo Basin (to the north) and Betic Cordillera (to the south). Fig. 7.22.: Shear velocity relative to a smoothed PREM-like model (shown on the right hand side) beneath a transect coinciding with the PICASSO Phase I profile, acquired from an European scale model by Barron [2010] using a horizontal correlation length of 250 km (AD: Alboran Domain). Also shown by black dots in the central graph are earthquake events, which occurred within a 150 km margin of the profile. to investigate much deeper regions. Investigations related to the deep Spanish subsurface were conducted, among others, by Barron [2010], using surface wave tomography as part of his PhD study. The constructed surface-wave shear velocity model is based on the inversion of fundamental and higher-mode Rayleigh waveforms and has a footprint of 2 x 2 degree in the region of Spain, from which the author provided a 1200 km transect coinciding with the PICASSO Phase I MT profile. Barron [2010] used a horizontal correlation length of 250 km in order to construct the model (Fig. 7.22); however, these results are certainly preliminary. The displayed perturbation is relative to a smoothed PREM-like model and is assumed reliable down to a depth of 250 km. The top of the model is removed since only periods in the range 50 – 160 s are used. The transect displays a slight relative increase of velocity beneath the region of the PICASSO Phase I profile but mainly illustrates the above-mentioned difficulties of deep-probing seismic investigation due to 156
53 km 95 km 145 km 200 km 260 km 7.3. Tajo Basin and central Spain -3.0 % P-wave velocity relative to PREM 0.0 % +3.0 % Fig. 7.23.: Body wave tomography of the Iberian Peninsula and surrounding regions shows a generally low relative P-wave velocity beneath the peninsula. Deep reaching roots of the Pyrenees and Betic Chain are indicated by even lower velocity, whereas a region of high velocity is observed beneath the Alboran Domain; from Villaseñor et al. [2003]. The green line denotes the location of the PICASSO Phase I profile, with black ticks indicating the limits of the profile as well as the boundary between Tajo Basin (to the north) and Betic Cordillera (to the south). the location of the Iberian Peninsula. Further information about the seismic velocity of the Iberian Peninsula deep interior is provided by Villaseñor et al. [2003] using body wave tomography to derive P-wave velocity, enhancing the resolution of earlier work by Bijwaard et al. [1998] and elucidating structures between 50 km and 260 km depth (Fig. 7.23). The upper mantle beneath Iberia appears to contain predominantly low velocity materials, except for the region below the Alboran Domain exhibiting relatively high velocities, in particular for the deeper regions. The most striking features of this model are regions of exceedingly low velocities associated with the Pyrenees and Betics Chain, the latter indicating a material change along an approximately NE-SW striking interface down to a depth of at least 200 km. Given that the feature, which is causing the obtained change in seismic velocity, is likely to also have a prevailing effect on the electric conductivity structure, points towards a roughly NE-SW orientated geoelectric strike direction for the deep regions beneath southern Iberia. A distinct indication of features beneath the PICASSO Phase I profile cannot be derived from the model by Villaseñor et al. [2003], but further seismic tomography studies in this region were carried out by Amaru [2007] and Amaru et al. [2008] as part of a global subsurface investigation using P-wave travel time. A vertical transect, co-located with the PICASSO Phase I profile, was extracted from the 3D model, displaying the seismic 157
- Page 142 and 143: 6. Using magnetotellurics to gain i
- Page 144 and 145: 6. Using magnetotellurics to gain i
- Page 146 and 147: 6. Using magnetotellurics to gain i
- Page 148 and 149: 6. Using magnetotellurics to gain i
- Page 150 and 151: 6. Using magnetotellurics to gain i
- Page 152 and 153: 6. Using magnetotellurics to gain i
- Page 154 and 155: 6. Using magnetotellurics to gain i
- Page 156 and 157: 6. Using magnetotellurics to gain i
- Page 158 and 159: 6. Using magnetotellurics to gain i
- Page 160 and 161: 6. Using magnetotellurics to gain i
- Page 162 and 163: 6. Using magnetotellurics to gain i
- Page 164 and 165: 6. Using magnetotellurics to gain i
- Page 168 and 169: Part II Geology of the study area I
- Page 170 and 171: 7. Geology of the Iberian Peninsula
- Page 172 and 173: 7. Geology of the Iberian Peninsula
- Page 174 and 175: 7. Geology of the Iberian Peninsula
- Page 176 and 177: 7. Geology of the Iberian Peninsula
- Page 178 and 179: 7. Geology of the Iberian Peninsula
- Page 180 and 181: 7. Geology of the Iberian Peninsula
- Page 182 and 183: 7. Geology of the Iberian Peninsula
- Page 184 and 185: 7. Geology of the Iberian Peninsula
- Page 186 and 187: 7. Geology of the Iberian Peninsula
- Page 188 and 189: 7. Geology of the Iberian Peninsula
- Page 190 and 191: 7. Geology of the Iberian Peninsula
- Page 194 and 195: 7. Geology of the Iberian Peninsula
- Page 196 and 197: 7. Geology of the Iberian Peninsula
- Page 198 and 199: 7. Geology of the Iberian Peninsula
- Page 200 and 201: 7. Geology of the Iberian Peninsula
- Page 202 and 203: 7. Geology of the Iberian Peninsula
- Page 205 and 206: Recovering a synthetic 3D subsurfac
- Page 207 and 208: direction direction Depth: 12 - 30
- Page 209 and 210: 8.2. Generating synthetic 3D model
- Page 211 and 212: Distance from the centre of the mes
- Page 213 and 214: 3D N45W 3D-crust TE Rho TE Phi Peri
- Page 215 and 216: 8.3. Inversion of 3D model data sch
- Page 217 and 218: Model variation RMS misfit Optimal
- Page 219 and 220: Profile: 3D-crust (TM-only) Depth (
- Page 221 and 222: Parameter Value 8.3. Inversion of 3
- Page 223 and 224: Depth (km) 10 -2 10 -1 10 0 10 1 10
- Page 225 and 226: Depth (km) 10 -2 10 -1 10 0 10 1 10
- Page 227 and 228: Step 1: Isotropic 2D inversion Step
- Page 229 and 230: 8.3. Inversion of 3D model data par
- Page 231 and 232: 8.4. Summary and conclusions bution
- Page 233 and 234: Regularisation order Smoothing para
- Page 235 and 236: S N 1% 0 Depth (km) 3% Depth (km) 1
- Page 237 and 238: 9.1. Profile location Data collecti
- Page 239 and 240: Location (degrees) Recording period
- Page 241 and 242: Geological region Stations Geologic
7. Geology of the Iberian Peninsula<br />
Fig. 7.21.: Group velocity maps of the Iberian Peninsula subsurface, obtained from ambient noise tomography using Rayleigh waves at<br />
periods of (a) 10 s and (b) 20 s, related to structures of the upper 10 km and between 15 km and 30 km, respectively. Thick contour lines<br />
indicate the region in which features with a lateral extend greater than 100 km are well resolved; from Villaseñor et al. [2007]. The<br />
green line denotes the location of the PICASSO Phase I profile, with black ticks indicating the limits of the profile and the boundary<br />
between Tajo Basin (to the north) and Betic Cordillera (to the south).<br />
Fig. 7.22.: Shear velocity relative to a smoothed PREM-like model (shown on the right hand side) beneath a transect coinciding with<br />
the PICASSO Phase I profile, acquired from an European scale model by Barron [2010] using a horizontal correlation length of<br />
250 km (AD: Alboran Domain). Also shown by black dots in the central graph are earthquake events, which occurred within a 150 km<br />
margin of the profile.<br />
to investigate much deeper regions. Investigations related to the deep Spanish subsurface<br />
were conducted, among others, by Barron [2010], using surface wave tomography as part<br />
of his <strong>PhD</strong> study. The constructed surface-wave shear velocity model is based on the inversion<br />
of fundamental and higher-mode Rayleigh waveforms and has a footprint of 2 x 2<br />
degree in the region of Spain, from which the author provided a 1200 km transect coinciding<br />
with the PICASSO Phase I MT profile. Barron [2010] used a horizontal correlation<br />
length of 250 km in order to construct the model (Fig. 7.22); however, these results are<br />
certainly preliminary. The displayed perturbation is relative to a smoothed PREM-like<br />
model and is assumed reliable down to a depth of 250 km. The top of the model is removed<br />
since only periods in the range 50 – 160 s are used. The transect displays a slight<br />
relative increase of velocity beneath the region of the PICASSO Phase I profile but mainly<br />
illustrates the above-mentioned difficulties of deep-probing seismic investigation due to<br />
156


