P. Schmoldt, PhD - MTNet - DIAS
P. Schmoldt, PhD - MTNet - DIAS P. Schmoldt, PhD - MTNet - DIAS
7. Geology of the Iberian Peninsula Fig. 7.10.: a) Structural map of the Betic Cordillera with black dots denoting the location of MT recording sites and black lines indicating the location of transects shown in this figure. A-A’, B-B’, C-C’) vertical slices of the 3D model crossing the CB2 body. Therein, white dots show hypocentre locations within a 8 km margin of the respective profile, recorded since 1900. Dashed lines indicate the lithosphere–asthenosphere boundary (LAB) inferred from the resistivity distribution, and labels D1, D2, and D3 refer to features in the 3D model. From Rosell et al. [2010]. to the south [Lopez-Gomez et al., 2002] (Fig. 7.14). The basin was again separated from the northern regions of the Iberian Basin (forming the Ebro and Duero Basins) during Palaeogene Alpine convergence between Europe and Africa due to the resulting uplift of the Iberian and Catalonian Coastal Ranges [Aurell et al., 2002; Lopez-Gomez et al., 2002; Martin-Chivelet et al., 2002]. Thereafter, the Tajo Basin became the locus of Tertiary sedimentation, establishing it as an intracratonic depocentre [Alonso-Zarza et al., 2002; Gutierrez-Elorza et al., 2002]. It underwent little or no alpine deformation, but later became subdivided due to the Pliocene uplift of the Altomira Range (Sierra de Altomira in Spanish literature), a branch of the Iberian Range. The resulting subbasins are the Madrid Basin and the much smaller Loranca Basin (also referred to as Intermediate Depression or western sector of the Júcar Basin) to the north, and the Manchega Plain to the south [de Vicente et al., 1996; Alonso-Zarza et al., 2002; Andeweg, 2002; Gibbons and Moreno, 2002a; Gutierrez-Elorza et al., 2002] (Fig. 7.12). The Loranca Basin has been characterised as foreland basin produced by a westwardmoving Iberian fold–thrust belt, possessing a 1 – 1.4 km thick layer of Eocene to Quaternary sediments containing primarily sandstone, gravel, mudstones, limestone, gypsum, and lacustrine carbonates [Gomez et al., 1996; Torres et al., 1997; Andeweg, 2002]. The basin experienced a folding phase during the early Miocene, presumably due to the on- 144
7.3. Tajo Basin and central Spain Fig. 7.11.: a–b) geodynamic scheme and cross-section of the subsurface beneath Betic Cordillera and Alboran Domain proposed by Rosell et al. [2010], wherein the dashed line denotes the coast line and the red line A-A’ indicates the location of the transects b) and c). c) shows a projection of the model onto the collocated transect of the 3D inversion model by Rosell et al. [2010]. d) Seismic velocity distribution of the same region inferred from a 3D seismic tomography study by Amaru [2007], with the location of the seismic velocity–depth profile and the transects c) and d) shown in the inset as red and white line respectively. The dashed yellow line shows the approximate location of b) and c) whereas the yellow dot and the dashed white line indicate the location of the conductivity anomaly and the area of asthenospheric intrusion proposed by Rosell et al. [2010]. IC: Iberian Crust, AC: Alboran Crust (Internal Betics and Alboran Sea), LC: Ligurian Crust, ILM: Iberian Lithospheric-Mantle, ALM: Alboran Lithospheric-Mantle, LLM: Ligurian Lithospheric-Mantle, AS: Asthenosphere. Projection of the results by Rosell et al. [2010] onto a velocity–depth transect shows that anomaly is located on top of the region with relatively high velocity associated with the slab. set of the Betics–Iberian collision [Andeweg, 2002]. To its south the Manchega Plain, representing the southern region of the Tajo Basin, comprises Quaternary aeolian sediments covering a substratum made up of the terraces of the alluvial systems of the Guadiana and the Júcar rivers [Rebollal and Pérez-González, 2008]. Further south, outside the Tajo Basin, the Campo de Montiel, a region of low-lying hills of Mesozoic carbonates, formed during Jurassic – Triassic times may constitute the southernmost part of the Iberian Ranges adjacent to the Betic Cordillera (Sec. 7.2) [Aurell et al., 2002; Gutierrez- Elorza et al., 2002]. Hence, the Jurassic strata of Iberian Range and Campo de Montiel are potentially connected below the Manchega Plain forming the base of the overlying younger layers [Aurell et al., 2002, Fig. 11.7, p. 225]. The Iberian Range (also referred to as Iberian Chain in English and Sistema Ibérico or Cordillera Ibérico in Spanish literature) is a NW-SE orientated intraplate mountain range formed as consequence of pre-Alpine sedimentary Basin inversion [Tejero and Ruiz, 2002] due to the Pyrenean Orogeny [de Vicente and Vegas, 2009]. The Range was one of the few regions of the eastern Iberian Peninsula rising above sea level in pre-Cenozoic times [Andeweg, 2002]. After very limited deformation during the Late Oligocene, the 145
- Page 130 and 131: 5. Earth’s properties observable
- Page 132 and 133: 5. Earth’s properties observable
- Page 134 and 135: 5. Earth’s properties observable
- Page 136 and 137: 5. Earth’s properties observable
- Page 138 and 139: 5. Earth’s properties observable
- Page 140 and 141: 5. Earth’s properties observable
- Page 142 and 143: 6. Using magnetotellurics to gain i
- Page 144 and 145: 6. Using magnetotellurics to gain i
- Page 146 and 147: 6. Using magnetotellurics to gain i
- Page 148 and 149: 6. Using magnetotellurics to gain i
- Page 150 and 151: 6. Using magnetotellurics to gain i
- Page 152 and 153: 6. Using magnetotellurics to gain i
- Page 154 and 155: 6. Using magnetotellurics to gain i
- Page 156 and 157: 6. Using magnetotellurics to gain i
- Page 158 and 159: 6. Using magnetotellurics to gain i
- Page 160 and 161: 6. Using magnetotellurics to gain i
- Page 162 and 163: 6. Using magnetotellurics to gain i
- Page 164 and 165: 6. Using magnetotellurics to gain i
- Page 168 and 169: Part II Geology of the study area I
- Page 170 and 171: 7. Geology of the Iberian Peninsula
- Page 172 and 173: 7. Geology of the Iberian Peninsula
- Page 174 and 175: 7. Geology of the Iberian Peninsula
- Page 176 and 177: 7. Geology of the Iberian Peninsula
- Page 178 and 179: 7. Geology of the Iberian Peninsula
- Page 182 and 183: 7. Geology of the Iberian Peninsula
- Page 184 and 185: 7. Geology of the Iberian Peninsula
- Page 186 and 187: 7. Geology of the Iberian Peninsula
- Page 188 and 189: 7. Geology of the Iberian Peninsula
- Page 190 and 191: 7. Geology of the Iberian Peninsula
- Page 192 and 193: 7. Geology of the Iberian Peninsula
- Page 194 and 195: 7. Geology of the Iberian Peninsula
- Page 196 and 197: 7. Geology of the Iberian Peninsula
- Page 198 and 199: 7. Geology of the Iberian Peninsula
- Page 200 and 201: 7. Geology of the Iberian Peninsula
- Page 202 and 203: 7. Geology of the Iberian Peninsula
- Page 205 and 206: Recovering a synthetic 3D subsurfac
- Page 207 and 208: direction direction Depth: 12 - 30
- Page 209 and 210: 8.2. Generating synthetic 3D model
- Page 211 and 212: Distance from the centre of the mes
- Page 213 and 214: 3D N45W 3D-crust TE Rho TE Phi Peri
- Page 215 and 216: 8.3. Inversion of 3D model data sch
- Page 217 and 218: Model variation RMS misfit Optimal
- Page 219 and 220: Profile: 3D-crust (TM-only) Depth (
- Page 221 and 222: Parameter Value 8.3. Inversion of 3
- Page 223 and 224: Depth (km) 10 -2 10 -1 10 0 10 1 10
- Page 225 and 226: Depth (km) 10 -2 10 -1 10 0 10 1 10
- Page 227 and 228: Step 1: Isotropic 2D inversion Step
- Page 229 and 230: 8.3. Inversion of 3D model data par
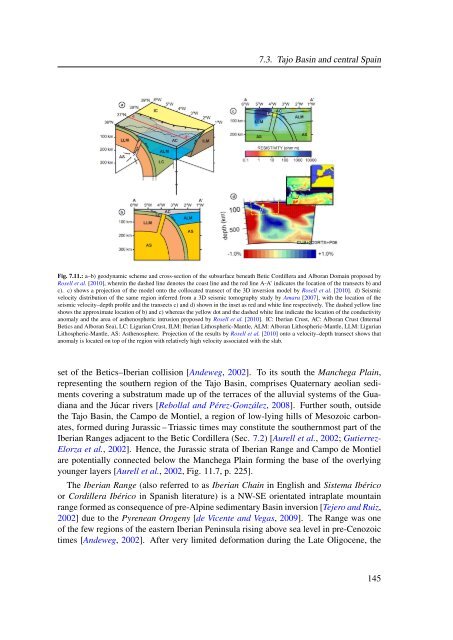
7.3. Tajo Basin and central Spain<br />
Fig. 7.11.: a–b) geodynamic scheme and cross-section of the subsurface beneath Betic Cordillera and Alboran Domain proposed by<br />
Rosell et al. [2010], wherein the dashed line denotes the coast line and the red line A-A’ indicates the location of the transects b) and<br />
c). c) shows a projection of the model onto the collocated transect of the 3D inversion model by Rosell et al. [2010]. d) Seismic<br />
velocity distribution of the same region inferred from a 3D seismic tomography study by Amaru [2007], with the location of the<br />
seismic velocity–depth profile and the transects c) and d) shown in the inset as red and white line respectively. The dashed yellow line<br />
shows the approximate location of b) and c) whereas the yellow dot and the dashed white line indicate the location of the conductivity<br />
anomaly and the area of asthenospheric intrusion proposed by Rosell et al. [2010]. IC: Iberian Crust, AC: Alboran Crust (Internal<br />
Betics and Alboran Sea), LC: Ligurian Crust, ILM: Iberian Lithospheric-Mantle, ALM: Alboran Lithospheric-Mantle, LLM: Ligurian<br />
Lithospheric-Mantle, AS: Asthenosphere. Projection of the results by Rosell et al. [2010] onto a velocity–depth transect shows that<br />
anomaly is located on top of the region with relatively high velocity associated with the slab.<br />
set of the Betics–Iberian collision [Andeweg, 2002]. To its south the Manchega Plain,<br />
representing the southern region of the Tajo Basin, comprises Quaternary aeolian sediments<br />
covering a substratum made up of the terraces of the alluvial systems of the Guadiana<br />
and the Júcar rivers [Rebollal and Pérez-González, 2008]. Further south, outside<br />
the Tajo Basin, the Campo de Montiel, a region of low-lying hills of Mesozoic carbonates,<br />
formed during Jurassic – Triassic times may constitute the southernmost part of the<br />
Iberian Ranges adjacent to the Betic Cordillera (Sec. 7.2) [Aurell et al., 2002; Gutierrez-<br />
Elorza et al., 2002]. Hence, the Jurassic strata of Iberian Range and Campo de Montiel<br />
are potentially connected below the Manchega Plain forming the base of the overlying<br />
younger layers [Aurell et al., 2002, Fig. 11.7, p. 225].<br />
The Iberian Range (also referred to as Iberian Chain in English and Sistema Ibérico<br />
or Cordillera Ibérico in Spanish literature) is a NW-SE orientated intraplate mountain<br />
range formed as consequence of pre-Alpine sedimentary Basin inversion [Tejero and Ruiz,<br />
2002] due to the Pyrenean Orogeny [de Vicente and Vegas, 2009]. The Range was one<br />
of the few regions of the eastern Iberian Peninsula rising above sea level in pre-Cenozoic<br />
times [Andeweg, 2002]. After very limited deformation during the Late Oligocene, the<br />
145


