Three-dimensional Magnetotelluric Inversion - MTNet - DIAS
Three-dimensional Magnetotelluric Inversion - MTNet - DIAS
Three-dimensional Magnetotelluric Inversion - MTNet - DIAS

Create successful ePaper yourself
Turn your PDF publications into a flip-book with our unique Google optimized e-Paper software.
<strong>Three</strong>-<strong>dimensional</strong> <strong>Magnetotelluric</strong><br />
<strong>Inversion</strong><br />
by<br />
Anna Avdeeva<br />
Thesis presented for the degree of<br />
Doctor of Philosophy<br />
to the National University of Ireland<br />
Research conducted at:<br />
The Dublin Institute for Advanced Studies,<br />
5 Merrion Square, Dublin 2<br />
and<br />
Department of Earth and Ocean Sciences, Faculty of Science,<br />
National University of Ireland, Galway<br />
Supervisors: Dr. Colin Brown,<br />
Professor Alan Jones and Dr. Dmitry Avdeev<br />
January 2008
Contents<br />
List of Symbols v<br />
List of Abbreviations vii<br />
Acknowledgements viii<br />
Summary x<br />
1. Introduction 1<br />
1.1. Thesis outline . . . . . . . . . . . . . . . . . . . . . . . . . . . . . . . 1<br />
1.2. History and main aspects of magnetotellurics . . . . . . . . . . . . . . 3<br />
1.2.1. Sources . . . . . . . . . . . . . . . . . . . . . . . . . . . . . . 3<br />
1.2.2. Conductivity mechanisms in earth materials . . . . . . . . . . 5<br />
1.2.3. Practical measurements and processing . . . . . . . . . . . . . 6<br />
1.2.4. MT applications . . . . . . . . . . . . . . . . . . . . . . . . . 8<br />
1.3. Maxwell’s equations and very basic definitions . . . . . . . . . . . . . 11<br />
1.4. History of 3D MT inversion . . . . . . . . . . . . . . . . . . . . . . . 13<br />
2. Essential parts of EM inversion 16<br />
2.1. Forward modelling method . . . . . . . . . . . . . . . . . . . . . . . . 16<br />
2.1.1. Key formulae of IE method . . . . . . . . . . . . . . . . . . . 18<br />
2.1.2. Bottlenecks of serial implementation . . . . . . . . . . . . . . 21<br />
2.1.3. Parallel implementation . . . . . . . . . . . . . . . . . . . . . 23<br />
2.2. Optimization method . . . . . . . . . . . . . . . . . . . . . . . . . . . 28<br />
2.2.1. General setting of EM inverse problem, as optimization problem 28<br />
2.2.2. Quasi-Newton optimization method . . . . . . . . . . . . . . . 29<br />
2.3. Regularization . . . . . . . . . . . . . . . . . . . . . . . . . . . . . . . 33<br />
3. 1D MT <strong>Inversion</strong> 35<br />
3.1. Theory and basic equations . . . . . . . . . . . . . . . . . . . . . . . 35<br />
ii
Contents<br />
3.1.1. Calculation of derivatives ∂ϕd<br />
∂σk<br />
. . . . . . . . . . . . . . . . . . 37<br />
3.1.2. Regularization technique . . . . . . . . . . . . . . . . . . . . . 42<br />
3.2. Model study . . . . . . . . . . . . . . . . . . . . . . . . . . . . . . . . 43<br />
3.3. Conclusions . . . . . . . . . . . . . . . . . . . . . . . . . . . . . . . . 47<br />
4. 3D MT <strong>Inversion</strong> 48<br />
4.1. Theory and basic equations . . . . . . . . . . . . . . . . . . . . . . . 49<br />
4.1.1. Calculation of derivatives ∂ϕd<br />
∂σk<br />
. . . . . . . . . . . . . . . . . . 50<br />
4.1.2. Regularization technique . . . . . . . . . . . . . . . . . . . . . 58<br />
4.2. Model study . . . . . . . . . . . . . . . . . . . . . . . . . . . . . . . . 61<br />
4.2.1. Two-layered half-space . . . . . . . . . . . . . . . . . . . . . . 62<br />
4.2.2. Buried conductive dyke . . . . . . . . . . . . . . . . . . . . . . 67<br />
4.2.3. Outcropping conductive dyke . . . . . . . . . . . . . . . . . . 76<br />
4.2.4. Two adjacent blocks . . . . . . . . . . . . . . . . . . . . . . . 83<br />
5. Additional regularization 104<br />
5.1. Preconditioning by a model covariance matrix . . . . . . . . . . . . . 106<br />
5.2. Preconditioning by the Hessian matrix . . . . . . . . . . . . . . . . . 113<br />
5.2.1. Calculation of second derivatives<br />
∂ 2 ϕd<br />
∂σk∂σk<br />
. . . . . . . . . . . . . 113<br />
6. Conclusions 116<br />
A. MT impedance 121<br />
A.1. Impedance of a layered Earth . . . . . . . . . . . . . . . . . . . . . . 121<br />
A.2. Impedance of 3D Earth . . . . . . . . . . . . . . . . . . . . . . . . . . 123<br />
B. Calculation of Digital Convolution 124<br />
C. How to measure the 3D misfit? 126<br />
D. More general 3D misfit and its derivative 128<br />
E. Hydrocarbon reservoir detectability study 130<br />
E.1. Numerical examples . . . . . . . . . . . . . . . . . . . . . . . . . . . . 131<br />
E.1.1. Time-domain modelling . . . . . . . . . . . . . . . . . . . . . 131<br />
E.1.2. Frequency-domain modelling . . . . . . . . . . . . . . . . . . . 134<br />
E.2. Comparison of time-domain and frequency-domain methods . . . . . 136<br />
E.3. Conclusions . . . . . . . . . . . . . . . . . . . . . . . . . . . . . . . . 138<br />
iii
Contents<br />
References 139<br />
iv
List of Symbols<br />
Symbol Description of Symbol<br />
(x, y, z) Cartesian coordinates [m] and z representing positive<br />
down<br />
E Electric field vector with x, y and z components Ex, Ey<br />
and Ez respectively [Vm −1 ]<br />
H Magnetic field vector with x, y and z components Hx,<br />
Hy and Hz respectively [Am −1 ], or Hessian matrix<br />
T Period [s]; 1/T = frequency f [s −1 ]<br />
ω Angular frequency [rad s −1 ] ; ω = 2πf<br />
µ Permeability [Hm −1 ]<br />
µ0<br />
Magnetic permeability of vacuum [Hm −1 ] ; µ0 = 4π ×<br />
10 −7 Hm −1<br />
ε Dielectric permittivity<br />
ρ Electrical resistivity [Ωm]<br />
ρ app Apparent resistivity [Ωm]<br />
σ Electrical conductivity [Sm −1 ]; σ = 1/ρ<br />
σk<br />
Electrical conductivity of k-th cell or layer [Sm −1 ]<br />
δ Skin depth [m], or Dirac’s delta-function<br />
Zij<br />
Dij<br />
Dij<br />
2 × 2 complex-valued matrix of MT impedance tensor<br />
2×2 complex-valued matrix of observed MT impedance<br />
tensor<br />
2 × 2 complex-valued matrix of noiseless MT impedance<br />
tensor<br />
v
List of Symbols<br />
Symbol Description of Symbol<br />
ϕ Objective (or penalty) function<br />
ϕd<br />
ϕs<br />
Data misfit<br />
Regularization function (or stabilizer)<br />
λ Regularization parameter<br />
m Vector consisting of model parameters<br />
N Number of model parameters<br />
NS<br />
NT<br />
nit<br />
nfg<br />
ncp<br />
Number of MT sites<br />
Number of frequencies<br />
Number of quasi-Newton iterations<br />
Number of evaluations of penalty function together with<br />
its gradient<br />
Number of correction pairs<br />
tr Trace of its matrix argument<br />
ℜ Real part of its argument<br />
ℑ Imaginary part of its argument<br />
x3d IE forward modelling code by Avdeev et al. (1997, 2002)<br />
vi
List of Abbreviations<br />
Abbreviation Description of Abbreviation<br />
1D one-<strong>dimensional</strong><br />
2D two-<strong>dimensional</strong><br />
3D three-<strong>dimensional</strong><br />
EM electromagnetism<br />
MT magnetotellurics<br />
QN quasi-Newton (method)<br />
GN Gauss-Newton (method)<br />
NLCG non-linear conjugate gradient (method)<br />
BFGS the Broyden-Fletcher-Goldfarb-Shanno algorithm<br />
L-BFGS the limited memory Broyden-Fletcher-Goldfarb-Shanno<br />
algorithm<br />
L-BFGS-B the limited memory Broyden-Fletcher-Goldfarb-Shanno<br />
algorithm for bound constrained optimization<br />
FD finite-difference (method)<br />
FE finite-element (method)<br />
IE integral equation (method)<br />
MPI message passing interface<br />
vii
Acknowledgements<br />
There are a number of people without whose help, support and guidance I would<br />
never have completed this thesis.<br />
First, I would like to express my thanks to my father Dmitry Avdeev with whom<br />
I constantly collaborated during this four-years work on my PhD. His patient and<br />
determined support, advice, expertise and helpful suggestions were always available<br />
at just the right moments. His knowledge of mathematics, geophysics and life not<br />
only helped me in writing this thesis, but taught me valuable lessons in all aspects<br />
of life.<br />
My supervisors Alan Jones and Colin Brown gave me the opportunity to work<br />
with various researchers around the world and to present my work on numerous<br />
occasions. They together with my external examiner Mark Everett made a lot of<br />
detailed comments and suggestions, which helped to improve this thesis.<br />
I also would like to thank Professor Luke Drury, the director of the CosmoGrid<br />
Project, for benevolence, interest in my work and kind support.<br />
Max Moorkamp made a lot of important corrections and suggestions, which helped<br />
to improve this thesis immensely. He showed endless patience at work and at home<br />
during times of despair.<br />
Thanks to Brian O’Reilly, who corrected the English in a number of papers and<br />
abstracts submitted to various journals and conferences.<br />
During my two-month visit to the Laurence Berkeley National Laboratory in<br />
Summer 2006, Gregory Newman and Michael Commer showed me how to handle<br />
3D finite-difference modelling codes in the frequency and the time domain. This<br />
visit helped to widen my scientific horizon.<br />
Professor Hisashi Utada helped me with the hassle I had to get a Japanese visa<br />
and kindly hosted me in the Ocean Hemisphere Research Center of University of<br />
Tokyo in July 2007, where I could closely work with Dmitry Avdeev at the final<br />
stage of this work.<br />
Thank you very much also to Jessica Spratt for leading the Canadian MT field-<br />
viii
Acknowledgements<br />
works in summer 2004, which gave me a general understanding of MT.<br />
I would like also to thank the rest of the School of Cosmic Physics staff at Merrion<br />
Square. Their company at numerous very interesting coffee breaks provided a great<br />
deal of diversion and entertainment.<br />
Huge thanks to Hilary O’Donnell for helping with difficulties of my casual life and<br />
for being such a good friend. She was always there in every difficult situation.<br />
Without the moral support of my parents and my grandmother I certainly could<br />
never have completed this thesis, or even started it.<br />
Finally, I gratefully acknowledge that this work has been financially supported<br />
by CosmoGrid, a research and technology development project funded as part of<br />
the Programme for Research in Third Level Institutions (PRTLI) supported by the<br />
National Development Plan.<br />
ix
Summary<br />
The main objective of my PhD research is developing a better understanding of the<br />
mathematics, physics and numerical aspects of 3D MT inversion. This should lead<br />
to a working software that allows inversion of MT datasets in three dimensions. It<br />
is well known that reliable inversion includes three important and well-developed<br />
constituents: forward modelling, optimization and regularization methods. Fortu-<br />
nately, I am lucky to have full access to an up-to-date forward modelling code, x3d.<br />
In addition there is a large number of optimization and regularization techniques.<br />
Having all those components in place greatly facilitate my task. It should be under-<br />
stood however that developing such complicated software as 3D inversion is not by<br />
any means a simple mix of the three constituents mentioned above. Even if all three<br />
mentioned constituents are ready to be used, the development of reliable inversion<br />
software still requires many years of hard work, as is shown by experience of many<br />
other inversion software developers. So why is it not just a simple mix? First of<br />
all, all three main constituents should be adjusted to our specific case - 3D MT<br />
data. As an example, it is unclear a priori which optimization method better suits<br />
3D MT inversion. The theory and algorithm of our chosen optimization method -<br />
the limited memory quasi-Newton (QN) method - is presented in Section 2.2. To<br />
investigate what specific parameters of QN optimization are optimal for 3D MT<br />
inversion we, as a start, studied thoroughly the 1D MT case (Chapter 3). Another<br />
important point is that optimization methods require the calculation of derivatives<br />
(such as gradients, Jacobians, Hessians) of some penalty function. In my work this<br />
important question is considered in Sections 3.1.1 and 4.1.1. Even more simple than<br />
this, it is unclear a priori what specific form of the penalty function is effective for<br />
3D MT inversion. We introduce the chosen penalty function for the 3D case in<br />
Section 4.1. Finally, of course, the whole approach has to be verified on synthetic<br />
examples. We performed this verification for several representative MT models and<br />
present the results in Section 4.2 and Chapter 5.<br />
In summary we have developed a working 3D MT inversion approach and verified<br />
x
it on synthetic test examples.<br />
Summary<br />
Of course, as usual some unresolved problem remains. This problem is related<br />
to the physics of the 3D MT inversion itself, rather than to bugs in the numerical<br />
software. This problem manifests itself in the synthetic experiment presented in<br />
Section 4.2.4. There we encountered a problem that the recovered anomaly image<br />
shows erratic behaviour in conductivity in the upper part of the model. For the<br />
moment the reason for this behaviour is clear - sizes of inversion cells are much<br />
smaller than an average distance between MT sites and at the same time the gradient<br />
is much higher for cells located just below the sites. This problem is not new and<br />
some remedies has been proposed. For example, usage of model covariance matrix<br />
to address this problem is reported in Siripunvaraporn et al. (2005) or usage of<br />
preconditioning of Newton system by an approximation to the inverted Hessian<br />
matrix (Newman, personal communication). This is discussed in Chapter 5 and is<br />
subject of my ongoing research.<br />
Regardless of this unresolved issue, our solution can be used to recover the true<br />
resistivity of the lower parts of realistic Earth models. Proper recovery of the true<br />
resistivity for the upper part of the models depends on many factors, such as the<br />
geometry and resistivity of the structures inside the Earth, coverage of the region<br />
by MT sites and many others.<br />
xi
Chapter 1.<br />
Introduction<br />
1.1. Thesis outline<br />
This thesis consists of six chapters. As this work was performed in close collabo-<br />
ration with Dr. Dmitry Avdeev, I will also describe for each chapter the specific<br />
contributions I made.<br />
In Chapter 1 we give a brief overview of magnetotellurics, and its contributions to<br />
understanding Earth interior structure and dynamic processes. Then we shortly out-<br />
line the basic equations of electromagnetism - Maxwell’s equations. In this chapter<br />
we also present the history and relevant references on three-<strong>dimensional</strong> magneto-<br />
telluric inversion.<br />
In Chapter 2 we present the essential parts of our EM inversion technique. These<br />
are forward modelling, optimization and regularization methods. In Section 2.1, we<br />
describe the basics of the integral equation (IE) approach for modelling EM fields<br />
in three dimensions, since we use the x3d forward modelling IE code by Avdeev<br />
et al. (1997, 2002) as an engine for 3D inversion. In order to accelerate the inversion<br />
I parallelized critical subroutines of the x3d code using message passing interface<br />
(MPI). We outline this parallel implementation and present some results obtained on<br />
distributed and shared memory clusters in Section 2.1.3. A 2D digital convolution<br />
routine used by the IE method is a performance bottleneck in its serial implemen-<br />
tation, and is this part that we accelerate through parallelization. In Section 2.2 we<br />
describe in detail how to formulate MT inversion as a quasi-Newton optimization<br />
problem. We also present the basic equation for a particular form of QN method, the<br />
so-called limited memory quasi-Newton method, which we further use in this work.<br />
It should be noted here that our setting is somewhat unconventional for EM, since<br />
we chose to use conductivities as model parameters and explicitly impose natural<br />
1
Chapter 1. Introduction<br />
conductivity constraints. The conventional way is to use logarithmic transforma-<br />
tion to ensure positiveness of the conductivity values. In Section 2.3 we consider<br />
a Tikhonov-type regularization to stabilize the solution, as the inverse problem is<br />
ill-posed.<br />
In order to test the QN method, I applied it to 1D MT and present the results in<br />
Chapter 3. Thus, we introduce the particular form of the data misfit and stabilizer<br />
we use for this case. In addition, we present a complete theory for calculating the<br />
gradient of the penalty function, based on the IE representation. This theory forms a<br />
very useful prelude to the general case of 3D inversion. I performed a large number<br />
of numerical studies for this 1D case to optimize the parameters for our limited<br />
memory quasi-Newton inversion. Tuning the method using 3D models would be too<br />
expensive in terms of computer time and storage.<br />
Chapter 4 is a key chapter of this work. It is devoted to our solution of the<br />
3D MT inverse problem. In Section 4.1 we present the problem as an optimiza-<br />
tion problem for a special form of penalty function. We propose this new form of<br />
penalty function, as it most adequately represents MT data misfit. There we also<br />
present the complete theory for the calculation of gradients of the penalty function<br />
with an adjoint method. The application of the adjoint method to the particular<br />
case of 3D MT was mainly performed by Dr. Dmitry Avdeev. The equations in-<br />
volved in this derivation are presented in Section 4.1.1. The solution of the inverse<br />
problem in three dimensions also requires an advanced type of regularization that<br />
I implemented and tested. Section 4.2 is devoted to synthetic model studies that<br />
are extremely important for proper judgment of the quality of our approach. These<br />
studies involve information about performance, robustness and limitations of the<br />
inversion. We present several 3D MT models and the corresponding results of the<br />
inversion obtained for these models.<br />
Chapter 5 we discuss different preconditioners, which can help to smooth the<br />
erratic behaviour of the conductivity values in the upper part of the inversion re-<br />
sults observed for some of our synthetic examples. In Chapter 6 we present some<br />
conclusions and outline the possibilities for future work.<br />
Some additional material to further understand the inversion method is placed<br />
into appendices. This material is not essential for general comprehension, but gives<br />
deeper understanding of the mathematics involved.<br />
2
Chapter 1. Introduction<br />
1.2. History and main aspects of magnetotellurics<br />
<strong>Magnetotelluric</strong>s (MT) appeared in the 1950’s as a method of electromagnetic sound-<br />
ing of the Earth (Tikhonov, 1950; Cagniard, 1953). In contrast to other geoelectrical<br />
methods, which are based on the study of the relationship between electromagnetic<br />
fields and their sources, the MT method is studying the ratios between the horizontal<br />
components of the electric (telluric) and magnetic fields to investigate the electrical<br />
conductivity structure of the Earth. This is due to the fact that the sources of MT<br />
are ionospheric and magnetospheric currents originating from the interaction of solar<br />
and near-earth plasma with the Earth’s magnetic field, and we do not have precise<br />
information on the distribution of these currents. Fortunately, in most cases the<br />
electromagnetic field arising from these sources can be considered a plane wave and<br />
the source geometry does not need to be known. This is one of the advantages of<br />
MT, as the geometry of artificial sources complicates the interpretation (i.e. forward<br />
modelling and inversion). In the following section we describe the MT sources in<br />
more detail.<br />
1.2.1. Sources<br />
There are two major types of source mechanisms that generate electromagnetic fields<br />
used for MT soundings (e.g. Simpson and Bahr, 2005):<br />
1. Above 1 Hz the electromagnetic waves used for MT sounding are generated by<br />
worldwide lightning activity. The electromagnetic waves emitted by individual<br />
lightning strokes get partially trapped in the waveguide, formed between the<br />
conductive ionosphere, the part of the atmosphere with the largest concentra-<br />
tion of ions extending from 100 to 250 km above the Earth’s surface, and the<br />
Earth. These waves can travel long distances and the lightning somewhere<br />
in the world is enough to provide a continuous source at any location of the<br />
Earth’s surface. The measured field at the surface of the Earth is a superposi-<br />
tion of waves generated from individual lightnings and the exact characteristics<br />
of the electromagnetic fields depends on the size, shape and the nature of the<br />
boundaries of the waveguide. As long as the measurements are far away from<br />
the individual thunderstorms this superposition can be considered as a plane<br />
wave.<br />
2. Solar wind consists of ionized particles flowing radially outward from the sun.<br />
3
Chapter 1. Introduction<br />
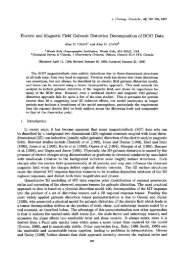
Figure 1.1.: Schematic image of magnetic field lines forming the Earth magnetosphere.<br />
The magnetosphere extends to more than 10 Earth radii on the<br />
day-side and to 40 radii on the night-side of the Earth (modified from<br />
Simpson and Bahr, 2005).<br />
These ionized particles are deflected by the Earth’s magnetic field at the outer<br />
region of the magnetosphere (at the magnetopause) and are guided around<br />
the Earth to the far tail, along the magnetic field lines (see Figure 1.1). When<br />
moving around the Earth they distort the Earth’s magnetic field and generate<br />
their own field. The variations of these external magnetic fields can be mea-<br />
sured at the surface of the Earth. The typical frequencies of these variations<br />
are from about 10 −5 to 1 Hz. The amplitudes of these variations are greater at<br />
times of the high solar activity and reach several 100 nT at periods of several<br />
hours. When the solar wind is strongly enhanced, stronger magnetic effects<br />
occur, these are known as magnetic storms. Even though these storms provide<br />
a good source for MT measurements, when their activity becomes too strong,<br />
the plane wave assumption is no longer valid. Hence, segments of the data<br />
corresponding to these times should be discarded. This problem mostly exists<br />
in polar regions where charged particles come close to the Earth’s surface in<br />
the cusp region, however when a storm is particularly large these effects can<br />
also be observed in mid-latitudes. Jones and Spratt (2002) provide a tech-<br />
nique for identifying problematic segments of the data under some simplifying<br />
assumptions.<br />
The narrow frequency range from 0.5 to 5 Hz, in the limit between solar wind and<br />
lightning activity, is known as the dead-band. In this frequency range the power<br />
spectrum of the natural electromagnetic field has a minimum (see Figure 1.2). In<br />
MT sounding curves this frequency range usually corresponds to a reduction of data<br />
quality.<br />
4
Chapter 1. Introduction<br />
Figure 1.2.: Power spectrum of natural magnetic variations. The inset shows the<br />
minimum of the power spectrum in the dead-band (modified from Simpson<br />
and Bahr, 2005).<br />
Both of the above source mechanisms create small, but measurable, time-varying<br />
electromagnetic signals. The problem is that the amplitudes of these signals vary<br />
considerably, which means that data have to be acquired for hours or even days at<br />
one MT site to ensure sufficient signal strength at all frequencies of interest.<br />
1.2.2. Conductivity mechanisms in earth materials<br />
As was mentioned earlier in this section the purpose of MT is to investigate the<br />
distribution of electrical conductivity inside the Earth’s subsurface. In order to<br />
understand the expected conductivity variations and possible targets of MT surveys<br />
we will review the major conductivity mechanisms within the Earth.<br />
Conductivity is the ability of a material to conduct electrical current. In rocks<br />
and minerals there are three types of the electrical charge transport mechanisms,<br />
these are semiconduction, electrolytic and electronic conduction.<br />
1. The main conductivity mechanism in dry unaltered rocks in the crust and<br />
upper mantle is semiconduction. In this case the electrical current flow is due<br />
to the movement of positive holes or missing electrons. Typical resistivities<br />
due to this conduction mechanism are 10 3 − 10 6 Ωm. These are the upper<br />
limits of what is usually observed in MT surveys (e.g. Ledo et al., 2004).<br />
5
Chapter 1. Introduction<br />
2. Electrolytic conduction means that the electric current is accompanied by the<br />
movement of matter in the form of ions. This type of conduction can appear<br />
in crustal rocks containing pores or fractures that are filled with fluid elec-<br />
trolytes containing, for example, NaCl. The amount of NaCl in the electrolyte<br />
fluid is usually the most important factor affecting the fluid saturated rock<br />
conductivity. This type of conduction usually suggested in tectonically active<br />
regions (e.g. Li et al., 2003). Under the temperatures of the upper mantle<br />
water itself is present in the form of H + and OH − ions which strongly enhance<br />
the observed conductivity (e.g. Gatzemeier and Moorkamp, 2005).<br />
In geothermal or volcanic areas very high conductivity can be explained by<br />
an interconnected network of partial melts, which is also act as electrolyte.<br />
Partial melts are formed when the temperature crosses the solidus line in<br />
pressure/temperature diagram. Small amounts of partial melt can greatly<br />
enhance the observed conductivity as long as it is interconnected and not in<br />
the form of isolated melt pockets (e.g. Heise et al., 2007).<br />
3. In electronic conductors, such as metals, the electrons can freely move within<br />
the material and transport charges. In the presence of an interconnected<br />
network of highly conducting matter, such as graphite or ores, this type of<br />
conduction increases the conductivity of the rock by orders of magnitude.<br />
Various groups of scientists assume this as a reason for the highly conductive<br />
areas within the crust (e.g. Haak et al., 1997), however this is under debate,<br />
as electrolytic conduction through a similar interconnected pore system can<br />
be also an explanation (e.g. Li et al., 2003).<br />
A more detailed overview of mechanisms of conductivity together with some ref-<br />
erences can be found in the review paper by Nover (2005).<br />
1.2.3. Practical measurements and processing<br />
Although we will only give a theoretical justification of the method below, we de-<br />
scribe here the practical aspects of acquiring MT data and how we obtain the fre-<br />
quency dependent impedance tensor that is the base of all MT surveys.<br />
As explained above, MT is based on the simultaneous measurement of the hori-<br />
zontal components of the electric and magnetic fields at the Earth’s surface. The<br />
exact way in which these fields are measured depends on the frequency range and<br />
whether the measurement site is on land or on the seafloor. We will concentrate<br />
6
Chapter 1. Introduction<br />
here on land-based measurements in the frequency range 300 Hz − 10, 000 s as they<br />
are performed at the Dublin Institute for Advanced Studies.<br />
Each component of the electric field in this frequency range is measured through<br />
the voltage between a pair of Pb/PbCl electrodes separated by 50 − 100 m. As for<br />
a constant electric field the voltage increases linearly with the distance between the<br />
electrodes, longer separation allows to detect smaller signals and enhances the signal<br />
to noise ratio. However it is rarely practical to have separations greater than 100 m<br />
as the installation becomes increasingly difficult.<br />
The magnetic fields are measured either with a set of coils for frequencies greater<br />
than 1 Hz or with three-component fluxgate magnetometers for longer periods. Mod-<br />
ern broad-band magnetic coils have signal to noise ratios that allow to register signals<br />
with periods up to 5,000 s under ideal circumstances and fluxgate magnetometers<br />
therefore might seem unnecessary. In contrast to coils that measure the change of<br />
the magnetic field and whose sensitivity consequently falls of as 1/(frequency), flux-<br />
gate magnetometers have a nearly constant sensitivity below a threshold frequency<br />
and can better record long period signals. Thus often both types of sensors are in-<br />
stalled at a single measurement site to ensure a wide frequency range can be used in<br />
the analysis. Regardless of which type of sensors are used, their electrical signals are<br />
digitized in a central recordings box and each component is stored on flash memory<br />
or a hard-disk as a time-series for further processing.<br />
Even though MT processing is theoretically straightforward, modern processing<br />
algorithms use sophisticated statistical methods such as robust estimation (Egbert<br />
and Booker, 1986; Chave et al., 1987) and the behaviour of the fields at neighbouring<br />
sites (Gamble et al., 1979). This is necessary because any violation of the plane<br />
wave assumption can seriously distort the estimated impedance. We will restrict<br />
ourselves here to a basic description of the simplemost processing scheme, a more<br />
detailed review can be found in Egbert (2002).<br />
The recorded time-series is divided into segments of equal length, depending on<br />
the total recording length and the longest period required. Each segment is fourier<br />
transformed and the auto- and cross-spectra are calculated. For each of those spectra<br />
we calculate the mean and the variance and then use a simple analytical formula<br />
to calculate the impedance estimates at the desired frequencies and their error. As<br />
mentioned above this way of calculating the estimates is highly susceptible to noise<br />
and therefore not recommended for practical applications. However it gives a better<br />
idea of the relationship between the measured quantities and the magnetotelluric<br />
7
Chapter 1. Introduction<br />
impedance used in inversion and modelling.<br />
1.2.4. MT applications<br />
Due to the huge frequency range from 10 −5 −10 4 Hz and therefore depths of penetra-<br />
tion from 10 m to up to 200 km, MT can be used for a large number of applications.<br />
In this section we present typical examples for some of most common ones.<br />
1. Deep crustal and mantle studies The aim of crustal and mantle studies is<br />
usually to understand the structure and tectonic history of a certain region<br />
on a large scale. Therefore these kind of studies are mostly conducted by<br />
academic institutions although the results can also help the mining industry<br />
to understand fundamental properties of that region.<br />
Jones et al. (2001) present result from three MT experiments on the Slave<br />
craton, which became a very popular area for geosciences since the discov-<br />
ery of diamoniferous kimberlite pipes. The first experiment used conventional<br />
land-based broadband instruments (from 10 −4 up to 10 4 Hz). For the second<br />
experiment they sank the electrodes to the bottom of the lake for electri-<br />
cal field recordings, while magnetometers were placed on the nearby shores.<br />
The third experiment used seafloor MT instruments deployed in the lakes.<br />
Analysing these data they found an electrical conductivity anomaly at a depth<br />
of ≈ 80 km that spatially coincides with the kimberlite field and is now known<br />
as the Central Slave Mantle Conductor (CSMC). To interpret this anomaly<br />
they discussed several possible causes for the high conductivity, such as melt,<br />
hydrated minerals, diffusion of hydrogen in the mantle, graphitization and sul-<br />
fides. Combining their results with the results from geochemical data from the<br />
same area they suggest that the most probable explanation of the high con-<br />
ductivity is either interconnected graphite or dissolved hydrogen. They also<br />
speculate on possible tectonic formation processes that might have caused the<br />
enhanced conductivity. However the limited information available from this<br />
depth prevents the clear identification of a single cause.<br />
2. Geothermal studies Geothermal studies are of interest to both academia and<br />
industry. Examining the structure of geothermal areas helps to understand<br />
basic properties of these systems and the connection to large scale tectonic<br />
processes, but also allows energy companies to identify interesting regions for<br />
geothermal power generation.<br />
8
Chapter 1. Introduction<br />
Heise et al. (2007) collected MT data along a profile across the Taupo Volcanic<br />
Zone (TVZ) consisting of 28 broad-band (0.003 - 2000 s) and 3 long period<br />
(10 - 10000 s) sites. Using the 2D inversion code by Rodi and Mackie (2001)<br />
and phase tensor analysis (Caldwell et al., 2004) they constructed an electrical<br />
conductivity model beneath this geothermal zone. They showed that the resis-<br />
tive (500 - 1500 Ωm) crust is thinned underneath the TVZ from 20 to 10 km.<br />
Beneath this thinned crust there is an area of high conductivity (3 - 30 Ωm),<br />
which they interpret as a zone of melt accumulation. This interconnected melt<br />
zone starts at about 13 km depth, however the bottom of the conductor is not<br />
well constrained, which is typical for MT.<br />
3. Environmental studies Usually shallow borehole measurements are used to<br />
investigate the extent and to monitor changes within waste sites. This tech-<br />
nique, however, is relatively expensive. Buried waste often has an electrical<br />
conductivity much higher than the surrounding host material and therefore<br />
EM methods seem suitable for investigating the extent of the waste more eco-<br />
nomically. In addition, repeating these EM measurements can help to monitor<br />
the changes in conductivity within the waste site and the surrounding. Often<br />
groundwater contamination appears as a conductive zone around the waste<br />
site and can be identified from EM models. MT has been shown to be very<br />
useful for buried waste characterization when used at radio frequencies (from<br />
10 kHz up to 1 MHz) (Pellerin, 2002). The principle of the radio magneto-<br />
telluric (RMT) method is the same as MT, but the source is the EM far-field<br />
of a radio transmitter, which can be viewed as a propagating plane wave. As<br />
RMT uses such high frequencies quick soundings are possible. As an example,<br />
Newman et al. (2003) had 320 RMT measurements using eight frequencies cov-<br />
ering the range between 18.3 and 234 kHz. These measurements were collected<br />
over a buried waste site near Cologne, Germany. Inverting these data using a<br />
3D MT inversion scheme (Newman and Alumbaugh, 2000) they successfully<br />
recovered the shape and extent of the contamination, which agrees with the<br />
borehole data. However, this success was partially due to incorporating a<br />
priori information within the inversion.<br />
4. Oil and mineral exploration MT methods are important cheap supplementary<br />
methods to seismic surveys for petroleum exploration. Petroleum and natural<br />
gas are often trapped in pockets between rock and salt that were formed by<br />
9
Chapter 1. Introduction<br />
the upward movement of salt towards the surface, penetrating and bending the<br />
existing rock. Due to this fact, mapping the top and bottom of salt structures<br />
is important to identify the location of reservoirs. Salt structures contain<br />
entrained sediments that produce significant scattering and have strong re-<br />
flecting vertical boundaries that produce ambiguities in the interpretation of<br />
seismic reflection data. Especially the steeply dipping sides and base of the salt<br />
are sometimes unresolved. Since the resistivity of salt is often more than ten<br />
times greater than the surrounding sediments, MT can help to resolve these<br />
problems. However, because of the attenuation of MT fields in conductive<br />
seawater the amplitude of the fields at short periods is within the noise level<br />
of traditional marine MT instruments. For this reason traditional instruments<br />
are used only at periods of 10 3 to 10 5 s in the marine environment. Yet, Hov-<br />
ersten et al. (1998) showed on the synthetic, but realistic examples that MT<br />
responses at periods from 1 and 10 3 s are sensitive to the salt structures at<br />
depth substantial for petroleum exploration. To solve this problem Constable<br />
et al. (1998) developed a novel broadband marine MT instrument and tested<br />
it for different sea water depths offshore San Diego. As a result they obtained<br />
good-quality responses at periods of 3 to 10 3 s in 1-km-deep water, while in<br />
shallower water due to wave activity and water currents the quality of the<br />
magnetic field recordings was not sufficient. They therefore suggest to replace<br />
these with nearby land magnetic recordings.<br />
Using this novel instrumentation, data in the period band of 1 to 3000 s were<br />
collected over a salt body at Gemini Prospect, Gulf of Mexico. These data<br />
were used by Key et al. (2006) in order to investigate the effectiveness of using<br />
2D marine MT methods to map 3D salt structures. Based on the result of the<br />
2D inversion of 1) a synthetic dataset calculated for a 3D model constructed<br />
from the seismic salt model and 2) the real data, they conclude that for the<br />
adequate recovery of the boundaries of the salt structure, a full 3D inversion is<br />
needed. 2D inversion should still be used for data quality assessment, finding<br />
appropriate error floors and, most importantly, for constructing an improved<br />
starting model for 3D MT inversion.<br />
These examples of recent applications of MT also show that most analyses of MT<br />
data are still performed with 2D inversion schemes and only rarely 3D tools are<br />
utilized. This is due to limited computer power, limited availability of 3D inversion<br />
codes and generally lower requirements in terms of number of stations for 2D surveys.<br />
10
Chapter 1. Introduction<br />
With current computer power and a greater variety of 3D inversion codes available<br />
it is starting to become mostly a matter of experimental design and costs whether<br />
3D methods can be used or not.<br />
1.3. Maxwell’s equations and very basic definitions<br />
Electromagnetic (EM) phenomena can be described by Maxwell’s equations (pre-<br />
sented here in the frequency-domain) (Ward and Hohmann, 1987)<br />
∇ × H = (σ − iωε)E + j ext , (1.1a)<br />
∇ × E = iωµ(H + h ext ), (1.1b)<br />
where µ and ε are the permeability and permittivity of the medium, respectively, σ<br />
is the electric conductivity, ω is the angular frequency of an EM field with assumed<br />
time-dependence e −iωt , and j ext and h ext are external sources.<br />
We will now shortly describe the definitions for forward and inverse problems that<br />
are commonly agreed on within the EM community. During forward modelling (1D,<br />
2D or 3D) one numerically solves Maxwell’s equations in order to calculate electric,<br />
E, and magnetic, H, fields within the volume of interest. Such mapping from the<br />
space of model parameters to the space of EM fields is called forward problem and<br />
we denote it as<br />
σ, ε, µ, j ext , h ext −→ E, H. (1.2)<br />
On the contrary, for inverse problem one assumes that the EM fields are known,<br />
usually at some sites on the surface (or underground) of the Earth, and the problem<br />
is to find a distribution of underground electrical conductivity, σ, permeability, µ,<br />
and permittivity, ε. In other words, the inverse problem is one of the following<br />
mappings<br />
or<br />
E, H, j ext , h ext −→ σ, ε, µ, (1.3a)<br />
E, H −→ f(E, H)<br />
<br />
transfer function<br />
−→ σ, ε, µ. (1.3b)<br />
The electric and magnetic fields are functions of the extraneous sources, the con-<br />
ductivity distribution, and the point of observation. Fortunately, the transfer func-<br />
tion in 1.3b that is independent of the geometry and polarization of the source can<br />
11
Chapter 1. Introduction<br />
be determined for MT. The MT transfer function is the impedance tensor, Z. This<br />
tensor Z is a 2 × 2 complex-valued matrix<br />
<br />
Ex<br />
Ey<br />
<br />
=<br />
<br />
Zxx Zxy<br />
Zyx Zyy<br />
<br />
Hx<br />
Hy<br />
<br />
. (1.4)<br />
This tensor relationship between the field components was first proposed by Neves<br />
(1957) and Berdichevsky (1960). In Appendix A we present some exact formulae<br />
for the MT impedance in the particular case of a layered-earth model.<br />
Figure 1.3.: Trivial scheme of model-data interaction.<br />
In Figure 1.3 we present a trivial scheme of model-data interaction together with<br />
a schematic inverse procedure, which can be understood as following:<br />
1) start with some initial guess model m (0) , 0 → n,<br />
2) calculate the residual r (n) = d (n) − d obs ,<br />
3) if r (n) ≤ ε stop, else goto 4)<br />
4) jump in the model space from model m (n) to some other model m (n+1) ,<br />
5) n + 1 → n, goto 2<br />
In the above algorithm, d (n) = F (m (n) ) is the solution of the forward problem for<br />
the model m (n) , and ε is some preassigned tolerance.<br />
From this trivial scheme we recognize two important components of the inversion<br />
procedure. First, the solution of the forward problem, and second, finding a way of<br />
jumping in the space of model parameters.<br />
12
Chapter 1. Introduction<br />
1.4. History of 3D MT inversion<br />
Since Tikhonov’s and Cagniard’s times, the MT method has dramatically devel-<br />
oped. Generally, modern MT can be viewed as a discipline, consisting of several<br />
self-contained parts, such as the MT equipment design, data acquisition, process-<br />
ing etc. In particular, it includes data interpretation, which, in its turn, includes<br />
a numerical inversion as an important constituent. Starting from the 1D case (in<br />
Tikhonov’s and Cagniard’s time) through 2D case (in the 70’s), it has now become<br />
feasible to invert data with respect to a 3D Earth model. In other words the in-<br />
version in three dimensions is an actual and important topic of modern MT. To<br />
further back up the idea of importance of 3D MT inversion today, we mention three<br />
international meetings partially devoted to this subject (Oristaglio and Spies, 1999;<br />
Zhdanov and Wannamaker, 2002; Macnae and Liu, 2003). We see three main reasons<br />
for that - first, significant improvement in instruments and acquisition techniques,<br />
second, dramatic rise in numerical methods and computer performance and, third,<br />
the need among geologists and Earth scientists to understand crustal-scale geological<br />
structures and processes.<br />
Interestingly, in spite of the urgent need for sophisticated 3D MT inversion soft-<br />
ware only a few developments of such a software are reported. It is not very sur-<br />
prising considering the level of complexity of 3D MT inverse problems (Mackie<br />
and Madden, 1993; Mackie et al., 2001; Newman and Alumbaugh, 2000; Newman<br />
et al., 2003; Zhdanov and Golubev, 2003; Sasaki, 2004; Siripunvaraporn et al., 2005;<br />
Avdeev and Avdeeva, 2006). Here we briefly summarize the main achievements of<br />
these previously published works.<br />
Usually a solution of the inverse problem is sought as a stationary point of some<br />
penalty functional ϕ(m). In order to do this Newton-type iterative methods are<br />
commonly applied. These methods traditionally require to compute and store the<br />
sensitivity matrix J = ∂F<br />
(F - forward problem solution) and Hessian matrix H =<br />
∂m<br />
∂2ϕ ∂m2 , or its approximation. These matrices are long to compute and large memory<br />
is required in order to store them in the 3D case. That is why it is important to<br />
make this computations more economical or even try to avoid them.<br />
Mackie and Madden (1993) present algorithms for the solution of a 3D least-<br />
squares inverse problem using the conjugate gradient method (CG). This method<br />
does not require to calculate the sensitivity matrix J explicitly. At each iteration<br />
it only needs to compute the effect of the sensitivity matrix or its transpose mul-<br />
13
Chapter 1. Introduction<br />
tiplied by an arbitrary vector. They show that this is equivalent to the solution of<br />
two forward problems per frequency with sources distributed throughout the vol-<br />
ume and across the surface and demonstrate that their procedure works well for<br />
simple 3D models. Newman and Alumbaugh (2000); Newman et al. (2003); Mackie<br />
et al. (2001) use another optimization approach – the non-linear conjugate gradi-<br />
ent method (NLCG) by (Fletcher and Reeves, 1964; Polak and Ribiere, 1969) for<br />
the 3D MT inversion solution development. This approach avoids the calculation<br />
of sensitivities, but requires to compute the gradient vectors g = ∂ϕ<br />
instead. The<br />
∂m<br />
evaluation of the gradients involves a single solution of one forward problem and<br />
one adjoint problem at each NLCG iteration. This approach has been used to invert<br />
commercial datasets.<br />
Zhdanov and Golubev (2003) developed a 3D inversion algorithm also based on<br />
the NLCG method. To speed up the solution of the inverse problem they use a<br />
quasi-analytical approximation for the forward modelling solution. Another opti-<br />
mization method used to invert 3D MT data is the Gauss-Newton method (GN).<br />
This method requires to calculate the sensitivity matrix J in order to compute a<br />
first order approximation to the Hessian matrix H. Sasaki (2004) developed a 3D<br />
MT inversion based on a typical GN optimization with some modifications made to<br />
reduce the number of forward modellings to a reasonable level. His inversion algo-<br />
rithm allows to invert the MT data with static shift. Siripunvaraporn et al. (2005)<br />
successfully developed a solution based again on a GN approach, but this time in<br />
data space to reduce the size of the sensitivity matrix, as in 3D the amount of data<br />
is usually much smaller than the number of model parameters.<br />
In this work we apply a limited memory quasi-Newton optimization method to<br />
solve the 3D MT inverse problem. Quasi-Newton methods, similarly to NLCG,<br />
also require only the gradients g of the penalty functional ϕ to be supplied at each<br />
iteration. Using the gradients these methods construct an approximation to the<br />
Hessian matrix or its inverse. When computing the approximation to the inverse of<br />
the Hessian they circumvent the solution of the system of linear equations at each<br />
iteration, which is necessary for GN method. However their approximations to the<br />
Hessian or its inverse are usually dense, which makes it difficult to store and compute<br />
them in memory for large-scale problems. In this cases a modification of the method<br />
has to be applied. One of such modifications – the limited memory quasi-Newton<br />
method – obtains an inverse Hessian approximation that can be stored in just a few<br />
vectors. The length of these vectors is the same as the amount of model parameters.<br />
14
Chapter 1. Introduction<br />
This method is fairly robust and inexpensive, does not converge rapidly (Nocedal<br />
and Wright, 1999). As far as we know this method has never been applied before<br />
to solve an MT inverse problem, although Haber (2005) used QN methods to invert<br />
controlled-source electromagnetic data.<br />
15
Chapter 2.<br />
Essential parts of EM inversion<br />
In this chapter we present the main constituents of EM inversion: forward modelling,<br />
optimization and regularization. In our current implementation we use the integral<br />
equation forward modelling code x3d by Avdeev et al. (1997, 2002). We chose<br />
to use a limited memory quasi-Newton optimization method, as an optimization<br />
technique. For regularization, we used various Tikhonov-type regularizations. The<br />
essential details of these components are described below; we begin with the forward<br />
modelling technique used.<br />
2.1. Forward modelling method<br />
There are three main ways of solving the forward problem: finite-difference (e.g.<br />
Mackie et al., 1993; Newman and Alumbaugh, 1995; Xiong, 1999; Wang and Fang,<br />
2001; Siripunvaraporn et al., 2002), integral equation (e.g. Hohmann, 1975; Wanna-<br />
maker, 1991; Avdeev et al., 1997, 2002) and finite-element (e.g. Reddy et al., 1977;<br />
Zyserman and Santos, 2000; Badea et al., 2001; Mitsuhata and Uchida, 2004) ap-<br />
proaches. The FD methods are the most widely used, mostly due to the apparent<br />
simplicity of the numerical implementation. IE methods are not so trivial in their<br />
implementation, however if they are implemented accurately they are efficient in<br />
terms of computer memory. FE methods are still not widely used in 3D MT modell-<br />
ing, due to the nontrivial and time-consuming construction of the finite elements<br />
themselves. This approach operates with unstructured meshes, and hence, is more<br />
appropriate for complex geometries, than FD and IE methods (Badea et al., 2001).<br />
For all of these approaches the initial system of Maxwell’s equations reduces to<br />
the system of linear equations<br />
Ax = b. (2.1)<br />
16
Chapter 2. Essential parts of EM inversion<br />
The difference between these three approaches is the properties of the matrix A.<br />
For FD the matrix A is complex, large, sparse and symmetric. For FE this matrix<br />
is also complex, large and sparse, but now it is usually nonsymmetric. For the IE<br />
approach the matrix A is complex and dense, but much more compact than for FD<br />
or FE.<br />
The important points here for all three approaches are how well the system 2.1<br />
approximates the original system of Maxwell’s equations and how fast one can find<br />
its solution x. After many years of competition we have a few accurate, reliable and<br />
fast FD, FE and IE forward solvers. Comparison of these solvers is a very difficult<br />
task, for the reason that they perform better for different models and there is always<br />
a large number of meshes (completely different for different approaches) that have<br />
to be used to find the most appropriate ones. One of the attempts to compare<br />
FD, FE and IE was the COMMEMI project of Zhdanov et al. (1997). One should<br />
understand that the COMMEMI project was performed in 1997 and the results are<br />
out of date. The more complete overview and reference list on forward modelling<br />
can be found in the recent review paper by Avdeev (2005).<br />
I have never worked with any of FE forward solvers, but had an opportunity to<br />
work with the IE x3d code, which is used as an engine for our inversion solution and<br />
had some experience with two advanced 3D FD forward modelling codes, during a<br />
two-month visit to the Lawrence Berkeley National Laboratory. These FD codes are<br />
a time-domain FD code by Commer and Newman (2004) and a frequency-domain<br />
FD code by Newman and Alumbaugh (1995). As the results of this two-month work<br />
are not related to MT inversion, I present them in Appendix E.<br />
Regarding the forward modelling solver for my PhD research, I had only two<br />
options: (a) to develop such a code myself, or (b) to use an existing code written by<br />
somebody else. Item (a) involves enough work for a PhD thesis, and therefore was an<br />
unacceptable option. Item (b) also presents some difficulties, since the development<br />
of an MT inversion solution requires access to a forward modelling code together<br />
with its sources. Additionally, this code has to be able to handle controlled-source<br />
problems along with MT ones for reasons we will explain below. Fortunately, I had<br />
access to the x3d code through collaboration with Dr. Dmitry Avdeev. This code is<br />
based on a volume integral equation method originally presented by Singer (1995).<br />
The relevant references about the further development of the method can be found,<br />
for example, in Avdeev et al. (2002). A serial implementation of the method, named<br />
x3d, is thoroughly described in the papers of Avdeev et al. (1997, 2002), where the<br />
17
Chapter 2. Essential parts of EM inversion<br />
reader can find more details about the algorithm. Here we also present a parallel<br />
implementation of this code. This parallel implementation is essential for 3D EM<br />
inversion, as it reduces the required computation times significantly.<br />
In Section 2.1.1 we briefly summarize the main aspects of the volume IE ap-<br />
proach. We present formulae of the 3D IE EM forward modelling method that are<br />
of importance for us.<br />
In Section 2.1.2, we describe some numerical bottlenecks of the serial x3d code<br />
and show how the solution may be parallelized to circumvent these bottlenecks. In<br />
particular, we demonstrate that a 2D digital convolution is the most time-consuming<br />
part, at least for large-scale models. Further, in Subsection 2.1.3 we analyse to what<br />
extent our parallel implementation outperforms the serial x3d solution for various<br />
numbers of processors and model sizes. Comparisons have been undertaken on both<br />
distributed and shared memory clusters. The results presented are encouraging and<br />
suggest the parallel implementation can accelerate the x3d solution and, therefore,<br />
the inversion of EM data. This parallel implementation is one of the important<br />
parts of this thesis, but it is by no means a main scientific contribution to the work.<br />
2.1.1. Key formulae of IE method<br />
In this section we summarize the main aspects of the forward modelling code x3d<br />
based on the volume IE approach, following works by Avdeev et al. (1997, 2002).<br />
For the volume IE approach, first we have to choose some reference model with<br />
generalized conductivity ζ0 = σ0−iωε0. This model can be chosen in many ways with<br />
the condition that we are able to effectively calculate the 3×3 dyadic Green’s tensors<br />
for it. For example, it can have isotropic or transversely anisotropic conductivity.<br />
Avdeev et al. (1997) present the explicit formulae of the Green’s tensors for a general<br />
case of a layered uniaxial anisotropic model. Anisotropic conductivity has been<br />
observed in lab measurements on the upper mantle materials (e.g. Simpson and<br />
Tommasi, 2005) and is sometimes used to explain MT data (e.g. Mareschal et al.,<br />
1995).<br />
Once the reference model is chosen, we can write the following system of Maxwell’s<br />
equations:<br />
∇ × H 0 = ζ0E 0 + j ext , (2.2a)<br />
∇ × E 0 = iωµ(H 0 + h ext ), (2.2b)<br />
18
Chapter 2. Essential parts of EM inversion<br />
where E 0 and H 0 are the electric and magnetic fields, respectively. Using the defi-<br />
nition of the Green’s tensor the electric field E 0 is easy to calculate as<br />
E 0 <br />
(r) =<br />
V ext<br />
G ee<br />
0 (r, r ′ )(j ext (r ′ ) + ∇ × h ext (r ′ ))d 3 r ′ , (2.3)<br />
where V ext is the volume supporting the extraneous current j ext + ∇ × h ext , r =<br />
(x, y, z), r ′ = (x ′ , y ′ , z ′ ) are the vectors of 3D space, d 3 r ′ = dx ′ dy ′ dz ′ is the element<br />
of 3D volume. Substracting equations 2.2 from equations 1.1 we obtain the system<br />
of Maxwell’s equations for the scattered fields:<br />
∇ × H s = ζ0E s + j q , (2.4a)<br />
∇ × E s = iωµH s . (2.4b)<br />
In equations 2.4 E s = E − E 0 and H s = H − H 0 are the scattered electric and<br />
magnetic fields, respectively, and j q = (ζ − ζ0)(E s + E 0 ).<br />
We can derive the scattered electric field in a similar manner to formula 2.3.<br />
E s <br />
(r) =<br />
V s<br />
G ee<br />
0 (r, r ′ )j q (r ′ )d 3 r ′<br />
<br />
= E0(r) + G ee<br />
0 (r, r ′ )(ζ(r ′ ) − ζ0(r ′ ))E s (r ′ )d 3 r ′ , (2.5)<br />
V s<br />
where E0(r) = <br />
V s Gee 0 (r, r ′ )(ζ(r ′ ) − ζ0(r ′ ))E 0 (r ′ )d3r ′ is a free term, and the volume<br />
V s is the volume where ζ − ζ0 differs from 0. Equation 2.5 is a traditional integral<br />
scattering equation (Dmitriev, 1969; Weidelt, 1975a).<br />
In order to efficiently solve this scattering equation for models with high con-<br />
ductivity contrasts, the modified iterative dissipative method (MIDM) should be<br />
applied. This method was first proposed by Singer (1995). Following MIDM the<br />
following change of variables has to be made E s → χ, where<br />
χ(r) = 1<br />
2 ν−1 <br />
(r) (ζ(r) + ζ0(r))E s (r) + (ζ(r) − ζ0(r))E 0 <br />
(r) . (2.6)<br />
ℜ(ζ0τ), Here ν = diag<br />
ℜ(ζ0τ), <br />
ℜ(ζ0z) , the upper bar and ℜ in the above<br />
expressions, as everywhere else, are the complex conjugate and real parts of their<br />
argument, respectively. After this change of variables we can rewrite equation 2.5<br />
19
as:<br />
Chapter 2. Essential parts of EM inversion<br />
χ(r) = χ0(r) + R(r)χ(r) + 2ν(r)<br />
<br />
V s<br />
G ee<br />
0 (r, r ′ )ν(r ′ )R(r ′ )χ(r ′ )d 3 r ′ , (2.7)<br />
where<br />
χ0(r) = R(r)ν(r)E 0 <br />
(r) + 2ν(r)<br />
V s<br />
G ee<br />
0 (r, r ′ )ν(r ′ )R(r ′ )ν(r ′ )E 0 (r ′ )d 3 r ′ . (2.8)<br />
To derive the above equations 2.7 and 2.8 we used the formula ζ0 + ζ0 = 2ν 2 and<br />
the notation R = (ζ − ζ0)(ζ + ζ0) −1 .<br />
From equation 2.7, imposing a numerical grid on the model allows us to derive<br />
the following system of linear equations with respect to the unknown field χ:<br />
Operator A of equation 2.9 is defined as follows<br />
(Aχ)i,j,k = χi,j,k − (Rχ)i,j,k − Φ −1<br />
2<br />
(Aχ)i,j,k = (χ0)i,j,k. (2.9)<br />
Nz<br />
<br />
k ′ =1<br />
Qk,k ′Φ2<br />
<br />
( Rχ)k ′<br />
<br />
i,j<br />
. (2.10)<br />
It is assumed that the modelling volume V s is discretized by prisms Di,j,k (i =<br />
1, ..., Nx, j = 1, ..., Ny, k = 1, ..., Nz), where we assume also that all prisms in the<br />
mesh are of the same horizontal size, but their vertical size is variable along the<br />
vertical axis. Subscript i, j, k of equation 2.10 stands for an average value over<br />
prism Di,j,k. In this key equation<br />
Φ2 and Φ −1<br />
2<br />
−1 Ri,j,k = (ζi,j,k − (ζ0)k) ζi,j,k + (ζ0)k ; (2.11)<br />
are respectively the direct and inverse 2D digital Fourier transforms<br />
over both subscripts i and j;<br />
where i ′ = 1, ..., 2Nx, j ′ = 1, ..., 2Ny,<br />
(Qk,k ′) i ′ ,j ′ = 2νkΦ2 [qk,k ′] i ′ ,j ′ νk ′, (2.12)<br />
<br />
νk = diag ℜ(ζ0τ)k, ℜ(ζ0τ)k, <br />
ℜ(ζ0z)k , (2.13)<br />
20
and<br />
Chapter 2. Essential parts of EM inversion<br />
(qk,k ′)i,j =<br />
<br />
D i,j,k ′<br />
Here zk is the depth of the centre of prism Di,j,k.<br />
G ee<br />
0 (x, y, zk, z ′ )dz ′ . (2.14)<br />
The theory for the derivation of equation 2.10 from equation 2.7 is explained in<br />
appendix B. There the reader also can find an explanation for the tilde sign.<br />
The serial implementation of Avdeev et al. (2002) solves the system 2.9 using a<br />
Krylov subspace iteration technique. This iteration technique generates the sequence<br />
of Krylov approximations,<br />
the system 2.9 as<br />
<br />
χ (n)<br />
i,j,k<br />
<br />
, n = 1, ..., that approach the solution, χi,j,k, of<br />
χi,j,k ≈ lim χ<br />
n→∞ (n)<br />
i,j,k . (2.15)<br />
The stopping criteria for the Krylov iteration is based on reducing the relative<br />
residual<br />
r (n) =<br />
down to a user-determined level ε.<br />
<br />
(n) Aχ − χ0<br />
χ0 L2<br />
L2<br />
(2.16)<br />
When the solution χi,j,k of equation 2.15 is found, the electric field within the<br />
modelling volume V s is calculated as<br />
where<br />
−1 2νkχi,j,k Ei,j,k = ζi,j,k + (ζ0)k<br />
− j s 0<br />
i,j,k + Ei,j,k, (2.17)<br />
j s<br />
i,j,k = (ζi,j,k − (ζ0)k)E 0<br />
i,j,k, (2.18)<br />
and E 0<br />
i,j,k is the reference electric field.<br />
In the context of this study it is of particular importance that the solution exploits<br />
the multiple calculation of a discrete 2D convolution given on the right hand side of<br />
equation 2.10.<br />
2.1.2. Bottlenecks of serial implementation<br />
The performance of the serial implementation x3d for the solution presented above<br />
strongly depends on two time-consuming parts of the algorithm. The first is the<br />
calculation of the 3 × 3 Green’s matrices (Qk,k ′) i ′ ,j ′ given in equation 2.12, where<br />
k, k ′ = 1, ..., Nz, i ′ = 1, ..., 2Nx and j ′ = 1, ..., 2Ny. This requires the calculation<br />
of 9 × 2Nx × 2Ny × N 2 z complex-valued numbers in total. It should be noted that<br />
21
Chapter 2. Essential parts of EM inversion<br />
x3d stores the Green’s matrices (Qk,k ′) i ′ ,j ′ on hard disk for large-scale problems, and<br />
standard IO operations are used to read and write them to RAM when needed. This<br />
allows x3d to carry out this calculation only once during the whole iterative solution<br />
process, at the very beginning.<br />
The second time-consuming part is the multiple 2D convolution presented in the<br />
right hand side of equation 2.10. The amount of these convolutions depends on the<br />
number of Krylov iterates. Figures 2.1 and 2.2 present a typical computation time<br />
ratio between those two parts of the x3d solution. This ratio<br />
q = TAχ<br />
TQ<br />
(2.19)<br />
is a fraction of the wall time, TAχ, spent by the x3d solution within the 2D convo-<br />
lution routine, summed up for all Krylov iterates, over the wall time, TQ, required<br />
for calculation of the Green’s matrices (Qk,k ′) i ′ ,j ′. The ratio 2.19 is presented for 3D<br />
models with a conductivity contrast of 30 in bilogarithmic scale as a function of the<br />
model sizes Nx(= Ny) and Nz.<br />
Figure 2.1.: Factor q of equation 2.19 obtained on a distributed memory cluster<br />
Leda. The results are presented in bilogarithmic scale as a function of<br />
model sizes Nx(= Ny) and Nz.<br />
It is interesting that, for the models considered, the whole x3d solution requires<br />
only six Krylov iterates to achieve a relative residual as small as ε = 5 × 10 −4 .<br />
The models with higher conductivity contrasts would need more Krylov iterates,<br />
and hence, the ratio q for these models would be even larger than that presented in<br />
Figures 2.1 and 2.2. From these figures we can see that the ratio q can be as large<br />
22
Chapter 2. Essential parts of EM inversion<br />
Figure 2.2.: Factor q of equation 2.19 obtained on a shared memory cluster Hamilton.<br />
The results are presented in bilogarithmic scale as a function of<br />
model sizes Nx(= Ny) and Nz.<br />
as 30 for the models considered. Therefore, we conclude that the 2D convolution<br />
routine is the best candidate for acceleration of EM inversion through parallelization<br />
of the x3d computer code. Accordingly, we implemented this solution on distributed<br />
and shared memory clusters to investigate relative improvements in computational<br />
speed.<br />
2.1.3. Parallel implementation<br />
2.1.3.1. Distributed memory cluster<br />
First we developed a parallel implementation of the solution described above to run<br />
on a distributed memory cluster. Similar work was previously undertaken by Yosh-<br />
ioka and Zhdanov (2005) using the ScaLAPACK package. In our implementation,<br />
however, we adopted a more trivial scheme, which assigns the number k (number of<br />
the layer) given in the right hand side of equation 2.10 to the kth processor of the<br />
cluster. In other words, the kth processor calculates (Aχ)i,j,k of equation 2.10 for<br />
all i = 1, ..., Nx and j = 1, ..., Ny. A modification of this approach to the case where<br />
the total number Npr of processors is less than Nz is straightforward and easy to<br />
implement.<br />
The acceleration factor<br />
qNpr = T 1 Aχ<br />
T Npr<br />
Aχ<br />
23<br />
(2.20)
Chapter 2. Essential parts of EM inversion<br />
24<br />
(a) Npr = 4 (b) Npr = 8 (c) Npr = 16<br />
Figure 2.3.: The results on the distributed memory cluster (Leda). Factor qNpr of equation 2.20 for Npr = 4, 8, 16. The results<br />
are presented in bilogarithmic scale as a function of model sizes Nx(= Ny) and Nz.
Chapter 2. Essential parts of EM inversion<br />
of the parallel implementation over the serial one is presented in Figure 2.3. Here<br />
T Npr<br />
Aχ is the wall time for the calculation of (Aχ)i,j,k, using Npr processors. For<br />
our research we used a Linux cluster (Leda) available at the Dublin Institute for<br />
Advanced Studies. This cluster has 16 nodes, each with 2 processors, networked<br />
through a Gigabit ethernet. To parallelize the solution we used the MPI (mes-<br />
sage passing interface) for the interprocessor communications. The panels 2.3(a),<br />
2.3(b), and 2.3(c) show the factor qNpr of equation 2.20, calculated for various num-<br />
bers of processors Npr = 4, 8, 16, as a function of the model size of Nx(= Ny) =<br />
16, 32, 64, 128, 256, 512, 1000 and Nz = 1, 4, 16, 32, 64. From Figure 2.3(c) we can<br />
see that for as much as Npr = 16 processors the maximum acceleration, defined by<br />
qNpr, is less than 6. This is because interprocessor communication takes up a lot<br />
( Rχ)k ′<br />
<br />
of equation 2.10 for all<br />
of wall time. In particular, the Nz arrays of Φ2<br />
k ′ = 1, ..., Nz must be broadcast to all processors. This is a very time-consuming<br />
operation on a distributed memory cluster. Indeed, since<br />
T Npr<br />
Aχ ≈ T 1 Aχ<br />
+ Tcomm,<br />
Npr − 1<br />
where Tcomm is the wall time spent on the interprocessor communications, the ac-<br />
celeration factor is<br />
T<br />
qNpr ≈<br />
1 Aχ<br />
1<br />
Npr−1 T 1 Aχ + Tcomm<br />
≤ T 1 Aχ<br />
.<br />
Tcomm<br />
It is therefore clear that for any number of processors Npr the acceleration qNpr<br />
cannot be more than T 1 Aχ<br />
. This value depends on the size of 3D grid under con-<br />
Tcomm<br />
sideration and the speed of communication of the particular cluster employed in the<br />
calculation. In order to try to reduce the effect of interprocessor communications<br />
we repeated the above experiments on a shared memory cluster.<br />
2.1.3.2. Shared memory cluster<br />
For our experiments we used a Linux shared memory cluster (Hamilton) managed<br />
by the ICHEC 1 project. In Figure 2.4 the acceleration factor qNpr of equation 2.20 is<br />
presented. However, it should be understood that we did not have exclusive access<br />
to the cluster and the performance measurements are not very reliable. One factor<br />
affecting the performance is the current amount of users running their jobs. From<br />
the comparison of Figures 2.3 and 2.4 we see that the acceleration achieved on the<br />
1 Irish Centre for High-End Computing, http://www.ichec.ie/<br />
25
Chapter 2. Essential parts of EM inversion<br />
26<br />
(a) Npr = 4 (b) Npr = 8 (c) Npr = 16<br />
Figure 2.4.: The results on the shared memory cluster (Hamilton). Factor qNpr of equation 2.20 for Npr = 4, 8, 16. The results<br />
are presented in bilogarithmic scale as a function of model sizes Nx(= Ny) and Nz.
Chapter 2. Essential parts of EM inversion<br />
shared memory cluster is only slightly greater than that obtained on the distributed<br />
memory cluster. This is far from what might be anticipated and the reason for<br />
that is still unclear. One possible explanation is that the parallel implementation<br />
was written for a distributed memory cluster architecture and therefore transfers<br />
significant amount of data beetween different parts of the shared memory. Although<br />
this is considerably faster than transferring data over the network, a dedicated shared<br />
memory implementation, using OpenMP for example, could further enhance the<br />
performance.<br />
In this section we have described the basic equations of the serial implementation<br />
for 3D EM forward modelling, based on the volume integral equation approach.<br />
The key time-consuming part of this serial solution is the discrete 2D convolution<br />
routine. We chose to parallelize this routine, since we demonstrated that another<br />
time-consuming part of the solution, calculation of the Green’s matrices, takes much<br />
less wall time, especially for large-scale 3D models. To understand to what extend<br />
our parallel implementation improves performance of 3D EM forward modelling, we<br />
compared it with the serial x3d implementation by Avdeev et al. (1997, 2002). On<br />
both distributed and shared memory clusters, our parallel implementation allowed<br />
the solution to be reasonably accelerated. As an example, acceleration of 7 times<br />
was achieved with 16 processors for large models.<br />
27
Chapter 2. Essential parts of EM inversion<br />
2.2. Optimization method<br />
A large number of optimization methods for various applications, including geo-<br />
physics, has been developed. A very good review of some of these methods can be<br />
found in Nocedal and Wright (1999). For large-scale nonlinear problems, such as 3D<br />
MT inversion, we shall minimize some objective functional using gradient based op-<br />
timization techniques, including non-linear conjugate gradient (NLCG) and limited<br />
memory quasi-Newton schemes, because of their minimal storage requirements. In<br />
this work we chose a limited memory quasi-Newton method to be applied to solve<br />
our MT inverse problem.<br />
2.2.1. General setting of EM inverse problem, as optimization<br />
problem<br />
The EM inverse problem of equation 1.3b is usually solved by minimization,<br />
minϕ(m,<br />
λ), of the following objective function:<br />
m,λ<br />
where<br />
ϕ(m, λ) = ϕd(m) + λϕs(m), (2.21)<br />
ϕd(m) = 1 <br />
d<br />
2<br />
obs − F (m) 2 (2.22)<br />
is the data misfit. Here m = (m1, ..., mN) T is the vector consisting of the model<br />
parameters; for EM applications this is usually vector consisting of the conductivities<br />
or log conductivities of the layers (for 1D case) or cells (for 3D case); superscript<br />
T means transpose; N is the number of model parameters; F (m) is the solution<br />
of the forward mapping 1.2; d obs is the observed data; and λ is the regularization<br />
parameter. As prescribed by the theory of Tikhonov (1963), the objective function<br />
in equation 2.21 has a regularization part (stabilizer) ϕs(m). This stabilizer can<br />
be chosen in many ways (see, for example, Farquharson and Oldenburg (1998), and<br />
references therein), and moreover, the choice of ϕs(m) influences the inversion result.<br />
Traditionaly, this stabilizer is chosen to obtain smooth models, however this remains<br />
a subjective matter. We will discuss our choices of the stabilizer in Sections 3.1.2<br />
and 4.1.2.<br />
In our inversion scheme we chose to use conductivities σk as the model parameters<br />
mk, (k = 1, ..., N). Conductivity must be nonnegative, and usually lies in the range<br />
of 10 −6 to 100 S/m (Simpson and Bahr, 2005), and hence, the optimization problem<br />
28
Chapter 2. Essential parts of EM inversion<br />
given in equation 2.21 is subject to the bounds:<br />
l ≤ m ≤ u, (2.23)<br />
where l = (l1, ..., lN) T and u = (u1, ..., uN) T are the lower and upper bounds, respec-<br />
tively, lk ≥ 0 (k = 1, ..., N).<br />
An alternative way to keep the conductivities nonnegative is to define model pa-<br />
rameters mk as mk = log(σk −lk), or mk = log<br />
σk−lk<br />
uk−σk<br />
<br />
. After such transformations,<br />
the bounds of the model parameters, mk, extend to infinity, and the constrained<br />
problem of equations 2.21-2.23 nominally turns to an easier unconstrained problem.<br />
Although these transformations are commonly used, they may slow down the con-<br />
vergence of the solution if a minimum of the objective function of equation 4.1 is<br />
located on or near the bounds. However, a detailed study of the convergence of such<br />
an approach would require additional investigation.<br />
The problem posed in equations 2.21-2.23 is a typical optimization problem with<br />
simple bounds (Nocedal and Wright, 1999). One possible method to solve this<br />
problem is quasi-Newton optimization.<br />
2.2.2. Quasi-Newton optimization method<br />
Quasi-Newton (QN) optimization methods have become very popular tools for the<br />
numerical solution of EM inverse problems (Newman and Boggs, 2004; Haber, 2005).<br />
The reason behind this is that the methods only require calculation of gradients and<br />
avoid the calculation of second-derivative terms. For large-scale inverse problems,<br />
such as the three-<strong>dimensional</strong> (3D) magnetotelluric (MT) inverse problem, limited<br />
memory QN methods are preferable, because their requirements for storage are<br />
not as excessive as for other QN methods. However, it should be understood that<br />
their small memory requirements are counterbalanced by slower convergence. Our<br />
inverse problem solution is based on a limited memory quasi-Newton method and<br />
we describe its implementation below; it is an extension of previous work by Ni and<br />
Yuan (1997). In contrast to this earlier work, we implement Wolfe conditions, given<br />
in equations 2.36 to terminate the line search procedure, as was recommended by<br />
Byrd et al. (1995).<br />
We now present a general theory of QN optimization. This method operates<br />
similar to the other Newton-type methods that are also commonly applied to solve<br />
problem in equations 2.21-2.23. At each iteration step n, the Newton system of<br />
29
linear equations<br />
Chapter 2. Essential parts of EM inversion<br />
H (n) p (n) = −g (n)<br />
(2.24)<br />
is solved to find the search direction p (n) . It is desirable that the vector p (n) is a<br />
descent direction, i.e. g (n)T p (n) < 0. In equation 2.24 the gradient<br />
and the Hessian matrix<br />
H =<br />
<br />
∂ϕ<br />
g = , ...,<br />
∂m1<br />
∂ϕ<br />
∂mN<br />
⎛<br />
⎜<br />
⎝<br />
∂2ϕ ∂m1∂m1<br />
· · ·<br />
T<br />
∂ 2 ϕ<br />
∂m1∂mN<br />
· · · · · · · · ·<br />
∂ 2 ϕ<br />
∂mN ∂m1<br />
· · ·<br />
∂ 2 ϕ<br />
∂mN ∂mN<br />
are calculated at m = m (n) . The next iterate m (n+1) is then found as<br />
⎞<br />
(2.25)<br />
⎟<br />
⎠ (2.26)<br />
m (n+1) = m (n) + α (n) p (n) , (2.27)<br />
where the step length α (n) is computed by an inexact line search procedure.<br />
The calculation and storage of the Hessian matrix H is a complex numerical prob-<br />
lem. Fortunately, there is a group of Newton-type methods that avoids having to<br />
deal with the Hessian of equation 2.26, the so-called quasi-Newton (QN) methods.<br />
These methods require only the (multiple) calculation of the gradients of equa-<br />
tion 2.25. For these methods, at each iteration step n the search direction p (n) has<br />
the following form<br />
p (n) = −G (n) g (n) , (2.28)<br />
where the symmetric matrix G (n) is an approximation to the inverse Hessian matrix,<br />
H (n)−1 , and is updated at every iteration. When the vector p (n) is found from<br />
equation 2.28, and G (n) is positive definite, one has<br />
p (n)T g (n) = −g (n)T G (n) g (n) < 0, (2.29)<br />
and, hence, p (n) is a descent direction. Even though we are guaranteed that the<br />
vector p (n) is a descent direction as long as G (n) is symmetric and positive definite,<br />
the convergence to the solution is better if G (n) is a good approximation to the<br />
inverse of the Hessian. There are a variety of approaches that allow G (n) to be<br />
calculated, one of them is the so-called Broyden-Fletcher-Goldfarb-Shanno formula<br />
30
(Nocedal and Wright, 1999).<br />
2.2.2.1. BFGS formula<br />
Chapter 2. Essential parts of EM inversion<br />
According to the BFGS formula, at each iteration step n the approximation G (n) is<br />
updated as<br />
where ρ (n−1) =<br />
and<br />
G (n) = V (n−1)T G (n−1) V (n−1) + ρ (n−1) s (n−1) s (n−1)T , (2.30)<br />
1<br />
y (n−1)T ,<br />
s (n−1)<br />
G (0) = I, (2.31)<br />
V (n−1) = I − ρ (n−1) y (n−1) s (n−1)T , (2.32)<br />
s (n−1) = m (n) − m (n−1) , y (n−1) = g (n) − g (n−1) . (2.33)<br />
It follows from 2.30 that the matrix G (n) satisfies the secant equation<br />
G (n) y (n−1) = s (n−1) . (2.34)<br />
To explain the term “secant” let us, for simplicity, consider the case of only one<br />
model parameter (N = 1). In this case G (n) is just a 1 × 1 matrix, and m and g are<br />
scalars. From 2.34, we can see that G (n)−1 approximates the slope of the gradient<br />
function g at point m (n) by taking the secant through points (m (n−1) , g (n−1) ) and<br />
(m (n) , g (n) ). This means that G (n) is an approximation of the inverse of the true<br />
Hessian H (n) of equation 2.24. Moreover, when the vectors s (n−1) and y (n−1) satisfy<br />
the curvature condition<br />
s (n−1)T y (n−1) > 0, (2.35)<br />
it can be easily shown that the matrix G (n) is positive definite, as required by<br />
inequality 2.29 to guarantee the descent direction p (n) . However, the condition 2.35<br />
does not always hold, and in such cases one needs to enforce 2.35 explicitly by<br />
imposing restrictions on step length α (n) of equation 2.27. The condition 2.35 is<br />
guaranteed to hold if we impose the following Wolfe conditions<br />
ϕ (n) ≤ ϕ (n−1) + c1α (n−1) g (n−1)T p (n−1) , (2.36a)<br />
g (n)T p (n−1) ≥ c2g (n−1)T p (n−1) , (2.36b)<br />
31
Chapter 2. Essential parts of EM inversion<br />
with 0 < c1 < c2 < 1 (typical values for c1 and c2 are 10 −4 and 0.9, respectively),<br />
where ϕ (n) = ϕ(m (n) , λ). To verify this statement we note that from equation 2.33<br />
and condition 2.36b it follows that<br />
and therefore,<br />
g (n)T s (n−1) ≥ c2g (n−1)T s (n−1) ,<br />
y (n−1)T s (n−1) ≥ (c2 − 1)α (n−1) g (n−1)T p (n−1) .<br />
Since c2 < 1 and p (n−1) is a descent direction, the term on the right of the above<br />
inequality is positive, and the curvature condition 2.35 holds. A good illustration of<br />
the Wolfe conditions can be found in (p.37-41 Nocedal and Wright, 1999).<br />
Unfortunately, the BFGS formula is not practically applicable to large-scale op-<br />
timization problems, because matrix G (n) is usually dense. Therefore the storage<br />
and computational requirements grow in proportion to N 2 , and become excessive<br />
for large N. In order to circumvent this issue a limited memory QN methods must<br />
be applied.<br />
2.2.2.2. L-BFGS formula<br />
In accordance with the L-BFGS formula (Nocedal and Wright, 1999), the BFGS<br />
matrix G (n) is approximated as<br />
G (n) ≈ G (n)<br />
L =<br />
<br />
V (n−1)T <br />
(n−ncp)T<br />
· · · V γ (n) <br />
I V (n−ncp) · · · V (n−1)<br />
<br />
+ ρ (n−ncp)<br />
<br />
V (n−1)T <br />
(n−ncp+1)T<br />
· · · V s (n−ncp) <br />
(n−ncp)T<br />
s V (n−ncp+1) · · · V (n−1)<br />
<br />
+ ρ (n−ncp+1)<br />
<br />
V (n−1)T <br />
(n−ncp+2)T<br />
· · · V s (n−ncp+1) <br />
(n−ncp+1)T<br />
s V (n−ncp+2) · · · V (n−1)<br />
<br />
+ · · ·<br />
+ ρ (n−1) s (n−1) s (n−1)T ,<br />
(2.37)<br />
where γ (n) = s(n−1)T y (n−1)<br />
y (n−1)T y (n−1) , and stored implicitly using the ncp correction pairs<br />
{s (i) , y (i) : i = n − ncp, ..., n − 1} given in equation 2.33. After the correction pair<br />
{s (n) , y (n) } is computed, the oldest pair {s (n−ncp) , y (n−ncp) } is deleted and replaced by<br />
this new pair. The main idea behind this approach is to use information from only<br />
the most recent iterations and the information from earlier iterations is discarded<br />
32
Chapter 2. Essential parts of EM inversion<br />
in the interests of saving storage.<br />
It can be shown that the matrix G (n)<br />
L also satisfies the secant equation 2.34 and,<br />
hence, all the above argumentation about G (n) remains valid for G (n)<br />
L .<br />
2.2.2.3. Simple bounds constraints<br />
In our case the problem is also subject to simple bounds defined in inequality 2.23.<br />
As it was proved above, the Wolfe conditions guarantee that the matrix G (n)<br />
L is<br />
positive definite and, hence, p (n) is a descent direction. But condition 2.36b may<br />
not be reached inside the feasible region 2.23 and therefore the methods mentioned<br />
above may not work. If condition 2.36b does not hold, one should modify s (n−1)<br />
of 2.33 as follows (Ni and Yuan, 1997)<br />
θs (n−1) + (1 − θ)G (n−1)<br />
L y (n−1) → s (n−1)<br />
(2.38)<br />
<br />
where θ =<br />
1,<br />
0.8b/(b − a),<br />
if a ≥ 0.2b<br />
otherwise<br />
, a = s (n−1)T y (n−1) , b = y (n−1)T G (n−1)<br />
L y (n−1) .<br />
Ni and Yuan (1997) proved that the transformation 2.38 guarantees that the matrix<br />
G (n)<br />
L<br />
is positive definite.<br />
Alternative ways to deal with the bound constrained QN optimization can be<br />
found in Byrd et al. (1995) and Kelley (1999).<br />
To conclude this section let us mention that the QN method described above does<br />
not depend on the <strong>dimensional</strong>ity of the inverse problem. It can be equally applied<br />
to 1D, 2D or 3D cases. For the 1D case, mi is the electrical conductivity of the ith<br />
layer, for 2D and 3D cases, it is the electrical conductivity of the ith cell.<br />
2.3. Regularization<br />
The inverse problem 2.21-2.23 is ill-posed, as it is illustrated in Figure 2.5. This<br />
means that (due to the fact that the EM inverse problem is nonlinear and data are<br />
limited and contaminated by noise) there are an infinite number of models that can<br />
equally fit the data within a given tolerance threshold, i.e. ϕd(m1) ≈ ϕd(m2), when<br />
m1 − m2 >> m1.<br />
One approach for narrowing down the set of solutions of the inverse problem is to<br />
introduce a regularization term in the objective function, as done in the objective<br />
33
function of equation 2.21:<br />
Chapter 2. Essential parts of EM inversion<br />
Figure 2.5.: Sensitivity of inverse mapping.<br />
ϕ(m, λ) = ϕd(m) + λϕs(m).<br />
A possible way to construct the regularization term is to apply the following expres-<br />
sion:<br />
ϕs(m) = Wm 2<br />
This form usually forces the model m to be either:<br />
(2.39)<br />
1. the flattest that is still consistent with the data. This means that the first<br />
derivative of m is minimized, i.e. the matrix W is finite-difference approxi-<br />
mation to the gradient operator,<br />
2. the smoothest, but again consistent with the data, meaning that the second<br />
derivative of m is minimized, i.e. W represents the Laplacian,<br />
or some combination of the above two. The explicit expressions for the regularization<br />
function ϕs, we used in our implementations, are described in Sections 3.1.2 and<br />
4.1.2.<br />
34
Chapter 3.<br />
1D MT <strong>Inversion</strong><br />
In this chapter we apply the methods of Chapter 2 to a one-<strong>dimensional</strong> (1D)<br />
magnetotelluric (MT) inverse problem in order to test the optimization routines<br />
and determine suitable parameter values. Section 3.1 explains our setting of the 1D<br />
MT inverse problem. In Subsection 3.1.1 we present our calculation of gradients,<br />
which speeds up the inverse problem solution many times. In Subsection 3.1.2 we<br />
show a possible stabilizer for the 1D case together with an algorithm for choosing<br />
the regularization parameter λ. This regularization successfully stabilizes the QN<br />
inversion result. In Section 3.2 we demonstrate the efficiency of our inversion on a<br />
synthetic, but realistic, numerical example, along with a comparison with the lim-<br />
ited memory Broyden-Fletcher-Goldfarb-Shanno algorithm for bound constrained<br />
optimization (L-BFGS-B) by Byrd et al. (1995). This comparison shows similar<br />
convergence rates. In addition, we show that it is sufficient to store only a few<br />
correction pairs to produce reasonable results. The study presented in this chapter<br />
is a first step towards the solution of large-scale electromagnetic problems, with a<br />
full treatment of the 3D conductivity structure of the Earth, and the results have<br />
been published in Avdeeva and Avdeev (2006).<br />
3.1. Theory and basic equations<br />
In the frame of one-<strong>dimensional</strong> magnetotelluric inversion we assume a layered earth<br />
model and seek the conductivities of those layers. As mentioned in the previous<br />
chapter, this problem is usually solved by minimization minϕ(m,<br />
λ) of the following<br />
m,λ<br />
objective function:<br />
ϕ(m, λ) = ϕd(m) + λϕs(m) (3.1)<br />
35
Chapter 3. 1D MT <strong>Inversion</strong><br />
For the 1D MT case the data misfit has the following form<br />
ϕd(m) = 1<br />
2<br />
NT <br />
j=1<br />
βj |Zj (σ(m)) − Dj| 2 . (3.2)<br />
Here σ = (σ1, ..., σN) T is the vector consisting of the electrical conductivities of the<br />
layers; m = (m1, ..., mN) T is the vector of model parameters, such that<br />
mk = σk/σ (0)<br />
k , (k = 1, ..., N); (3.3)<br />
σ (0) is an initial guess conductivity model; superscript T means transpose; N is<br />
the number of layers; Zj(σ) and Dj are the complex-valued, modeled, and observed<br />
impedances at the jth period (j = 1, ..., NT ), respectively;<br />
βj = 1<br />
NT ε2 j<br />
2<br />
|Dj| 2<br />
(3.4)<br />
are positive weights. In definition 3.4 εj are the user-estimated relative errors of<br />
the impedance Dj. We will call these errors εj the noise floor. A large noise floor<br />
corresponds to bad quality MT data.<br />
There are two reasons for the form 3.4 for the weights βj: first, to be able to<br />
equally fit the impedances at all frequencies or choose the frequencies, which are<br />
important for a particular case and put large errors εj for the others, and second,<br />
to know to what level we should minimize our data misfit ϕd, in order not to overfit<br />
the data. For example, we should not minimize the data misfit to a level lower than<br />
1, if our data has noise of εj.<br />
Since the conductivities σk (k = 1, ..., N) must be nonnegative and reasonable,<br />
the optimization problem given in equation 3.1 is subject to bounds:<br />
l ≤ σ ≤ u, (3.5)<br />
where l = (l1, ..., lN) T and u = (u1, ..., uN) T are the lower and upper bounds, respec-<br />
tively, lk ≥ 0.<br />
To solve the problem posed in equations 3.1-3.5 we use the limited memory QN<br />
method described in Chapter 2. An essential difficulty of this optimization method<br />
is the calculation of derivatives ∂ϕd/∂mk as given in equation 2.25. Taking in mind<br />
36
equation 3.3, we see that<br />
Chapter 3. 1D MT <strong>Inversion</strong><br />
∂ϕd<br />
∂mk<br />
= ∂ϕd<br />
∂σk<br />
3.1.1. Calculation of derivatives ∂ϕd<br />
∂σk<br />
σ (0)<br />
k . (3.6)<br />
A straightforward numerical calculation of the derivatives by finite differences<br />
∂ϕd<br />
∂σk<br />
≈ ϕd(σ1, . . . , σk + δσk, . . . , σN) − ϕd(σ1, . . . , σk, . . . , σN)<br />
δσk<br />
(3.7)<br />
involves at least N + 1 solutions of the forward problem. However, for large-scale<br />
problems, when N is large, such a straightforward calculation may be prohibitive<br />
in terms of computational time. In addition, the selection of the increment δσk is<br />
not easy in order to ensure numerical stability, and usually few increments should<br />
be tried. One can significantly speed up the inverse problem solution by avoiding<br />
this straightforward calculation, given in formula 3.7.<br />
Our approach for calculating the derivatives exploits the Green’s function tech-<br />
nique and requires time equal to the time of the solution of two forward problems,<br />
rather than N + 1 forward problems.<br />
To derive the derivatives ∂ϕd<br />
∂σk<br />
let us first rewrite equation 3.2 as<br />
ϕd(σ) = 1<br />
2 〈Z − D, Z − D〉 2 , (3.8)<br />
where we introduce the vectors σ = (σ1, ..., σN) T , Z = (Z1, ..., ZNT )T , and D =<br />
(D1, ..., DNT )T and an inner product 〈·, ·〉 2 of vectors a and b as<br />
From equations 3.8 and 3.9, it follows that<br />
∂ϕd<br />
∂σk<br />
NT <br />
〈a, b〉 2 = βjajbj. (3.9)<br />
j=1<br />
= 1<br />
<br />
NT ∂(Zj − Dj)<br />
βj<br />
(Zj − Dj) +<br />
2<br />
∂σk<br />
j=1<br />
∂(Zj<br />
<br />
− Dj)<br />
(Zj − Dj)<br />
∂σk<br />
<br />
= ℜ Z − D, ∂Z<br />
<br />
. (3.10)<br />
∂σk 2<br />
The main problem now is how to calculate the derivatives ∂Z . From Maxwell’s<br />
∂σk<br />
equations written for a layered earth (see Appendix A), it follows that at any depth<br />
37
z, the impedance can be derived as<br />
Chapter 3. 1D MT <strong>Inversion</strong><br />
where vj(z) satisfies the Helmholtz equation<br />
Zj(z) = iωjµ0vj<br />
, (3.11)<br />
∂zvj<br />
∂ 2 zvj + iωjµ0σ(z)vj = 0, (3.12)<br />
and the boundary condition vj →<br />
z→∞ 0. Here, ωj = 2π/Tj is the jth angular frequency,<br />
and µ0 is the magnetic permeability of free space. Further, for a layered earth we<br />
easily may decompose σ(z) as<br />
σ(z) =<br />
N<br />
σkχk(z), (3.13)<br />
k=1<br />
where σk is the conductivity of the kth layer confined between boundaries zk and<br />
zk+1, and the boxcar function χk(z) = θ(z − zk) − θ(z − zk+1), where θ(z) is the<br />
Heaviside function. Note that in equation 3.13 we assume that zN+1 = ∞. From<br />
equations 3.12 and 3.13 it follows that<br />
∂ 2 z<br />
∂vj<br />
∂σk<br />
+ iωjµ0σ(z) ∂vj<br />
∂σk<br />
From equation 3.14, it follows that the derivative ∂vj<br />
∂σk<br />
∂vj<br />
∂σk<br />
<br />
= −<br />
zk+1<br />
Gj(z, ζ)χk(ζ)vj(ζ)dζ = −<br />
= −iωjµ0χk(z)vj. (3.14)<br />
zk<br />
is expressed as<br />
where the Green’s function is a solution to the following equation:<br />
Gj(z, ζ)vj(ζ)dζ, (3.15)<br />
∂ 2 zGj(z, ζ) + iωjµ0σ(z)Gj(z, ζ) = iωjµ0δ(z − ζ), (3.16)<br />
and where δ(z) is the delta-function. From equation 3.11 it follows that<br />
<br />
∂Zj 1 ∂vj<br />
(z) = Zj<br />
∂σk vj ∂σk<br />
38<br />
− 1<br />
∂zvj<br />
∂z<br />
∂vj<br />
∂σk<br />
<br />
. (3.17)
Chapter 3. 1D MT <strong>Inversion</strong><br />
Substituting equation 3.15 into equation 3.17 (and assuming z = 0) yields<br />
<br />
∂Zj<br />
(0) = Zj(0) −<br />
∂σk<br />
1<br />
zk+1<br />
Gj(0, ζ)vj(ζ)dζ<br />
vj(0) zk<br />
+<br />
1<br />
<br />
zk+1<br />
∂zGj(z, ζ)|z=0vj(ζ)dζ .<br />
∂zvj|z=0<br />
zk<br />
Using the following properties of Gj(z, ζ) (at z < ζ ) (Avdeev et al., 1997):<br />
where<br />
(3.18)<br />
1<br />
∂zGj(z, ζ) = iωjµ0<br />
Z∗ j (z)Gj(z, ζ), (3.19)<br />
Gj(z, ζ) =<br />
1<br />
Zj −1 (z) − Z∗−1 γj(z, ζ), (3.20)<br />
j (z)<br />
ζ<br />
γj(z, ζ) = exp iωjµ0 Zj<br />
z<br />
−1 <br />
(ζ)dζ , (3.21)<br />
and Z ∗ j (z) is the impedance of the layered earth model above the depth z, from<br />
equation 3.18 we derive that<br />
<br />
∂Zj<br />
(0) = Zj(0) −<br />
∂σk<br />
1<br />
vj(0) + iωµ0Z ∗ j −1 <br />
(0) 1<br />
∂zvj|z=0 Zj −1 (0) − Z∗ <br />
−1<br />
j (0)<br />
3.11<br />
= −Zj(0)<br />
iωµ0<br />
∂zvj|z=0<br />
= −Z 2 zk+1<br />
j (0)<br />
zk<br />
<br />
zk+1<br />
zk<br />
γj(0, ζ)vj(ζ)dζ 3.11<br />
= −Z 2 j (0)<br />
To obtain equation 3.22 we also used the fact that<br />
<br />
zk+1<br />
zk<br />
zk+1<br />
zk<br />
γj(0, ζ)vj(ζ)dζ<br />
γj(0, ζ) vj(ζ)<br />
vj(0) dζ<br />
γ 2 j (0, ζ)dζ. (3.22)<br />
γj(0, ζ) 3.21,3.11<br />
ζ<br />
∂zvj|z=ζ<br />
= exp<br />
0 vj(ζ) dζ<br />
<br />
= vj(ζ)<br />
vj(0)<br />
Substituting equation 3.22 in equation 3.10 yields the desired derivatives<br />
∂ϕd<br />
∂σk<br />
= −ℜ<br />
NT<br />
<br />
j=1<br />
βjΓkj<br />
39<br />
2<br />
Zj − Dj Zj <br />
, (3.23)
Chapter 3. 1D MT <strong>Inversion</strong><br />
where for simplicity we denoted Zj = Zj(0), and<br />
zk+1<br />
Γkj =<br />
zk<br />
γ 2 j (0, ζ)dζ (k = 1, ..., N). (3.24)<br />
Let us now derive an explicit expression for the coefficients Γkj.<br />
3.1.1.1. Calculation of Γkj<br />
By definition (see equation 3.24 and 3.21)<br />
where<br />
zk+1<br />
Γkj =<br />
From these two equations it follows that<br />
where<br />
Γkj =<br />
=<br />
zk+1<br />
zk<br />
k−1<br />
zk<br />
γ 2 j (0, ζ)dζ (k = 1, ..., N),<br />
ζ<br />
γj(z, ζ) = exp iωjµ0 Zj<br />
z<br />
−1 <br />
(ζ)dζ .<br />
⎡ ⎛<br />
k−1<br />
⎣exp ⎝iωjµ0<br />
l=1<br />
zl+1 <br />
zl<br />
Zj −1 (ζ)dζ + iωjµ0<br />
ζ<br />
zk<br />
Zj −1 (ζ)dζ<br />
⎞⎤<br />
⎠⎦<br />
<br />
γ 2 <br />
j (zl, zl+1) γkj, (3.25)<br />
l=1<br />
γkj =<br />
zk+1<br />
zk<br />
2<br />
dζ<br />
γ 2 j (zk, ζ)dζ. (3.26)<br />
In the above expressions, we assumed that z1 = 0 and zN+1 = ∞. From equa-<br />
tion 3.25 it follows that the coefficients Γkj can be calculated recursively as<br />
Γk+1j = γ 2 j (zk, zk+1) γk+1j<br />
Γkj, (3.27)<br />
γkj<br />
where Γ1j = γ1j as can be seen from equations 3.25 and 3.26. From equations 3.11,<br />
3.12 and the definition given by equation 3.21, it follows that<br />
γj(zk, ζ) = cosh (κkj(ζ − zk)) + λkj sinh (κkj(ζ − zk)) , (zk ≤ ζ ≤ zk+1), (3.28)<br />
40
where κkj = √ −iωµ0σk and<br />
Chapter 3. 1D MT <strong>Inversion</strong><br />
λkj = iωµ0<br />
Zj<br />
κkj<br />
−1 (zk). (3.29)<br />
From equations 3.11 and 3.12 and the definition given by equation 3.29, the following<br />
recursive formula follows<br />
⎧<br />
⎪⎨<br />
− sinh(∆kκkj)+cosh(∆kκkj)<br />
λkj =<br />
⎪⎩<br />
κk+1j λk+1j<br />
κkj cosh(∆kκkj)−sinh(∆kκkj) κk+1j , k = N − 1, ..., 1<br />
λk+1j<br />
κkj −1, k = N<br />
(3.30)<br />
This formula can also be easily obtained from definition 3.29 and the recursive<br />
formula for the 1D impedance A.9, explicitly derived in Appendix A.<br />
From equation 3.28 it also follows that<br />
γj(zk, zk+1) = cosh(∆kκkj) + λkj sinh(∆kκkj). (3.31)<br />
Finally, substituting equation 3.28 into equation 3.26, and after some manipulation,<br />
one obtains<br />
⎧<br />
⎪⎨<br />
γkj =<br />
⎪⎩<br />
<br />
1−λ2 kj<br />
∆k 2 <br />
(1+λkj) 2<br />
1<br />
2κkj<br />
2<br />
sinh(∆kκkj)<br />
+ ∆kκkj<br />
·<br />
<br />
cosh(∆kκkj) + λkj sinh(∆kκkj) , k = N − 1, ..., 1<br />
, k = N<br />
(3.32)<br />
The expressions presented in equations 3.31 and 3.32 permit the recursive calculation<br />
of the coefficients Γkj using equation 3.27. Comparing equations 3.30-3.32, one can<br />
see that the coefficients λkj, γkj, and γj(zk, zk+1) are calculated simultaneously while<br />
moving from the bottom of the model to the surface. Such a calculation is somewhat<br />
equivalent to the forward problem solution. Once the coefficients γkj and γj(zk, zk+1)<br />
are found, the Γkj required by the derivatives defined in equation 3.23 are calculated<br />
recursively from the surface to the bottom using equation 3.27. Thus the time to<br />
calculate the derivatives of equation 3.23 is not more than twice that required for<br />
the forward problem solution (calculating λkj alone).<br />
It is important to mention that the derivatives ∂ϕd/∂σk can also be calculated<br />
using the chain-rule (e.g. Constable et al., 1987), which is based on the differentiation<br />
of an analytical solution to a 1D forward problem.<br />
41
3.1.2. Regularization technique<br />
Chapter 3. 1D MT <strong>Inversion</strong><br />
In our 1D implementation the regularized part (stabilizer) ϕs introduced earlier in<br />
equation 3.1 has the following form:<br />
ϕs(m) =<br />
N<br />
(mk − mk−1) 2<br />
k=2<br />
where m = (m1, ..., mN) T and model parameters mk are given by equation 3.3.<br />
3.1.2.1. Choice of parameter λ<br />
(3.33)<br />
When we use any stabilizer ϕs we encounter the additional problem of finding the<br />
regularization parameter λ. We know that the solution of underdetermined (M 1, where m λ delivers the solution of min<br />
m ϕ(m, λ), with the<br />
parameter λ. To do this we solve the inverse problem posed in equations 3.1-3.5<br />
for different values of λ. As prescribed by the cooling approach, we start this<br />
process with a large value of the parameter λ. Note that the weight coefficients βj<br />
j = 1, ..., NT of the misfit ϕd are chosen so that the value ϕd = 1 exactly corresponds<br />
to the noise floor (see page 36). In the second stage, we find the biggest possible<br />
λopt such that ϕd(m λopt ) ≤ 1, where m λopt is a solution of min<br />
m ϕ(m, λopt). To find<br />
such a value λ, we iteratively apply the linear interpolation of φ(λ) = ϕd(m λ )<br />
at the segment [λlow, λhigh]. This approach is a simple variant of an algorithm by<br />
Haber and Oldenburg (1997). It should be understood, however, that it does not<br />
make sense to fine tune the regularization parameter λ, following our procedure, if<br />
the noise floor cannot be estimated reliably. In the numerical examples presented<br />
below, we demonstrate that our procedure works successfully for the case of a slightly<br />
overestimated noise floor.<br />
42
3.2. Model study<br />
Chapter 3. 1D MT <strong>Inversion</strong><br />
We demonstrate on a synthetic example the extent to which the calculation of the<br />
derivatives given by equation 3.6 presented in Section 3.1.1 accelerates the solution<br />
of the inverse problem. A seven-layered earth model is given in Table 3.1. This<br />
Conductivity [S/m] Thickness [km]<br />
0.01 64<br />
0.05 180<br />
0.1 150<br />
0.12 126<br />
0.28 130<br />
1.1 150<br />
1.5<br />
Table 3.1.: A seven-layered earth model<br />
model was compiled from the models derived from a seafloor MT and a global GDS<br />
long-period data set collected in the North Pacific Ocean (see Avdeev et al., 2004).<br />
To complicate the inversion process, we subdivided the three upper layers in this<br />
model (to a depth of 394 km) into 197 sublayers of equal thickness. This means<br />
that we deliberately overparametrized the problem. For this 201-layered (N = 201)<br />
model, we inverted the impedance Dj = Zj(m), calculated at NT = 30 periods,<br />
from 10 s to 10,800 s. In addition, we added 0.5% random noise to the impedance<br />
data. This is a realistic noise level for very good quality MT data. The relative error<br />
εj of equation 3.4 was taken as 0.01, which means that the noise floor is slightly<br />
overestimated and should lead to a smoother result. A 10 Ωm uniform half-space<br />
was used as an initial guess model.<br />
In Figure 3.1(a), we compare the convergence rates of two solutions obtained<br />
with straightforward calculation of the derivatives (see formula 3.7) and using the<br />
method presented in Section 3.1.1, respectively. The curves are shown as a function<br />
of the number of evaluations of ϕ(m, λ) for two cases, λ = 0 and λopt = 320. From<br />
Figure 3.1(a), it is seen that the calculation of the derivatives given in Section 3.1.1<br />
accelerates the solution by 130 times. The results of the inversion are presented<br />
in 3.1(b). As might be expected, the conductivity models recovered do not fit well<br />
for depths greater than 400 km because the responses at the periods considered are<br />
almost insensitive to these depths.<br />
43
(a)<br />
(b)<br />
Chapter 3. 1D MT <strong>Inversion</strong><br />
Figure 3.1.: (a) Comparison of convergence rates: The curves present the misfit<br />
of equation 3.2 obtained with the straightforward calculation of the<br />
derivatives shown for λ = 0 (amber) and λopt = 320 (green). The<br />
green dashed line presents the objective function of equation 3.1 for<br />
λopt = 320. The same is shown with the calculation of the derivatives<br />
that is presented in Section 3.1.1, for λ = 0 (red) and λopt = 320 (blue<br />
solid and dashed lines). (b) The conductivity models obtained with the<br />
calculation of the derivatives as presented in Section 3.1.1: for λ = 0<br />
(red) and λopt = 320 (blue). The solid and dashed black lines show the<br />
true and initial guess models, respectively.<br />
In our next example (Figure 3.2), we study the convergence rate of our solution<br />
for various numbers ncp of correction pairs. Let us remind here that every iteration<br />
n a pair of vectors {s (n) , y (n) } is calculated. This pair is called a correction pair. The<br />
optimization method requires to store these pairs only from ncp previous iterations.<br />
So the information from only the most recent iterations is stored and information<br />
from the previous iterations is discarded in the interest of saving storage. The<br />
number ncp is defined by user and depends on the amount of available memory. The<br />
44
Chapter 3. 1D MT <strong>Inversion</strong><br />
curves in Figure 3.2(a) are shown as a function of nfg. This number, nfg, is the<br />
number of evaluations of objective function ϕ(m, λopt) together with its gradient<br />
(∂ϕ/∂m1, ..., ∂ϕ/∂mN) T |m,λopt and is equal to or a little bit larger than the number<br />
of QN iterations, nit, since the method might need few steps within the line search<br />
procedure.<br />
We can see that for all the ncp numbers considered we get very similar resulting<br />
models (see Figure 3.2(b)). For ncp = 2 the convergence is worse than for all other<br />
ncp numbers (see Figure 3.2(a)). It is surprising that such a small number of pairs<br />
(ncp = 5) can be sufficient to get a relatively good convergence and a reasonable<br />
result.<br />
(a)<br />
(b)<br />
Figure 3.2.: Comparison for different numbers of correction pairs (ncp). (a) The<br />
convergence rate for ncp = 2 (green), ncp = 5 (blue), ncp = 20 (red) and<br />
ncp = 25 (black). (b) The corresponding conductivity models, which<br />
are plotted mostly on top of each other. The solid and dashed black<br />
lines show the true and initial guess models, respectively.<br />
In Figure 3.3, we present the third example – a comparison of two different so-<br />
lutions. The first solution is based on the optimization method offered in previous<br />
45
Chapter 3. 1D MT <strong>Inversion</strong><br />
chapter, and the second one uses the L-BFGS-B optimization code by Byrd et al.<br />
(1995). The comparison is presented for ncp = 5 correction pairs and λopt = 320.<br />
These solutions converge in a similar way and produce similar models. In the same<br />
figure we show the curves produced using the conventional QN algorithm of Gill<br />
et al. (1981), subject to simple bounds. To find the search direction p (n) , this al-<br />
gorithm solves the Newton system H (n) p (n) = −g (n) , rather than making use of<br />
equation p (n) = −G (n) g (n) (see equation 2.28), and it is mostly suitable for small-<br />
scale problems.<br />
(a)<br />
(b)<br />
Figure 3.3.: Comparison of three different QN methods. (a) The convergence rate<br />
for inversions, which uses the approach presented in Chapter 2 (blue<br />
line), L-BFGS-B algorithm (red) and QN algorithm by Gill et al. (1981)<br />
(green). (b) The corresponding conductivity models, which are plotted<br />
on top of each other. The solid and dashed black lines show the true<br />
and initial guess models, respectively.<br />
46
3.3. Conclusions<br />
Chapter 3. 1D MT <strong>Inversion</strong><br />
In this chapter we describe a limited memory QN method applied to solve the 1D<br />
MT inverse problem. In the numerical examples presented, we demonstrate that<br />
our method for the calculation of derivatives (see 3.1.1) dramatically accelerates the<br />
problem solution. The nontrivial problem of such a calculation of derivatives in the<br />
3D MT case is presented in the next chapter. We also describe the regularization<br />
procedure and propose a method for finding an optimal regularization parameter,<br />
λopt. This procedure is useful in cases where the noise floor is roughly known and<br />
we demonstrate that it works successfully on numerical examples. Another finding<br />
of our numerical experiments is that we can find a reasonable solution to the inverse<br />
problem with a surprisingly small number of correction pairs (ncp = 5). We also<br />
demonstrate that the solution, based on method described in Chapter 2, converges<br />
similarly to the solution based on the L-BFGS-B method.<br />
47
Chapter 4.<br />
3D MT <strong>Inversion</strong><br />
In this chapter we describe how we apply the limited memory quasi-Newton opti-<br />
mization method to develop a novel fully three-<strong>dimensional</strong> magnetotelluric inversion<br />
technique. The inversion involves all four entries of the MT impedance matrix and<br />
we employ the integral equation forward modelling code x3d by Avdeev et al. (1997,<br />
2002), briefly described in Section 2.1, as an engine for this inversion.<br />
In Section 4.1 we first briefly describe the setting of the inverse problem, as well<br />
as some key features of our implementation. In Subsection 4.1.1, we develop the<br />
theory and basic equations for the calculation of the derivatives of the data misfit,<br />
our theory is based on the known adjoint approach (Rodi, 1976; Rodi and Mackie,<br />
2001; Chen et al., 2005). Then, we demonstrate that the calculation of the deriva-<br />
tives, at a given period, is equivalent to only two forward modellings. Usage of this<br />
adjoint approach dramatically accelerates the inversion. In Section 4.2 we demon-<br />
strate how our inversion works in practice (in terms of the convergence, performance<br />
and accuracy) on synthetic, but realistic numerical examples. One of the examples<br />
(Subsection 4.2.2) includes a tilted conductive dyke in a uniform half-space (Zh-<br />
danov and Tolstaya, 2004). Another example is more complex, involving a model<br />
with resistive and conductive adjacent blocks buried in a two-layered earth (Sub-<br />
section 4.2.4). Both models have also been used to test other forward and inverse<br />
codes. The results presented in this chapter are encouraging and suggest that the<br />
solution developed in this work can be successfully applied to 3D inverse problems<br />
with measured MT data.<br />
48
Chapter 4. 3D MT <strong>Inversion</strong><br />
4.1. Theory and basic equations<br />
Let us consider a 3D earth conductivity model discretized by N cells, such that<br />
σ(r) = N<br />
<br />
1, r ∈ Vk<br />
σkχk(r), where χk(r) =<br />
, Vk is the volume occupied by the<br />
k=1<br />
0, r /∈ Vk<br />
kth cell and r = (x, y, z). In the frame of 3D MT inversion, we seek the conductivities<br />
σk (k = 1, ..., N) of the cells. This is again - as in the previous chapter - a typical<br />
optimization problem, such that ϕ(σ, λ) → σ,λ min, with a penalty function ϕ given as<br />
ϕ(σ, λ) = ϕd(σ) + λϕs(σ). (4.1)<br />
As in the previous chapter, the first term, ϕd(σ), is the data misfit and serves to<br />
ensure that our recovered model matches the observed data. The second term in<br />
equation 4.1, ϕs(σ), is a Tikhonov-type stabilizer (Tikhonov, 1963); λ is the regu-<br />
larization parameter that balances the effect of data misfit and model regularization<br />
during minimization. The stabilizer ϕs can be chosen in many different ways. This<br />
aspect of the problem is discussed in Subsection 4.1.2.<br />
For the 3D MT case the data misfit ϕd(σ) has the following form<br />
ϕd = 1<br />
2<br />
NS NT <br />
i=1<br />
<br />
j=1<br />
βijtr[A T<br />
ijAij] (4.2)<br />
Here NS is the number of MT sites ri = (xi, yi, z = 0), where i = 1, ..., NS; NT is the<br />
number of the frequencies ωj, where j = 1, ..., NT ; the 2 × 2 matrices Aij <br />
<br />
are defined<br />
as Aij = Zij−Dij, where Zij =<br />
Zxx Zxy<br />
Zyx Zyy<br />
ij<br />
and Dij =<br />
Dxx Dxy<br />
Dyx Dyy<br />
ij<br />
are ma-<br />
trices of the complex-valued predicted Z(ri, ωj) and observed D(ri, ωj) impedances,<br />
respectively;<br />
βij = 1<br />
NSNT ε2 ijtr 2<br />
<br />
D T<br />
(4.3)<br />
ijDij<br />
are the positive weights, where εij is the relative error of the observed impedance<br />
Dij(σ). The sign tr [·] introduced above means the<br />
<br />
trace of its<br />
<br />
matrix argument,<br />
which is defined as tr [B] = Bxx + Byy, for any B =<br />
Bxx Bxy<br />
Byx Byy<br />
. The question of<br />
why the form of equation 4.2 was chosen to represent a measure of misfit is discussed<br />
in Appendix C. In addition, a more generalized form of this equation is considered<br />
in Appendix D.<br />
49
Chapter 4. 3D MT <strong>Inversion</strong><br />
An alternative way for constructing data misfit ϕd would be to treat the individual<br />
entries of the impedance separately.<br />
Again, the conductivities σk (k = 1, ..., N) must be nonnegative and realistic and,<br />
hence, the optimization problem 4.1 is subject to the bounds<br />
l ≤ σ ≤ u, (4.4)<br />
where l = (l1, ..., lN) T and u = (u1, ..., uN) T are the lower and upper bounds, respec-<br />
tively, and lk ≥ 0, (k = 1, ..., N).<br />
To solve the problem posed in equations 4.1-4.4 we use the limited memory QN<br />
method described in Chapter 2. We assume that<br />
mk = σk/σ (0)<br />
k , (4.5)<br />
where σ (0)<br />
k is the conductivity of k-th cell for an initial guess model. As for the 1D<br />
case considered above, the essential difficulty of the 3D solution is the calculation<br />
of derivatives<br />
∂ϕd<br />
∂mk<br />
= ∂ϕd<br />
σ<br />
∂σk<br />
(0)<br />
k<br />
4.1.1. Calculation of derivatives ∂ϕd<br />
∂σk<br />
To derive the derivatives ∂ϕd<br />
∂σk<br />
(4.6)<br />
we apply a technique that is based on ideas of the<br />
electromagnetic adjoint method (Rodi, 1976, among others). This method uses<br />
the EM field reciprocity and has been applied previously to calculate sensitivities<br />
(Weidelt, 1975b; McGillivray and Oldenburg, 1990) and for forward modelling and<br />
inversion (Dorn et al., 1999; Rodi and Mackie, 2001; Newman and Boggs, 2004; Chen<br />
et al., 2005). The main idea behind EM field reciprocity is that we can interchange<br />
sources and receivers without affecting the measured electromagnetic field. This<br />
means that instead of calculating the field at the MT sites from sources located at<br />
every cell, we can can calculate the fields from sources located at the MT sites. Let<br />
us now describe our implementation of such a technique.<br />
50
Chapter 4. 3D MT <strong>Inversion</strong><br />
From equation 4.2 it easily follows that<br />
∂ϕd<br />
∂σk<br />
=<br />
1<br />
2<br />
∀B:trB T =trB<br />
= ℜ<br />
<br />
<br />
<br />
βijtr A T<br />
T ∂Zij<br />
ij<br />
∂σk<br />
+ A T<br />
<br />
∂Zij<br />
ij<br />
∂σk<br />
<br />
<br />
βijtr A T<br />
<br />
∂Zij<br />
ij<br />
∂σk<br />
<br />
. (4.7)<br />
NS NT <br />
i=1 j=1<br />
<br />
NS NT<br />
i=1<br />
j=1<br />
The MT impedance Zij = Z(ri, ωj) is a 2 × 2 matrix, which satisfies the following<br />
matrix equation<br />
The matrices Eij, Hij of equation 4.8 are defined as<br />
where p =<br />
<br />
and Hj(r) =<br />
1 0 0<br />
0 1 0<br />
<br />
H (1)<br />
x<br />
H (2)<br />
x<br />
<br />
H (1)<br />
y<br />
H (2)<br />
y<br />
Eij = ZijHij. (4.8)<br />
Eij = pEj(ri), Hij = pHj(ri), (4.9)<br />
is the 2×3 projection matrix, Ej(r) =<br />
H (1)<br />
z<br />
H (2)<br />
z<br />
T<br />
j<br />
<br />
E (1)<br />
x<br />
E (2)<br />
x<br />
E (1)<br />
y<br />
E (2)<br />
y<br />
E (1)<br />
z<br />
E (2)<br />
z<br />
are functions of the Cartesian coordinates r =<br />
(x, y, z). Here the superscripts 1 and 2 denote the polarization of the source Jj(r) =<br />
<br />
J (1)<br />
x<br />
J (2)<br />
x<br />
J (1)<br />
y<br />
J (2)<br />
y<br />
J (1)<br />
z<br />
J (2)<br />
z<br />
T<br />
j<br />
, and the vectors E = (Ex, Ey, Ez) T and H = (Hx, Hy, Hz) T<br />
are the electric and magnetic fields, respectively. We choose the polarizations of<br />
the source parallel(1) and perpendicular(2) to the x-axis. The 3 × 2 matrices Ej(r)<br />
and Hj(r) are composed of EM fields and, hence, they satisfy 2 × NT systems of<br />
Maxwell’s equations written as<br />
where ∇ × Hj and ∇ × Ej denote 3 × 2 matrices<br />
respectively.<br />
From equation 4.8 it immediately follows that<br />
∇ × Hj = σ(r)Ej + Jj, (4.10a)<br />
∇ × Ej = √ −1ωjµHj, (4.10b)<br />
<br />
∇ × H (1)<br />
∇ × H (2)<br />
T<br />
j<br />
,<br />
<br />
∇ × E (1)<br />
∇ × E (2)<br />
T<br />
Zij = EijH −1<br />
ij , (4.11)<br />
51<br />
j<br />
T<br />
,<br />
j
Chapter 4. 3D MT <strong>Inversion</strong><br />
where H −1<br />
ij is the inverse of matrix Hij. Applying the chain-rule of differentiation<br />
to equation 4.11 one can derive<br />
where we denote<br />
Zij,k = ∂Zij<br />
∂σk<br />
Zij,k = (Eij,k − ZijHij,k)H −1<br />
ij , (4.12)<br />
, Eij,k = ∂Eij<br />
, Hij,k =<br />
∂σk<br />
∂Hij<br />
∂σk<br />
(k = 1, ..., N). (4.13)<br />
Now substituting the derivative of equation 4.12 into equation 4.7 one gets<br />
∂ϕd<br />
∂σk<br />
= ℜ<br />
NS<br />
NT <br />
βijtr A T<br />
ij (Eij,k − ZijHij,k) H −1<br />
<br />
ij<br />
<br />
. (4.14)<br />
i=1<br />
j=1<br />
Further, from equations 4.9, 4.10 it follows that<br />
Eij,k = pejk(ri), Hij,k = phjk(ri), (4.15)<br />
where 3 × 2 matrices ejk(r) and hjk(r) satisfy 2 × NT × N systems of Maxwell’s<br />
equations<br />
with the given electric current densities<br />
∇ × hjk = σ(r)ejk + j jk, (4.16a)<br />
∇ × ejk = √ −1ωjµhjk, (4.16b)<br />
j jk = χkEj. (4.17)<br />
To derive equations 4.16, 4.17 from 4.10 we decompose the conductivity as σ(r) =<br />
N<br />
σkχk(r) and then differentiate equations 4.10 by σk. We also assume that<br />
k=1<br />
∂Jj<br />
= 0.<br />
∂σk<br />
<br />
In equations 4.16 and 4.17 the matrices ejk(r) =<br />
<br />
h (1)<br />
x<br />
h (2)<br />
x<br />
h (1)<br />
y<br />
h (2)<br />
y<br />
h (1)<br />
z<br />
h (2)<br />
z<br />
T<br />
jk<br />
e (1)<br />
x<br />
e (2)<br />
x<br />
e (1)<br />
y<br />
e (2)<br />
y<br />
e (1)<br />
z<br />
e (2)<br />
z<br />
T<br />
jk<br />
and hjk(r) =<br />
are functions of the Cartesian coordinates r = (x, y, z).<br />
Thus, to calculate the MT impedance derivative ∂Z<br />
∂σk (ri, ωj) for the complete set<br />
of triple indices {(i, j, k) : i = 1, ..., NS, j = 1, ..., NT , k = 1, ..., N} one should solve<br />
52
Chapter 4. 3D MT <strong>Inversion</strong><br />
2 × NT × (N + 1) forward problems, given in equations 4.10 and 4.16. Obviously,<br />
for a 3D conductivity model, where the number of cells, N, is relatively large, such<br />
an approach is not feasible. Fortunately, we need to calculate derivatives ∂ϕ<br />
, ...,<br />
∂σ1<br />
∂ϕ<br />
rather than the matrices of equation 4.13. In the following explanation, we<br />
∂σN<br />
show that for the calculation of these derivatives ∂ϕ ∂ϕ<br />
, ..., , we need to solve only<br />
∂σ1 ∂σN<br />
2 × NT × 2 forward problems, rather then 2 × NT × (N + 1).<br />
Along with the forward problems given in equation 4.16, let us also consider 2×NT<br />
adjoint problems, presented by Maxwell’s equations<br />
where j ext<br />
j<br />
and<br />
and h ext<br />
j<br />
h ext<br />
j<br />
∇ × vj = σuj + j ext<br />
j + ∇ × h ext<br />
j , (4.18a)<br />
are defined as<br />
j ext<br />
j<br />
∇ × uj = √ −1ωjµvj, (4.18b)<br />
NS <br />
= βijp T AijH −T<br />
ij δ(r − ri), (4.19)<br />
i=1<br />
NS<br />
1 <br />
= −√<br />
βijp<br />
−1ωjµ<br />
T Z T<br />
ijAijH −T<br />
ij δ(r − ri), (4.20)<br />
i=1<br />
respectively. In these equations H −T<br />
ij means transpose of H −1<br />
ij , and δ is the Dirac’s<br />
delta-function.<br />
Let us now rewrite equations 4.16 and 4.18 as<br />
∇ × ∇ × ejk − √ −1ωjµσ(r)ejk = √ −1ωjµχkEj, (4.21a)<br />
∇ × ∇ × uj − √ −1ωjµσ(r)uj = √ −1ωjµ(j ext<br />
j + ∇ × h ext<br />
j ). (4.21b)<br />
Multiplying equation 4.21a by uT j and equation 4.21b by eT jk and integrating the<br />
difference of the resulting equations over the whole 3D space, one gets<br />
<br />
R3 tr e T jkj ext<br />
j + e T jk∇ × h ext<br />
<br />
<br />
j dV = tr<br />
Vk<br />
u T <br />
j Ej dV. (4.22)<br />
To derive equation 4.22 we use the Green-type formula <br />
R3(v∇×w−w∇×v)dV = 0<br />
that is valid for any complex-valued vector fields v and w. We then modify the left<br />
53
hand side of equation 4.22 as<br />
<br />
R 3<br />
Chapter 4. 3D MT <strong>Inversion</strong><br />
tr e T jkj ext<br />
j + √ −1ωjµh T<br />
jkh ext<br />
j<br />
<br />
<br />
dV =<br />
using tr eT <br />
jk∇ × hext j = tr (∇ × ejk) T h ext<br />
j<br />
further equations 4.19, 4.20 for sources j ext<br />
j , h ext<br />
j<br />
property that <br />
NS <br />
i=1<br />
Vk<br />
= √ −1ωjµtr h T<br />
tr u T <br />
j Ej dV, (4.23)<br />
jkh ext<br />
j<br />
. Substituting<br />
into equation 4.23 and using the<br />
R 3 v(r)δ(r − ri)dV = v(ri) for any vector v, one derives<br />
<br />
βijtr A T<br />
ij (pejk(ri) − Zijphjk(ri)) H −1<br />
<br />
ij = tr<br />
Vk<br />
u T <br />
j Ej dV, (4.24)<br />
since tr[BC] = tr[CB], tr[B T ] = tr[B], (BC) T = C T B T for any pair of matrices B<br />
and C. Comparing equations 4.24, 4.9 and 4.14 one immediately concludes that<br />
∂ϕd<br />
∂σk<br />
= ℜ<br />
NT<br />
<br />
<br />
j=1<br />
Vk<br />
tr u T <br />
j Ej dV<br />
<br />
. (4.25)<br />
The formula of equation 4.25 means that the computational loads for calculating<br />
the gradient of equation 2.25 are equivalent to those for the solution of 2 × NT<br />
forward problems using equations 4.10 to find Ej and of 2 × NT adjoint problems<br />
using equations 4.18 to find uj for all j = 1, ..., NT .<br />
4.1.1.1. Numerical verification<br />
To calculate the derivatives of equation 4.25 we need to solve the adjoint system of<br />
Maxwell’s equations 4.18. To solve this system we should be able to calculate not<br />
the electric fields, but their averages over numerical cells, for the media excited by<br />
horizontal electric, j ext<br />
j , and magnetic, h ext<br />
j , dipoles. We are lucky that the x3d code<br />
computes exactly these averages. To verify the ability of x3d, we checked it against<br />
an analytical solution for a uniform space.<br />
Thus, let us consider a uniform space with conductivity σ. For such a space<br />
the electric field components excited by a horizontal magnetic dipole of moment<br />
(Mx, 0, 0), which is located at the coordinate origin, are as following (Ward and<br />
54
Hohmann, 1987)<br />
Chapter 4. 3D MT <strong>Inversion</strong><br />
Ex = 0, (4.26a)<br />
Ey = − √ −1ωµ Mxza(r)<br />
r 2 (κr + 1), (4.26b)<br />
Ez = √ −1ωµ Mxya(r)<br />
r 2 (κr + 1), (4.26c)<br />
where κ 2 = − √ −1ωµσ, r = x 2 + y 2 + z 2 and a(r) = e −κr /4πr.<br />
0-100 m 100-300 m 300-700 m 0.7-1.4 km 1.4-2.7 km 2.7-4.5 km 4.5-7 km<br />
0-100 m 100-300 m 300-700 m 0.7-1.4 km 1.4-2.7 km 2.7-4.5 km 4.5-7 km<br />
Figure 4.1.: Comparisons of averaged 〈Ey〉 for a uniform space excited by a magnetic<br />
dipole. Each row presents 7 horizontal (x−y) slices starting from the top<br />
(left) to the bottom (right). The 1st row corresponds to 〈Ey〉 obtained<br />
using x3d, the 2nd row - to 〈Ey〉 obtained from equations 4.26b, 4.27<br />
and 4.28. The 3rd row shows the relative error between averaged 〈Ey〉<br />
obtained by x3d and those obtained from equations 4.26b, 4.27 and 4.28.<br />
Using the x3d code, we calculated the 10-s electric fields for a 100 Ωm uniform<br />
space. The modelling domain was comprised of Nx × Ny × Nz = 32 × 32 × 7 = 7168<br />
rectangular prisms, with dx = dy = 1 km. The magnetic dipole was situated in the<br />
centre of the upper face of the central cell. For each of the prisms we computed<br />
55
Chapter 4. 3D MT <strong>Inversion</strong><br />
an average of the electric field E and compared it with the analytical solution of<br />
equation 4.26. This comparison for the y-component of the electric field, 〈Ey〉 =<br />
{ <br />
Eydv}/Vαβγ, is presented in Figure 4.1. In order to calculate analytically the<br />
Vαβγ<br />
average 〈Ey〉 for the most complicated central prism, where the dipole is seated, we<br />
make use of the fact that this prism is located at the near zone, |κr|
Chapter 4. 3D MT <strong>Inversion</strong><br />
0-100 m 100-300 m 300-700 m 0.7-1.4 km 1.4-2.7 km 2.7-4.5 km 4.5-7 km<br />
0-100 m 100-300 m 300-700 m 0.7-1.4 km 1.4-2.7 km 2.7-4.5 km 4.5-7 km<br />
Figure 4.2.: Comparisons of 〈Ex〉 for a uniform space excited by an electric dipole.<br />
Each row presents 7 horizontal (x − y) slices starting from the top (left)<br />
to the bottom (right). The 1st row corresponds to 〈Ex〉 obtained using<br />
x3d, the 2nd - to 〈Ex〉 obtained from equations 4.29a, 4.30 and 4.31.<br />
The 3rd row shows the relative error between averaged 〈Ex〉 obtained<br />
by x3d and those obtained from equations 4.29a, 4.30 and 4.31.<br />
As mentioned above we need the average values of electric fields over the prisms.<br />
To approximate these averages over the central cell (the cell where the electric dipole<br />
is situated) for the x-component of electric field we use the following formula:<br />
〈Ex〉 αtrβtr0 =<br />
<br />
Vα tr β tr 0<br />
Exdv<br />
Vαtrβtr0<br />
≈ − Mx 1<br />
. (4.30)<br />
4σdxdy 2 dz0 + d2 This formula is obtained by integrating equation 4.29a over the prism and assuming<br />
the near zone, |κr|
Chapter 4. 3D MT <strong>Inversion</strong><br />
from x3d and obtained from the analytical approximations 4.30 and 4.31 is presented<br />
in Figure 4.2. We also performed the comparison for all other components of the<br />
electric field and obtained good agreement.<br />
Our conclusion from the above experiments is that we can use the x3d code for<br />
the calculation of the derivatives 4.25.<br />
4.1.2. Regularization technique<br />
As previously mentioned in Section 2.3, in order to alleviate the ill-posedness of the<br />
inverse problem we use a regularization function of the form 2.39. In our imple-<br />
mentation the matrix W represents a finite-difference approximation to the Laplace<br />
operator. Therefore, the regularization function ϕs has the following form:<br />
ϕs = dxdy <br />
αβγ<br />
[∆σ(x, y, z)] 2<br />
αβγ dzγ = dxdy <br />
2 ∂ σ<br />
∂x2 + ∂2σ ∂y2 + ∂2σ ∂z2 2 dzγ (4.32)<br />
αβγ<br />
where dx, dy and dzγ are the sizes of the cells in x, y and z directions, respectively.<br />
Note that dx and dy are constant throughout the numerical grid, although dx can<br />
be different from dy. At the same time, dzγ can change with depth, the index γ<br />
corresponds to the number of the γ-th layer. These requirements on the cell sizes<br />
are imposed by the x3d code.<br />
In equation 4.32 the second derivative operator is approximated as follows:<br />
2 ∂ σ<br />
∂x2 2 ∂ σ<br />
∂y2 2 ∂ σ<br />
∂z 2<br />
αβγ<br />
αβγ<br />
αβγ<br />
αβγ<br />
≈ A 1 ασα−1βγ + A 2 ασαβγ + A 3 ασα+1βγ + A 4 ασ b γ , (4.33)<br />
≈ B 1 βσαβ−1γ + B 2 βσαβγ + B 3 βσαβ+1γ + B 4 βσ b γ , (4.34)<br />
≈ C 1 γσαβγ−1 + C 2 γσαβγ + C 3 γσαβγ+1 + C 4 γσ b Nz+1 . (4.35)<br />
In equations 4.33-4.35, α = 1, ..., Nx, β = 1, ..., Ny, γ = 1, ..., Nz and σ b γ is the con-<br />
ductivity of the background medium. Whether σ b γ appears in the stabilizer ϕs de-<br />
pends on the boundary conditions. We implemented two different types of boundary<br />
conditions that we will describe below. We also set σ0βγ = σα0γ = σαβ0 = σNx+1βγ =<br />
σαNy+1γ = σαβNz+1 = 0.<br />
When we use the Neumann boundary conditions, ∂σ/∂ν| ∂V = 0, where ν is the<br />
normal to the boundary ∂V , the coefficients Aα, Bβ and Cγ have the following form:<br />
58
Chapter 4. 3D MT <strong>Inversion</strong><br />
A 1 α =<br />
A 2 α =<br />
A 3 α =<br />
A 4 α =<br />
⎧<br />
⎪⎨<br />
⎪⎩<br />
⎧<br />
⎪⎨<br />
⎪⎩<br />
⎧<br />
⎪⎨<br />
⎪⎩<br />
⎧<br />
⎪⎨<br />
⎪⎩<br />
dx −2 ,<br />
0,<br />
dx −2 ,<br />
−2dx −2 ,<br />
0,<br />
0,<br />
dx −2 ,<br />
dx −2 ,<br />
0,<br />
0,<br />
−dx −2 ,<br />
−dx −2 ,<br />
α = 1, Nx<br />
α = 1<br />
α = Nx<br />
α = 1, Nx<br />
α = 1<br />
α = Nx<br />
α = 1, Nx<br />
α = 1<br />
α = Nx<br />
α = 1, Nx<br />
α = 1<br />
α = Nx<br />
,<br />
,<br />
,<br />
.<br />
(4.36)<br />
The coefficients Bβ are derived in the same manner as the Aα, one just has to<br />
substitute α to β, dx to dy and Nx to Ny in equation 4.36. Finally,<br />
C 1 γ =<br />
C 2 γ =<br />
C 3 γ =<br />
C 4 γ =<br />
⎧<br />
⎪⎨<br />
⎪⎩<br />
⎧<br />
⎪⎨<br />
⎪⎩<br />
⎧<br />
⎪⎨<br />
2<br />
h (1)<br />
γ (dzγ+dzγ−1) ,<br />
0,<br />
⎪⎩<br />
0,<br />
⎧<br />
⎪⎨<br />
0,<br />
0,<br />
⎪⎩<br />
2<br />
h (3)<br />
γ (dzγ+dzγ−1) ,<br />
−8<br />
(dzγ+1+dzγ)(dzγ+dzγ−1) ,<br />
−2<br />
h (2)<br />
γ (dzγ+1+dzγ) ,<br />
0,<br />
2<br />
h (1)<br />
γ (dzγ+1+dzγ) ,<br />
2<br />
h (2)<br />
γ (dzγ+1+dzγ) ,<br />
−2<br />
h (3)<br />
γ (dzγ+dzγ−1) ,<br />
59<br />
γ = 1, Nz<br />
γ = 1<br />
γ = Nz<br />
γ = 1, Nz<br />
γ = 1<br />
γ = Nz<br />
γ = 1, Nz<br />
γ = 1<br />
γ = Nz<br />
γ = 1, Nz<br />
γ = 1<br />
γ = Nz,<br />
,<br />
,<br />
,<br />
.<br />
(4.37)
where<br />
Chapter 4. 3D MT <strong>Inversion</strong><br />
h (1)<br />
γ = 1<br />
4 (dzγ−1 + 2dzγ + dzγ+1) ,<br />
h (2)<br />
γ = 1<br />
4 (dzγ−1 + 2dzγ + dzγ+1) ,<br />
h (3)<br />
γ = 1<br />
4 (dzγ−1 + 2dzγ + dzγ+1) .<br />
(4.38)<br />
In this case the regularization given by equation 4.32 has a strong effect and depends<br />
strongly on the background conductivity σ b γ. We will call this strong regularization.<br />
This type of regularization should be used only when we have a very good idea about<br />
the conductivity of the 1D background model. As an example, strong regularization<br />
was used for a simple two-layered model considered in Section 4.2.1.<br />
Another type of the boundary conditions we used in our research is those following<br />
from the continuity of the gradient at the boundary of the inversion domain, i.e.<br />
<br />
∂σ <br />
<br />
∂ν<br />
∂V −<br />
= ∂σ<br />
<br />
<br />
<br />
∂ν<br />
∂V +<br />
In this case the background conductivity, σ b γ, is not included in the stabilizer ϕs at<br />
all, and hence, the coefficients A 4 α = B 4 β = C4 γ = 0, for all α, β and γ. All other<br />
coefficients Aα are<br />
A 1 α =<br />
A 2 α =<br />
A 3 α =<br />
<br />
<br />
<br />
dx −2 ,<br />
0,<br />
−2dx −2 ,<br />
0,<br />
dx −2 ,<br />
0,<br />
.<br />
α ∈ [2, Nx − 1]<br />
else<br />
α ∈ [2, Nx − 1]<br />
else<br />
α ∈ [2, Nx − 1]<br />
else<br />
,<br />
,<br />
.<br />
(4.39)<br />
The coefficients Bβ are derived in the same manner as the Aα. The coefficients Cγ<br />
60
have the following form<br />
C 1 γ =<br />
C 2 γ =<br />
C 3 γ =<br />
Chapter 4. 3D MT <strong>Inversion</strong><br />
<br />
<br />
<br />
2<br />
h (1)<br />
γ (dzγ+dzγ−1) ,<br />
0,<br />
−8<br />
(dzγ+1+dzγ)(dzγ+dzγ−1) ,<br />
0,<br />
2<br />
h (1)<br />
γ (dzγ+1+dzγ) ,<br />
0,<br />
γ = 1, Nz<br />
else<br />
γ = 1, Nz<br />
else<br />
γ = 1, Nz,<br />
else<br />
,<br />
,<br />
.<br />
(4.40)<br />
It is this type of regularization we call weak and we use in most of our numerical<br />
experiments (see Section 4.2).<br />
4.1.2.1. Choice of parameter λ<br />
As mentioned in the previous chapter, when a stabilizer ϕs is used in the inversion,<br />
we encounter the additional problem of finding the optimum regularization param-<br />
eter λ. In Section 3.1.2 we proposed an approach for finding the regularization<br />
parameter λ for the 1D MT inversion case. There we solve several inverse problems<br />
with a fixed value of λ, starting from the same initial guess model, in order to find<br />
the optimum regularization parameter.<br />
For the 3D case, the inversion can take several days to compute and this pro-<br />
cedure becomes too time consuming. Therefore, for the 3D case, we choose the<br />
regularization parameter λ in a manner similar to the idea of Haber et al. (2000).<br />
A relatively large value of λ is initially assigned, and then gradually reduced. Then<br />
each new problem is solved using the solution of the previous problem (i.e. the<br />
model obtained using the previous value of λ) as an initial guess. How to choose the<br />
initial value for the regularization parameter λ and how fast it should be reduced<br />
at this moment purely depends on the experience of the user, and some automatic<br />
schemes still have to be developed.<br />
4.2. Model study<br />
To investigate the robustness and effectiveness of the inversion solution developed<br />
we performed a number of numerical experiments. These are described below.<br />
61
Chapter 4. 3D MT <strong>Inversion</strong><br />
For all of these experiments, we calculate the 2 × 2 matrices Dij of “observed”<br />
impedances using the x3d code and added random noise to these data. The relative<br />
errors εij of the impedance (see equation 4.3) were taken as 0.05. This value of εij<br />
means that the misfit ϕd defined in equation 4.2 drops to 1, when the<br />
⎛<br />
rms = ⎝ 1<br />
NSNT<br />
NS NT <br />
i=1<br />
<br />
tr (Z − D)<br />
j=1<br />
T<br />
<br />
ij (Z − D)ij<br />
<br />
tr D T<br />
⎞<br />
⎠<br />
ijDij<br />
1<br />
2<br />
(4.41)<br />
drops to 5%. We think that using the same forward code for the predicted and<br />
to generate the “observed” data is sufficient for testing the inversion, because the<br />
forward modelling code x3d has been tested against many other forward modell-<br />
ing codes (see, for example, MT3DINV 1 webpage) and the difference between the<br />
responses from different codes is less than the noise we add to the data.<br />
4.2.1. Two-layered half-space<br />
We first consider a simple two-layered model. This model consists of a 10 Ωm, 10 km-<br />
thick layer on top of a 100 Ωm uniform half-space. Our modelling domain, presented<br />
in Figure 4.3, comprises of Nx × Ny × Nz = 19 × 19 × 7 = 2, 527 rectangular prisms,<br />
with dx = dy = 950 m and dz grows with depth (see Table 4.1). Our inversion<br />
domain coincides with the modelling domain. Thus N = 2, 527 conductivities σk<br />
(k = 1, ..., N) of the prisms need to be recovered. Below are the results of the<br />
inversion, obtained while inverting the data from just a single MT site and from 4<br />
MT sites.<br />
γ dzγ [m] zγ [m]<br />
1 1000 0<br />
2 1500 1000<br />
3 2000 2500<br />
4 2500 4500<br />
5 3000 7000<br />
6 3000 10000<br />
7 3000 13000<br />
Table 4.1.: Thicknesses and depths of the layers. γ corresponds to the number of<br />
the layer<br />
1 MT 3D <strong>Inversion</strong> Workshop, <strong>DIAS</strong>, March, 2008,<br />
http://www.dias.ie/lang/en/cosmic/geo/mt workshop2008.html<br />
62
Chapter 4. 3D MT <strong>Inversion</strong><br />
x-z slice x-y slices<br />
0-10 km 10-16 km<br />
Figure 4.3.: Two-layered conductivity model used for testing the inversion. The left<br />
most panel shows a vertical (x-z) slice through the modelling domain.<br />
The other two panels show the horizontal (x-y) slices for two ranges of<br />
depths, 0-10 km and 10-16 km.<br />
Single MT site<br />
For a period of 100 s (NT = 1) and for one MT site (NS = 1), located on the surface<br />
(z = 0), at the centre of the numerical grid (αs = βs = 10), all 4 complex-valued<br />
elements of MT impedance tensor, Dij (see page 49), were calculated. We added<br />
1% noise to these “observed” data, this means that Dij = Dij(1 + ξij), where ξij<br />
are random numbers between −0.01 and 0.01. The initial guess model, described<br />
in equation 4.6, was a model with the conductivities σ (0)<br />
k = 50 Ωm for all the cells<br />
of the inversion domain. Its background coincided with the background of the true<br />
model. The values of the conductivities of the background model do not change<br />
during the inversion, only conductivity values of the cells inside inversion domain<br />
are sought. For this experiment we used the strong regularization (see page 60)<br />
and the regularization parameter λ was kept unchanged and equal to 10 6 . In fact,<br />
this high value of λ means that the process of inversion is mostly governed by the<br />
stabilizer ϕs, rather than ϕd. Indeed ϕd/λϕs ≈ 3%, and hence, practically ϕ ≈ ϕs.<br />
The inversion was stopped at nfg = 289 since it could not generate any significant<br />
improvements. The objective functional at this iteration was ϕ = 113.5 and the<br />
data misfit ϕd = 2.9. This value of the data misfit corresponds to an rms of 8.5%<br />
(see equation 4.41). Let us recall here that the index nfg increases by one after each<br />
63
Chapter 4. 3D MT <strong>Inversion</strong><br />
nfg = 1 nfg = 6 nfg = 30<br />
nfg = 84 nfg = 289 true model<br />
Figure 4.4.: The process of the inversion. The panels present vertical (x-z) crosssections<br />
through the middle (y = 0) of the model starting from the<br />
initial guess model. The iteration number is written over the panels.<br />
True model is also presented for comparison.<br />
Figure 4.5.: The convergence curves for data misfit ϕd (blue) and penalty function<br />
ϕ (red). The curves are plotted as a function of nfg.<br />
evaluation of a pair ϕ and g. This index is proportional to the time of the inversion<br />
and a little larger than the number of the QN iterations nit. Note that for the true<br />
model ϕ = 203, whereas the initial guess model gives ϕ = 6342. Figure 4.4 shows<br />
64
Chapter 4. 3D MT <strong>Inversion</strong><br />
a vertical slice through the middle of the models, obtained after various number of<br />
iterations. From the figure we can see how the inversion progresses from iteration to<br />
iteration. We can see that a resistive circular artifact appears around the MT site<br />
in the upper part of the models, when nfg reaches a value between 30 and 84. The<br />
regularization does not help to remove this artifact and it still remains at the end of<br />
the inversion process, when nfg = 289. In contrast, at larger depths the resistivities<br />
of the cells approach the resistivity of the true model. The conclusion from this<br />
example is that the inversion process stagnates after nfg = 289, still not giving the<br />
true image. It is interesting to see what happens if we include more MT sites in the<br />
inversion.<br />
4 MT sites<br />
Let us consider the same two-layered model with the same grid. We chose NS = 4<br />
MT sites on the surface of the earth. The locations of the sites coincides with the<br />
centres of the cells and are shown in Figure 4.6 together with the grid. We again<br />
computed the “observed” MT impedance tensor, Dij, and then added 1% noise to<br />
it. It should be noted that the values for the elements of noiseless Dij are identical<br />
for all 4 MT sites, as it may be expected for a 1D model.<br />
Figure 4.6.: Location of the MT sites.<br />
Figure 4.7 shows the process of the inversion. This process is presented in a simi-<br />
lar manner as before for 1 MT site, but now we only show the inversion domain. We<br />
again used strong regularization and the regularization parameter λ was kept con-<br />
stant and equal to 10 6 for the whole process of the inversion. Comparing Figures 4.4<br />
and 4.7, we can see very similar behaviour of the inversion for the first 30 function<br />
and gradient evaluations. However, now we do not get the resistive artifact at later<br />
65
Chapter 4. 3D MT <strong>Inversion</strong><br />
nfg = 1 nfg = 6 nfg = 30 nfg = 84 nfg = 435 true model<br />
Figure 4.7.: The process of the inversion. The row of panels presents vertical (x-z)<br />
slice through the middle (y = 0) of the model starting from the initial<br />
guess model (left) to the true model (right). The iteration number is<br />
written over the panels. True model is also presented for comparison.<br />
0 − 1 km 1 − 2.5 km 2.5 − 4.5 km 4.5 − 7.0 km 7.0 − 10 km 10 − 13 km<br />
Figure 4.8.: 3D electrical resistivity model for 4 MT sites without regularization.<br />
The row of panels presents 6 horizontal (x-y) slices through the model<br />
starting from the top (left) to the bottom (right). The range of depths<br />
is given right above each panel.<br />
iterations and we obtain a model very similar to the true model, when nfg = 435<br />
and the data misfit ϕd = 0.4, corresponding to an rms of 3%, which is smaller than<br />
was obtained using one MT site.<br />
In contrast, if we do not apply the regularization functional (λ is set to zero), it<br />
is equivalent to the minimization of the data misfit ϕd only. The recovered model<br />
obtained in this case is presented in Figure 4.8. From the figure we can see that the<br />
inversion result has little similarity with the true model. At first, this result might<br />
seem surprising, because we consider a two-layered model as simple, however 3D<br />
inversion does not have any idea about 1D nature of the model and seeks any model<br />
which would explain the data. It happens that the model presented in Figure 4.8 is<br />
simple for the inversion.<br />
Comparing Figures 4.7 and 4.8 one can conclude that the stabilizer ϕs greatly<br />
66
Chapter 4. 3D MT <strong>Inversion</strong><br />
helps to obtain a reasonable image. However, for the sake of objectivity, we should<br />
mention that the good image presented in Figure 4.7 may be just a result of the<br />
strong regularization used. With this strong regularization, the inversion tends to<br />
extend the background conductivity inside inversion domain, as can be seen from<br />
the form of strong regularization, given in Section 4.1.2. When inverting the real<br />
data we usually do not know the conductivity of the background, and hence, we<br />
should not use strong regularization in the inversion. That is why we use weak<br />
regularization for most of the experiments described below.<br />
4.2.2. Buried conductive dyke<br />
100-200 m 200-300 m 300-400 m 400-500 m 500-600 m 600-700 m 700-800 m<br />
Figure 4.9.: 3D electrical resistivity model. The row of panels presents 7 horizontal<br />
(x-y) slices through the model starting from the top (left) to the bottom<br />
(right). The range of depths is given right above each panel.<br />
Figure 4.10.: (x-z) slice through the centre of the 3D resistivity model.<br />
The second example employs a truly 3D model, which is presented in Figures 4.9<br />
and 4.10. One of the reason to consider this model is that it was previously used<br />
to test a 3D MT inversion algorithm in Zhdanov and Tolstaya (2004). This model<br />
67
Chapter 4. 3D MT <strong>Inversion</strong><br />
Figure 4.11.: Numerical mesh and location of the MT sites for the model presented<br />
in Figures 4.9 and 4.10.<br />
consists of a tilted 3 Ωm dyke embedded into a 100 Ωm half-space. The dyke is<br />
located at a depth of 200 m to 700 m and it consists of 5 shifted adjacent blocks of<br />
200 × 800 × 100 m 3 size each. Our modelling domain comprises of Nx × Ny × Nz =<br />
16×24×8 = 3, 072 rectangular prisms of 100×100×100 m 3 size that cover the dyke<br />
and some part of the surroundings. Notice that the modelling volume lies at depths<br />
of 100-900 m and during the forward problem solution x3d embeds this modelling<br />
volume into 100 Ωm background.<br />
The inversion domain coincides with the modelling domain. This means that<br />
N = 3, 072 conductivities σk (k = 1, ..., N) of the prisms need to be recovered. For<br />
this model we calculate 2 × 2 matrices Dij of “observed” impedances at NT = 4<br />
frequencies (fi = 1/Ti, i = 1, ..., NT ) of 1000, 100, 10 and 1 Hz. For real MT<br />
surveys usually more frequencies are used, however our experiments are mainly<br />
for understanding and improving the inversion software and using the realisticly<br />
higher number of frequencies would lead to a very long times for the inversion and<br />
therefore to less experiments. The impedances were computed at NS = 168 sites rj<br />
(j = 1, ..., NS) coinciding with the centres of a homogeneous nx × ny = 12 × 14 grid,<br />
with a 100 m distance between adjacent nodes (see Figure 4.11).<br />
68
Chapter 4. 3D MT <strong>Inversion</strong><br />
With this synthetic example we perform a number of numerical experiments,<br />
which are described below.<br />
4.2.2.1. Regularization by simple bounds<br />
For our first numerical experiment with this model we did not apply the stabilizer<br />
ϕs of equation 2.39, i.e. the regularization parameter λ was assigned a zero value.<br />
Instead, we constrained the conductivity values to lie between lk = 200 Ωm and<br />
uk = 1 Ωm of equation 4.4. Subsequently this turned out to play a similar role to<br />
that of regularization. It should be noted that without putting these constraints on<br />
σk the iteration method without a stabilizer (i.e. when λ = 0) stagnates, when the<br />
data misfit ϕd drops to a value of 0.7 (see Figure 4.12) and it fails to produce a good<br />
conductivity image.<br />
Figure 4.12.: Convergence rates of the inversions without use of a stabilizer ϕs, but<br />
with some limits imposed on the conductivities of the cells. The horizontal<br />
dashed line shows the value of the data misfit for the true model<br />
and for the data with 1% noise added.<br />
The curves in Figure 4.12 are shown as a function of the number nfg of evaluations<br />
of the penalty function of equation 4.1 and its gradient given in equation 2.25. To<br />
obtain these results we have chosen a number ncp = 6 of correction pairs, a 100 Ωm<br />
homogeneous half-space as an initial guess and 1% random noise was added to the<br />
impedance matrix Dij.<br />
The convergence rates for various numbers ncp of correction pairs is presented in<br />
Figure 4.13(a). From this figure it can be seen that for ncp = 6 we get an even<br />
better convergence rate than for ncp = 20. Therefore, for all simulations presented<br />
later in this section we used ncp = 6. Surprisingly, for 2 correction pairs we only<br />
69
Chapter 4. 3D MT <strong>Inversion</strong><br />
get a slightly worse convergence and we manage to obtain a data misfit as small<br />
as ϕd = 0.03. Figure 4.13(b) presents the comparison of the convergence rates of<br />
the various inversions of datasets with different amounts of noise (0%, 1% and 5%)<br />
added. From this figure we can see that even with 5% noise added a reasonable<br />
data misfit is reached. As mentioned above, the noise floor εj is 0.05 for all of our<br />
experiments, and therefore the final misfit levels we try to achieve are different for<br />
different noise levels.<br />
Figure 4.13.: Comparisons of convergence rates of the inversions for different cases:<br />
(a) various numbers of correction pairs: ncp = 2 (dotted line), ncp = 6<br />
(solid line) and ncp = 20 (dashed line). 1% noise was added to the<br />
data; (b) various levels of the data noise: 5% noise (dotted line), 1%<br />
(solid line) and no noise (dashed line). ncp = 6. The horizontal dashed<br />
lines show the level of the data misfit ϕd calculated for the true model<br />
and noisy data (1%, 5%).<br />
It should be noted that it takes 5 minutes for a single penalty function and its<br />
gradient evaluation to be computed on a serial PC. This means that it takes 4 days<br />
to obtain results for the synthetic data with 1% noise added.<br />
4.2.2.2. Acceleration of convergence<br />
The numerical experiment presented in Section 4.2.2.1 was undertaken with some<br />
limits imposed on possible values of the conductivities of the cells. Since these<br />
limits (lk = 200 Ωm and uk = 1 Ωm, k = 1, ..., N) for the conductivities are not<br />
very realistic, we now extend these values to lk = 10000 Ωm and uk = 0.01 Ωm,<br />
but restart the inversion process every nrs-th iteration in order to obtain a better<br />
convergence rate and smaller data misfit. In other words, a model obtained after nrs<br />
70
Chapter 4. 3D MT <strong>Inversion</strong><br />
iterations is taken as a new initial guess model and the inversion process is repeated.<br />
From the point of Newton-type optimization the latter means that after each nrs<br />
iterations QN search direction of equation 2.28 is modified to be a steepest descent<br />
direction, p (k) = −g (k) , k = nrs ∗ i, i = 0, 1, . . ..<br />
Figure 4.14.: Convergence rates of the inversions with the stabilizer and with gradually<br />
diminishing regularization parameter λ (solid line), with restart<br />
every 20-th iteration (dashed line) and without restart and stabilizer,<br />
but with limits on the cells conductivities (dotted line). The curves<br />
present the data misfit versus the number of evaluations of the penalty<br />
functional and its gradient. The dashed horizontal line shows the value<br />
of the data misfit for the true model and data with 1% noise added.<br />
The comparison of convergence rates for restarted and non-restarted inversions<br />
is presented in Figure 4.14. Again, the convergence curves are shown as a function<br />
of nfg. It can be seen that the inversion converges to the solution faster if it is<br />
restarted every 20-th iteration. In addition, only 1 day instead of 4 days of CPU<br />
time is required to reach an acceptable data misfit on a serial PC. One of the possible<br />
explanations of such an improvement is that in order to achieve a good convergence<br />
rate, the limited memory QN approximation of the inverse of the Hessian should<br />
be as close as possible to the true inverse. However, the curvature of the objective<br />
function may change rapidly and gradient information even from the previous ncp<br />
iterations does not improve the inverse of the Hessian approximation at the current<br />
iteration. It therefore can be better to discard this information and restart the<br />
inversion process taking the steepest descent as a search direction. However, this<br />
explanation is very speculative and requires further analysis and investigation.<br />
71
4.2.2.3. Regularization by smoothing<br />
Chapter 4. 3D MT <strong>Inversion</strong><br />
The experiments presented in Sections 4.2.2.1 and 4.2.2.2 were done without the<br />
stabilizer ϕs of equation 2.39 involved, i.e. with λ = 0. In this section we use<br />
the stabilizer ϕs and choose the regularization parameter λ, as explained in Sec-<br />
tion 4.1.2.1. For this experiment we start with λ = 10 6 and then gradually diminish<br />
it to 10 3 . The result of the inversion is presented in Figures 4.15 and 4.16. The<br />
100-200 m 200-300 m 300-400 m 400-500 m 500-600 m 600-700 m 700-800 m<br />
Figure 4.15.: <strong>Inversion</strong> result with 168 MT sites and 4 frequencies. The row of panels<br />
presents 7 horizontal (x-y) slices through the model starting from the<br />
top (left) to the bottom (right). The upper row of panels presents the<br />
initial guess model, the middle row - the image recovered using smoothing<br />
regularization and gradually diminishing regularization parameter<br />
λ, the lower row is for the true model.<br />
comparison with the true model, shown in the same figures, demonstrates good re-<br />
sults when we combine the inversion technique with smoothing regularization and<br />
with gradually diminishing regularization parameter λ. From the figure we can see<br />
that the position, shape and amplitude of the true anomaly is successfully recovered,<br />
although there are few resistive artifacts. This is especially true for the upper part<br />
of the model. As we can expect for MT inversion, the deeper layers are not recovered<br />
as sharp as the upper ones - the bottom part of the recovered model is naturally<br />
72
Chapter 4. 3D MT <strong>Inversion</strong><br />
Figure 4.16.: Comparison for a central (x-z) cross-section. The upper panel presents<br />
the inversion result, whereas the lower panel presents true model. We<br />
used responses at 168 MT sites and 4 frequencies.<br />
Figure 4.17.: Convergence of the data misfit ϕd. 168 MT sites and 4 frequencies<br />
were used.<br />
smeared out, delivering only a hint on the presence of the conductive dyke. The<br />
convergence curve for this inversion is presented in Figure 4.17.<br />
73
Chapter 4. 3D MT <strong>Inversion</strong><br />
100-200 m 200-300 m 300-400 m 400-500 m 500-600 m 600-700 m 700-800 m<br />
Figure 4.18.: Comparison of the inversion results obtained for various regularization<br />
techniques. Each row of panels present seven horizontal (x − y) slices<br />
of the model starting from 150 m (left) to 750 m (right) depth (z).<br />
1-st row corresponds to the true model; 2-nd row - to the result of<br />
the inversion with use of the stabilizer and with gradually diminishing<br />
regularization parameter λ; 3-rd row - to the result of the inversion<br />
with nrs = 20 and without use of the stabilizer, and the last row<br />
corresponds to the result of the inversion without use of the stabilizer,<br />
but with limits imposed on conductivities.<br />
The comparison of the results using this approach (i.e. reducing the regularization<br />
parameter) and those results without the stabilizer is presented in Figure 4.18. In all<br />
cases the inversions were terminated when the data misfit ϕd could not be improved<br />
significantly, and it dropped to 0.027. This value of the data misfit corresponds to<br />
an rms of 0.8% (see equation 4.41), which is just below the actual noise level. We<br />
observe that the inversion using the stabilizer ϕs and with gradually diminishing<br />
regularization parameter λ produces a much better result. The results of the inver-<br />
74
Chapter 4. 3D MT <strong>Inversion</strong><br />
100-200 m 200-300 m 300-400 m 400-500 m 500-600 m 600-700 m 700-800 m<br />
Figure 4.19.: Convergence of the inversion with use of the stabilizer and with gradually<br />
diminishing regularization parameter λ. 1-st row - the initial<br />
guess 100 Ωm model (ϕd = 16.44); 2-nd row - model obtained after<br />
nfg = 34 (ϕd = 1.51); 3-rd row - model after nfg = 40 (ϕd = 0.83);<br />
4-th row - model after nfg = 64 (ϕd = 0.25); 5-th row - after nfg = 147<br />
(ϕd = 0.027), the last row corresponds to the true model (ϕd = 0.013).<br />
sions without the stabilizer produce highly erratic images, especially for the upper<br />
75
Chapter 4. 3D MT <strong>Inversion</strong><br />
slices. We obtained the worst result when the conductivity values were constrained<br />
between 1 Ωm and 200 Ωm (see the last row in Figure 4.18). One of the reasons<br />
for such a poor result is that it is very easy to reach the boundaries in the process<br />
of the inversion and the method tends to stick to these boundaries. In all of the<br />
following experiments we are not using such close limits for the conductivities, but<br />
instead employ the stabilizer ϕs.<br />
Finally, a set of 3D models recovered at various iterations is presented in Fig-<br />
ure 4.19 for the inversion that uses the stabilizer and with the parameter λ gradually<br />
diminishing from 10 6 to 10 3 . From this figure we can see that the inversion quickly<br />
senses the presence of the conductor, although the value of the conductivity and<br />
its shape are defocused. When the number of objective function and its gradient<br />
evaluations increases the inversion focuses more and more and when we reach the<br />
nfg of 147 we get the true shape, resistivity and the location of the conductor at the<br />
upper layer of the model. Still, some resistive halo persists.<br />
4.2.3. Outcropping conductive dyke<br />
0-100 m 100-200 m 200-300 m 300-400 m 400-500 m 500-600 m 600-700 m<br />
Figure 4.20.: 3D electrical resistivity model. The row of panels presents 7 horizontal<br />
(x-y) slices through the model starting from the top (left) to the bottom<br />
(right).<br />
The third model is similar to the previous one, but now the 3D conductive dyke<br />
reaches the surface (see Figures 4.20 and 4.21). This model is more challenging, due<br />
to numerical difficulties that arise from the outcropping of the dyke, and we expect<br />
erratic behaviour of the conductivities in the near surface layers. For the calculation<br />
of the gradients of the data misfit ϕd we have to calculate the adjoint electric field<br />
uj, which is the solution of the system of adjoint Maxwell’s equations 4.18. As it<br />
follows from this equation, the adjoint field uj is some combination of electric fields<br />
of horizontal electric and magnetic dipoles. This combination should be averaged<br />
76
Chapter 4. 3D MT <strong>Inversion</strong><br />
Figure 4.21.: (x-z) slice through the centre of the 3D resistivity model.<br />
over each cell of the inversion domain. The dipoles are positioned in the locations<br />
of the MT sites. For an outcropped dyke, the upper cells of the inversion domain<br />
touch the dipoles, which makes averaging over the cells a difficult problem. Closer<br />
examination of the problem shows that it is rooted in the physics of MT problem,<br />
rather than numerical - the derivatives of the data misfit for the cells touching the<br />
dipoles are significantly greater than for all other cells. This reflects the fact that<br />
the cells are far more sensitive to the MT data.<br />
Returning to the model, the 3 Ωm dyke is located at a depth of 0 m to 500 m and<br />
consists of the same 5 shifted adjacent blocks of 200 × 800 × 100 m 3 size each. The<br />
modelling domain comprises of Nx×Ny×Nz = 35×35×7 = 8, 575 rectangular prisms<br />
of 100×100×100 m 3 size that cover the dyke and some part of the surroundings, and<br />
extends from 0 to 700 m depth. The inversion domain is smaller than the modelling<br />
domain and it comprises of Nx × Ny × Nz = 16 × 24 × 7 = 2, 688 cells that cover<br />
the dyke and some part of the surrounding (see blue box in Figure 4.22).<br />
4.2.3.1. 168 MT sites<br />
For this model we again calculate 2 × 2 matrices Dij of “observed” impedances at<br />
NT = 1 frequency of 10 Hz, and then add 1% noise to this data. The impedances<br />
are computed at NS = 168 sites ri (i = 1, ..., NS) coinciding with the centres of<br />
a homogeneous nx × ny = 12 × 14 grid, with a 100 m distance between adjacent<br />
nodes (see Figure 4.22). Of course it is unrealistic to use a single frequency for the<br />
inversion, however with one frequency it is easier to examine and understand the<br />
behaviour of the inversion algorithm. In this case we start the inversion with<br />
the initial guess model, which has 50 Ωm everywhere inside the inversion domain,<br />
in contrast to 100 Ωm we had for the buried dyke. Figure 4.23 presents the result<br />
of the inversion together with the initial and true models. The vertical cross-section<br />
77
Chapter 4. 3D MT <strong>Inversion</strong><br />
Figure 4.22.: Location of 168 MT sites.<br />
0-100 m 100-200 m 200-300 m 300-400 m 400-500 m 500-600 m 600-700 m<br />
Figure 4.23.: <strong>Inversion</strong> result with 168 MT sites and 10-Hz responses. The row of<br />
panels presents 7 horizontal (x-y) slices through the model starting<br />
from the top (left) to the bottom (right). The upper row of panels<br />
presents the initial guess model, the middle row shows the image recovered,<br />
the lower row is for the true model.<br />
78
Chapter 4. 3D MT <strong>Inversion</strong><br />
Figure 4.24.: Comparison for a central (x-z) cross-section. The upper panel presents<br />
the inversion result, whereas the lower panel presents true model. 10-<br />
Hz responses at 168 MT sites were used.<br />
Figure 4.25.: Convergence of the inversion. 10-Hz responses at 168 MT sites were<br />
used. The inversion was terminated when no significant improvement<br />
could be made and when we reached a misfit ϕd = 0.29 which corresponds<br />
to rms of 2.5%.<br />
79
Chapter 4. 3D MT <strong>Inversion</strong><br />
through the middle of the model is shown in Figure 4.24. Interestingly, only a single<br />
frequency happens to be enough to more or less recover the true position and shape<br />
of the dyke.<br />
The reason for such a good result is obvious - we use a very refined grid of MT<br />
sites. However, it should be mentioned that the value of the dyke’s resistivity is<br />
overestimated by a factor of 1.5-2. We also can see remnants of the initial model at<br />
the edges of the inversion domain and some resistive artifacts, especially at the upper<br />
layer of the model. Figure 4.25 presents the convergence curve for this inversion.<br />
In our next experiment we consider how decreasing of the number of MT sites<br />
deteriorates the result of inversion.<br />
4.2.3.2. 42 MT sites<br />
Figure 4.26.: Location of 42 MT sites.<br />
In this experiment we cover the surface with 42 MT sites, as shown in Figure 4.26.<br />
Again we only invert 10 Hz responses with 1% added noise. The result of the<br />
inversion is shown in Figures 4.27 and 4.28. Similar to Figures 4.23 and 4.24, we get<br />
a blury image of the conductor at the lower part of the model, but now it extends<br />
80
Chapter 4. 3D MT <strong>Inversion</strong><br />
0-100 m 100-200 m 200-300 m 300-400 m 400-500 m 500-600 m 600-700 m<br />
Figure 4.27.: <strong>Inversion</strong> result with 42 MT sites and 10-Hz responses. The row of<br />
panels presents 7 horizontal (x-y) slices through the model starting<br />
from the top (left) to the bottom (right). The upper row of panels<br />
presents the initial guess model, middle row shows the image recovered,<br />
the lower row is for the true model.<br />
Figure 4.28.: Comparison for a central (x-z) cross-section. The upper panel presents<br />
the inversion result, whereas the lower panel presents true model. 10-<br />
Hz responses at 42 MT sites were used.<br />
slightly deeper. We also obtained a lot of strange resistive artifacts, especially in the<br />
very first layer. From the figures we can see that although the shape of the dyke is<br />
81
Chapter 4. 3D MT <strong>Inversion</strong><br />
0-100 m 100-200 m 200-300 m 300-400 m 400-500 m 500-600 m 600-700 m<br />
Figure 4.29.: <strong>Inversion</strong> result for 42 MT sites and 4 frequencies. The row of panels<br />
presents 7 horizontal (x-y) slices through the model starting from the<br />
top (left) to the bottom (right). The upper row of panels presents the<br />
initial guess model, the middle row shows the image recovered, the<br />
lower row is for the true model.<br />
Figure 4.30.: Comparison for a central (x-z) cross-section. The upper panel presents<br />
the inversion result, whereas the lower panel presents the true model.<br />
42 MT sites and 4 frequencies were used.<br />
recovered, the upper part of it is shifted to the right by one cell. The first obvious<br />
explanation is that there are no data that covers the uppermost left margin of the<br />
82
Chapter 4. 3D MT <strong>Inversion</strong><br />
Figure 4.31.: Convergence of the inversion. 42 MT sites and 4 frequencies were<br />
used. The inversion was terminated when ϕd drops to 0.18, which<br />
corresponds to rms of 2%.<br />
dyke.<br />
We analyze whether increasing the number of frequencies helps to obtain a more<br />
accurate image. So we repeat the experiment with data at NT = 4 frequencies of<br />
1000, 100, 10 and 1 Hz and plot the result in Figures 4.29 and 4.30, and convergence<br />
curve in Figure 4.31. Not surprisingly we obtain much better result and this time the<br />
shape, position and even the value of the conductivity of the dyke are accurately<br />
recovered. The bottom of the dyke is now better resolved and we obtain much<br />
less resistive artifacts at the top. One can conclude that an increased number of<br />
frequencies, involved in inversion, helps a lot to improve the inversion result.<br />
So far we dealt with only a relatively simple problem with around 3000 unknown<br />
conductivities. Although the results are promising they only give a first indication<br />
of the reliability and stability of the method. Hence, more complicated situations<br />
are studied below.<br />
4.2.4. Two adjacent blocks<br />
This section is very important for the whole work. Running ahead, let us state that<br />
this model for the first time allowed us to realize a problem that is crucial for reliable<br />
inversion of 3D MT dataset. The below experiments imply that Tikhonov-type<br />
regularization, which we included in our inversion solution, in certain cases is not<br />
powerful enough to suppress the non-smoothness of the resistivity image, especially<br />
for the upper part of the model. In order to construct reliable resistivity images<br />
83
Chapter 4. 3D MT <strong>Inversion</strong><br />
x-z slice x-y slices<br />
0-10 km 10-32 km<br />
Figure 4.32.: The synthetic test model. The left most panel presents a vertical (x-z)<br />
slice through the middle of the model. The other two panels show<br />
horizontal (x-y) slices for two ranges of depths, 0-10 km and 10-32 km.<br />
one has to put more strong constraints on the model parameters, stronger than<br />
those imposed by traditional Tikhonov-type regularization. In Chapter 5 we suggest<br />
different types of the preconditioners in our inversion to overcome this problem.<br />
This more complex model is somewhat famous. It was previously considered<br />
in various 3D forward modelling papers (Wannamaker, 1991; Mackie et al., 1994;<br />
Avdeev et al., 1997, among others). Moreover, the inversion code by Siripunvaraporn<br />
et al. (2005) was also tested using this model. The model consists of resistive and<br />
conductive blocks buried in a two-layered earth. The horizontal and vertical slices<br />
presented in Figure 4.32 completely describe the model.<br />
To select the appropriate frequency range for the inversion, we perform a simple<br />
sensitivity analysis. This analysis involves the comparison of apparent resistivity,<br />
ρ app , and phase, φ, curves calculated for 4 two-layered models, constructed from<br />
the true and initial guess models used in the inversion. Resistivity values of the<br />
10-km upper layer for these 1D models are 1, 10, 50 and 100 Ωm, respectively, while<br />
resistivity of the lower layer is 100 Ωm. The 1D curves are shown in Figure 4.33 as a<br />
function of period. From the figure, we can see that the frequency range from 10 −4<br />
to 10 −1 Hz is appropriate in order to sense the important parts of the true model.<br />
Although we only start to sense the 100 Ωm lower layer for 1 Ωm (red) curve at the<br />
frequency of 10 −4 Hz, this frequency is the realistic lower limit for the long period<br />
MT data. Note that Siripunvaraporn et al. (2005) used higher frequencies of 10 −3 ,<br />
10 −2 , 10 −1 , 1 and 10 Hz.<br />
We perform a set of experiments for the model shown in Figure 4.32. These are<br />
described in the following sections.<br />
84
Chapter 4. 3D MT <strong>Inversion</strong><br />
Figure 4.33.: Apparent resistivity and phase curves for 4 different two-layered models.<br />
These models have the resistivity of 100 Ωm for the lower layer,<br />
while the resistivity values of the 10-km upper layer are 1 (red), 10<br />
(blue), 50 (green) and 100 Ωm (black), respectively.<br />
4.2.4.1. Coarse numerical grid<br />
In this section we use a coarse grid for the horizontal dimensions, we will refine this<br />
grid in the next Section 4.2.4.2.<br />
First we choose an inversion domain of Nx × Ny × Nz = 20 × 20 × 9 = 3, 600<br />
rectangular cells with dx = dy = 4000 m. The inversion domain volume reaches a<br />
depth of 32 km, and the modelling domain coincides with the inversion domain.<br />
400 MT sites.<br />
For our first experiment with this grid we cover the surface (z = 0) of the inversion<br />
domain with 400 MT sites (NS = 400), located at the centres of a homogeneous nx×<br />
ny = 20 × 20 grid, with 4000 m distance between adjacent nodes (see Figure 4.34).<br />
For these MT sites we simulated data at 3 frequencies of 0.01, 0.0033 and 0.001 Hz<br />
(NT = 3). We again added 1% noise to the simulated data. We also used the<br />
stabilizer ϕs and the technique of gradually diminishing regularization parameter<br />
λ (see Section 4.1.2.1) in the inversion. The result of the inversion is shown in<br />
Figures 4.35 and 4.36 together with the true and initial guess models. It should be<br />
noted here that the initial guess model has the conductivity of 50 Ωm in all cells<br />
of the inversion domain, assuming that outside conductivity coincides with the true<br />
background. For this model the true background is just a two-layered structure with<br />
a 10-km thick 10 Ωm layer on the top of the 100 Ωm halfspace.<br />
Comparing the recovered image with the true model, we obtain a satisfactory<br />
result: the shape and position of the blocks are recovered. The value of the resistiv-<br />
85
Chapter 4. 3D MT <strong>Inversion</strong><br />
Figure 4.34.: Location of 400 MT sites.<br />
86
z : 0-1 km 1-2.5 km 2.5-4.5km 4.5-7 km 7-10 km 10-14 km 14-19 km 19-25 km 25-32 km<br />
Chapter 4. 3D MT <strong>Inversion</strong><br />
87<br />
Figure 4.35.: Result of the inversion for 400 MT sites and 3 frequencies. Each row presents nine horizontal (x − y) slices<br />
through the model starting from the top (left) to the bottom (right). 1st row corresponds to the initial guess<br />
model, 2nd to the result of the inversion and 3rd to the true model.
Chapter 4. 3D MT <strong>Inversion</strong><br />
Figure 4.36.: Comparison for a central (x-z) cross-section. The upper panel presents<br />
the inversion result, whereas the lower panel presents true model. 400<br />
MT sites and 3 frequencies were used.<br />
88
Chapter 4. 3D MT <strong>Inversion</strong><br />
ity for the conductive block is retrieved correctly, although it is overestimated for<br />
the resistive block. As usual for MT inversion, the position of the bottom of the<br />
conductive block is somewhat obscured.<br />
Figure 4.37.: Convergence of the inversion. 400 MT sites and 3 frequencies were<br />
used. The inversion was terminated when ϕd drops to 9.7.<br />
We stopped the inversion process when the value of the data misfit ϕd could not<br />
be improved anymore and it dropped to 9.7. The whole convergence curve is shown<br />
in Figure 4.37. A single calculation of the penalty function together with its gradient<br />
for this experiment takes about 7 minutes on a serial PC, resulting in a total time<br />
of ≈ 50 hours.<br />
80 MT sites.<br />
We now diminish the number of MT sites used for the inversion to 80. These sites<br />
are randomly placed, however, we prevent two sites from being placed in directly<br />
adjacent cells. The locations of these MT sites are shown in Figure 4.38. Everything<br />
else was kept as in the previous experiment, we only changed the number of MT<br />
sites.<br />
Figures 4.39 and 4.40 present the result of the inversion together with the true<br />
and initial guess models. We observe that the recovered image is very different<br />
from the true model. It has a very erratic behaviour, especially for the upper part<br />
of the model, with a lot of artificial structure. This result cannot be considered<br />
satisfactory. It is interesting that if we plot the locations of the MT sites on top of<br />
the recovered image (see Figure 4.41) we see that reasonable resistivity values occur<br />
exactly for those cells that contain MT sites. For these selected cells it is obviously<br />
possible to retrieve the underground structure, at the same time it is absolutely<br />
impossible to utilize the resistivity of the other cells.<br />
89
Chapter 4. 3D MT <strong>Inversion</strong><br />
Figure 4.38.: Location of 80 MT sites.<br />
90
z : 0-1 km 1-2.5 km 2.5-4.5km 4.5-7 km 7-10 km 10-14 km 14-19 km 19-25 km 25-32 km<br />
Chapter 4. 3D MT <strong>Inversion</strong><br />
91<br />
Figure 4.39.: Result of the inversion. Each row presents nine horizontal (x−y) slices through the model starting from the top<br />
(left) to the bottom (right). 1st row corresponds to the initial guess model, 2nd to the result of the inversion<br />
and 3rd - the true model. 80 MT sites and 3 frequencies were used.
Chapter 4. 3D MT <strong>Inversion</strong><br />
Figure 4.40.: Comparison for a central (x-z) cross-section. The upper panel presents<br />
the inversion result, whereas the lower panel presents true model. 80<br />
MT sites and 3 frequencies were used.<br />
92
Chapter 4. 3D MT <strong>Inversion</strong><br />
Figure 4.41.: The location of 80 MT sites plotted on top of the upper layer of the<br />
recovered image.<br />
93
Chapter 4. 3D MT <strong>Inversion</strong><br />
To better understand how our inversion works, we refine the grid, hoping that the<br />
above result is just a consequence of a too coarse grid used for forward modelling.<br />
4.2.4.2. Refined numerical grid<br />
We chose our inversion domain to be Nx × Ny × Nz = 40 × 40 × 5 = 8000 with<br />
dx = dy = 2000 m, compared with dx = dy = 4000 m in the previous section.<br />
Again the modelling domain coincides with the inversion domain. In order to save<br />
computational time we invert only for the first 5 layers up to 10 km depth.<br />
1444 MT sites.<br />
Figure 4.42.: Location of 1444 MT sites.<br />
For the first experiment with this refined grid we cover the surface of the inversion<br />
domain with 1444 MT sites (NS = 1444). The exact locations of the sites are shown<br />
in Figure 4.42. For these MT sites we simulated data at 3 frequencies of 0.033, 0.01<br />
and 0.0033 Hz (NT = 3), slightly higher than in the previous setup. We again add<br />
1% noise to the simulated data. For the initial guess model we assign a resistivity<br />
value of 50 Ωm to all the cells of the inversion domain. The inverted model is shown<br />
94
Chapter 4. 3D MT <strong>Inversion</strong><br />
z : 0-1 km 1-2.5 km 2.5-4.5km 4.5-7 km 7-10 km<br />
Figure 4.43.: 3D electrical resistivity models. Each row presents five horizontal (x −<br />
y) slices through the model starting from the top (left) to the bottom<br />
(right). 1st row corresponds to the initial guess model, the 2nd row<br />
- to the result of the inversion and the 3rd - to the true model. 1444<br />
MT sites and 3 frequencies were used for the inversion.<br />
Figure 4.44.: Comparison for a central (x-z) cross-section. The upper panel presents<br />
the inversion result, whereas the lower panel presents the true model.<br />
1444 MT sites and 3 frequencies were used.<br />
on Figure 4.43 and 4.44 along with the true and initial guess models.<br />
As in Section 4.2.4.1 for the coarse grid with a dense site coverage, we obtain a<br />
very satisfactory result. From the figures, we can see that the position and the true<br />
95
Chapter 4. 3D MT <strong>Inversion</strong><br />
resistivity of the anomalies are retrieved correctly. Although the boundaries of the<br />
anomalies are not so sharp, they are much sharper than for the coarse grid and these<br />
smooth transitions are the normal effect of the regularization. The background re-<br />
sistivity of 10 Ωm is not well resolved at depth, if compared with the result obtained<br />
on the coarse grid. This can be explained by the fact that for this inversion we used<br />
higher frequencies.<br />
Figure 4.45.: Convergence of the inversion. The inversion was terminated when we<br />
reached a data misfit ϕd = 47. 1444 MT sites and 3 frequencies were<br />
used.<br />
The inversion process was stopped when ϕd dropped to 47. The full convergence<br />
curve is shown in Figure 4.45. For the grid used in this experiment a single calcu-<br />
lation of the penalty function together with its gradient takes about 6 minutes on a<br />
serial PC. Even though we used finer grid, the smaller number of layers in z-direction<br />
reduced the computational time (we needed 7 minutes for a single calculation of the<br />
penalty function together with its gradient for the coarse grid).<br />
It is also interesting to compare the results obtained for various numbers and val-<br />
ues of frequencies involved in the inversion. In Figures 4.46 and 4.47 we compare the<br />
recovered images when 1, 2 or 3 frequencies are used in the inversion. When we use<br />
just one period of 100 s we can resolve surprisingly well the resistivity, position and<br />
shape of the conductive anomaly. This anomaly extends all the way to the bottom<br />
of the inversion domain, as it does for the true model. The shape and position of the<br />
resistor are also retrieved, however its resistivity is overestimated. The background<br />
resistivity cannot be resolved for this single frequency. If we use period of 300 s<br />
instead of 100 s we again can retrieve the conductor quite well, however the resistive<br />
anomaly and the 10 Ωm background are full of strange artifacts. To use 2 or 3 fre-<br />
96
Chapter 4. 3D MT <strong>Inversion</strong><br />
z : 0-1 km 1-2.5 km 2.5-4.5km 4.5-7 km 7-10km<br />
Figure 4.46.: Comparison of the results of inversions with different number of frequencies.<br />
Each row presents five horizontal (x − y) slices through the<br />
model starting from the top (left) to the bottom (right). The 1st row<br />
corresponds to the inversion result obtained using only 1 frequency of<br />
0.01 Hz, a data misfit of ϕd = 75 was reached in this case, the 2nd<br />
row presents the result for a frequency of 0.0033 Hz and we obtained<br />
ϕd = 33, the 3rd row shows the result when 2 frequencies of 0.01 and<br />
0.033 Hz were used, there ϕd = 53, in the 4th row - we used 3 frequencies<br />
of 0.0033, 0.01 and 0.033 Hz and the data misfit dropped to<br />
ϕd = 47. Finally, the 5th row displays the true model. We used 1444<br />
MT sites for these results.<br />
quencies helps to resolve the background resistivity, especially for the 3 upper layers.<br />
The conductor is reasonably well resolved for both of these cases and we can better<br />
see the resistor if 3 frequencies are used. The main conclusion from the comparison<br />
97
Chapter 4. 3D MT <strong>Inversion</strong><br />
Figure 4.47.: Comparison for a central (x-z) cross-section. The four upper panels<br />
present the inversion results for the various numbers of frequencies used<br />
in the inversion, whereas the lower panel corresponds to the true model.<br />
Please see the caption for the Figure 4.46 for the used frequencies and<br />
the obtained values of the data misfits ϕd. 1444 MT sites were used.<br />
is that the increased number of frequencies again, as in Subsection 4.2.3.2, helps to<br />
improve quality of the inversion.<br />
Let us see how the problem found with the coarse grid and few sites manifests<br />
itself for the case of the refined grid. For this analysis we diminish the number of<br />
MT sites used in the inversion from 1444 to 500.<br />
500 MT sites.<br />
We randomly choose the locations of the MT sites, these are shown in Figure 4.48<br />
together with the modelling cells. Due to the random distribution it happened that<br />
there are regions where MT sites grouped closely together and regions with hardly<br />
any sites. This observation is important for understanding the inversion results and<br />
is a typical situation in a real field survey. The grid was kept as in the previous<br />
98
Chapter 4. 3D MT <strong>Inversion</strong><br />
Figure 4.48.: Location of 500 MT sites.<br />
99
Chapter 4. 3D MT <strong>Inversion</strong><br />
z : 0-1 km 1-2.5 km 2.5-4.5km 4.5-7 km 7-10 km<br />
Figure 4.49.: Result of the inversion. Each row presents five horizontal (x − y) slices<br />
through the model starting from the top (left) to the bottom (right).<br />
1st row corresponds to the initial guess model, 2nd to the result of the<br />
inversion and 3rd - the true model. 500 MT sites and 4 frequencies of<br />
0.033, 0.01, 0.0033 and 0.001 Hz were used.<br />
100
Chapter 4. 3D MT <strong>Inversion</strong><br />
Figure 4.50.: Comparison for (x-z) cross-sections. The recovered resistivity image<br />
is presented for north (upper panel), central (2nd panel), south (3rd<br />
panel) profiles. The lowermost presents the true image. 500 MT sites<br />
and 4 frequencies were used.<br />
101
experiment with 1444 MT sites.<br />
Chapter 4. 3D MT <strong>Inversion</strong><br />
For the inversion we used data calculated at 4 frequencies of 0.033, 0.01, 0.0033<br />
and 0.001 Hz (NT = 4). Figures 4.49 and 4.50 present the result of the inversion<br />
together with the true and initial guess models. From these figures we can see that<br />
the recovered image is different from the true model, except at the volumes located<br />
under regions with densely located sites. In sparsely covered regions the resistivity<br />
shows the erratic behaviour we already observed in some of the previous examples.<br />
Again the upper part of the model is particularly affected.<br />
We plot the recovered image for the surface layer together with the locations of<br />
the MT sites in Figure 4.51. From this figure we can see that reasonable resistivity<br />
values are recovered exactly under the cells beneath the MT sites. For these selected<br />
cells it is possible to see the underground structure, at the same time it is difficult<br />
to reconstruct the resistivity elsewhere.<br />
We present some thoughts and ideas about possible reasons for this phenomena<br />
in the next chapter.<br />
102
Chapter 4. 3D MT <strong>Inversion</strong><br />
Figure 4.51.: The location of 500 MT sites plotted on top of the upper layer of the<br />
recovered image.<br />
103
Chapter 5.<br />
Additional regularization<br />
In this chapter we will investigate why our current solution for the 3D MT inverse<br />
problem sometimes cannot resolve the resistivity immediately beneath the surface,<br />
in regions that are not covered by MT sites. With this aim in mind, we write down<br />
an explicit formula for the first model update:<br />
σ (1)<br />
k<br />
= σ(0)<br />
k<br />
(1 + αp(0)<br />
k ). (5.1)<br />
This expression straightforwardly follows from equation 2.27, if one recalls that<br />
m (1)<br />
k<br />
= σ(1)<br />
k /σ(0)<br />
k<br />
, (k = 1, . . . , N) (see equation 4.5). Here σ(0)<br />
k is the conductivity of<br />
the k-th cell of the initial guess model. Further,<br />
p (0)<br />
k<br />
= − σ(0)<br />
k<br />
∂ϕd<br />
∂σk<br />
+ λ ∂ϕs<br />
<br />
σ=σ<br />
, (5.2)<br />
∂σk<br />
(0)<br />
as follows from equations 2.21, 2.25, 2.28 and 2.31. Substituting equation 5.2 into<br />
equation 5.1, we get<br />
σ (1)<br />
k<br />
= σ(0)<br />
k<br />
This expression for the first update σ (1)<br />
k<br />
<br />
1 − ασ (0)<br />
<br />
∂ϕd<br />
k + λ<br />
∂σk<br />
∂ϕs<br />
<br />
σ=σ<br />
. (5.3)<br />
∂σk<br />
(0)<br />
means that the smoothness of σ(1)<br />
k is directly<br />
related to the smoothness of ∂ϕd/∂σk. Indeed, equation 5.3 can be rewritten as<br />
σ (1)<br />
k<br />
= σ(0)<br />
k<br />
− ασ(0)<br />
k<br />
2 ∂ϕd<br />
, (5.4)<br />
∂σk<br />
since in many cases the initial guess model σ (0) is chosen as a uniform half-space<br />
and consequently ∂ϕs/∂σk| σ=σ (0) = 0.<br />
104
Chapter 5. Additional regularization<br />
As an example of the first update, in Figure 5.1 we show the resistivities ρ (1)<br />
k =<br />
1/σ (1)<br />
k<br />
for the model example with two adjacent blocks described on page 89. In<br />
that example, 80 MT sites were inverted and the inversion domain was discretized<br />
by Nx × Ny × Nz = 20 × 20 × 9 = 3, 600 rectangular cells. Note that these MT sites<br />
covered only 80 surface cells, leaving 320 surface cells uncovered.<br />
Figure 5.1.: Resistivity of the uppermost layer after the first iteration when starting<br />
from a homogeneous half-space. The resistivity values are proportional<br />
to the elements of the gradient. The locations of 80 MT sites are shown<br />
as black dots.<br />
We can clearly see that the values of σ (1)<br />
k are dramatically higher for the 80 cells<br />
covered with sites and nearly vanish for the other 320 cells. In other words, the<br />
first update σ (1) looks very rough. Moreover, the smoothness of this image cannot<br />
be improved by Tikhonov-type regularization at all. This conclusion follows from<br />
equation 5.4, since the right hand side of the equation does not depend on ϕs. The<br />
105
Chapter 5. Additional regularization<br />
regularization may help only with improving this erratic image σ (1) in the course<br />
of consequent iterations σ (n) . Our experience, and the examples considered in this<br />
work, demonstrate that this type of regularization does not always help, but its<br />
effectiveness depends on many factors.<br />
Summing up, the singularity of the gradient ∂ϕd/∂σk in the vicinity of the MT<br />
sites introduces erratic structures to the model and this behaviour complicates the<br />
solution of the 3D MT inverse problem. This is particularly true with Newton-<br />
type optimization approaches that rely heavily on the gradients. It is surprising<br />
that, although the problem outlined above reflects the physics of the 3D MT inverse<br />
problem, it is not very well reported in literature, but only hinted at. A general<br />
solution is to put more constraints on the model conductivity values directly, rather<br />
than impose them through the Tikhonov-type stabilizer ϕs. As an example of such<br />
an approach, the paper by Siripunvaraporn et al. (2005) proposes to put additional<br />
constraints on the resistivity of the cells using the so-called model covariance ma-<br />
trix. This operation can be alternatively viewed as a change of unknowns. Gregory<br />
Newman, in private communication, has proposed to adjust the gradient using a<br />
Hessian matrix.<br />
These two approaches may help us to eliminate the erratic behaviour at the upper<br />
part of the model sometimes observed for our currently implemented inverse problem<br />
solution. In the following two sections we are trying to solve the problem using these<br />
two ideas.<br />
5.1. Preconditioning by a model covariance matrix<br />
We will now use g (n) = Mg (n) instead of our old gradient g (n) , where M is the<br />
so-called model covariance matrix. This means that the new BFGS update formula<br />
will get the following form<br />
and<br />
G (n)<br />
=<br />
<br />
I − y(n−1) s (n−1)T<br />
y (n−1) T T s (n−1)<br />
G (n−1)<br />
<br />
I − y(n−1) s (n−1)T<br />
y (n−1) <br />
+<br />
T s (n−1)<br />
s(n−1) s (n−1)T<br />
y (n−1) T s (n−1)<br />
G (0)<br />
106<br />
(5.5)<br />
= I, (5.6)
Chapter 5. Additional regularization<br />
where y (n−1) = My (n−1) . From equation 5.5 one can easily derive that the new<br />
matrix G (n)<br />
satisfies a new secant equation<br />
From equations 2.34 and 5.7 it follows that<br />
G (n)<br />
y (n−1) = s (n−1) . (5.7)<br />
G (n)<br />
= G (n) M −1<br />
(5.8)<br />
This means that all the search directions remain exactly the same, except the very<br />
first one, in other words<br />
p (n) =<br />
<br />
p (n) , n > 0,<br />
Mp (n) , n = 0.<br />
(5.9)<br />
From equation 5.9 we get that the matrix M has to be positive definite in order<br />
to obtain always a descent search direction p (n) . A similar argumentation can be<br />
applied to the L-BFGS update formula 2.37.<br />
This means that our optimization method should still work if we multiply the<br />
gradient g (n) by any positive definite matrix M.<br />
Now we are ready to move on to the solution of the problem. We apply the<br />
following Gaussian filter to the gradient g (n) ,<br />
where<br />
⎧<br />
⎪⎨<br />
fi,k =<br />
⎪⎩<br />
g (n)<br />
k =<br />
NxNyNz <br />
i=1<br />
−<br />
e<br />
1 ⎡<br />
x<br />
c<br />
⎣ i<br />
−x<br />
2<br />
c 2 <br />
k<br />
y<br />
c<br />
+ i<br />
−y<br />
axdx<br />
c ⎤<br />
2<br />
k ⎦<br />
aydy<br />
NxNyNz −<br />
<br />
e<br />
l=1<br />
1 ⎡<br />
xc−x ⎣ l<br />
2<br />
c 2 <br />
yc−y k + l<br />
axdx<br />
c ⎤<br />
2<br />
k ⎦<br />
aydy<br />
fi,k · g (n)<br />
i , (5.10)<br />
, i ∈ [NxNy(γ − 1) + 1, NxNyγ]<br />
0, else.<br />
(5.11)<br />
This filtering could be alternatively viewed as applying our optimization method<br />
to minimize the old objective functional ϕ, but in a new model space of the new<br />
model parameters<br />
σk =<br />
NxNyNz <br />
i=1<br />
107<br />
fi,k · σi. (5.12)
Chapter 5. Additional regularization<br />
In equation 5.11 γ corresponds to the number of the layer, where the cell with<br />
conductivity σk is located.<br />
Figure 5.2 illustrates the effect of such a filter on the first update model, the first<br />
layer of which is shown in Figure 5.1. The conductivity values of the first update<br />
have the same behaviour as the gradient g (1) . From this figure we can see that the<br />
filter reduces the erratic behaviour for the upper layers and does not significantly<br />
change the already smooth lower layers of the model. We also see that higher values<br />
of the parameters ax and ay produce smoother images.<br />
z : 0-1 km 2.5-4.5km 10-14 km central x-z slice<br />
Figure 5.2.: The effect of the Gaussian filter described in equations 5.10, 5.11. The<br />
first 3 panels of each row show 3 horizontal (x − y) slices through the<br />
model and the last panel shows the central (x−z) cross-section through<br />
the middle of the model. The 1st row corresponds to the unfiltered<br />
model, the 2nd to the model after applying the filter with ax = ay = 0.5<br />
and the last row with ax = ay = 1.<br />
In our implementation k = 1, · · · , NxNyNz and the model covariance matrix<br />
M = {fi,k} is a square matrix. We apply this model covariance matrix M, as a<br />
preconditioner, in order to overcome the problem, stated in the beginning of this<br />
108
Chapter 5. Additional regularization<br />
chapter. Applying such a preconditioner is similar to the idea of Siripunvaraporn<br />
et al. (2005).<br />
We will check now how this idea helps in the example of two adjacent blocks, which<br />
was introduced in section 4.2.4. For the following experiment, we chose to use the two<br />
block model with 80 MT sites described in section 4.2.4.1. As before, the inversion<br />
domain coincides with the modelling domain and comprises of 20 × 20 × 9 = 3, 600<br />
rectangular cells, extending to a depth of 32 km. Again we covered the surface<br />
(z = 0) of the inversion domain with 80 MT sites (NS = 80). The coordinates of<br />
these MT sites are exactly the same as before (see Figure 4.38). For these MT sites<br />
we simulated data at 3 frequencies of 0.01, 0.0033 and 0.001 Hz (NT = 3). We again<br />
added 1% noise to the simulated data.<br />
For these data we compare results from two versions of our inverse problem so-<br />
lution, one without the filter (g (n) used as the gradient), and another one with the<br />
filter (g (n) used as the gradient). Our initial guess conductivity was 50 Ωm for the<br />
whole inversion domain, assuming that the outside conductivity coincides with the<br />
true background for both of these solutions. For this initial model the true back-<br />
ground is just a two-layered structure with a 10-km thick 10 Ωm layer on the top of<br />
the 100 Ωm halfspace.<br />
For the inversion with the filter we now have two extra parameters ax and ay.<br />
Too large values of these filtering parameters deliver an overly smooth resistivity<br />
image, not allowing to get a sufficiently small data misfit ϕd. So in order to reach a<br />
satisfactory value of the data misfit we are using a sequence of decreasing filtering<br />
parameters ax and ay, similarly to the reduction of the regularization parameter<br />
λ. We first choose ax = ay = 3 and then gradually diminish the values of these<br />
parameters. With the first values we run first 10 iterations, then we change them<br />
to ax = ay = 2 for another 20 iterations, then to ax = ay = 1 for additional 20<br />
iterations, and finally run the final 100 iterations without filter at all. We tried<br />
various values of the filtering parameters, but all of these experiments show that the<br />
exact values of ax and ay are not critical for the inversion results.<br />
The comparison of the results of the inversions with and without filtering is shown<br />
in Figures 5.3, 5.4 and 5.5.<br />
From these figures one can obviously see that the results with filtering are much<br />
more similar to the true model. The positions and the resistivity values of the<br />
anomalies are reasonably well matched. The location of the interface between con-<br />
ductor and resistor is found. With depth the image becomes more smooth and the<br />
109
z : 0-1 km 1-2.5 km 2.5-4.5km 4.5-7 km 7-10 km 10-14 km 14-19 km 19-25 km 25-32 km<br />
Chapter 5. Additional regularization<br />
110<br />
Figure 5.3.: Comparison of different inversion results. Each row presents nine horizontal (x − y) slices through the model<br />
starting from the top (left) to the bottom (right). The 1st row corresponds to the initial guess model, the 2nd<br />
to the result of the inversion without filtering, the 3rd to the inversion with additional filtering described in<br />
equations 5.10, 5.11 and the last row is the true model. 80 MT sites and 3 frequencies were used.
Chapter 5. Additional regularization<br />
Figure 5.4.: Comparison for a central (x-z) cross-section. The upper panel presents<br />
cross-section through the inversion result without any filter, the 2nd -<br />
through the result with filtering described in equations 5.10, 5.11, and<br />
the lower panel presents cross-section through the true model. 80 MT<br />
sites and 3 frequencies were used.<br />
111
Chapter 5. Additional regularization<br />
Figure 5.5.: Comparison of the convergence curves. The inversion without the filter<br />
(top) converged to a data misfit ϕd of 11, corresponding to an rms of<br />
16.6% and with the filter (bottom) it drops to 2.5 (rms = 8%). 80 MT<br />
sites and 3 frequencies were used.<br />
112
Chapter 5. Additional regularization<br />
conductor extends slightly deeper, but this can be expected for MT.<br />
5.2. Preconditioning by the Hessian matrix<br />
Another possibility is to smooth the gradient using the inverse of the Hessian matrix.<br />
This idea was proposed to us by Gregory Newman in a personal communication.<br />
Let us introduce the equations we need to implement this idea. As before<br />
g (n) = M (n) g (n) . (5.13)<br />
We use the preconditioner (Newman and Boggs, 2004; Mackie et al., 2007)<br />
M (n) = (diag( H (n)<br />
) + λW T W) −1 , (5.14)<br />
where H (n) and W T W are the Hessian matrices of the data misfit ϕd and stabilizer<br />
ϕs, respectively, and λ as before is the regularization parameter. The tilde sign<br />
stands here for approximation. The matrix W in our implementation represents a<br />
finite-difference approximation to the Laplace operator (see Sections 2.3 and 4.1.2).<br />
The essential difficulty here is the calculation of those diagonal elements<br />
Hkk = ∂2 ϕd<br />
∂mk∂mk<br />
5.2.1. Calculation of second derivatives<br />
As we showed earlier in Section 4.1.1<br />
∂ϕd<br />
∂σk<br />
= ℜ<br />
NS<br />
i=1<br />
j=1<br />
= ∂2ϕd (σ<br />
∂σk∂σk<br />
(0)<br />
k )2 . (5.15)<br />
NT <br />
<br />
βijtr A T<br />
ij<br />
∂ 2 ϕd<br />
∂σk∂σk<br />
∂Zij<br />
∂σk<br />
<br />
, (5.16)<br />
From this equation and neglecting the second-order terms one can get the following<br />
∂ 2 ϕd<br />
∂σk∂σk<br />
= ℜ<br />
Recalling (see 4.12 and 4.15) that<br />
∂Zij<br />
∂σk<br />
NS<br />
NT <br />
βijtr<br />
i=1<br />
j=1<br />
∂Z T<br />
ij<br />
∂σk<br />
∂Zij<br />
∂σk<br />
<br />
, (5.17)<br />
= (pejk(ri) − Zijphjk(ri))H −1<br />
ij , (5.18)<br />
113
we obtain the equations<br />
Chapter 5. Additional regularization<br />
∂Zij<br />
∂σk<br />
∂Z T<br />
ij<br />
∂σk<br />
= p(ejk(ri) − p T Zijphjk(ri))H −1<br />
ij , (5.19a)<br />
= H −T<br />
ij (e T jk(ri)p T − h T<br />
jk(ri)p T Z T<br />
ij). (5.19b)<br />
Very similar to the calculation of the gradient in Section 4.1.1 let us write the<br />
following equations<br />
where<br />
and<br />
∇ × ∇ × ejk − √ −1ωjµσ(r)ejk = √ −1ωjµχkEj, (5.20a)<br />
∇ × ∇ × uij − √ −1ωjµσ(r)uij = √ −1ωjµ(j ext<br />
ij + ∇ × h ext<br />
ij ), (5.20b)<br />
h ext<br />
j ext<br />
ij = p T δ(r − ri), (5.21)<br />
1<br />
ij = −√<br />
−1ωjµ pT Z T<br />
ijpj ext<br />
ij . (5.22)<br />
It is important to note that, in contrast to equation 4.21b, equation 5.20b is now<br />
different for different MT sites (index i). Multiplying equation 5.20a by u T ij and<br />
equation 5.20b by eT jk and integrating the difference of the resulting equations over<br />
the whole 3D space, one gets<br />
However<br />
<br />
R 3<br />
and hence,<br />
<br />
R 3<br />
T<br />
ejkj ext<br />
ij + e T jk∇ × h ext<br />
<br />
T<br />
ij dV = uijEj dV. (5.23)<br />
Vk<br />
e T jk∇ × h ext<br />
<br />
ij dV =<br />
R3 ∇ × e T jkh ext<br />
<br />
ij dV =<br />
R3 √<br />
−1ωjµh T<br />
jkh ext<br />
ij dV, (5.24)<br />
<br />
Vk<br />
From the equations 5.19 and 5.25<br />
<br />
T<br />
uijEj dV =<br />
R3 (e T jk − h T<br />
jkp T Z T<br />
ijp)p T δ(r − ri)dV. (5.25)<br />
∂Zij<br />
∂σk<br />
<br />
=<br />
Vk<br />
T −1<br />
uijEj dV Hij . (5.26)<br />
114
Chapter 5. Additional regularization<br />
Now we are finally ready to write the equation for the second derivatives of the data<br />
misfit ϕd<br />
∂ 2 ϕd<br />
∂σk∂σk<br />
= ℜ<br />
NS<br />
NT <br />
<br />
βijtr H −T<br />
<br />
ij E<br />
Vk<br />
T<br />
<br />
j uij dV<br />
i=1<br />
j=1<br />
<br />
Vk<br />
u T ijEj<br />
<br />
−1<br />
dV Hij <br />
. (5.27)<br />
The formula of equation 5.27 means that the computational load for calculating<br />
the second derivatives is equivalent to the solution of 2 × NT forward problems<br />
using standard Maxwell’s equations to find Ej and of 2 × NT × NS adjoint problems<br />
using equations 5.20b to find uij for all periods j = 1, ..., NT and for all MT sites<br />
i = 1, ..., NS.<br />
In order to reduce the time for caculation of uij, we calculate these fields for the<br />
1D background model. We perform these calculation just once before the inversion.<br />
So instead of the true Hessian matrix, H, we use H with the following diagonal<br />
elements<br />
Hkk = ℜ<br />
NS<br />
NT <br />
<br />
βijtr H −T<br />
<br />
ij E<br />
Vk<br />
T<br />
j u 1D<br />
<br />
ij dV<br />
i=1<br />
j=1<br />
<br />
Vk<br />
<br />
u 1D<br />
ij<br />
T Ej<br />
<br />
dV H −1<br />
<br />
ij<br />
<br />
(σ (0)<br />
k )2 .<br />
(5.28)<br />
We implemented the theory described in this section and then undertook a number<br />
of the synthetic experiments, but so far did not obtain any satisfactory results. It is<br />
difficult immediately see whether it is some numerical problem of our implementation<br />
or some problem with the approach. This investigation is subject of our ongoing<br />
research.<br />
115
Chapter 6.<br />
Conclusions<br />
3D MT inversion is very large in scale and only a few years ago it seemed to be<br />
impossible due to the limited speed and memory of computers. The only way to<br />
interpret 3D MT datasets was to use 3D forward modelling codes in order to fit the<br />
data through trial and error. In the 3D case this procedure is somewhat cumber-<br />
some, tedious, and requires a lot of imagination. That is why 2D approximations<br />
were usually used. Trial and error techniques are sometimes used in 2D, how-<br />
ever there are also a number of preferable 2D inversion schemes available. To use<br />
2D forward modelling and inversion is a very common practice for interpreting 3D<br />
datasets. In some cases this can be done successfully, however in some instances,<br />
especially in areas of very complex 3D geology, it can lead to wrong interpretation.<br />
Today because of high level of modern computer facilities the numerical solution of<br />
3D inverse problem becomes possible, however it still remains a very difficult and<br />
computationally expensive task. Therefore to date there are only a few 3D MT in-<br />
version codes available, most of which are not free. Recently, Siripunvaraporn et al.<br />
(2005) released their code WSINV3DMT and now, judging by the WSINV3DMT 1<br />
webpage, it attracts a large amount of users. This demonstrates the urgent need for<br />
3D MT inversion.<br />
For this thesis we developed and implemented a 3D magnetotelluric inversion<br />
method. This method is based on the limited memory quasi-Newton optimization<br />
approach. The main advantage of this approach, compared to other Newton-type<br />
optimization techniques, is the storage requirement, only a limited number of pairs<br />
of vectors have to be stored in memory. This advantage makes it possible to handle<br />
large-scale problems, such as 3D MT inversion. As for most other types of opti-<br />
mization methods, the limited memory QN optimization requires the calculation<br />
1 http://mucc.mahidol.ac.th/∼scwsp/wsinv3dmt<br />
116
Chapter 6. Conclusions<br />
of the gradient of the penalty function ϕ. Using the adjoint method helps to per-<br />
form this task with a minimum number of forward modellings and we developed<br />
and presented the concrete formulae for the gradients in the 1D and 3D MT cases,<br />
respectively. The mathematics behind the derivation of these formulae and their<br />
numerical implementation are not straightforward. Therefore we assured the accu-<br />
racy of the implementation by comparing our numerical results with an analytical<br />
solution and observe good agreement for the adjoint fields needed for the gradient.<br />
Our development is quite general and is not limited to magnetotellurics alone. It<br />
can be applied to a variety of EM problems, such as marine controlled-source EM<br />
and well induction logging.<br />
Another important part of the inversion is the forward modelling code employed<br />
as an engine for the inversion. Most of the existing 3D inversions use finite-difference<br />
and finite-element forward modelling codes. We use the integral equation (IE) code<br />
x3d. To accelerate the forward modelling code, we parallelize its discrete 2D con-<br />
volution routine, which is the most time-consuming part of the serial solution. The<br />
comparison between the serial and parallel versions on both, distributed-memory<br />
and shared-memory clusters, shows that we achieve a reasonable acceleration, e.g.<br />
a factor of 7 for 16 processors and large models. Another inversion based on IE<br />
approach is developed by Zhdanov and Golubev (2003). To speed up the inversion<br />
process it uses approximate forward modelling solution, but general reliability and<br />
the accuracy of such a solution is still under question. Zhdanov and Tolstaya (2004),<br />
to insure the accuracy of the solution, used rigorous forward modelling at the final<br />
stage of the inversion.<br />
Due to the fact that the solution of the 3D MT inverse problem is non unique, we<br />
need an appropriate regularization approach. We suggest two Tikhonov-type regu-<br />
larizations: strong regularization, which uses the Neumann boundary conditions and<br />
ties the resistivity in the inversion domain to the fixed background resistivity, and<br />
weak regularization, which only assumes continuity of the gradient at the boundary<br />
of the inversion domain. With strong regularization the inversion tends to extend<br />
the background resistivity inside the inversion domain. While this helps in synthetic<br />
tests cases where the true background resistivity is known, it is impractical for the<br />
inversion of real data, as the background resistivity has to be chosen before the<br />
inversion process and exerts an overly strong influence on the inversion results. In<br />
comparison, the weak regularization keeps the influence of the background resistiv-<br />
ity to a minimum and is appropriate for situations where the background resistivity<br />
117
is not known a priori.<br />
Chapter 6. Conclusions<br />
Our tests with a suite of standard synthetic test models (Wannamaker, 1991;<br />
Mackie et al., 1994; Avdeev et al., 1997; Zhdanov and Tolstaya, 2004; Siripunvara-<br />
porn et al., 2005, among others) demonstrate that with pure Tikhonov-type regu-<br />
larization we only achieve satisfactory results with a dense site coverage. Generally<br />
speaking though, we are satisfied by the software developed and by the results of our<br />
model experiments. For the conductive dyke model, for example, we can reasonably<br />
recover the true resistivity image for both buried and outcropped dykes; and for<br />
both coarse and dense MT site coverage. Therefore we believe in the robustness and<br />
accuracy of the inversion results obtained for the dyke models.<br />
For the more complicated model, the model with two adjacent blocks, our feelings<br />
are controversial. On the one hand side we achieve relatively good results with a<br />
dense MT sites coverage. At the same time, for a coarser coverage we found that<br />
our inversion solution cannot “see” through numerical cells that are not covered<br />
by MT sites. This conclusion promptly implies that Tikhonov-type regularization,<br />
which we included in our inversion solution, is not powerful enough to suppress the<br />
non-smoothness of the resistivity image, especially for the upper part of the model.<br />
However, we believe that our solution can be used to recover the true resistivity<br />
of the lower parts of earth models. As for the upper part of the models its proper<br />
recovery depends on many factors, such as the geometry and resistivity of the struc-<br />
tures inside the Earth, coverage of the region by MT sites and many others. In order<br />
to construct reliable resistivity images one has to put more strong constraints on<br />
the model parameters, stronger than those imposed by traditional Tikhonov-type<br />
regularization.<br />
We suggest to use different types of the preconditioners in our inversion to over-<br />
come this problem. The first one is based on applying a model covariance matrix to<br />
smooth the gradient of the penalty functional. This is similar to the idea of Siripun-<br />
varaporn et al. (2005). In our implementation the model covariance matrix is based<br />
on a Gaussian filter. Applying such a preconditioner improves the results dramat-<br />
ically, although some artifacts are still present. A possible explanation is that our<br />
filter is too simple and a more complicated filter has to be applied. The second<br />
preconditioner is based on the approximation to the inverse of the Hessian matrix.<br />
This approach was proposed by Gregory Newman. The mathematics behind this<br />
approach is not as trivial as for the first one. We developed and implemented this<br />
approach, but so far did not obtain satisfactory results. At the moment we are<br />
118
Chapter 6. Conclusions<br />
trying to understand whether this is because of some numerical error in our current<br />
implementation of the approach or due to some problem with this approach itself.<br />
This is a subject of ongoing research.<br />
It is difficult to compare different 3D MT inversion codes due to the different<br />
forms of the data misfit used, different forward engines employed, the optimization<br />
approaches, stopping criteria and so on. Some codes require less memory, but con-<br />
verge slower. Another issue is that different codes can perform better in different<br />
situations and that the quantification of the overall quality is difficult. We only can<br />
compare the results of the inversion for particular synthetic datasets. One of such<br />
an attempts was the MT 3D inversion workshop held by <strong>DIAS</strong> in March 2008 (see<br />
MT3DINV 2 webpage). There the data computed from some secret synthetic model<br />
was distributed among 3D MT software developers and the various codes showed<br />
more or less similar results, however the time for calculation and memory require-<br />
ments were not compared. In addition other factors such as noise and incomplete<br />
data were not taken into consideration and such issues can be the dominating factors<br />
for the quality of an inversion of real data.<br />
For the future a closer examination of the implemented preconditioners and the<br />
investigation of possible alternatives would show in how far the efficiency of our<br />
approach can be improved. One possibility would be to relax the influence of the<br />
gaussian filter for deeper layers where it is not needed. However, it seems that the<br />
filter does not affect these layers even in the current version and thus the behaviour<br />
should not change fundamentally.<br />
One more promising extension is the application of the automatic relaxation<br />
scheme to the regularization in 3D case and possibly to the Gaussian precondi-<br />
tioner. So far we adjust the value of the regularization parameter λ at different<br />
stages of the inversion manually based on our experience. This is time consuming as<br />
the inversion has to be stopped, the convergence examined manually and restarted<br />
with the new value. An automatic scheme would accelerate this process, even though<br />
human experience and judgment can never fully be replaced.<br />
Even though the first paper on 3D MT inversion was published over 15 years ago<br />
Mackie and Madden (1993), the field is still in its infancy and 3D inversion codes only<br />
now become available for a wider range of researchers. With more widespread use<br />
the advantages and deficiencies of individual approaches will become more apparent<br />
2 MT 3D <strong>Inversion</strong> Workshop, <strong>DIAS</strong>, March, 2008,<br />
http://www.dias.ie/lang/en/cosmic/geo/mt workshop2008.html<br />
119
Chapter 6. Conclusions<br />
and give the developers the opportunity to improve their codes. Even though 2D<br />
inversion approaches will remain in use for their cost effectiveness and comparative<br />
ease of use, 3D inversion will become the standard method for constructing detailed<br />
models of the Earth.<br />
120
Appendix A.<br />
MT impedance<br />
In this appendix we introduce the basic ideas and equations of the magnetotelluric<br />
method. The MT method was proposed independently by Tikhonov (1950) and<br />
Cagniard (1953) as a method for a one-<strong>dimensional</strong> sounding of the Earth. They<br />
proposed to use an impedance Z to find the Earth’s conductivity. Below we derive<br />
the explicit expressions for the impedance for the 1D case.<br />
A.1. Impedance of a layered Earth<br />
Let us consider an N−layered Earth model with conductivities σk, (k = 1, ..., N)<br />
within each layer. Within each layer the Helmholtz equation<br />
∆E = −iωµ0σE (A.1)<br />
holds. Choosing the coordinate system so that the external current j ext flows in<br />
x−direction and with the z−axis pointing downward, the x−component of the elec-<br />
tric field inside the k-th layer, z ∈ (zk, zk+1), have the following form<br />
Exk = E1ke κkz + E2ke −κkz , (A.2)<br />
where κk = √ −iωµ0σk. Now we can compute the following impedance transfer<br />
function of the k-th layer<br />
Zk = Exk<br />
Hy k<br />
= iωµ0<br />
κk<br />
= iωµ0Exk<br />
∂zExk<br />
(A.3)<br />
E1keκkz + E2ke−κkz E1keκkz iωµ0 (1 + Ake<br />
=<br />
− E2ke−κkz κk<br />
−2κkz )<br />
(1 − Ake−2κkz , (A.4)<br />
)<br />
121
Appendix A. MT impedance<br />
where formula A.3 is obtained using the Faraday’s law ∇ × E = iωµ0H and the<br />
coefficient Ak = E2k/E1k.<br />
We now can derive the transfer functions Zk(zk) and Zk(zk+1) at the top and<br />
bottom of the k-th layer, respectively:<br />
Zk(zk) = iωµ0 (1 + Ake<br />
κk<br />
−2κkzk)<br />
(1 − Ake−2κkzk) , (A.5a)<br />
Zk(zk+1) = iωµ0 (1 + Ake−2κkzk+1) (1 − Ake−2κkzk+1) . (A.5b)<br />
From equation A.5b we can derive the coefficient Ak as follows<br />
κk<br />
Ak = e 2κkzk+1<br />
κk<br />
iωµ0 Zk(zk+1) − 1<br />
, (A.6)<br />
κk<br />
iωµ0 Zk(zk+1) + 1<br />
Now we substitute formula A.6 into equation A.5a to yield:<br />
Zk(zk) = iωµ0<br />
κk<br />
In this equation ∆k stands for zk+1 − zk.<br />
<br />
− sinh(κk∆k) + cosh(κk∆k) κk<br />
iωµ0 Zk(zk+1)<br />
cosh(κk∆k) − sinh(κk∆k) κk<br />
iωµ0 Zk(zk+1)<br />
<br />
. (A.7)<br />
Furthermore, the components of the electric and magnetic fields are continuous<br />
at the transition from the k-th to the (k + 1)-th layer, and therefore<br />
Zk(zk+1) = Zk+1(zk+1). (A.8)<br />
From equation A.8 and equation A.7 we can obtain the following recursive formula<br />
for the impedance transfer function:<br />
Zk(zk) = iωµ0<br />
κk<br />
<br />
− sinh(κk∆k) + cosh(κk∆k) κk<br />
iωµ0 Zk+1(zk+1)<br />
cosh(κk∆k) − sinh(κk∆k) κk<br />
iωµ0 Zk+1(zk+1)<br />
<br />
. (A.9)<br />
To find the impedance Z1(z1) at the surface of the Earth one should use the fact,<br />
that the impedance ZN(zN) = iωµ0/κN (impedance of a half-space), and apply the<br />
recursive formula A.9 iteratively, moving from the top of the lowermost layer to the<br />
surface.<br />
122
Appendix A. MT impedance<br />
A.2. Impedance of 3D Earth<br />
To obtain the impedance tensor in the 3D case one also has to solve a system of<br />
Maxwell’s equations<br />
∇ × H = (σ − iωε)E + j ext , (A.10a)<br />
∇ × E = iωµ(H + h ext ), (A.10b)<br />
but now the fields and the conductivity depend on the Cartesian coordinates (x, y, z).<br />
When we numerically solve the system of Maxwell’s equations, in other words find<br />
the electric, E, and magnetic, H, fields we can obtain the complex-valued impedance<br />
tensor, Z . This tensor relates the orthogonal components of the horizontal electric<br />
and magnetic fields as<br />
<br />
Ex<br />
Ey<br />
<br />
=<br />
<br />
Zxx Zxy<br />
Zyx Zyy<br />
123<br />
<br />
Hx<br />
Hy<br />
<br />
. (A.11)
Appendix B.<br />
Calculation of Digital Convolution<br />
This appendix is the summary of the Appendix C of paper Avdeev et al. (1997). To<br />
simplify the following explanation instead of a 2D digital convolution we assume a<br />
1D digital convolution<br />
hk =<br />
N<br />
k ′ =1<br />
gk−k ′fk ′, k = 1, · · · , N (B.1)<br />
In this equation, the function fk is defined for k = 1, · · · , N, while the function gk<br />
is defined for k = 0, ±1, · · · ± (N − 1).<br />
If we define the new functions fk and gk as following<br />
fl =<br />
<br />
fl, l = 1, · · · , N<br />
0, l = N + 1, · · · , 2N<br />
⎧<br />
⎪⎨ gl−1, l = 1, · · · , N<br />
gk = 0,<br />
⎪⎩<br />
gl−1−2N,<br />
l = N + 1<br />
l = N, · · · , 2N,<br />
then the convolution B.1 can be written as<br />
(B.2)<br />
(B.3)<br />
hk = Φ −1<br />
<br />
Φ[g]Φ[ <br />
f] , k = 1, · · · , N, (B.4)<br />
k<br />
where Φ and Φ −1 are direct and inverse Digital Fourier Transforms, respectively and<br />
are defined as<br />
Φ[S]k =<br />
2N<br />
l=1<br />
2πi (l − 1)(k − 1)<br />
Sle<br />
2N<br />
124<br />
(B.5)
Appendix B. Calculation of Digital Convolution<br />
Φ −1 [S]k = 1<br />
2N<br />
2N<br />
l=1<br />
−2πi (l − 1)(k − 1)<br />
Sle<br />
2N<br />
125<br />
(B.6)
Appendix C.<br />
How to measure the 3D misfit?<br />
The predicted Z and observed D impedances (at a given MT site and at a discrete<br />
period) are 2 × 2 matrices, not scalars. So, the question is how to measure the<br />
distance ρ(Z, D) between them in order to define a proper form of misfit ϕd. The<br />
answer is not obvious. A natural way to define such a distance is to consider the<br />
matrix A = Z − D and its induced matrix norm<br />
where u 2 =<br />
A 2 = max Au 2<br />
u 2<br />
(C.1)<br />
<br />
|u1| 2 + |u2| 2 , for any vector u = (u1, u2) T , and define ρ(Z, D) =<br />
Z − D 2 . It can be shown that for any matrix A,<br />
A 2 =<br />
<br />
λ1(A T A) (C.2)<br />
where λ1(A T A) is the largest (real) eigenvalue of the Hermitian matrix A T A. More-<br />
over, for a 2 × 2 matrix A, it follows that<br />
where<br />
(A2 ) 2 = 1<br />
<br />
tr[A<br />
2<br />
T <br />
A] + tr[A T A] 2 − 4det[A T <br />
A] , (C.3)<br />
tr[A T A] = |Axx| 2 + |Axy| 2 + |Ayx| 2 + |Ayy| 2<br />
(C.4)<br />
and det[A T A] are respectively the trace and determinant of matrix A T A. Theo-<br />
retically, the formula given in equation C.3 is what we are looking for. But, it is<br />
too complicated, i.e. not quadratic, to be considered an appropriate form of misfit<br />
126
Appendix C. How to measure the 3D misfit?<br />
function. Somehow, we have to simplify it. From equation C.3 it follows that<br />
1<br />
2 tr[AT A] ≤ (A 2 ) 2 ≤ tr[A T A]. (C.5)<br />
The inequalities given in equation C.5 means that the distance ρ(Z, D) = Z − D 2<br />
is controlled by the trace tr[A T A], where A = Z − D, and so this trace can be<br />
chosen to measure the misfit as<br />
ϕd = 1<br />
2 tr[AT A]. (C.6)<br />
Although it should be mentioned that tr[A T A] is not associated with any matrix<br />
norm itself.<br />
127
Appendix D.<br />
More general 3D misfit and its<br />
derivative<br />
Equation 4.2 is written for a particular problem where the data misfit ϕd includes<br />
the impedance difference matrices Aij whose entries are equally weighted by the<br />
values βij. The generalization of the theory presented in Chapter 4 for the case of<br />
the individually weighted entries of Aij is not straightforward. The main difficulty<br />
here is in deriving equations for the derivatives ∂ϕd . However, it is still possible to<br />
∂σk<br />
straightforwardly extend the theory to the more general case, if the data misfit<br />
ϕd = 1<br />
2<br />
NS NT <br />
i=1<br />
<br />
βijtr[ A T<br />
j=1<br />
is written in terms of the weighted matrices<br />
Aij =<br />
<br />
wxxAxx wxyAxy<br />
wyxAyx wyyAyy<br />
ij Aij], (D.1)<br />
<br />
ij<br />
, (D.2)<br />
where the tilde sign means the weighting by the real-valued weights, wxx, wxy, wyx, wyy.<br />
If we additionally assume that wxy = wyx, then it is easy to prove that B T<br />
= B T and<br />
tr[ BC] = tr[B C] for any matrices B and C. These simple properties allow us to<br />
obtain the relevant alterations of equations, presented in Section 4.1.1 of Chapter 4.<br />
It can be shown that equations 4.7, 4.14, 4.19, 4.20, 4.24 should be, respectively,<br />
altered to the following forms<br />
∂ϕd<br />
∂σk<br />
= ℜ<br />
NS<br />
<br />
NT <br />
tr<br />
i=1<br />
j=1<br />
128<br />
A T<br />
ij<br />
∂ Zij<br />
∂σk<br />
<br />
, (D.3)
where<br />
NS <br />
i=1<br />
Appendix D. More general 3D misfit and its derivative<br />
tr<br />
∂ϕd<br />
∂σk<br />
<br />
= ℜ<br />
h ext<br />
j<br />
NS<br />
<br />
NT T<br />
A tr ji (Eij,k − ZijHij,k) H −1<br />
<br />
ij , (D.4)<br />
i=1<br />
j ext<br />
j<br />
j=1<br />
NS <br />
= p T AijH−T ij δ(r − ri), (D.5)<br />
i=1<br />
NS<br />
1 <br />
= −√<br />
p<br />
−1ωjµ<br />
T Z T AijH ij<br />
−T<br />
ij δ(r − ri), (D.6)<br />
i=1<br />
T<br />
A ij (pejk(ri) − Zijphjk(ri)) H −1<br />
<br />
ij<br />
Aij =<br />
<br />
w 2 xxAxx w 2 xyAxy<br />
w 2 yxAyx w 2 yyAyy<br />
<br />
=<br />
<br />
ij<br />
Vk<br />
tr u T <br />
j Ej dV, (D.7)<br />
. (D.8)<br />
All the other equations presented in Chapter 4 remains the same, including the key<br />
formula of equation 4.25.<br />
129
Appendix E.<br />
Hydrocarbon reservoir detectability<br />
study<br />
In this appendix we present a comparative study about the detectability of a hydro-<br />
carbon reservoir in a marine environment, using controlled-source electromagnetic<br />
(CSEM) methods both in the time and frequency domain. This work was performed<br />
during a two-month visit to the Lawrence Berkeley National Laboratory and the re-<br />
sults are published in Avdeeva et al. (2007). The target is a thin resistive body<br />
buried at a certain depth under the sea floor. The depth of the sea, and depth,<br />
thickness and resistivity of the reservoir are variable model parameters. For differ-<br />
ent sets of these parameters we calculate synthetic electromagnetic (EM) responses<br />
using a parallel version of the three-<strong>dimensional</strong> (3D) time-domain finite-difference<br />
forward modelling code by Commer and Newman (2004) and the 3D frequency-<br />
domain finite-difference code by Newman and Alumbaugh (1995). To compare the<br />
responses quantitatively, signal-to-noise ratios (SNR) were calculated as a function<br />
of time/frequency and source-receiver separation. SNR were calculated using the<br />
scattered field response of the reservoir as signal and the response of the background,<br />
in our case a two-layered model, as noise.<br />
Marine CSEM is a promising yet challenging method in modern geophysical ex-<br />
ploration for hydrocarbon reservoirs (MacGregor and Sinha, 2000; Eidesmo et al.,<br />
2002; Ellingsrud et al., 2002; Johansen et al., 2005, among others). It is important<br />
as a supplementary method to seismic surveys. Recent works on modelling and in-<br />
version of marine CSEM data include (Um and Alumbaugh, 2005; Abubakar et al.,<br />
2006; Constable and Weiss, 2006; Hoversten et al., 2006, among others).<br />
In contrast to time-domain electromagnetic (TDEM) methods and its correspond-<br />
ing data interpretation tools, the development and application of frequency-domain<br />
130
Appendix E. Hydrocarbon reservoir detectability study<br />
(FDEM) methods for marine surveys has made significant progress. In this appendix<br />
we investigate the detectability of a 3D hydrocarbon reservoir in a marine environ-<br />
ment. The first section presents synthetic responses obtained for different 3D hydro-<br />
carbon reservoir models with a time-domain and a frequency-domain finite-difference<br />
(FD) forward modelling solutions. Further, the two solutions are compared in their<br />
ability to detect a deep hydrocarbon reservoir.<br />
E.1. Numerical examples<br />
In this study a typical 3D hydrocarbon reservoir model, shown in Figure E.1, is<br />
employed. The model consists of a thin resistive target buried at a certain depth<br />
under the sea floor. Four different seawater depths are considered, h1 = 100, 200,<br />
400 and 1000 m. We also varied the depth (h2 = 200, 400, 1000 m), thickness<br />
(h3 = 100, 200, 400 m), and resistivity (ρ3 = 20, 30, 50, 100 Ωm) of the reservoir.<br />
The reservoir itself extends 2000 m along the x and y axes, and its centre is located<br />
at x = 0 m and y = 0 m. The EM responses were simulated using the 3D TDEM<br />
finite-difference forward modelling code of Commer and Newman (2004) and the 3D<br />
FDEM finite-difference code of Newman and Alumbaugh (1995).<br />
Figure E.1.: The 3D hydrocarbon reservoir model and survey configuration. The<br />
white horizontal arrows correspond to the transmitter positions, the<br />
white circles show the receiver profile.<br />
E.1.1. Time-domain modelling<br />
We first analyze TDEM responses over the thin resistive target. The signals are<br />
excited by a 250-m long x-oriented grounded wire. <strong>Three</strong> transmitter locations at<br />
131
Appendix E. Hydrocarbon reservoir detectability study<br />
the bottom of the sea are considered, marked by the white horizontal arrows in<br />
Figure E.1, these are xtr = −2000, −1000, 0 m, with ytr = 0 m and ztr = 0 m<br />
constant. The TDEM responses were calculated for a profile of 45 receivers with a<br />
receiver spacing of 250 m along the x-axis. The profile is located 50 m above the<br />
sea floor.<br />
To choose an optimal 3D grid for our simulations, its responses are calculated<br />
for a 1D layered model without the resistive target and compared against a quasi-<br />
analytical 1D solution. For the survey scenario depicted in Figure E.1, a grid of<br />
153 × 153 × 90 nodes was used. Its smallest mesh spacing is ∆min = 50 m, hence,<br />
the initial time step required by the FD scheme of Commer and Newman (2004) is<br />
∆t0 = 10 −4 s.<br />
Figure E.2.: Horizontal electric field, Ex, excited by an impulse source. The curves<br />
are given for various seawater depths. The transmitter is located at<br />
xtr = −2000 m and the receiver at xrc = 2000 m. The solid lines show<br />
the 3D responses, the dashed lines present the background responses.<br />
The depth of the reservoir is h2 = 1000 m.<br />
E.1.1.1. Impulse source<br />
First, we consider an impulse signal for source excitation. The horizontal, Ex, and<br />
the vertical, Ez, electric fields were calculated for all (4 × 3 × 3 × 4 = 144) possible<br />
132
Appendix E. Hydrocarbon reservoir detectability study<br />
Figure E.3.: The same as Figure E.2, but for the depth of the reservoir h2 = 200 m.<br />
values of the model parameters (h1, h2, h3 and ρ3). Figure E.2 exemplifies the<br />
responses obtained for h3 = 200 m and for ρ3 = 50 Ωm. The figure shows these<br />
responses for a source-receiver offset of 4 km, and a source position of xtr = −2000 m.<br />
Experimenting with different transmitter positions, we found that the position xtr =<br />
−2000 m yields the highest sensitivity. Moreover, as shown below, for the target<br />
geometry considered here, this spacing produces a maximum reservoir effect on Ex<br />
(cf. Figure E.6(a)). In Figure E.2 the curves are plotted as a function of time for<br />
four seawater depths (h1 = 100, 200, 400, 1000 m). In this figure the responses<br />
of the 3D target are solid lines and background responses are dashed lines of the<br />
same colour. A visible effect of the reservoir is seen for all four seawater depths. In<br />
Figure E.3 the responses are exemplified for a more shallow target (h2 = 200 m).<br />
In comparison with Figure E.3, it can be observed that over the four different sea<br />
depths considered, the target response increases with the sea depth. Further analysis<br />
of these results is undertaken below in the Section “Comparison of time-domain and<br />
frequency-domain methods”.<br />
E.1.1.2. Step-off source<br />
Keeping the geometry of the model and positions of the sources and receivers un-<br />
changed, we also simulated the responses generated by a step-off source signal. Here,<br />
133
Appendix E. Hydrocarbon reservoir detectability study<br />
field generation is caused by shutting off an initially steady current within the hori-<br />
zontal grounded line source. Figure E.4 presents the responses again for the source<br />
position xtr = −2000 m, and the receiver position xrc = 2000 m. The curves are<br />
shown for h1 = 200 and 1000 m. From here on, we focus our analysis on the case of<br />
a target thickness of h3 = 200 m and a resistivity of ρ3 = 50 Ωm. From this plot we<br />
can see that the target produces a significant signal. However, the observed differ-<br />
ences between the background (dashed lines) and the 3D reservoir model responses<br />
(solid lines) mostly occur in the signal’s DC limit, rather than during the transient’s<br />
decay.<br />
Figure E.4.: Horizontal electric field, Ex, excited by a step-off source signal. The<br />
curves are given for various seawater depths. The transmitter is located<br />
at xtr = −2000 m and the receiver at xrc = 2000 m. The solid lines show<br />
the 3D responses, the dashed lines present the background responses.<br />
The depth of the reservoir is h2 = 1000 m.<br />
E.1.2. Frequency-domain modelling<br />
We now investigate to what extent a target response can be detected by the FDEM<br />
method. In order to be able to compare this method with TDEM, the model ge-<br />
ometry and survey configuration were kept identical for both methods. The only<br />
difference is that now the x-directed horizontal electric dipole is energized with a<br />
sinusoidal waveform of a particular frequency.<br />
In this study 6 frequencies are considered, these are 0.01, 0.03, 0.1, 0.3, 1 and 3 Hz.<br />
For each of the frequency pairs 0.01/0.03, 0.1/0.3, and 1/3, a separate 3D numerical<br />
grid is employed. The 3D frequency-domain FD code by Newman and Alumbaugh<br />
134
Appendix E. Hydrocarbon reservoir detectability study<br />
(1995) is used for modelling. In order to verify the responses computed on the FD<br />
grids against quasi-analytical 1D solutions, we replaced the 3D resistive target by a<br />
continuous resistive layer, thus considering a 5-layered model (air, sea water, seabed,<br />
the resistive layer and again seabed). For the frequency pair 0.01/0.03 Hz a grid<br />
of size 126 × 101 × 126 nodes is employed, with an uniform grid spacing of 200 m.<br />
For the pair 0.1/0.3 Hz, the grid size is 171 × 101 × 101 nodes, and the smallest<br />
grid spacing is ∆min = 100 m. For the last two frequencies of 1 and 3 Hz the<br />
corresponding grid has 261 × 181 × 116 nodes with ∆min = 50 m. Both horizontal,<br />
Ex, and vertical, Ez, electric fields were calculated for the 3D reservoir model using<br />
the following model parameters: h1 = 200, 1000 m; h2 = 200, 1000 m; h3 = 200 m<br />
and ρ3 = 50 Ωm.<br />
Figure E.5 presents the amplitude of the horizontal electrical field, Ex, as a func-<br />
tion of receiver position. The curves are plotted for the frequencies of 0.01, 0.1 and<br />
1 Hz and for two seawater depths of h1 = 200 and 1000 m. The source is located at<br />
xtr = −2000 m.<br />
Using a frequency of 1 Hz, no difference can be observed between the 3D reservoir<br />
model and background model responses for the case of a seawater depth of h1 =<br />
200 m (red line in Figure E.5). However for the deep water example (blue line) the<br />
3D reservoir model starts to produce a larger scattered field and the difference to the<br />
background response grows until the receiver position reaches about 2500 m. Beyond<br />
this receiver position, the difference diminishes and then vanishes. The signal at this<br />
receiver distance is affected by the known effect caused by the air-water interface,<br />
when a strong airwave arrives at the sea floor. This airwave contains no information<br />
about the resistivity structure of the seabed. For source-receiver offsets larger than<br />
twice the seawater depth, the airwave starts to influence the EM signal, which<br />
is known as the airwave problem, see for example MacGregor et al. (2006). The<br />
depth of the sea controls the source-receiver offset, where sensitivity to the target<br />
is diminished or lost due to the airwave arrival. Because of this problem it is more<br />
difficult to detect the reservoir for shallow sea water. This is a disadvantage of the<br />
FDEM method.<br />
135
Appendix E. Hydrocarbon reservoir detectability study<br />
Figure E.5.: Horizontal electric field responses obtained using the 3D FDEM finitedifference<br />
code for two seawater depths h1 = 200, 1000 m and for<br />
three frequencies of 0.01, 0.1 and 1 Hz. The transmitter is located at<br />
xtr = −2000 m. The depth of the reservoir is h2 = 1000 m. The solid<br />
lines again show the 3D reservoir model responses, the dashed lines<br />
present the background responses.<br />
E.2. Comparison of time-domain and<br />
frequency-domain methods<br />
To compare TDEM and FDEM responses, signal-to-noise ratios (SNR) were calcu-<br />
lated for both methods. In this study signal is defined as the scattered horizontal<br />
electrical field of the reservoir, as noise the response of the background medium with-<br />
out the target. We show contour plots of SNR as a function of the source-receiver<br />
offset and time (or frequency) for the TDEM (or FDEM) modelling. In Figure E.6<br />
we present the SNR for the model with shallow water (h1 = 200 m) and deep target<br />
(h2 = 1000 m), since this case happens to be the most difficult for all the methods<br />
considered. Figure E.6(a) presents the SNR for the TDEM method when the model<br />
is energized by the impulse signal, Figure E.6(b) shows the SNR for the step-off<br />
signal, and Figure E.6(c) shows the ratio for the FDEM method. To detect the<br />
136
Appendix E. Hydrocarbon reservoir detectability study<br />
(a)<br />
(b)<br />
(c)<br />
Figure E.6.: SNR obtained for the 200 m seawater depth and 1000 m depth of the<br />
target, the transmitter positioned at xtr = −2000 m: (a) the timedomain<br />
method when the model is energized by the impulse source; (b)<br />
the time-domain method when the model is energized by the step-off<br />
source, and (c) the frequency-domain method.<br />
137
Appendix E. Hydrocarbon reservoir detectability study<br />
reservoir, we require a minimum SNR of 0.1. When the transmitter is excited by<br />
the impulse signal, TDEM yields SNR values as large as 0.5, which indicates a very<br />
good target detectability. However, the contour plot in Figure E.6(a) shows that<br />
this region is relatively narrow, limited to a time range of 1.3 s to 2 s, and a range<br />
of source-receiver offsets between 3750 m and 4000 m. The SNR does not get larger<br />
than 0.2 using the step-off source (Figure E.6(b)). Therefore the impulse seems to<br />
be a favorable signal form for the TDEM method.<br />
An important result is that TDEM together with the impulse source signal can<br />
detect the reservoir over the whole range of the receiver profile. Comparing the SNR<br />
values with the ones obtained using the FDEM method, the TDEM results indicate<br />
a better reservoir detectability. Also, we found that this is true for other transmitter<br />
positions (not presented here). The FDEM method is able to detect the target for<br />
source-receivers offsets from approximately 2000 m and up to 7000 m.<br />
E.3. Conclusions<br />
This preliminary study indicates that the TDEM method using an impulse source<br />
signal has a potentially better ability for detecting the type of hydrocarbon reservoir<br />
considered here. An advantage is that the airwave problem, encountered in FDEM<br />
methods, can be overcome. However, we believe that other source signal waveforms<br />
should also be analyzed.<br />
138
References<br />
Abubakar, A., Habashy, T., Druskin, V., Alumbaugh, D., Zerelli, A., and Knizh-<br />
nerman, L. (2006). Two-and-half-<strong>dimensional</strong> forward and inverse modeling for<br />
marine CSEM problems. In Expanded Abstracts, pages 750–754. Society of Ex-<br />
ploration Geophysicists.<br />
Avdeev, D. B. (2005). <strong>Three</strong>-<strong>dimensional</strong> electromagnetic modelling and inversion<br />
from theory to application. Surveys in Geophysics, 26(6), 767–799.<br />
Avdeev, D. B. and Avdeeva, A. D. (2006). A rigorous three-<strong>dimensional</strong> magneto-<br />
telluric inversion. Progress In Electromagnetics Research, PIER, 62, 41–48.<br />
Avdeev, D. B., Kuvshinov, A. V., Pankratov, O. V., and Newman, G. A. (1997).<br />
High-performance three-<strong>dimensional</strong> electromagnetic modeling using modified<br />
Neumann series. Wide-band numerical solution and examples. Journal of Ge-<br />
omagnetism and Geoelectricity, 49, 1519–1539.<br />
Avdeev, D. B., Kuvshinov, A. V., Pankratov, O. V., and Newman, G. A. (2002).<br />
<strong>Three</strong>-<strong>dimensional</strong> induction logging problems, Part I: An integral equation solu-<br />
tion and model comparisons. Geophysics, 67, 413–426.<br />
Avdeev, D. B., Utada, H., Kuvshinov, A. V., and Koyama, T. (2004). <strong>Three</strong>-<br />
<strong>dimensional</strong> electromagnetic modeling of the Hawaiian swell. In AGU Fall Meeting<br />
Abstracts.<br />
Avdeeva, A. D. and Avdeev, D. B. (2006). A limited-memory quasi-newton inversion<br />
for 1D magnetotellurics. Geophysics, 71, G191–G196.<br />
Avdeeva, A. D., Commer, M., and Newman, G. A. (2007). Hydrocarbon reservoir<br />
detectability study for marine CSEM methods: Time-domain versus frequency-<br />
domain. In San Antonio 2007 Annual Meeting Expanded Abstracts, pages 628–632.<br />
SEG.<br />
139
References<br />
Badea, E. A., Everett, M. E., Newman, G. A., and Biro, O. (2001). Finite-element<br />
analysis of controlled-source electromagnetic induction using Coulomb-gauged po-<br />
tentials. Geophysics, 66(3), 786–799.<br />
Berdichevsky (1960). Principles of magnetotelluric profiling theory. Applied Geo-<br />
physics, 28, 70–91.<br />
Byrd, R. H., Lu, P., Nocedal, J., and Zhu, C. (1995). A limited-memory algorithm<br />
for bound constrained optimization. SIAM Journal on Scientific Computing, 16,<br />
1190–1208.<br />
Cagniard, L. (1953). Basic theory of the magneto-telluric method of geophysical<br />
prospecting. Geophysics, 18, 605–635.<br />
Caldwell, T. G., Bibby, H. M., and Brown, C. (2004). The magnetotelluric phase<br />
tensor. Geophysical Journal International, 158, 457–469.<br />
Chave, A. D., Thomson, D. J., and Ander, M. E. (1987). On the robust estima-<br />
tion of power spectra, coherences and transfer functions. Journal of Geophysical<br />
Research, 92(B1), 633–648.<br />
Chen, J., Oldenburg, D. W., and Haber, E. (2005). Reciprocity in electromagnetics:<br />
application to modelling marine magnetometric resistivity data. Physics of the<br />
Earth and Planetary Interios, 150, 45–61.<br />
Commer, M. and Newman, G. A. (2004). A parallel finite-difference approach for<br />
3D transient electromagnetic modeling with galvanic sources. Geophysics, 69,<br />
1192–2002.<br />
Constable, S. and Weiss, C. J. (2006). Mapping thin resistors and hydrocarbons with<br />
marine EM methods: Insights from 1D modeling. Geophysics, 71, G43–G51.<br />
Constable, S. C., Parker, R. L., and Constable, C. G. (1987). Occam’s inversion: A<br />
practical algorithm for generating smooth models from electromagnetic sounding<br />
data. Geophysics, 52(3), 289–300.<br />
Constable, S. C., Orange, A. S., Morrison, H. F., and Hoversten, G. M. (1998).<br />
Marine magnetotellurics for petroleum exploration Part I: A sea-floor equipment<br />
system. Geophysics, 63, 816–825.<br />
140
References<br />
Dmitriev, V. I. (1969). Electromagnetic fields in inhomogeneous media. Moscow<br />
State University.<br />
Dorn, O., Bertete-Aguirre, H., Berryman, J. G., and Papanicolaou, G. C. (1999). A<br />
nonlinear inversion method for 3D electromagnetic imaging using adjoint fields.<br />
Inverse Problems, 15, 1523–1558.<br />
Egbert, G. D. (2002). Processing and interpretation of electromagnetic induction<br />
array data. Surveys in Geophysics, 23, 207–249.<br />
Egbert, G. D. and Booker, J. R. (1986). Robust estimation of geomagnetic transfer<br />
functions. Geophysical Journal of the Royal Astronomical Society, 87(2), 173–194.<br />
Eidesmo, T., Ellingsrud, S., MacGregor, L. M., Constable, S., Sinha, M. C., Jo-<br />
hansen, S., Kong, F. N., and Westerdahl, H. (2002). Sea bed logging (SBL), a<br />
new method for remote and direct identification of hydrocarbon filled layers in<br />
deepwater areas. First Break, 20, 144–152.<br />
Ellingsrud, S., Eidesmo, T., Johansen, S., Sinha, M. C., MacGregor, L. M., and<br />
Constable, S. (2002). The meter reader - Remote sensing of hydrocarbon layers<br />
by seabed logging (SBL): results from a cruise offshore Angola. The Leading Edge,<br />
21, 972–982.<br />
Farquharson, C. G. and Oldenburg, D. W. (1998). Non-linear inversion using general<br />
measures of data misfit and model structure. Geophysical Journal International,<br />
134, 213–227.<br />
Fletcher, R. and Reeves, C. M. (1964). Function minimization by conjugate gradi-<br />
ents. The Computer Journal, 7, 149–154.<br />
Gamble, T. D., Goubau, W. M., and Clarke, J. (1979). <strong>Magnetotelluric</strong>s with a<br />
remote magnetic reference. Geophyiscs, 44(1), 53–68.<br />
Gatzemeier, A. and Moorkamp, M. (2005). 3D modelling of electrical anisotropy<br />
from electromagnetic array data: hypothesis testing for different upper mantle<br />
conduction mechanisms. Physics of the Earth and Planetary Interios, 149, 225–<br />
242.<br />
Gill, P. E., Murray, W., and Wright, M. H. (1981). Practical optimization. Academic<br />
Press, Inc.<br />
141
References<br />
Haak, V., Simpson, F., Bahr, K., Bigalke, J., Eisel, M., Harms, U., Hirschmann,<br />
G., Huenges, E., Jödicke, H., Kontny, A., Kück, J., Nover, G., Rauen, A., Stoll,<br />
J., Walther, J., Winter, H., Zulauf, G., and Wolfgang, J. (1997). KTB and the<br />
electrical conductivity of the crust. Journal of Geophysical Research, 102, 18289–<br />
18306.<br />
Haber, E. (2005). Quasi-Newton methods for large-scale electromagnetic inverse<br />
problems. Inverse Problems, 21(1), 305–323.<br />
Haber, E. and Oldenburg, D. W. (1997). Joint inversion: a structural approach.<br />
Inverse Problems, 13(1), 63–77.<br />
Haber, E., Asher, U., and Oldenburg, D. (2000). On optimization techniques for<br />
solving nonlinear inverse problems. Inverse Problems, 16, 1263–1280.<br />
Heise, W., Bibby, H. M., Caldwell, T. G., Bannister, S. C., Ogawa, Y., Takakura,<br />
S., and Uchida, T. (2007). Melt distribution beneath a young continental rift: the<br />
Taupo Volcanic Zone, New Zealand. Geophysical Research Letters, 34, L14313.<br />
Hohmann, G. W. (1975). <strong>Three</strong>-<strong>dimensional</strong> induced-polarization and electro-<br />
magnetic modeling. Geophysics, 40, 309–324.<br />
Hoversten, G. M., Morrison, H. F., and Constable, S. C. (1998). Marine magnetotel-<br />
lurics for petroleum exploration, Part II: Numerical analysis of subsalt resolution.<br />
Geophysics, 63, 826–840.<br />
Hoversten, G. M., Newman, G. A., Geier, N., and Flanagan, G. (2006). 3D modeling<br />
of a deepwater EM exploration survey. Geophysics, 71, G239–G248.<br />
Johansen, S. E., Amundsen, H. E. F., Rosten, T., Ellingsrud, S., Eidesmo, T., and<br />
Bhuyian, A. H. (2005). Subsurface hydrocarbons detected by electromagnetic<br />
sounding. First Break, 23, 31–36.<br />
Jones, A. G. and Spratt, J. (2002). A simple method for deriving the uniform field<br />
MT responses in auroral zones. Earth Planets Space, 54, 443–450.<br />
Jones, A. G., Ferguson, I. J., Chave, A. D., Evans, R. L., and McNeice, G. W.<br />
(2001). Electric lithosphere of the Slave craton. Geology, 29, 423–426.<br />
Kelley, C. T. (1999). Iterative methods for optimization. SIAM.<br />
142
References<br />
Key, K. W., Constable, S. C., and Weiss, C. J. (2006). Mapping 3D salt using the<br />
2D marine magnetotelluric method: Case study from Gemini Prospect, Gulf of<br />
Mexico. Geophysics, 71, B17–B27.<br />
Ledo, J., Jones, A. G., Ferguson, I. J., and Wolynec, L. (2004). Lithospheric struc-<br />
ture of the Yukon, northern Canadian Cordillera, obtained from magnetotelluric<br />
data. Journal of Geophysical Research (Solid Earth), 109(B18), B04410.<br />
Li, S., Unsworth, M., Booker, J., Wei, W., Tan, H., and Jones, A. (2003). Partial<br />
melt or aqueous fluid in the mid-crust of southern Tibet? Constraints from IN-<br />
DEPTH magnetotelluric data. Geophysical Journal International, 153, 289–304.<br />
MacGregor, L. M. and Sinha, M. C. (2000). Use of marine controlled source electro-<br />
magnetic sounding for sub-basalt exploration. Geophysical Prospecting, 48, 1091–<br />
1106.<br />
MacGregor, L. M., Andreis, D., Tomlinson, J., and Barker, N. (2006). Controlled-<br />
source electromagnetic imaging on the Nuggets-1 reservoir. The Leading Edge,<br />
25, 984–992.<br />
Mackie, R. L. and Madden, T. R. (1993). <strong>Three</strong>-<strong>dimensional</strong> magnetotelluric inver-<br />
sion using conjugate gradients. Geophysical Journal International, 115, 215–229.<br />
Mackie, R. L., Madden, T. R., and Wannamaker, P. E. (1993). <strong>Three</strong>-<strong>dimensional</strong><br />
mangnetotelluric modeling using difference equations – Theory and comparisons<br />
to integral equation solutions. Geophysics, 58, 215–226.<br />
Mackie, R. L., Smith, J. T., and Madden, T. R. (1994). <strong>Three</strong>-<strong>dimensional</strong> electro-<br />
magnetic modeling using finite difference equations: the magnetotelluric example.<br />
Radio Science, 29(4), 923–935.<br />
Mackie, R. L., Rodi, W., and Watts, M. D. (2001). 3-D magnetotelluric inversion for<br />
resource exploration. In 71st Annual International Meeting Extended Abstracts,<br />
pages 1501–1504. SEG.<br />
Mackie, R. L., Watts, M. D., and Rodi, W. (2007). Joint 3D inversion of marine<br />
CSEM and MT data. SEG Expanded Abstracts, 26, 574.<br />
Macnae, J. and Liu, G., editors (2003). <strong>Three</strong>-Dimensional Electromagnetics - III .<br />
Australian Society of Exploration Geophysicists.<br />
143
References<br />
Mareschal, M., Kellett, R. L., Kurtz, R. D., Ludden, J. N., Ji, S., and Bailey,<br />
R. C. (1995). Archaean cratonic roots, mantle shear zones and deep electrical<br />
anisotropy. Nature, 375, 134–137.<br />
McGillivray, P. R. and Oldenburg, D. W. (1990). Methods for calculating Frechet<br />
derivatives and sensitivities for the non-linear inverse problems. Geophysics, 60,<br />
899–911.<br />
Mitsuhata, Y. and Uchida, T. (2004). 3D magnetotelluric modeling using the T-Ω<br />
finite-element method. Geophysics, 69, 108–119.<br />
Neves, A. S. (1957). The magnetotelluric method in two-<strong>dimensional</strong> structures.<br />
Ph.D. thesis, Massachusetts institute of technology.<br />
Newman, G. A. and Alumbaugh, D. L. (1995). Frequency-domain modeling of<br />
airborne electromagnetic responses using staggered finite differences. Geophysical<br />
Prospecting, 43, 1021–1042.<br />
Newman, G. A. and Alumbaugh, D. L. (2000). <strong>Three</strong>-<strong>dimensional</strong> magnetotelluric<br />
inversion using non-linear conjugate gradients. Geophysical Journal International,<br />
140(2), 410–424.<br />
Newman, G. A. and Boggs, P. T. (2004). Solution accelerators for large-scale three-<br />
<strong>dimensional</strong> electromagnetic inverse problem. Inverse Problems, 20, s151–s170.<br />
Newman, G. A., Recher, S., Tezkan, B., and Neubauer, F. M. (2003). 3D inversion<br />
of a scalar radio magnetotelluric field data set. Geophysics, 68, 791–802.<br />
Ni, Q. and Yuan, Y. (1997). A subspace limited memory quasi-Newton algorithm<br />
for large-scale nonlinear bound constrained optimization. Mathematics of Com-<br />
putation, 66(220), 1509–1520.<br />
Nocedal, J. and Wright, S. J. (1999). Numerical optimization. Springer-Verlag, New<br />
York.<br />
Nover, G. (2005). Electrical properties of crustal and mantle rocks - a review of<br />
laboratory measurements and their explanation. Surveys in Geophysics, 26, 593–<br />
651.<br />
Oristaglio, M. and Spies, B., editors (1999). <strong>Three</strong>-Dimensional Electromagnetics.<br />
Society of Exploration Geophysicists.<br />
144
References<br />
Pellerin, L. (2002). Applications of electrical and electromagnetic methods for envi-<br />
ronmental and geotechnical investigations. Surveys in Geophysics, 23, 101–132.<br />
Polak, E. and Ribiere, G. (1969). Note sur la convergence de methodes de directions<br />
conjuguees. Revue Francaise d’Informatique et de Recherche Operationnelle, 16,<br />
35–43.<br />
Reddy, I. K., Rankin, D., and Philips, R. J. (1977). <strong>Three</strong>-<strong>dimensional</strong> modelling<br />
in magnetotelluric and magnetic variational sounding. Geophysical Journal of the<br />
Royal Astronomical Society, 51, 313–325.<br />
Rodi, W. (1976). A technique for improving the accuracy of finite element solution<br />
for magnetotelluric data. Geophysical Journal of the Royal Astronomical Society,<br />
44, 483–506.<br />
Rodi, W. and Mackie, R. L. (2001). Nonlinear conjugate gradients algorithm for<br />
2-D magnetotelluric inversion. Geophysics, 66(1), 174–187.<br />
Sasaki, Y. (2004). <strong>Three</strong>-<strong>dimensional</strong> inversion of static-shifted magnetotelluric<br />
data. Earth Planets Space, 56, 239–248.<br />
Simpson, F. and Bahr, K. (2005). Practical magnetotellurics. University press,<br />
Cambridge, UK.<br />
Simpson, F. and Tommasi, A. (2005). Hydrogen diffusivity and electrical anisotropy<br />
of a peridotite mantle. Geophysical Journal International, 160, 1092–1102.<br />
Singer, B. S. (1995). Method for solution of maxwell’s equations in non-uniform<br />
media. Geophysical Journal International, 120(3), 590–598.<br />
Siripunvaraporn, W., Egbert, G., and Lenbury, Y. (2002). Numerical accuracy<br />
of magnetotelluric modeling: A comparison of finite difference approximations.<br />
Earth Planets Space, 54, 721–725.<br />
Siripunvaraporn, W., Egbert, G., Lenbury, Y., and Uyeshima, M. (2005). <strong>Three</strong>-<br />
<strong>dimensional</strong> magnetotelluric inversion: data-space method. Physics of the Earth<br />
and Planetary Interios, 150, 3–14.<br />
Tikhonov, A. N. (1950). On determining electric characteristics of the deep layers<br />
of the Earth’s crust. Dokl. Acad. Nauk. SSSR, 73, 295–297.<br />
145
References<br />
Tikhonov, A. N. (1963). Regularization of incorrectly posed problems. Soviet Math-<br />
ematics Doklady, 4, 1624–1627.<br />
Um, E. and Alumbaugh, D. (2005). On the physics of the marine-time-domain<br />
controlled source electromagnetic method for detecting hydrocarbon reservoirs.<br />
In Expanded Abstracts, pages 583–586. Society of Exploration Geophysicists.<br />
Wang, T. and Fang, S. (2001). 3-D electromagnetic anisotrophy modeling using<br />
finite differences. Geophysics, 66, 1386–1398.<br />
Wannamaker, P. E. (1991). Advances in three-<strong>dimensional</strong> magnetotelluric modeling<br />
using integral equations. Geophysics, 56(11), 1716–1728.<br />
Ward, S. H. and Hohmann, G. W. (1987). Electromagnetic theory for geophysical<br />
applications. In M. N. Nabighian, editor, Electromagnetic methods in applied<br />
geophysics, pages 131–311. Society of Exploration Geophysicists, Tulsa.<br />
Weidelt, P. (1975a). Electromagnetic induction in 3D structures. Geophysical Jour-<br />
nal International, 41, 85–109.<br />
Weidelt, P. (1975b). <strong>Inversion</strong> of two-<strong>dimensional</strong> conductivity structures. Physics<br />
of the Earth and Planetary Interios, 10, 281–291.<br />
Xiong, Z. (1999). Domain decomposition for 3D electromagnetic modelings. Earth<br />
Planets Space, 51, 1013–1018.<br />
Yoshioka, K. and Zhdanov, M. S. (2005). Electromagnetic forward modeling based<br />
on the integral equation method using parallel computers. In SEG expanded<br />
abstracts, volume 24, pages 550–553.<br />
Zhdanov, M. S. and Golubev, N. G. (2003). <strong>Three</strong>-<strong>dimensional</strong> inversion of magneto-<br />
telluric data in complex geological structures. Austr. Soc. Expl. Geophys., 20,<br />
550–553.<br />
Zhdanov, M. S. and Tolstaya, E. (2004). Minimum support nonlinear parametriza-<br />
tion in the solution of a 3D magnetotelluric inverse problem. Inverse Problems,<br />
20, 937–952.<br />
Zhdanov, M. S. and Wannamaker, P. E., editors (2002). <strong>Three</strong>-Dimensional Elec-<br />
tromagnetics, Methods in Geochemistry and Geophysics, 35. Elsevier.<br />
146
References<br />
Zhdanov, M. S., Varentsov, I. M., Weaver, J. T., Golubev, N. G., and Krylov, V. A.<br />
(1997). Methods for modelling electromagnetic fields: Results from COMMEMI<br />
- the international project on the comparison of modelling methods for electro-<br />
magnetic induction. Journal of Applied Geophysics, 37, 133–271.<br />
Zyserman, F. and Santos, J. (2000). Parallel finite element algorithm with domain<br />
decomposition for three-<strong>dimensional</strong> magnetotelluric modeling. Journal of Applied<br />
Geophysics, 44, 337–351.<br />
147