Marine electromagnetic induction studies - Marine EM Laboratory
Marine electromagnetic induction studies - Marine EM Laboratory
Marine electromagnetic induction studies - Marine EM Laboratory

Create successful ePaper yourself
Turn your PDF publications into a flip-book with our unique Google optimized e-Paper software.
MARINE E.M. 305<br />
Controlled source <strong>studies</strong> also benefit from the absence of an air wave; propagation<br />
at high frequencies (or short times) is solely through the seafloor, which is usually<br />
the primary region of interest.<br />
All marine electrical methods benefit from the ease with which contact may be<br />
made with the environment. Potential electrode noise is lower than experienced on<br />
land, as temperature, salinity and contact resistance are all nearly constant. Water<br />
choppers (Filloux, 1987) may be used to reduce low frequency electrode noise<br />
(below about 0.01 Hz) even further. Controlled source experiments may use trans-<br />
mission currents of up to 100 A in electric dipoles because a low impedance contact<br />
to seawater is so easily made. Both electric receivers and electric transmitters may<br />
be flown through the water, or dragged across the seabed, while making continuous<br />
electrical contact.<br />
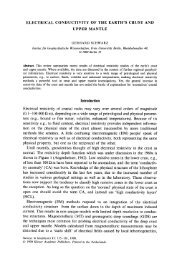
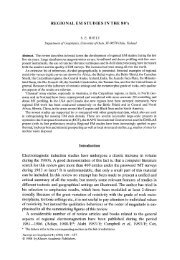
Figure 1 presents a resistivity-depth profile of the oceanic seafloor, based on<br />
borehole logging and soundings by controlled source and M.T. methods. These<br />
experiments will be discussed later in this review, but the figure presents an<br />
instructive summary of seafloor resistivity.<br />
Seawater resistivity is about 0.3 Qm throughout most of the ocean, although it is<br />
as low as half this value in warmer, surface waters. In the oceanic crust, electrical<br />
conductivity is largely controlled by the presence of pore fluids (predominantly<br />
E<br />
10 5<br />
10 4.<br />
10 3<br />
.~ 10 2<br />
re"<br />
101<br />
10 0<br />
@<br />
rll<br />
.><br />
0 0<br />
0<br />
I<br />
I<br />
I<br />
I<br />
I<br />
,, o<br />
"<br />
r~<br />
.,P<br />
o 0<br />
~ m<br />
m,.j<br />
10-1 I I I I I i I I I I lill I I<br />
10-1 10 0<br />
.7_.0<br />
u~<br />
.~'5<br />
8~<br />
I i i i Ii<br />
101<br />
Depth below seafloor, km<br />
l<br />
O<br />
~<br />
~, i...: i<br />
"o .i<br />
0 ~"" i<br />
i i i i i i iii I<br />
10 2<br />
Fig. 1. Seafloor resistivity as a function of depth, based on data from large scale borehole resistivity<br />
and interpretations of controlled source and MT soundings. The lithospheric ages are 6.2, 25 and<br />
30 My respectively.<br />
~