Edwin Jan Klein - Universiteit Twente
Edwin Jan Klein - Universiteit Twente
Edwin Jan Klein - Universiteit Twente

You also want an ePaper? Increase the reach of your titles
YUMPU automatically turns print PDFs into web optimized ePapers that Google loves.
DENSELY INTEGRATED MICRORING-<br />
RESONATOR BASED COMPONENTS FOR<br />
FIBER-TO-THE-HOME APPLICATIONS<br />
<strong>Edwin</strong> <strong>Jan</strong> <strong>Klein</strong>
Promotiecommissie:<br />
Promotor: Prof. Dr. A. Driessen <strong>Universiteit</strong> <strong>Twente</strong><br />
Leden: Prof. Dr. M. Pollnau <strong>Universiteit</strong> <strong>Twente</strong><br />
Prof. Dr. Ir. R. Baets <strong>Universiteit</strong> Gent<br />
Prof. Dr. Ir. W.C. Van Etten <strong>Universiteit</strong> <strong>Twente</strong><br />
Dr. A. Melloni Politecnico di Milano<br />
Dr. Ir. R.G. Heideman LioniX B.V.<br />
Dr. Ir. H. De Waardt Technische <strong>Universiteit</strong><br />
Eindhoven.<br />
The research carried out in this thesis was carried out at the Integrated<br />
Optical Microsystems (IOMS) Group of the MESA Research Institute and the<br />
Faculty of Electrical Engineering, Mathematics and Computer Science<br />
(EEMCS), University of <strong>Twente</strong>, PO. Box 217, 7500 AE Enschede, The<br />
Netherlands.<br />
The work was financially supported by the EC funded IST-Project NAIS, Next-<br />
Generation Active Integrated-Optic Subsystems, (IST-2000-28018), and by<br />
the Dutch Freeband Communication Project “Broadband Photonics”.<br />
Cover design:<br />
The illustration on the cover shows a “Hyper resonator”, so named for its complex resonant<br />
nature. This circuit, given to me by Ronald Dekker as a brainteaser, sat idle on a post-it for<br />
nearly three years after it was first drawn. Since then it has become a taunting symbol of the<br />
complexity of seemingly simple circuits until, at the very end of four years of research, a<br />
simulation tool was finally created that could simulate this and many other circuits.<br />
However, not only this software was created but also several micro-resonator based devices<br />
of such complexity that they required packaging and the development of control electronics<br />
before being able to operate. As such the three inner circles in the “Hyper resonator” have<br />
also come to symbolize the three pillars that form the basis of this thesis is: simulation<br />
software, fabricated optical devices and their controlling hardware. Without the development<br />
of any one of these this thesis might have looked quite different…<br />
Copyright © 2007 <strong>Edwin</strong> <strong>Jan</strong> <strong>Klein</strong>, Enschede, The Netherlands.<br />
ISBN 978-90-365-2495-7
DENSELY INTEGRATED MICRORING-<br />
RESONATOR BASED COMPONENTS FOR<br />
FIBER-TO-THE-HOME APPLICATIONS<br />
PROEFSCHRIFT<br />
Ter verkrijging van<br />
de graad van doctor aan de <strong>Universiteit</strong> <strong>Twente</strong>,<br />
op gezag van de rector magnificus,<br />
prof. dr. W.H.M. Zijm,<br />
volgens besluit van het College voor Promoties<br />
in het openbaar te verdedigen<br />
op 11 April 2007 om 15.00 uur<br />
door<br />
<strong>Edwin</strong> <strong>Jan</strong> <strong>Klein</strong><br />
geboren op 20 januari 1976<br />
te Zwolle
Dit proefschrift is goedgekeurd door:<br />
Prof. Dr. Alfred Driessen
To my parents…
i<br />
Abstract<br />
This thesis describes the design, realization and characterization of densely integrated<br />
optical components based on thermally tunable microring resonators fabricated in<br />
Si3N4/SiO2.<br />
Chapter 1 “Introduction”<br />
In this chapter a brief introduction and overview are given of current broadband<br />
communication networks to provide a background for the work presented in this<br />
thesis. Current copper based networks are unable to meet future bandwidth demands<br />
and will therefore be slowly replaced with optical networks. A promising technology<br />
for these networks is WDM-PON. Currently, however, this technology is too<br />
expensive. The Broadband Photonics and NAIS projects within which the presented<br />
work was carried out both seek to lower the cost of WDM-PON implementations<br />
through dense integration of reconfigurable optical components based on optical<br />
microring resonators.<br />
Chapter 2 “The micro-resonator”<br />
In the second chapter the operating principle of a microring resonator is explained and<br />
the basic parameters that govern its operation are introduced. The filter frequencydomain<br />
responses for single as well as serial higher order systems based on two<br />
resonators are derived. Solutions for typical problems that occur when designing<br />
resonators such as a Free Spectral Range (FSR) that is too small or a filter shape that<br />
does not meet the desired specifications are also given.<br />
Chapter 3 “Design”<br />
In the third chapter the design of microring resonator based devices is discussed in<br />
general terms. Several performance parameters are introduced that can be used to<br />
translate the requirements of a certain application into specific values of the basic<br />
microring resonator parameters.<br />
For microring resonators with a radius of 50 µm (FSR≈4.2 nm) , which is the case for<br />
most of the devices presented in this thesis, it is shown that for telecom applications a<br />
good target for the field coupling coefficients is between 0.4 and 0.6 when reasonable<br />
losses of 2 dB/cm are assumed for the resonator. The methodologies for creating an<br />
actual resonator design from these basic parameters are also given. In addition design<br />
aspects on a device level (the whole device layout) are discussed. Here it is shown<br />
that for these resonators the miniaturization of devices that incorporate these
esonators is limited by the spacing of the fibers in the fiber array used for pigtailing<br />
rather than the size of the individual resonators.<br />
Chapter 4 “Simulation and analysis”<br />
In Chapter 4 some of the tools that were created to aid in the design and<br />
characterization of microring resonator based devices are presented. In particular the<br />
analytical and numerical methods used to fit measured resonator responses are<br />
examined in detail. Another tool that is discussed is Aurora, a tool that was created to<br />
perform simulations on complex optical circuits containing resonators. The<br />
simulations performed by Aurora are time-domain based. Although the simulation<br />
principle, based on the delayed forwarding of signals between optical components, is<br />
fairly simple, it is nonetheless very powerful and allows for a very fast simulation of<br />
highly complex optical circuits.<br />
Chapter 5 “Fabrication”<br />
In Chapter 5 three distinct fabrication processes are described. Each process was<br />
designed for a specific resonator type. The simplest process was designed for laterally<br />
coupled resonators. This process does not suffer from resonator misalignment but is<br />
critical where the resolution of the lithography is concerned. A more complex process<br />
was designed for vertically coupled resonators. The lithographic requirements of this<br />
process are less important although the process is highly susceptible to resonator<br />
misalignment. The most elaborate fabrication process is based on stepper lithography.<br />
This allows for very small feature sizes as well as a high alignment accuracy which is<br />
very important from a device yield perspective. The only downside is that the<br />
maximum size of devices is limited to 22 by 22 mm. However, devices made in a<br />
materials system with a high index contrast such as Si3N4/SiO2 will often be smaller<br />
than this. The stepper process also included chemical mechanical polishing of the<br />
separation layer between the ring resonator and the port waveguides in order to reduce<br />
the losses in the resonator caused by an abrupt “lifting” of the resonator on top of the<br />
port waveguides.<br />
Chapter 6 “Microring-resonator building blocks”<br />
In Chapter 6 the design of a basic resonator building block is given. This building<br />
block is based on a 2.0 x 0.14 µm port waveguide from where the light is coupled into<br />
a ring resonator that has waveguide dimensions of 2.5 x 0.18 µm and a radius of 50<br />
µm. On top of the resonator a heater is placed to be able to shift its resonance<br />
wavelength. Depending on the resonator radius (25 or 50 µm) and the thickness of the<br />
cladding layer on top of the resonator (3 or 4 µm) resonance shifts between 7 pm/mW<br />
and 21 pm/mW have been observed. By using an overshoot in the electrical signal<br />
that drives the heater, thermal modulation frequencies up to 10 KHz could be<br />
observed. Also demonstrated in this chapter is a wavelength selective optical switch<br />
based on two cascaded resonators. The switch measures only 200 µm x 200 µm. The<br />
“on/off” attenuation of the switch is 12 dB. When the switch is “on” the crosstalk with<br />
the adjacent channels is ≈-20 dB (channel spacing of 0.8 nm). The on chip insertion<br />
loss of the switch is around 5 dB. A Vernier resonator based on two resonators with a<br />
radius of 46 µm and 55 µm is also demonstrated. The combined FSR is ≈28 µm.<br />
ii
Chapter 7 “Densely integrated devices for WDM-PON”<br />
In Chapter 7 the design and characterization of two different types of OADM, for use<br />
at 1310 nm or at 1550 nm, and a Router are discussed. The 1550 nm OADM could be<br />
fully tuned and could be configured to drop one or more channels. In addition system<br />
level measurements were performed in this OADM. A 40 Gbit/s could be dropped to<br />
a single channel without a significant penalty in BER. In addition multicasting was<br />
demonstrated. The same reconfigurability was also shown for the 1300 nm OADM.<br />
Finally the 1300 nm router is discussed and basic functionality of the router, dropping<br />
one, two or three channels to a single output is demonstrated.<br />
Chapter 8 “Polarization independent devices”<br />
A major problem of microring resonator based devices is that it is often very difficult<br />
to make them polarization independent. Although this can by solved by introducing<br />
polarization diversity in the devices this also doubles the number of resonators and<br />
creates a number of new problems. In Chapter 8 a method is described where a single<br />
microring resonator is used bi-directionally so that a single resonator effectively<br />
operates as if two resonators are present. The number of resonators that is required to<br />
implement polarization diversity in a device is therefore more or less the same (there<br />
is a minor overhead) as the number of resonators in an implementation that uses<br />
polarization independent resonators.<br />
Chapter 9 “Discussion and conclusions”<br />
Finally, in Chapter 9, conclusions are drawn based on the results presented in this<br />
thesis.<br />
iii
iv<br />
Samenvatting<br />
Dit proefschrift beschrijft het ontwerp, de realisatie en de karakterisatie van hoog<br />
geïntegreerde optische componenten gebaseerd op thermisch verstembare microring<br />
resonatoren in het Si3N4/SiO2 materiall system.<br />
Hoofdstuk 1 “Introductie”<br />
In dit hoofdstuk worden een korte introductie en overzicht gegeven van huidige<br />
breedband communicatie netwerken om een achtergrond te geven van het onderzoek<br />
dat gepresenteerd wordt in dit proefschrift. Huidige netwerken gebaseerd op koper<br />
zijn niet in staat om tegemoet te komen aan de toekomstige vraag om bandbreedte van<br />
de consument. Daardoor worden deze geleidelijk aan vervangen door optische<br />
netwerken. Een veelbelovende techniek hiervoor is WDM-PON. Op dit moment<br />
echter, is deze technologie nog te duur voor gebruik. urrently, however, this<br />
technology is too expensive. De Broadband Photonics en NAIS projecten waarbinnen<br />
het werk dat gepresenteerd wordt in deze thesis is uitgevoerd hadden beide als<br />
belangrijke doelstelling om de kosten van een WDM-PON network te reduceren. Dit<br />
door zeer hoog geïntegreerde en reconfigureerbare optische componenten te<br />
ontwikkelen op basis van microring resonatoren.<br />
Hoofdstuk 2 “De micro-resonator”<br />
In het tweede hoofdstuk wordt de werking van de microring resonator uitgelegd en<br />
worden de basis parameters die de werking van de resonator bepalen geïntroduceerd.<br />
De frequentie domein filter responses van enkele alsook van twee seriëel gekoppelde<br />
resonatoren worden afgeleid. Oplossingen voor typische problemen die voor kunnen<br />
komen bij het ontwerp van micro resonatoren zoals een Free Spectral Range (FSR)<br />
die te klein is of een filter vorm die niet voldoet aan de specificaties worden ook<br />
aangedragen.<br />
Hoofdstuk 3 “Ontwerp”<br />
In het derde hoofdstuk wordt het ontwerp van microring resonatoren besproken in<br />
algemene termen. Een aantal performance parameters worden geïntroduceerd die<br />
gebruikt kunnen worden om gewenste specificaties van een applicatie te vertalen in<br />
specifieke waarden van de basis parameters.<br />
Voor microring resonatoren met een radius van 50 µm (FSR≈4.2 nm) , zoals geldt<br />
voor de meeste resonatoren die gepresenteerd worden in dit proefschrift, wordt<br />
aangetoond dat een goed doelgebied voor de veld koppelings coëfficienten ligt tussen<br />
0.4 en 0.6 als redelijke bochtverliezen van 2 dB/cm worden aangenomenn voor de<br />
resonator. De methodieken voor het ontwerpen van een resonator aan de hand van<br />
deze basis parameters worden ook gegeven. Voorts wordt er ingegaan op de ontwerp
aspecten op component niveau (betreffende de gehele device layout). Een conclusie<br />
die hier getrokken wordt, is dat de gegeven resonatoren niet de limiterende factor voor<br />
verdere miniaturisatie zijn. Echter, de afstand van 250 µm van de fibers in een fiber<br />
array zorgt ervoor dat de componenten niet verder verkleind kunnen worden.<br />
Hoofdstuk 4 “Simulatie en analyse”<br />
In hoofdstuk 4 worden een aantal van de programma’s die gemaakt zijn om te helpen<br />
bij het ontwerp en de analyse van op microring resonator gebaseerde componenten<br />
gepresenteerd. In het bijzonder worden de analytische en numerieke algoritmes<br />
besproken die gebruikt worden voor het fitten van gemeten microring resonator<br />
responses. Een ander programma dat besproken wordt, is Aurora, een<br />
simulatieprogramma dat special gebouwd werd om simulaties te kunnen doen aan<br />
complexe optische schakelingen die microring resonatoren bevatten.<br />
Hoofdstuk 5 “Fabricage”<br />
In hoofdstuk 5 worden drie specifieke fabricage processen beschreven. Elk proces is<br />
bedoeld om gebruikt te worden om een specifiek soort resonator te fabriceren. Het<br />
meest eenvoudige proces is bedoeld voor het fabriceren van lateral gekoppelde<br />
resonatoren. Dit proces is ongevoelig voor resonator plaatsing ten opzichte van de<br />
poort golfgeleiders maar is kritisch wat betreft de resolutie van de lithografie. Een<br />
enigszins ingewikkelder proces werd gebruikt voor de fabricage van vertikaal<br />
gekoppelde resonatoren. De lithografische resolutie is van minder belang in dit<br />
proces. Dit process is echter zeer gevoelig voor de uitlijning van de resonator op de<br />
poort golfgeleiders. Het meest uitvoerige proces werd gebruikt voor de fabricage van<br />
resonatoren met behulp van stepper lithografie. Met stepper lithografie kan een hoge<br />
lithografische resolutie behaald worden alsook een goede uitlijning wat zeer<br />
belangrijk is met het oog op het reduceren van uitval van gefabriceerde componenten.<br />
The most elaborate fabrication process is based on stepper lithography. Het enige<br />
minpunt is dat de maximum grootte van de componenten is gelimiteerd tot ongeveer<br />
22 bij 22 mm. Echter, componenten die gemaakt worden in een hoog contrast material<br />
system zoals Si3N4/SiO2 zullen niet snel deze grootte bereiken. In het fabricage proces<br />
gebruikt in combinatie met de stepper, werd ook chemisch mechanisch polijsten<br />
toegepast op de laag tussen de poort golfgeleiders en the ring resonator. Dit om de<br />
verliezen te reduceren die optraden bij het plotselinge “oplichten” van de resonator<br />
golfgeleider op de locatie van de poort golfgeleiders.<br />
Hoofdstuk 6 “Microring-resonator bouw blokken”<br />
In hoofdstuk 6 wordt het ontwerp van een microring resonator bouw blok gegeven.<br />
Dit bouw blok is gebaseerd op een 2.0 x 0.14 µm poort golfgeleider vanwaar licht<br />
ingekoppeld in een ring resonator met een kanaal afmeting van 2.5 x 0.18 µm en een<br />
radius van 50 µm. Bovenop deze resonator is een verwarmingselement geplaatst<br />
waarmee de resonantie golflengte verstemd kan worden. Afhankelijk van de radius<br />
van de ring resonator (25 of 50 µm) en de dikte van de buffer lag bovenop de<br />
resonator (3 of 4 µm) warden resonantie verschuivingen van 7 pm/mW tot 21 pm/mW<br />
waargenomen. Door gebruikmaking van pulsvorming in het electrisch<br />
aansturingssignaal van het verwarmingselement konden thermische modulatie<br />
frequenties gehaald worden tot 10 KHz. In dit hoofdstuk word took een golflengte<br />
afhankelijke optische schakelaar besproken welke is gebaseerd op twee in serie<br />
geschakelde microring resonatoren. De oppervlakte van de schakelaar is slechts 200<br />
µm x 200 µm. De “aan/uit” signal onderdrukking van de schakelaar 12 dB. Als de<br />
v
schakelaar “aan” is, dan is de overspraak met de naastgelegen kanalen ≈-20 dB (bij<br />
een kanaal afstand van 0.8 nm). De op-chip signal verlizen zijn rond de 5 dB. Een<br />
Vernier resonator gebaseerd op twee ringen met een radius van 46 µm en 55 µm<br />
wordt ook gepresenteerd. De gecombineerde FSR van deze resonator is ≈28 µm.<br />
Hoofdstuk 7 “Hoog geïntegreerde optische componenten voor WDM-PON”<br />
In hoofdstuk 7 worden het ontwerp en de karakterisatie van twee types OADM,<br />
werkend bij 1310 nm en 1550 nm, en een Router besproken. De 1550 nm OADM kon<br />
volledig worden geconfigureerd om een enkel of meerdere kanalen te droppen.<br />
Systeem niveau metingen uitgevoerd aan de OADM lieten zien dat een 40 Gbit/s<br />
gedropped kon worden naar een enkele drop poort zonder een significante penalty in<br />
de BER. Tevens is er multicasting gedemonstreerd. De 1300 nm OADM kon op<br />
gelijke wijze worden geconfigureerd. Basis functionaliteit van de 1300 nm router kon<br />
ook worden aangetoond door het droppen van een, twee of drie kanalen naar een<br />
enkele drop poort.<br />
Hoofdstuk 8 “Polarisatie onafhankelijke componenten”<br />
Een groot probleem bij op microring resonator gebaseerde componenten is dat het<br />
vaak moeilijk is om deze polarisatie onafhankelijk te maken. Hoewel dit opgelost kan<br />
worden door het gebruik van polarisatie diversiteit in de componenten, verdubbeld dit<br />
ook het aantal benodigde microring resonatoren en creëert tevens een aantal nieuwe<br />
problemen. In hoofdstuk 8 wordt een methode gepresenteerd waarbij een enkele<br />
microring resonator bidirectioneel wordt gebruikt zodat deze effectief werkt als twee<br />
resonatoren. Het aantal resonatoren wat nodig is voor het implementeren van<br />
polarisatie diversiteit kan daardoor vrijwel gelijk blijven (er is een kleine toename)<br />
aan het aantal resonatoren in een component gebaseerd op polarisatie onafhankelijke<br />
resonatoren.<br />
Hoofdstuk 9 “Discussie and conclusie”<br />
Ten slotte, in hoofdstuk 9, worden er conclusies getrokken gebaseerd op de resultaten<br />
die gepresenteerd zijn in dit proefschrift.<br />
vi
Contents<br />
ABSTRACT ............................................................................................................................................ I<br />
SAMENVATTING.............................................................................................................................. IV<br />
CHAPTER 1 INTRODUCTION...........................................................................................................1<br />
1.1 PREFACE.........................................................................................................................................2<br />
1.2 BROADBAND TO THE HOME.............................................................................................................3<br />
1.3 BRINGING FIBER TO THE HOME ......................................................................................................5<br />
1.3.1 Passive optical networks........................................................................................................5<br />
1.3.2 Ethernet Point to Point networks ...........................................................................................5<br />
1.3.3 Wavelength Division Multiplexed PON .................................................................................6<br />
1.4 PROJECTS........................................................................................................................................6<br />
1.4.1 NAIS.......................................................................................................................................6<br />
1.4.2 Broadband Photonics.............................................................................................................7<br />
1.5 OUTLINE.........................................................................................................................................8<br />
CHAPTER 2 THE MICRO-RESONATOR.......................................................................................11<br />
2.1 INTRODUCTION .............................................................................................................................12<br />
2.2 OPERATIONAL DESCRIPTION .........................................................................................................12<br />
2.2.1 Four port filter operation.....................................................................................................13<br />
2.1.2 Transient resonator behavior...............................................................................................14<br />
2.3 MICRORING RESONATOR MODEL ..................................................................................................15<br />
2.3.1 Directional coupler model ...................................................................................................15<br />
2.3.2 Ring waveguide model .........................................................................................................17<br />
2.3.3 Combined model ..................................................................................................................18<br />
2.4 SPECTRAL RESPONSE OF A SINGLE RESONATOR ............................................................................18<br />
2.4.1 The drop response................................................................................................................19<br />
2.4.2 The through response...........................................................................................................21<br />
2.5 MR FILTER BANDWIDTH VERSUS REJECTION RATIO......................................................................22<br />
2.6 MULTIPLE-RESONATOR FILTERS ...................................................................................................24<br />
2.7 VERNIER OPERATION ....................................................................................................................29<br />
2.8 RESONATOR TUNING.....................................................................................................................31<br />
2.8.1 Wavelength tuning methods .................................................................................................31<br />
2.8.2 Wavelength tuning range .....................................................................................................34<br />
2.8.3 Filter shape tuning...............................................................................................................36<br />
2.8.3.1 Changing the field coupling coefficients................................................................................ 36<br />
2.8.3.2 Changing the resonator attenuation ...................................................................................... 37<br />
CHAPTER 3 DESIGN .........................................................................................................................39<br />
3.1 INTRODUCTION .............................................................................................................................40<br />
3.2 THE MICRO-RESONATOR USED IN TELECOM APPLICATIONS...........................................................41<br />
3.2.1 Drop port on-resonance insertion loss.................................................................................42<br />
3.2.2 Filter rejection ratio.............................................................................................................43<br />
3.2.3 Filter bandwidth...................................................................................................................44<br />
3.2.4 Channel Crosstalk................................................................................................................45<br />
3.2.5 Through port insertion loss..................................................................................................46<br />
3.2.6 Through port on-resonance residual power.........................................................................47<br />
3.2.7 Design parameter summary.................................................................................................49<br />
3.3 GEOMETRICAL DESIGN CHOICES ...................................................................................................50<br />
3.3.1 Micro-resonator geometry ...................................................................................................50<br />
3.3.2 Vertical or lateral coupling..................................................................................................51<br />
3.4 MATERIAL SYSTEM.......................................................................................................................53<br />
3.5 VERTICAL RESONATOR DESIGN.....................................................................................................55<br />
3.5.1 Resonator design..................................................................................................................55<br />
3.5.2 Resonator propagation losses..............................................................................................56<br />
3.5.3 Determination of the coupling coefficients ..........................................................................57<br />
3.6 LATERAL RESONATOR DESIGN ......................................................................................................59<br />
3.6.1 Port waveguide and resonator design..................................................................................60<br />
vii
3.6.2 Overlap loss reduction.........................................................................................................61<br />
3.6.3 Setting the lateral field coupling coefficient ........................................................................63<br />
3.7 COMPONENT DESIGN CONSIDERATIONS ........................................................................................64<br />
3.7.1 Creating a design layout for pigtailing purposes.................................................................65<br />
3.7.2 Tapers ..................................................................................................................................66<br />
3.7.3 Optimal port waveguide bend radius...................................................................................67<br />
CHAPTER 4 SIMULATION AND ANALYSIS .................................................................................69<br />
4.1 INTRODUCTION .............................................................................................................................70<br />
4.2 MICRO-RESONATOR INVESTIGATOR.............................................................................................71<br />
4.2.1 Transient response...............................................................................................................72<br />
4.2.2 Increasing the computational efficiency ..............................................................................74<br />
4.3 RFIT .............................................................................................................................................75<br />
4.4 DROPZONE ...................................................................................................................................77<br />
4.5 AURORA .......................................................................................................................................81<br />
4.5.1 Architecture..........................................................................................................................82<br />
4.5.2 Simulation method ...............................................................................................................84<br />
4.5.2.1 Primitives ................................................................................................................................... 84<br />
4.5.2.2 The execution engine .............................................................................................................. 88<br />
4.5.3 Validation of the simulation method ....................................................................................91<br />
4.5.4 Strengths and weaknesses of the simulation method............................................................96<br />
4.5.4.1 Simulation strengths ................................................................................................................ 96<br />
4.5.4.2 Simulation weakness ............................................................................................................... 99<br />
4.5.5 Simulations on complex structures.....................................................................................102<br />
4.5.5.1 The hyper-resonator .............................................................................................................. 102<br />
4.5.5.2 Simulation of a waveguide grating....................................................................................... 104<br />
CHAPTER 5 FABRICATION ..........................................................................................................109<br />
5.1 INTRODUCTION ...........................................................................................................................110<br />
5.2. FABRICATION AND MASK DESIGN OF LATERALLY COUPLED RESONATORS .................................111<br />
5.2.1 Fabrication ........................................................................................................................111<br />
5.2.2 Mask layout........................................................................................................................113<br />
5.3. FABRICATION AND MASK DESIGN OF VERTICALLY COUPLED RESONATORS DEFINED USING<br />
CONTACT LITHOGRAPHY...................................................................................................................115<br />
5.3.1 Fabrication ........................................................................................................................115<br />
5.3.2 Packaging ..........................................................................................................................116<br />
5.3.3 Mask layout........................................................................................................................118<br />
5.4. FABRICATION AND MASK DESIGN OF VERTICALLY COUPLED RESONATORS DEFINED USING<br />
STEPPER LITHOGRAPHY ....................................................................................................................120<br />
5.4.1 Stepper lithography and mask design ................................................................................120<br />
5.4.2 Fabrication ........................................................................................................................124<br />
CHAPTER 6 MICRORING-RESONATOR BUILDING BLOCKS.............................................129<br />
6.1 INTRODUCTION ...........................................................................................................................130<br />
6.2 A VERTICALLY COUPLED MICRORING RESONATOR BASED BUILDING BLOCK...............................131<br />
6.2.1 Dimensions of the oxide layers ..........................................................................................133<br />
6.2.2 Dimensions of the resonator and port waveguides ............................................................134<br />
6.2.3 Chromium heater design....................................................................................................138<br />
6.2.4 Heater characterization .....................................................................................................141<br />
6.3 CHARACTERIZATION OF SINGLE, VERTICALLY COUPLED MICRORING RESONATORS ....................144<br />
6.3.1 Measurement setup ............................................................................................................144<br />
6.3.2 The importance of phase-matching and the fitting of resonator responses........................147<br />
6.3.3 Microring resonator thermal tuning and modulation frequency .......................................151<br />
6.4 A WAVELENGTH SELECTIVE OPTICAL SWITCH BASED ON MICRORING RESONATORS ...................154<br />
6.4.1 Switch design .....................................................................................................................154<br />
6.4.2 Characterization ................................................................................................................155<br />
6.4.3 Vernier switch ....................................................................................................................156<br />
CHAPTER 7 DENSELY INTEGRATED DEVICES FOR WDM-PON.......................................159<br />
7.1 INTRODUCTION ...........................................................................................................................160<br />
7.2. A RECONFIGURABLE ADD-DROP MULTIPLEXER BASED ON MICRORING RESONATORS...............163<br />
viii
7.2.1 Design and fabrication.......................................................................................................163<br />
7.2.1 Spectral measurements ......................................................................................................165<br />
7.2.2 Spectral measurements ......................................................................................................167<br />
7.3 FLEXIBLE Λ-MULTICASTING ROUTER FOR USE IN ACCESS NETWORKS........................................169<br />
7.3.1 Router implementation using micro-resonators.................................................................169<br />
7.3.2 Router design................................................................................................................171<br />
7.3.3 Improved OADM design...............................................................................................174<br />
7.3.4 Characterization...........................................................................................................175<br />
7.3.4.1 Characterization of the OADM ............................................................................................. 176<br />
7.3.4.2 Characterization of the Router ............................................................................................. 179<br />
CHAPTER 8 POLARIZATION INDEPENDENT DEVICES.......................................................183<br />
8.1 INTRODUCTION ...........................................................................................................................184<br />
8.2 POLARIZATION DIVERSITY ..........................................................................................................185<br />
8.3 POLARIZATION INDEPENDENCE THROUGH BI-DIRECTIONAL USE OF THE MICRO-RESONATOR .....186<br />
8.4 POLARIZATION DIVERSE ROUTER ...............................................................................................189<br />
CHAPTER 9 DISCUSSION AND CONCLUSIONS ......................................................................193<br />
APPENDIX A. MASON’S RULE .....................................................................................................195<br />
APPENDIX B. CROSSTALK DERIVATION ................................................................................197<br />
LIST OF ACRONYMS......................................................................................................................199<br />
LIST OF SYMBOLS..........................................................................................................................201<br />
BIBLIOGRAPHY ..............................................................................................................................203<br />
PUBLICATION LIST........................................................................................................................215<br />
DANKWOORD/ACKNOWLEDGEMENTS ..................................................................................221<br />
ix
Chapter 1<br />
Introduction<br />
The devices discussed in this thesis all have an intended<br />
application in a WDM-PON access network. This type of<br />
network is seen as a possible successor to current network<br />
solutions such as PON and ADSL in order to satisfy the ever<br />
increasing bandwidth demands from consumers. The reasons<br />
for this are explained in this chapter by providing a short<br />
history and overview on the rise of fiber optic networks and<br />
competing broadband technologies. In addition a description is<br />
given of the two projects within which the work presented in<br />
this thesis was carried out.
Chapter 1<br />
1.1 Preface<br />
In the late 80’s and 90’s of the past century an unprecedented overhaul of world<br />
Telecommunications took place. By 1999 [1] almost half of the 189 members of the<br />
International Telecommunication Union had at least partially privatized their telecom<br />
operators. The privatization of traditional telecom operators caused a surge in cross<br />
border acquisitions and mergers and eventually gave rise to transnational systems that<br />
superseded national carriers in scope and function.<br />
In every economic sector corporate networks invested billions in hardware and<br />
software needed to enlarge and modernize their proprietary systems. Fueled by<br />
proclamations of business and academic commentators of an information revolution<br />
and promises that the internet backbone requirements would double every 3.7 months<br />
[2] financial markets were only too happy to answer calls from existing and would-be<br />
network suppliers and technology-startups. In the last two years of the telecom boom<br />
alone $35 billion was spent by companies worldwide, laying 160 million kilometers<br />
of optical fiber for broadband networks.<br />
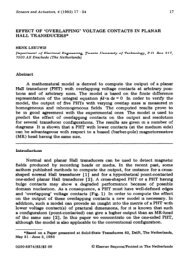
Then, in late 2000, the bubble burst. As Figure 1.1 shows, capital expenditures hugely<br />
outpaced revenues and by 2001 only 5% of the 160 million km of fiber laid out<br />
worldwide had been “lit”[3].<br />
Figure 1.1. Capital expenditures and profit growth in the late 1990’s.<br />
(Source: Optical Oracle, Light Reading)<br />
Within a year large companies such as Lucent and Nortel saw their revenues fall by<br />
42% and 39% percent respectively [4] whilst the entire industry lost nearly 500.000<br />
jobs and $2 trillion in market value [2]. The industry was down but not out however.<br />
Whilst investments virtually froze to a standstill the bandwidth demands of consumers<br />
never ceased to increase. This eventually sparked renewed interest from the industry<br />
in recent years with major business activities started in 2003 and 2004 to bring fiber<br />
with higher bandwidth capabilities of up to 100 Mbps to the consumer [5]. Currently<br />
though the consumer market is still dominated by competing broadband technologies<br />
such as Digital Subscriber Line (DSL) and Cable.<br />
2
1.2 Broadband to the home<br />
3<br />
Introduction<br />
DSL and Cable technologies will be the dominant medium to bring broadband to the<br />
consumer for many years to come, as the forecast in Figure 1.2 shows, with an<br />
expected number of subscribers surpassing 370 million in 2010. These technologies<br />
have been natural candidates for broadband access because they can use the often<br />
installed base of copper wire for telephony and coaxial cable for television but allow<br />
significant gains in bandwidth compared with dial-up modems. The overall cost for<br />
broadband access for both the consumer and network provider can thus be<br />
significantly lower than competing solutions such as fiber and wireless.<br />
Figure 1.2. Global broadband subscriber forecast until 2010.<br />
(Source: Broadbandtrends.com)<br />
In using these technologies, however, there is always a compromise. While cable<br />
typically offers about double the bandwidth of DSL it is a shared bandwidth solution<br />
where the bandwidth per user scales down with the number of subscribers. Likewise<br />
DSL is hampered by the fact that there is always a compromise between bandwidth<br />
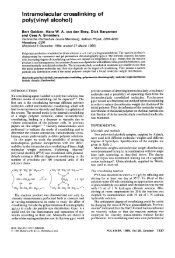
and distance to the subscriber due to its electrical nature. This is also illustrated in<br />
Figure 1.3 that shows the maximum bit rate versus distance for a number of DSL<br />
implementations [6,7,8]. Currently most countries have deployed Asymmetric Digital<br />
Subscriber Line (ADSL), with bit rates up to 8 Mbps, but the faster standards such as<br />
ADSL2 and ADSL2+ are rapidly introduced. The ADSL2+ standard can support bit<br />
rates of up to 25 Mbps for distances less than 900 meters.<br />
At these distances ADSL2+ is a significant competitor to Fiber-to-the-Home (FTTH)<br />
in locations where the average distance to the subscriber is low. This is evidenced in<br />
Europe where, due to its high population density, the dominating focus is on xDSL in<br />
contrast to the less densely populated United States where, in part due to recent<br />
investments by Verizon, fiber is gaining momentum.<br />
Population density is not the only factor, however; government regulation can also<br />
play an important role. In a densely populated country as Japan for instance, xDSL<br />
would be the favorable solution in terms of cost. Instead FTTH is the preferred option.<br />
FTTH in Japan has undergone rapid deployment with commercial activities started in<br />
2001 [5]. This is largely due to Japanese government policy and the Nippon
Chapter 1<br />
Telegraph and Telephone Corporation (NTT) that have already focused on optical<br />
fiber for over 20 years.<br />
Data rate (Mbps)<br />
60<br />
50<br />
40<br />
30<br />
20<br />
10<br />
0<br />
0 1 2 3 4 5 6<br />
Loop length (km)<br />
As a result the country already has a Fiber-to-the-Curb (FTTC) infrastructure which<br />
helps to reduce the cost of FTTH deployment. In addition aerial fiber is allowed<br />
which speeds up deployment and reduces cost.<br />
Interestingly, xDSL can also be seen as a driving force behind FTTH rather than a<br />
major competitor. Currently subscriber demand for triple play services, which<br />
combine internet, telephony and high definition television (HDTV), is on the rise. In<br />
addition a bandwidth race is developing due to increased competition between<br />
operators with broadband sold on a speed/price formula. Here dropping prices and<br />
clever marketing will lead subscribers to want bandwidth far beyond what they<br />
actually require. Network operators have to respond to this with ever faster xDSL<br />
offerings. In this respect Japan offers a glimpse of the future.<br />
Japanese fiber networks are often of the Fiber-to-the-Building (FTTB) type where<br />
fiber can terminate optically for individual homes. They can, however, also be<br />
completed by a Very high bit-rate Digital Subscriber Line (VDSL) network in an<br />
apartment building. For short distances less than 300m the VDSL and the faster<br />
VDSL2 (up to 100 Mbps) solutions can deliver fast broadband using conventional<br />
copper lines. By combining FTTC or FTTB with VDSL network operators can<br />
therefore provide more economic high bandwidth connections since not every<br />
subscriber requires a costly direct fiber connection [9].<br />
Since VDSL is not fundamentally different from the current ADSL implementations -<br />
all use the same Discrete Multi-Tone (DMT) line-coding method - it shows a<br />
migratory path to be taken by network operators in Europe. These can slowly and<br />
economically upgrade current ADSL and ADSL2 networks to VDSL supported by<br />
fiber, all driven by consumer demand. The demand for faster DSL thus brings the<br />
fiber networks that support the DSL ever closer to the subscriber until finally fully<br />
fledged FTTH networks are created.<br />
4<br />
ADSL2+<br />
ADSL2<br />
ADSL<br />
VDSL<br />
Figure 1.3. DSL Loop length versus data rate.
1.3 Bringing Fiber to the Home<br />
5<br />
Introduction<br />
The last link between the subscriber and the first point of connection to a network<br />
infrastructure is the so-called Access Network (AN). The previously mentioned xDSL<br />
and FTTH as well as other technologies such as Cable and Wireless (WIFI) are<br />
possible implementations of this network. Within the access network FTTH may be<br />
implemented in several topologies. The two main competing topologies are Ethernet<br />
Point to Point (P2P) and the Passive Optical Network (PON) in the form of Ethernet<br />
PON (EPON) or the newer Gigabit PON (GPON).<br />
1.3.1 Passive optical networks<br />
Passive optical networks were first introduced in the 1980’s. Since prices for fiber<br />
optic cable and optical transceivers were very high at the time a topology was devised<br />
that could share these resources. To this end PON networks use a Point to Multi-Point<br />
(P2MP) topology as shown in Figure 1.4a.<br />
Figure 1.4a. Passive optical network. Figure 1.4b. Ethernet based Point to point<br />
network.<br />
In this topology an Optical Line Terminal (OLT) at the head office is connected to a<br />
single strand of fiber that goes out to a passive optical splitter near the customers’<br />
premises. Here the signal is typically divided into 32 different lines using a passive<br />
splitter. Each of these lines is connected to an Optical Network Unit (ONU) on a<br />
customers’ premise. Downstream data is therefore transmitted to all users with each<br />
ONU having to determine which packets are for that customer. The PON uses one<br />
wavelength for downstream traffic and another for upstream traffic. The latest<br />
specifications call for downstream traffic from the OLT to the ONU to be transmitted<br />
at a wavelength 1490 nm while upstream traffic is transmitted from the ONU at 1310<br />
nm [10].<br />
1.3.2 Ethernet Point to Point networks<br />
In an Ethernet point to point network each customers’ ONU has a direct fiber<br />
connection to a central router at the Head Office (HO) or an aggregation router in the<br />
street cabinet, as shown in Figure 1.4b. Like the PON the point to point network uses<br />
one wavelength for downstream traffic and another for upstream traffic. In the past<br />
the cost of optical fiber and transceivers, as well as the maintenance cost of the active<br />
components in the field, has been prohibitive in the deployment of P2P networks.
Chapter 1<br />
Today, however, the cost of optical fiber and transceivers is a fraction of they used to<br />
be and P2P is beginning to show several advantages over PON.<br />
By nature, the OLT in a PON is an expensive component because it needs to be able<br />
to send a broadband optical signal up to 20 or 30 km with enough power to light up 32<br />
or more ONUs. Therefore an OLT doesn’t start to become economical until a large<br />
percentage of the total supported ONUs is served [11]. In addition, because many<br />
users share the same fiber, the bandwidth for each user will decrease when new users<br />
are added. Furthermore, the fact that many users share the same fiber also means any<br />
upgrade to a higher aggregate bandwidth always affects multiple users (all users will<br />
have to upgrade simultaneously), thus becoming a costly exercise.<br />
In contrast the P2P network can be upgraded on a per-user basis and can achieve<br />
much higher bit rates at longer distances because no synchronization is required and<br />
no bandwidth is shared between users.<br />
1.3.3 Wavelength Division Multiplexed PON<br />
Combining many of the benefits of P2P and traditional passive optical networks<br />
Wavelength Division Multiplexed (WDM)-PON is seen as a possible successor [12].<br />
WDM-PON uses the same passive network topology as PON but the addition of many<br />
wavelengths implicates that many different services can be run side by side.<br />
Customers, for instance, that require higher bit rates can then do so by transferring to<br />
a different wavelength with this service. Changes are then only required at the head<br />
office and the customers’ premises, keeping the PON system out in the field<br />
unchanged.<br />
For now, however, the biggest problem for WDM-PON is cost. For true WDM<br />
narrowband tunable or wavelength specific lasers are required in the ONUs on the<br />
customer side. Such ONUs, however, will be prohibitively expensive in an industry<br />
that looks for €100 to €250 solutions.<br />
1.4 Projects<br />
The work presented in this thesis was carried out within the final two years of the<br />
three year NAIS project and the first two years of the ongoing Broadband Photonics<br />
project. An important goal in both these projects was to create cost-effective devices<br />
for use in WDM-PON networks.<br />
1.4.1 NAIS<br />
The EC funded NAIS (Next generation Active Integrated optic Sub-systems) project<br />
[13] aimed to exploit recent insights in electro-optical materials and technological<br />
advances in optical Microring Resonators to create a densely integrated optic<br />
subsystem (ONU) with an application in WDM-PON. The technological scope of the<br />
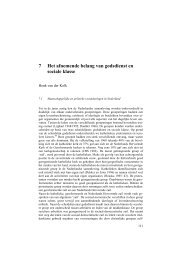
subsystem, shown in Figure 1.5, sees functions such as optical switching, modulation,<br />
multiplexing and filtering integrated on a single optical chip. Only a high-speed<br />
detector and a broadband light source, which through the use of integrated optical<br />
filters can be implemented using a low-cost LED, are kept off-chip.<br />
6
Figure 1.5. The technological scope of the NAIS project.<br />
7<br />
Introduction<br />
All functions on chip are implemented in a scalable manner so that additional optical<br />
channels can easily be integrated, eventually allowing hundreds of channels per chip.<br />
The high levels of integration required for such devices can be obtained through the<br />
use of microring resonators which are able to perform a wide range of optical<br />
functions at typical dimensions less than 100 µm. Through the combination of<br />
microring resonators with novel polymers that exhibit large electro-optic effects,<br />
active components, such as high speed modulators, can be created.<br />
A new generation integrated optic subsystem is thus developed that, through dense<br />
integration and novel materials, allows large-scale manufacturability and can<br />
potentially lead to low-cost WDM-ONUs.<br />
Within the NAIS project research groups and companies are joined together to<br />
perform a chain of activities that include the study and development of novel electrooptic<br />
and high index passive materials, the development and application of design<br />
tools, and the design and technological realization of micro-resonator based devices.<br />
The NAIS related work presented in this thesis focuses on this last activity with the<br />
design, implementation and characterization of tunable microring resonator based<br />
filters and switches.<br />
1.4.2 Broadband Photonics<br />
The Broadband Photonics Project [14] develops reconfigurable access networks for<br />
providing the user with congestion-free access and abundant exchange of abundant<br />
amounts of information.<br />
By enabling the network operator to easily and remotely reconfigure his access<br />
network, the capacity distribution across the users can timely be adapted to his<br />
varying service demands. Optical fiber carrying multiple wavelength channels<br />
(WDM) is chosen for the broadband flexible network infrastructure. The project puts<br />
emphasis on low cost, which is a crucial factor for success in the access market.<br />
Therefore reconfigurable access network architectures and access network modules<br />
are being investigated. Compact low-power photonic integrated circuits and<br />
intelligent network reconfiguration mechanisms are key research items in the project.<br />
A concept of the network is shown in Figure 1.6.
Chapter 1<br />
Multi-λ BM Tx<br />
Multi-λ BM Rx<br />
Multi-λ CW Tx<br />
The concept aims for up to 1024 users that can be connected to a single network<br />
topology. This topology consists of up to 4 routers (3 shown) each connecting up to<br />
256 users to a ring network, which is used for redundancy. The ring network is<br />
connected to a head-end node through which signals are communicated across the<br />
network and from which the various routers can be controlled to implement load<br />
balancing and schemes such as multicasting.<br />
Key components to be developed within the Broadband photonics project are a<br />
reflective ONU and a multicasting router based on microring resonators. The<br />
multicasting router and a related component, a reconfigurable optical add drop<br />
multiplexer (ROADM), both based on microring resonators are, amongst other<br />
devices, presented in this thesis.<br />
1.5 Outline<br />
tuning<br />
WDM mux/demux<br />
{ { λλ down, down, i i , , λλ up,j up,j CW} CW}<br />
{ { λλ up,j up,j } }<br />
Multi-casting λ-router<br />
node 4<br />
Multi-casting λ-router<br />
This thesis is structured as follows:<br />
• In Chapter 2, the principle of operation of the microring resonator, which is<br />
used in all of the optical components presented in this thesis, will be<br />
discussed. Also, the basic parameters that govern its operation are introduced<br />
and using these parameters the frequency-domain responses of single and<br />
second order microring resonator based filters will be derived. This chapter<br />
will also discuss some of the limitations that designs based on single (first<br />
order) resonators may face and offers several solutions based on the use of<br />
multiple resonators. In the final section of this chapter the various methods<br />
that can be used to tune various aspects of the resonator such as its resonance<br />
frequency, which is crucial in devices such as the OADM and the Router, or<br />
its filter shape are discussed.<br />
• In Chapter 3 the design of microring resonator based devices is discussed in<br />
general terms. Several performance parameters are introduced that can be used<br />
to translate the requirements of a certain application into specific values of the<br />
basic microring resonator parameters. The methodologies for transforming<br />
8<br />
node 1<br />
WDM<br />
WDM<br />
BM Rx<br />
BM Tx<br />
refl. mod.<br />
node 2<br />
BM Rx<br />
BM Tx<br />
refl. mod.<br />
Multi-casting λ-router<br />
bidir.<br />
EDFA<br />
ONU<br />
Figure 1.6. The Broadband Photonics network concept.<br />
1<br />
BM Rx<br />
256<br />
WDM<br />
BM Tx<br />
refl. mod.<br />
CWDM
9<br />
Introduction<br />
these basic parameters into actual resonator designs are given for a laterally<br />
and a vertically coupled resonator. Apart from the design of the resonators<br />
some important issues related to overall device design, up to the prototype<br />
level, are also be discussed.<br />
• In Chapter 4 some of the tools that were created to aid in the design and<br />
characterization of microring resonator based devices are presented. In<br />
particular the analytical and numerical methods used to fit measured resonator<br />
responses are examined in detail. Aurora, a tool created to perform simulations<br />
on complex optical circuits containing resonators, is also discussed in this<br />
chapter.<br />
• In Chapter 5 the fabrication processes used to fabricate the various devices<br />
presented in this thesis are described in detail. Also the implications that a<br />
certain process has on the design of the masks used in that process are<br />
discussed.<br />
• In Chapter 6 a specific design for a basic resonator building block is given.<br />
This building block consists of a single thermally tunable resonator and was<br />
used as the fundamental unit (i.e. the same resonator design was used many<br />
times) in the OADM and Router discussed in Chapter 7. Some important<br />
aspects in the design of a resonator building block are illustrated using the<br />
wavelength response and thermal tuning measurements on a number of<br />
(steadily improving) resonator designs. Also presented are the wavelength<br />
selective switch and a Vernier filter based on two resonators.<br />
• In Chapter 7 the design and characterization of two different types of OADM,<br />
for use at 1310 nm or at 1550 nm, and a Router are discussed. For 1550 nm<br />
OADM system level measurements performed at 40 Gbit/s are also presented.<br />
• A major problem of microring resonator based devices is that it is often very<br />
difficult to make them polarization independent. Although this can by solved<br />
by introducing polarization diversity in the devices this doubles the number of<br />
resonators in the devices and creates a number of new problems. In Chapter 8<br />
a method is described for creating a polarization diverse device that does not<br />
double the number of resonators and that also has several other advantages.<br />
• Finally, in Chapter 9, general conclusions based on the work presented in this<br />
thesis will be drawn.
Chapter 2<br />
The Micro-Resonator<br />
In this chapter the basic principle behind the operation of the<br />
micro-resonator will be given and the basic equations that<br />
describe its operation will be derived. In addition it will be<br />
shown that the resonator has certain limitations concerning its<br />
Free Spectral Range and filter response. For this several<br />
solutions such as, for instance, the use of higher order filters are<br />
offered. In the final section of this chapter several methods of<br />
active tuning will be discussed because it is this tuning that<br />
gives the micro-resonator its attractive functionality as will be<br />
shown in several other chapters.
Chapter 2<br />
2.1 Introduction<br />
Integrated optic microring resonators were first proposed by Marcatili in 1969 [15].<br />
These resonators find their origin in the field of fiber optic ring resonators [16, 17]<br />
and micrometer sized resonant spheres and droplets [18-20]. These resonators are,<br />
like the Fabry-Perot resonator (FP), a class of resonant filters that, due to internal<br />
optical feedback, achieve high frequency selectivity.<br />
Functionally these resonators behave similar to the Fabry-Perot resonator and share its<br />
Lorentzian-like frequency response. The integrated optic microring-resonator,<br />
however, has the linear cavity of the FP replaced by a loop waveguide and the cavity<br />
mirrors replaced by a directional coupler or, occasionally, a Multi Mode<br />
Interferometer (MMI). In an integrated optics FP the cavity the mirrors are commonly<br />
created using cleaved facets or reflective gratings, both of which are difficult to<br />
integrate when produced on a large scale. However, the use of directional couplers in<br />
a microring resonator allows, depending on the index contrast, ring radii as small as a<br />
few micrometers [21, 22]. The microring-resonator is therefore a highly attractive<br />
component for Large Scale Integrated Optics (LSIO) [23-26]. In addition, by careful<br />
design of the resonator geometry and choice of the materials system it can be made to<br />
perform a wide range of functions. Aside from its use as a highly selective passive<br />
filter the microring resonator has seen application as an optical delay line element, a<br />
dispersion compensator and even as a highly sensitive sensor [27-30]. Using electrooptic<br />
polymers or materials such as silicon-on-insulator (SOI), Gallium-Arsenide<br />
(GaAs) and Indium-Phosphide (InP) high speed modulators can be created [31-36]<br />
and also microring-resonator lasers [37-42] have been demonstrated.<br />
2.2 Operational description<br />
Most integrated optics microring resonators operate as either a two or a four port<br />
device. In a two-port resonator the resonant cavity is coupled to a single port<br />
waveguide and therefore has only a single in and output, as shown in Figure 2.1a.<br />
This type of resonator is ideally suited as a dispersive or attenuating element and has<br />
been used in dispersion compensation [43, 44] and true-time-delay [45] applications.<br />
The two port configuration can also be used for making lasers [37, 41] and sensors<br />
[27-29]. It is, however, less useful as a wavelength filtering element in the<br />
applications described in this thesis and is therefore not further covered.<br />
In Out In 1<br />
Figure 2.1a. Two port ring resonator. Figure 2.1b. Four port ring resonator.<br />
Conversely, the four port configuration is ideal for this task. Used throughout this<br />
thesis the four port configuration, shown in Figure 2.1b, is created by adding an<br />
additional port waveguide to the two-port resonator. This effectively transforms the<br />
micro-resonator into a wavelength selective filter that allows signals of certain<br />
wavelengths to be transferred from one port waveguide to the other.<br />
12<br />
Out 2<br />
In 2<br />
Out 1
2.2.1 Four port filter operation<br />
13<br />
The Micro-Resonator<br />
The transfer of power between the two port waveguides of a four port micro-resonator<br />
is only possible at discrete wavelength regions at which the optical path length of the<br />
light in the resonator is an integer multiple of its effective wavelength. The process by<br />
which power is transferred through the resonator is characterized by three distinct<br />
phases: the initial, transient and the equilibrium phase.<br />
In the initial phase, shown in Figure 2.2a, incoming light Iin of a certain wavelength<br />
propagates along one of the port waveguides of the micro-resonator. When the light<br />
2<br />
reaches the first coupler a small power fraction κ 1 ⋅ Iin<br />
is evanescently coupled into<br />
the resonator. Most of the light, however, will continue its path along the port<br />
waveguide as Ithrough The light Icav1 that is now in the resonator will propagate along<br />
the resonator until it reaches the other port waveguide and the second coupler. Here a<br />
2<br />
small fraction κ 2 ⋅ Icav1<br />
of the light is coupled out of the resonator as Idrop while the<br />
larger fraction Icav2 continues its roundtrip towards the first coupler.<br />
In the transient phase the dominant factor that determines the buildup of power the<br />
resonator is the modal phase of the light Icav2 as it interferes with the light in the port<br />
waveguide at the first coupler. If the resonance condition:<br />
ϕ r = m ⋅ 2π<br />
, m ∈ Ν<br />
(2.1)<br />
is satisfied for the roundtrip phase of Icav2, constructive interference will occur at the<br />
resonator side of the first coupler, resulting in a net increase of power within the<br />
resonator. At the same time destructive interference at the port waveguide side results<br />
in a decrease of the power Ithrough, as shown in Figure 2.2b.<br />
Icav2 =<br />
2<br />
Icav1 − κ 2 ⋅ Icav1<br />
Idrop<br />
Iin<br />
κ ⋅ I<br />
2<br />
κ 1<br />
2<br />
2 cav1<br />
⋅ I in<br />
Icav1 =<br />
2<br />
κ1<br />
⋅ Iin<br />
Ithrough =<br />
Iin − ⋅ Iin<br />
2<br />
κ 1<br />
Figure 2.2a. Light coupling into the microresonator<br />
in the initial phase.<br />
Power (a.u.)<br />
4<br />
3<br />
2<br />
1<br />
0<br />
Interference after first<br />
roundtrip results in an<br />
increase in Icav and a<br />
decrease in IThrough<br />
I Cav1<br />
IThrough<br />
0 10 20 30 40 50 60<br />
Time (a.u)<br />
Figure 2.2b. Constructive interference at the<br />
first coupler results in a build-up of power in<br />
the resonator while reducing the power IThrough.<br />
The process of power enhancement within the cavity while transferring more power<br />
from Iin will repeat itself many times as Icav2 continues to interfere with the light in the<br />
port waveguide on every roundtrip. In tandem the dropped power Idrop will also<br />
2<br />
increase according to I drop = κ 2 ⋅ I cav1.<br />
The intra-cavity power cannot rise indefinitely,<br />
however, and at a certain power level a state of equilibrium is reached between the
Chapter 2<br />
light Icav2 in the cavity and the light in the port waveguide Iin. At this point no<br />
additional power can be transferred from Iin and the resonator is operating in a steady<br />
state condition. The power in the through port Ithrough is now at its lowest level while<br />
the power in the drop port Idrop is at its highest level. The resonator has thus<br />
effectively transferred power from the input to the drop port.<br />
2.1.2 Transient resonator behavior<br />
As described in the previous section all the power that is transferred from the (first)<br />
input waveguide into the resonator is dropped to the second port waveguide (for a<br />
loss-less the resonator). The transient drop response of a micro-resonator in full<br />
2<br />
resonance, which can be found from the intra-cavity power using I drop = κ 2 ⋅ I cav1,<br />
is<br />
shown in Figure 2.3a. In this Figure the transient buildup of power and the stable<br />
equilibrium phase where the dropped power no longer fluctuates can be identified.<br />
Figure 2.3b shows the transient step response of a resonator that is near full<br />
resonance. In this case the roundtrip phase of the light in the cavity is not exactly<br />
2 ⋅ mπ<br />
, but constructive interference within the resonator cavity, and thus power<br />
buildup, can still occur. However, the maximum attainable intra-cavity power is<br />
reduced and as a result the maximum dropped power level is lower compared to that<br />
of a resonator in full resonance.<br />
Power (a.u.)<br />
1.0<br />
0.8<br />
0.6<br />
0.4<br />
0.2<br />
0.0<br />
0 10 20 30<br />
Time<br />
40 50 60<br />
Figure 2.3a. Transient drop response at<br />
full resonance.<br />
In a resonator that is completely off<br />
resonance the roundtrip phase of the<br />
light in the resonator cavity is equal to<br />
(2.m+1).π. It will therefore interfere<br />
destructively with the light that enters<br />
the cavity. This has the effect that the<br />
power of the light that enters the<br />
cavity is reduced below its initial<br />
2<br />
value of κ 1 ⋅ Iin<br />
, thereby blocking the<br />
transfer of power from the input to the<br />
drop port. This is also visible in<br />
Figure 2.3c where, after an initial peak<br />
in power, the drop power converges to<br />
a significantly lower value.<br />
Power (a.u.)<br />
14<br />
0.5<br />
0.4<br />
0.3<br />
0.2<br />
0.1<br />
0.0<br />
0 10 20 30 40 50 60<br />
Time<br />
Figure 2.3b. Transient drop response near<br />
full resonance.<br />
Power (a.u.)<br />
0.07<br />
0.06<br />
0.05<br />
0.04<br />
0.03<br />
0.02<br />
0.01<br />
0.00<br />
0 10 20 30<br />
Time<br />
40 50 60<br />
Figure 2.3c. Transient drop response at offresonance.
2.3 Microring resonator model<br />
15<br />
The Micro-Resonator<br />
The qualitative description of the previous paragraph can also be translated into a<br />
quantitative mathematical model. This model can be used to find the spectral behavior<br />
of the microring resonator and serves as the basis from which many important<br />
performance parameters can be derived.<br />
The parameters that are used to define the mathematical model of the microringresonator<br />
are summed up in Figure 2.4. These parameters are either related to the two<br />
coupling regions between the ring and port waveguides or the ring resonator itself.<br />
These parts are therefore discussed individually before proceeding to the overall<br />
model.<br />
Figure 2.4. Micro-resonator model components and parameters (κ1 and κ2 are field coupling<br />
coefficients).<br />
2.3.1 Directional coupler model<br />
The coupling region between the port waveguide and the ring resonator can be<br />
modeled as a 2x2 directional coupler. The transmission characteristics of this coupler<br />
can be expressed by its transfer matrix as [46]:<br />
M<br />
A<br />
=<br />
Drop<br />
Neffg<br />
In<br />
λ0<br />
Bend<br />
guide<br />
Directional coupler 2<br />
2 ⎡cos(<br />
∆.<br />
Leff<br />
) − jA ⋅ sin( ∆.<br />
Leff<br />
) − jB ⋅ sin( ∆.<br />
Leff<br />
) ⎤<br />
1−<br />
χ c ⎢<br />
⎥<br />
⎣ − jB ⋅ sin( ∆.<br />
Leff<br />
) cos( φ)<br />
+ j ⋅ Asin(<br />
∆.<br />
Leff<br />
)<br />
(2.2)<br />
⎦<br />
where χc is fraction of the power that is lost in the coupler and Leff is the effective<br />
coupling length between the resonator and port waveguides. The parameters ∆, A and<br />
B are related to the coupler asymmetry and are defined as:<br />
( − ) / ∆<br />
A = β β 2<br />
(2.3)<br />
r<br />
κ2, χ2<br />
κ1, χ1<br />
Directional coupler 1<br />
g<br />
R<br />
Add<br />
Neffr, αdB<br />
Bend<br />
guide<br />
Through<br />
B = κ c / ∆<br />
(2.4)
Chapter 2<br />
∆ =<br />
⎛ β r − β g ⎞<br />
⎜<br />
2 ⎟<br />
⎝ ⎠<br />
16<br />
2<br />
− κ<br />
2<br />
c<br />
(2.5)<br />
where κc is the coupling constant of the port and resonator waveguides and βr and βg<br />
are the propagation constants. The propagation constants are related to the effective<br />
refractive index Neffr of the ring resonator and that of the port waveguide Neffg via:<br />
= 2π ⋅ Neff / λ<br />
(2.6)<br />
β i<br />
i<br />
Examination of Equations (2.2-2.6) shows that the effective refractive indices Neffr<br />
and Neffg are very important parameters in the overall operation of the microringresonator.<br />
The difference between Neffr and Neffg, called the phase mismatch,<br />
determines the maximum of the field coupling between the port and ring waveguides.<br />
In the case that strong coupling is required the mismatch should therefore be carefully<br />
controlled as it may otherwise limit the coupling to a range lower than what is<br />
required for a certain device implementation.<br />
If the effective refractive indices are equal then the coupling regions of the resonator<br />
can be described using the simplified transfer matrix for symmetric couplers:<br />
M<br />
S<br />
=<br />
0<br />
⎡ cos( κ . ) − sin( . )<br />
2<br />
c Leff<br />
j κ c Leff<br />
⎤<br />
1−<br />
χ c ⎢<br />
⎥<br />
⎣−<br />
j sin( κ c.<br />
Leff<br />
) cos( κ c.<br />
Leff<br />
)<br />
(2.7)<br />
⎦<br />
which is found by setting Neffr = Neffg, in Equations (2.2-2.6). In this case complete<br />
coupling between the waveguides is possible.<br />
Equations (2.2) and (2.7) can also be written as:<br />
=<br />
M c<br />
2 ⎡ µ − jκ<br />
⎤<br />
1 − χ ⎢ ⎥<br />
⎣−<br />
jκ<br />
µ<br />
(2.8)<br />
⎦<br />
In this equation the field coupling coefficient κ (0
17<br />
The Micro-Resonator<br />
plane. A 2D simulation of the cross-section is therefore not sufficient to calculate the<br />
field coupling coefficient. It is then easier not to calculate κc and Leff, but to calculate<br />
the field coupling coefficient κ directly via a 3D simulation of the entire coupler using<br />
for instance Coupled Mode Theory (CMT) [47-49] or the Beam Propagation Method<br />
(BPM) [50].<br />
While the transfer matrix in Equation (2.8) includes the coupler loss χc, this loss term<br />
is not included in the equations that describe the micro-resonator from here on. It<br />
should be noted, however, that while the omission of the loss term may be largely<br />
valid for the microring-resonators presented in this thesis it is not correct to do so in<br />
general. For micro-resonators with a small radius of several microns for instance, it<br />
has been shown that significant losses can occur due to abrupt modal changes in the<br />
coupling region [51].<br />
2.3.2 Ring waveguide model<br />
The ring resonator consists of a single circular waveguide. In the model of the<br />
resonator, however, this waveguide is split in two halves that are connected to each<br />
other via the two couplers. The two halves of the resonator can be described by the<br />
field propagation term SR of the light in these waveguides:<br />
ϕr<br />
j<br />
R = e<br />
− 2<br />
S ⋅ χ<br />
r<br />
(2.9)<br />
In this equation φr is the roundtrip phase and χr is the roundtrip loss factor of the light<br />
in the resonator. The roundtrip phase is defined as:<br />
2 ( 2.<br />
π )<br />
ϕ r = ⋅ R ⋅ ng<br />
(2.10)<br />
λ<br />
0<br />
where R is the radius of the ring resonator. The parameter ng is the group index of the<br />
mode in the waveguide defined [52] as:<br />
The roundtrip loss factor χr is defined as:<br />
0 0 ) (<br />
∂Neff<br />
r<br />
n g = Neff r λ − λ<br />
(2.11)<br />
∂λ<br />
−αr<br />
20<br />
λ<br />
0<br />
χ = 10 , α r = 2 π ⋅ R ⋅α<br />
dB<br />
(2.12)<br />
r<br />
where αr is the roundtrip loss of the resonator in dB and αdB (αdB >0) is the loss of the<br />
mode in the ring waveguide in dB/m.
Chapter 2<br />
2.3.3 Combined model<br />
The descriptions of the couplers and bend waveguides that make up the microresonator<br />
can be combined into a full model of a resonator. This model, which is<br />
shown in Figure 2.5, is based on a notation derived from control engineering where<br />
feed forward or feedback paths are clearly visible. This notation aids in the creation of<br />
the analytical description of the resonator through Mason’s rule (See Appendix A) as<br />
will be shown in the next paragraph. The model shown here assumes a unidirectional<br />
resonator. In essence, a resonator is a bi-directional component where light can<br />
propagate in opposing directions within the resonator. Light propagation in two<br />
directions in the resonator may be intentional, as illustrated in Chapter 8, but is most<br />
often an undesired by-product of back scattering in the ring resonator or, in the case of<br />
a ring-resonator laser, an inherent property of omnidirectional emission. In all these<br />
instances, however, light propagating in one direction has negligible interaction with<br />
the counter propagating light so that in the case of bi-directional behavior the<br />
resonator can be described by treating this resonator as two separate unidirectional<br />
resonators.<br />
µ1<br />
+<br />
In Through<br />
−<br />
jϕ r<br />
2 e χ<br />
r<br />
+<br />
-j.κ2<br />
-j.κ2<br />
Figure 2.5. Control engineering representation of a unidirectional four port micro-resonator.<br />
2.4 Spectral response of a single resonator<br />
µ1<br />
µ2<br />
The spectral responses of a resonator are commonly referred to as the through and the<br />
drop response. The drop response signifies the power fraction of the light that is<br />
transferred by the resonator from the In port to the Drop port as a function of the<br />
wavelength of this light. Similarly the through response signifies the power fraction of<br />
the light that is extracted by the resonator from the In port to the Through port. The<br />
drop and through responses can be found by identifying in Figure 2.5 all the paths the<br />
light in the resonator may follow from respectively the input to the drop port and from<br />
the input to the trough port and then applying Mason’s rule to find a mathematical<br />
expression from the paths.<br />
18<br />
-j.κ1<br />
-j.κ1<br />
+<br />
−<br />
ϕ<br />
j r<br />
2 e χ<br />
Drop +<br />
µ2<br />
Add<br />
r
2.4.1 The drop response<br />
19<br />
The Micro-Resonator<br />
In the model of Figure 2.5 only two paths can be identified between the in and the<br />
drop port. This leads to the simplified model of Figure 2.6 in which the direct path<br />
from the in to the drop port as well as the feedback loop caused by the resonator can<br />
be discerned.<br />
In<br />
Figure 2.6. Simplified resonator model used to obtain the drop response.<br />
By applying Mason’s rule to this simplified model transfer function (2.13) is obtained.<br />
E<br />
E<br />
Drop<br />
In<br />
− jϕ<br />
r<br />
2<br />
− κ1κ<br />
2 ⋅ e<br />
=<br />
1−<br />
µ µ ⋅ e<br />
1<br />
2<br />
− jϕ<br />
r<br />
χ<br />
χ<br />
r<br />
r<br />
(2.13)<br />
In order to find the power dropped by the ring resonator the equation is squared and<br />
rearranged as:<br />
P<br />
P<br />
Drop<br />
In<br />
1<br />
-jκ1<br />
2<br />
− jϕ<br />
r<br />
2<br />
− κ1κ<br />
2 ⋅ e<br />
=<br />
1−<br />
µ µ ⋅ e<br />
− jϕ<br />
r<br />
χ<br />
χ<br />
r<br />
2<br />
2<br />
r<br />
2 2<br />
k1<br />
κ2<br />
⋅ χr<br />
=<br />
2<br />
( 1−<br />
µ µ ⋅ χ ) + 4µ<br />
µ ⋅ e<br />
This can be simplified further and is most often written as:<br />
where H is given by:<br />
P<br />
P<br />
Drop<br />
In<br />
H =<br />
1<br />
2<br />
H<br />
=<br />
2<br />
1+<br />
F sin ( ϕ / 2)<br />
C<br />
κ κ ⋅ χ<br />
2 2<br />
1 2 r<br />
( 1−<br />
µ 1µ<br />
2 ⋅ χr<br />
r<br />
r<br />
)<br />
2<br />
1<br />
2<br />
−α<br />
r<br />
sin<br />
2<br />
( ϕ / 2)<br />
Also, H is also the maximum power available in the drop port for a resonator in<br />
resonance:<br />
P<br />
Drop _ Max<br />
H<br />
= H =<br />
2<br />
1+ FC<br />
sin (( ϕ r = 2<br />
Fc is the so-called finesse factor defined as:<br />
+<br />
µ1<br />
− jϕr 2<br />
e χ<br />
− jϕr 2<br />
e χ<br />
r<br />
r<br />
π<br />
µ2<br />
) / 2)<br />
-jκ2<br />
r<br />
Drop<br />
(2.14)<br />
(2.15)<br />
(2.16)<br />
(2.17)
Chapter 2<br />
FC<br />
4µ<br />
1µ<br />
2 ⋅ χr<br />
=<br />
2<br />
( 1−<br />
µ µ ⋅ χ )<br />
1<br />
The Finesse F of the resonator can be determined from the finesse factor following:<br />
π<br />
F =<br />
2arcsin(<br />
1/<br />
FC<br />
2<br />
20<br />
r<br />
π µ 1µ<br />
2 ⋅ χr<br />
≈<br />
) 1−<br />
µ µ ⋅ χ<br />
1<br />
2<br />
r<br />
(2.18)<br />
(2.19)<br />
The finesse is a measure of the quality of the microresonator and can be related to the<br />
storage capacity or quality factor Q of the resonator through:<br />
Fλ0<br />
Q =<br />
FSR<br />
(2.20)<br />
where FSR is the Free Spectral range of the resonator, defined as the distance between<br />
two consecutive fringes or resonance peaks. The free spectral range is determined by:<br />
2<br />
λ0<br />
FSR =<br />
2π<br />
⋅ n<br />
g ⋅<br />
R<br />
(2.21)<br />
From the free spectral range and the finesse the bandwidth of the resonator can be<br />
calculated. The bandwidth ∆λFWHM is defined as the Full Width at Half Maximum of<br />
the drop response and relates to the Finesse and the FSR as:<br />
∆λ FWHM =<br />
FSR<br />
F<br />
(2.22)<br />
The free spectral range and full width half maximum are also illustrated in Figure 2.7.<br />
Here three fringes of the drop response of a microring-resonator are drawn, obtained<br />
for R=50 µm, κ1= κ2=0.5, αdB=1 dB/cm and ng=1.5.<br />
P Drop /P In (dB)<br />
0<br />
-2<br />
-4<br />
-6<br />
-8<br />
-10<br />
-12<br />
-14<br />
-16<br />
-3dB<br />
∆λFWHM<br />
-18<br />
1542 1544 1546 1548 1550 1552 1554 1556 1558<br />
Wavelength (nm)<br />
FSR<br />
Figure 2.7. Microring resonator drop response.
2.4.2 The through response<br />
21<br />
The Micro-Resonator<br />
The through response of a micro-resonator can be derived from Figure 2.5 in a way<br />
similar to that of the drop response by identifying all the paths the light may follow<br />
from the In port to the Through port. This leads to the simplified model of Figure<br />
2.8. in which the feedback loop caused by the resonator and a feed-forward path<br />
through the first coupler can be discerned.<br />
In<br />
-jκ1<br />
Figure 2.8. Simplified resonator model used to obtain the through response.<br />
The application of Mason’s rule then leads to the field transfer function of (2.23):<br />
E<br />
E<br />
Through<br />
In<br />
µ 1 − µ 2 ⋅ e<br />
=<br />
1−<br />
µ µ ⋅ e<br />
The power in the through port is then given by:<br />
P<br />
Through<br />
P<br />
In<br />
1<br />
2<br />
1<br />
2<br />
− jϕ<br />
− jϕ<br />
r χr<br />
r χ<br />
2<br />
µ 1 − 2χ<br />
r ⋅ µ 1µ<br />
2 ⋅cos(<br />
ϕ)<br />
+ χ ⋅ µ<br />
=<br />
1−<br />
2χ<br />
⋅ µ µ ⋅cos(<br />
ϕ)<br />
+ µ ⋅ χ<br />
r<br />
r<br />
2<br />
r<br />
2 2<br />
1 µ 2<br />
By substitution of the cosine in the denominator and rearranging expression (2.24),<br />
the through response can be written in a way analogous the drop response of (2.15):<br />
where G is given by:<br />
+<br />
P<br />
P<br />
− jϕr 2<br />
e . χ<br />
Through<br />
In<br />
r<br />
2<br />
2<br />
2<br />
r<br />
(2.23)<br />
(2.24)<br />
G<br />
= 2<br />
1+<br />
F sin ( ϕ / 2)<br />
(2.25)<br />
2<br />
2 2<br />
µ 1 − 2χ<br />
r ⋅ µ 1µ<br />
2 ⋅ cos( ϕ)<br />
+ χr<br />
⋅ µ 2<br />
G =<br />
2<br />
( 1−<br />
µ µ ⋅ χ )<br />
1<br />
C<br />
2<br />
µ2<br />
µ1<br />
µ1<br />
r<br />
Through<br />
(2.26)<br />
The trough response of (2.24) is shown in Figure 2.9 where three fringes are drawn<br />
for R=50 µm, κ1= κ2=0.5, αdB=1 dB/cm and ng=1.5.<br />
− jϕr 2<br />
e . χ<br />
r<br />
-jκ1 +
Chapter 2<br />
P Through /P In (dB)<br />
0<br />
-10<br />
-20<br />
-30<br />
-40<br />
-50<br />
1542 1544 1546 1548 1550 1552 1554 1556 1558<br />
Wavelength (nm)<br />
Figure 2.9. Microring resonator through response.<br />
2.5 MR Filter bandwidth versus rejection ratio<br />
Two important parameters in filter design are the filter bandwidth and its ability to<br />
reject unwanted signals. For a micro-resonator the definition of the bandwidth ∆λFWHM<br />
and the filter rejection ratio SRR is illustrated in Figure 2.10.<br />
P Drop /P In (dB)<br />
The bandwidth of a micro-resonator was previously defined in (2.22) as the spectral<br />
width in which the micro-resonator still drops half of its maximum power.<br />
The filter rejection ratio SRR of a micro-resonator can be defined as the ratio of the<br />
power that is transferred on resonance (φr=2π) and the power that is transferred by the<br />
resonator when it is completely off resonance (φr=π). The SRR can be found by using<br />
Equation (2.15) and dividing the power dropped by a resonator in resonance by the<br />
power dropped off resonance as in (2.27):<br />
⎛ P<br />
0<br />
-2<br />
-4<br />
-6<br />
-8<br />
-10<br />
-12<br />
-14<br />
-16<br />
-18<br />
⎞<br />
SRR<br />
-3 dB<br />
1547 1548 1549 1550 1551 1552 1553<br />
⎛ H<br />
⎜<br />
1+<br />
F ⋅sin<br />
( π )<br />
2<br />
On s<br />
C<br />
S ⎜ Re<br />
RR = 10 ⋅ log ⎟ = 10 ⋅ log⎜<br />
⎟ = 10 ⋅ log 1+<br />
⎜ P ⎟ ⎜ H ⎟<br />
⎝ Off Re s ⎠<br />
⎜<br />
2<br />
1+<br />
F<br />
⎟<br />
C ⋅sin<br />
( π / 2)<br />
⎝<br />
Wavelength (nm)<br />
22<br />
∆λFWHM<br />
Figure 2.10. Definition of the filter rejection ratio SRR and bandwidth ∆λFWHM in the<br />
response of a micro-resonator.<br />
⎞<br />
⎟<br />
⎠<br />
( F )<br />
C<br />
(2.27)
Substitution with (2.18) then gives:<br />
SRR<br />
⎛ ( 1+<br />
µ 1µ<br />
2 ⋅ χr<br />
)<br />
10.<br />
log ⎜<br />
⎝ ( 1−<br />
µ 1µ<br />
2 ⋅ χr<br />
)<br />
= 2<br />
23<br />
2<br />
⎞<br />
⎟<br />
⎠<br />
The Micro-Resonator<br />
(2.28)<br />
where SRR is expressed in dB.<br />
The SRR is proportional to the finesse of the resonator. The exact relationship between<br />
the finesse and the SRR can be found by rewriting (2.28) as a function of SRR:<br />
µ µ ⋅ χ =<br />
1<br />
2<br />
r<br />
10<br />
10<br />
Substitution of (2.29) in (2.19) then leads to:<br />
S RR<br />
10<br />
S RR<br />
10<br />
−1<br />
+ 1<br />
S RR<br />
10<br />
π µ 1µ<br />
2 ⋅ χr<br />
π 10<br />
F ≈<br />
=<br />
1−<br />
µ µ ⋅ χ 2<br />
1<br />
2<br />
r<br />
−1<br />
(2.29)<br />
(2.30)<br />
In general filter design there is always a tradeoff to be made between the bandwidth<br />
of a filter and the filter rejection ratio. That a micro-resonator based filter is no<br />
exception to this rule is apparent by substituting (2.30) in (2.22):<br />
∆λ<br />
FWHM<br />
=<br />
2.<br />
FSR<br />
S RR<br />
=<br />
10 2 10<br />
π 10 −1<br />
n ⋅ R ⋅π<br />
10 −1<br />
g<br />
λ<br />
2<br />
0<br />
S RR<br />
(2.31)<br />
This equation can be used to plot the bandwidth ∆λFWHM of the resonator as a function<br />
of the rejection ration for a number of effective resonator radii (REff=R.ng) as is done<br />
in Figure 2.11.<br />
Bandwidth (GHz)<br />
300<br />
275<br />
250<br />
225<br />
200<br />
175<br />
150<br />
125<br />
100<br />
75<br />
50<br />
25<br />
20 µm<br />
50 µm<br />
75 µm<br />
100 µm<br />
200 µm<br />
500 µm<br />
1000 µm<br />
0<br />
5 10 15 20 25 30 35 40<br />
SRR (dB)<br />
Figure 2.11. Maximum achievable bandwidth as a function of SRR for a number of<br />
different effective radii (simulated for λ0=1550nm)
Chapter 2<br />
The figure shows that it can be very difficult if not impossible to create a single ring<br />
resonator that achieves a high rejection ratio as well as a large bandwidth. Assuming<br />
for instance that a resonator with an effective radius of ≈87 µm, similar to that of the<br />
basic resonator building block presented in later chapters, is used in a device with<br />
bandwidth requirements of 40 GHz then an SRR of at most 20 dB can be achieved.<br />
While this may be sufficient in some cases, typical telecom applications often require<br />
rejection ratios at least an order of magnitude higher.<br />
Decreasing the radius of a resonator can be a possible solution to this problem. In<br />
most cases, however, the minimum radius of the resonator is limited by the choice of<br />
materials and the fabrication technology. An attractive alternative is then offered by<br />
higher order filters, which will be discussed in the next paragraph.<br />
2.6 Multiple-resonator filters<br />
Similar to the higher order filters well known from the field of electronic engineering<br />
multiple resonators can also be combined to form more complex filters. Although the<br />
higher number of resonators requires more space on-chip or, in some cases, is more<br />
technologically demanding, the resulting filter characteristics can often be very<br />
rewarding. Figure 2.12 shows two of the most common filter implementations. These<br />
are the first order resonator cascade and second order serial filter in Figures 2.12a and<br />
2.12b respectively.<br />
Figure 2.12a. First order MR cascade. Figure 2.12b. Second order serial MR.<br />
The first order cascade filter in Figure 2.12a already has significant advantages over a<br />
single micro-resonator. It is created by using multiple resonators of equal geometry<br />
where each resonator has its own set of port waveguides that guide light from one<br />
resonator to the next. Because this type of filter is based on multiple copies of the<br />
basic single resonator geometry it is relatively straightforward to calculate the<br />
response. The filter function is given by:<br />
n<br />
Drop<br />
P<br />
P<br />
In<br />
⎛ H<br />
= ⎜<br />
⎝1<br />
+ FC<br />
⋅sin<br />
(<br />
24<br />
2<br />
ϕr<br />
/ 2)<br />
where n is the number of resonators in the cascade.<br />
⎞<br />
⎟<br />
⎠<br />
n<br />
(2.32)
25<br />
The Micro-Resonator<br />
In a higher order serial filter [53-58], of which the second order variant is shown in<br />
Figure 2.12b the intermediate waveguide between the micro-resonators is omitted and<br />
light is coupled directly between the resonators. This causes the light not only to<br />
resonate in the individual resonators but also between the resonators. This can also be<br />
seen in Figure 2.13b that shows the drop port model of the second order resonator in<br />
Figure 2.13a. In this model the feedback loops that account for the resonance in the<br />
individual resonators (short dash boxes) are supplemented by an additional feedback<br />
loop (long dash) that creates an additional resonance.<br />
Figure 2.13a. Model parameters for a second order serial MR filter.<br />
In<br />
Figure 2.13b. Simplified drop-port model of a second order serial MR filter.<br />
It is this additional feedback loop that gives the response of this filter some interesting<br />
properties when compared with the cascade filter. The drop response of this filter can<br />
be derived from Figure 2.13b and is given by:<br />
− j(<br />
ϕ<br />
2<br />
1 + ϕ 2 )<br />
2<br />
Drop<br />
jκ1κ<br />
2κ3<br />
⋅ e χr1χ<br />
r 2<br />
= − jϕ1<br />
− jϕ<br />
2<br />
− j(<br />
ϕ1<br />
+ ϕ 2 )<br />
PIn<br />
1− µ 1µ<br />
2 ⋅ e χr1<br />
− µ 2µ<br />
3 ⋅ e χr<br />
2 + µ 1µ<br />
3 ⋅ e χr1<br />
⋅ χr<br />
2<br />
P<br />
-jκ1<br />
µ1<br />
µ1<br />
+<br />
e<br />
e<br />
e<br />
IIn<br />
−<br />
jϕr 2 −αr<br />
2 2<br />
. e<br />
− jϕr1 −αr<br />
2 2<br />
. e<br />
− jϕr1 −αr1<br />
2 2<br />
. e<br />
1<br />
2<br />
α2, φ2<br />
α1, φ1<br />
IThrough<br />
where αn and φn are the loss and phase terms of the respective resonators.<br />
κ3<br />
κ2<br />
κ1<br />
µ2<br />
− jϕr 2 −αr<br />
-jκ2 2 2<br />
-jκ2<br />
µ2<br />
+<br />
e<br />
e<br />
e<br />
. e<br />
− jϕr 2 −αr<br />
2 2<br />
. e<br />
− jϕr 2 −αr<br />
2 2<br />
. e<br />
2<br />
2<br />
2<br />
µ3<br />
µ3<br />
-jκ3<br />
Drop<br />
(2.33)
Chapter 2<br />
In<br />
− jϕr1 2<br />
Figure 2.14. Simplified through-port model of a second order serial MR filter.<br />
Similarly the through port response of the filter can be derived from Figure 2.14:<br />
P<br />
P<br />
-jκ1<br />
+<br />
e χ<br />
Through<br />
In<br />
r1<br />
− jϕ2<br />
− j(<br />
ϕ1+<br />
ϕ2<br />
)<br />
( µ ⋅e<br />
χ − µ ⋅e<br />
χ χ )<br />
κ ⋅<br />
= (2.34)<br />
1 χ χ r<br />
2<br />
1 2<br />
r 2 3<br />
r1<br />
r 2<br />
µ 1 −<br />
− jϕ1<br />
− jϕ2<br />
− j(<br />
ϕ1+<br />
ϕ2<br />
)<br />
− µ 1µ<br />
2 ⋅e<br />
χ r1<br />
− µ 2µ<br />
3 ⋅e<br />
χr<br />
2 + µ 1µ<br />
3 ⋅e<br />
A very important parameter in the operation of the second order filter is the coupling<br />
strength between the two resonators, κ2. When κ2 is too low in relation to the field<br />
coupling coefficients κ1 and κ3 then insufficient power will be dropped by the second<br />
order resonator. In this regime the resonators are under-coupled. Conversely, when κ2<br />
is too high the individual resonators are over-coupled, resulting in an undesirable<br />
filter shape.<br />
The value of κ2 for which the maximum power is dropped without distorting de filter<br />
shape is obtained at the so-called critical coupling κc. The value for which critical<br />
coupling is achieved in a symmetrically coupled second order resonator (when κ1= κ3)<br />
is given [59] by:<br />
2<br />
κ1<br />
κ c ≈ 2<br />
2 − κ<br />
(2.35)<br />
1<br />
Figure 2.15 shows the filter responses of an under-, critically- and over-coupled<br />
second order resonator filter for κ1=κ3=0.5. For these values critical coupling is<br />
achieved at κ2≈0.14.<br />
P Drop /P In (dB)<br />
0<br />
-10<br />
-20<br />
-30<br />
-40<br />
-50<br />
1548.5 1549.0 1549.5 1550.0 1550.5 1551.0 1551.5<br />
Wavelength (nm)<br />
26<br />
κ2 =0.05<br />
κ2 =0.147<br />
κ2 =0.4<br />
Figure 2.15. Second order response for an under, critically and over coupled κ2.<br />
µ1<br />
µ1<br />
− jϕ − jϕ r 2<br />
r 2<br />
-jκ2 + 2<br />
2<br />
e χ µ3 e χ<br />
r 2<br />
r 2<br />
µ2<br />
µ2<br />
-jκ2<br />
Through<br />
r1<br />
+<br />
2<br />
2<br />
+<br />
-jκ1<br />
− jϕr1 2<br />
e χ<br />
r1
27<br />
The Micro-Resonator<br />
In Figure 2.16 a comparison is made between the filter responses of a single<br />
resonator, two resonators in series, and a second order resonator.<br />
P Drop /P In (dB)<br />
0<br />
-10<br />
-20<br />
-30<br />
Single MR<br />
Double MR<br />
2nd Order MR<br />
1548 1549 1550<br />
Wavelength (nm)<br />
1551 1552<br />
Figure 2.16a. Comparison between filter<br />
responses for αdB =1 dB/cm.<br />
P Drop /P In (dB)<br />
0<br />
-10<br />
-20<br />
-30<br />
-40<br />
-50<br />
1548 1549 1550 1551 1552<br />
Wavelength (nm)<br />
Single MR<br />
Double MR<br />
2nd Order MR<br />
Figure 2.16b. Comparison between filter<br />
responses for αdB =10 dB/cm.<br />
As a basis for the comparison the SRR was used. Although other important filter<br />
properties such as the channel crosstalk (discussed in Chapter 3.2.4) could also have<br />
been used for this comparison, the SRR has been chosen in particular because of its<br />
relevance to the “on/off” performance of the MR based switch presented in Chapter 6<br />
and the router discussed in Chapter 7. In order to make the comparison the field<br />
coupling coefficients of all filters were set such that a rejection ratio of ≈33 dB was<br />
achieved in all filters. For comparatively low cavity waveguide losses of 1 dB/cm this<br />
SRR was achieved for the parameter values given in to Table 2.1. The corresponding<br />
filter responses are shown in Figure 2.16a. Here, both the cascaded MR and the<br />
second order MR show a clear advantage over the single order MR. While the ∆λFWHM<br />
of the single MR response is only 0.054 nm (≈6.8 GHz) the cascaded and second<br />
order MR offer respectively 0.25 nm and 0.38 nm (≈31 and 48 GHz), thereby greatly<br />
increasing the available bandwidth at the same SRR. Overall the second order filter<br />
shows the best performance. Compared with the cascaded MR the second order filter<br />
has a flattened top, which can also be seen more clearly in Figure 2.15, and a steeper<br />
roll-off. This is in fact a typical characteristic of the serial higher order filter where the<br />
addition of more resonators causes the filter response to look increasingly box-shaped<br />
[54].<br />
Table 2.1. MR Filter parameters required for SRR≈33 dB at αdB =1 dB/cm.<br />
Single MR Cascaded MR Second order MR<br />
κ1 0.195 0.5 0.58<br />
κ2 0.195 0.5 0.58<br />
κ21 0.5<br />
κ22 0.5<br />
κ3 0.2<br />
Radius MR1 (µm) 50 50 50<br />
Radius MR2 (µm) 50 50<br />
ng 1.84 1.84 1.84<br />
In Figure 2.16b the same responses are shown but now at higher losses of 10 dB/cm.<br />
The parameters of these responses are given in Table 2.2. At these higher losses the
Chapter 2<br />
differences between the filters become even more pronounced. The dropped power of<br />
the single order MR is more than 12 dB below that of the cascaded MR. This large<br />
difference is due to the very small coupling coefficients required for the single order<br />
MR to achieve the 33 dB SRR. Combined with the high losses this only allows a small<br />
power fraction to be dropped. Again the best filter of choice is the second order filter<br />
with 1 dB more power dropped than the cascaded filter. Although this may seem to<br />
implicate that, when a single order resonator is no longer sufficient for a specific task,<br />
second order MR or even higher order filters are preferred over cascaded filters this is<br />
largely dependent on the available technology. This is because the resonators in the<br />
serially coupled higher order filters couple directly with each other. Due to the<br />
circular geometry in the coupling region, however, the gap size between the<br />
resonators may have to be quite small in order to achieve the required coupling<br />
between the resonators. The choice between the filter types may therefore ultimately<br />
be made based on the available lithography.<br />
Table 2.2. MR Filter parameters required for SRR≈33 dB at αdB =10 dB/cm.<br />
Single MR Cascaded MR Second order MR<br />
κ1 0.09 0.48 0.57<br />
κ2 0.09 0.48 0.57<br />
κ21 0.48<br />
κ22 0.48<br />
κ3 0.19<br />
Radius MR1 (µm) 50 50 50<br />
Radius MR2 (µm) 50 50<br />
ng 1.84 1.84 1.84<br />
Instead of cascading the MRs in series they can also be placed in parallel [60-66] as<br />
shown in Figure 2.17. This offers certain (fabrication) advantages over a series<br />
coupled filter. In a series coupled filter the resonance wavelengths of all MRs have to<br />
be identical for optimal performance. However, in a parallel MR filter the optical<br />
signal goes through all MRs simultaneously which relaxes this strict requirement.<br />
Also, because the resonators are all coupled directly to the port waveguides in stead of<br />
each other, the lithographical requirements are more relaxed because no (typically<br />
small) coupling gaps are present between the resonators. The disadvantage, however,<br />
is that the distance Lc between the resonators is a highly important parameter in the<br />
performance of these filters and should typically be as close to a small odd multiple of<br />
a quarter wavelength [60] for optimum filter performance.<br />
Figure 2.17. Second order serial MR.<br />
28
29<br />
The Micro-Resonator<br />
In practical designs this may, however, be difficult to achieve. In addition this filter is<br />
highly susceptible to variations in the thickness and width of the port waveguides as<br />
these will result in a different effective path length between the resonators. In<br />
contrast, variations in port waveguide thickness will not greatly affect the<br />
performance of serial coupled resonators (only the coupling changes slightly).<br />
Although small variations in Lc can be compensated using, for instance, thermal<br />
tuning, this is also possible for variations in resonance in a series coupled MR filter.<br />
Provided that the lithography is available to define the small gaps between the<br />
resonators the series coupled MR filter is therefore preferred over the parallel MR<br />
filter.<br />
2.7 Vernier operation<br />
The roundtrip losses that can be allowed in a resonator are greatly dependent on the<br />
type of application in which it will be used. High finesse (e.g. F>500) applications<br />
may for instance require roundtrip losses lower than 0.01 dB if the power dropped by<br />
the resonator is not to be sacrificed too severely. In telecom applications, that have a<br />
high bandwidth requirement, however, a finesse of 10-20 may already be sufficient<br />
and higher losses of around 0.1 dB per 360° roundtrip can be allowed. The allowable<br />
roundtrip losses in turn set, dependent on the effective index contrast, a lower limit for<br />
the bend radius of the micro-resonator and thus its free spectral range.<br />
A problem arises when the maximum obtainable effective refractive index in a certain<br />
technology does not allow for a resonator to be built with a sufficiently large FSR. A<br />
resonator created in stoichiometric Si3N4/SiO2 for instance has a minimum bend<br />
radius of 20 µm, allowing for a FSR of ≈10 nm. If this resonator is used in a telecom<br />
application in the C-band of the ITU grid, which spans roughly 40 nm, it will still<br />
drop at least four channels which is often undesirable.<br />
A similar problem arises when, from a design perspective, a certain radius is favored<br />
while, from a device perspective, a much smaller radius is required. Most of the<br />
Si3N4/SiO2 resonators discussed in the following chapters for instance, have a radius<br />
of 50 µm because of phase matching and resonator “tuning” related requirements.<br />
The tuning in particular can limit the FSR. Certain tuning methods that operate by<br />
changing the effective refractive index of the resonator for instance, may only do this<br />
by a very small amount. Reducing the FSR is then one option to enlarge the tuning<br />
since the tuning range itself is independent of the FSR as will be shown in Chapter<br />
2.8. It is therefore possible to tune across a relatively larger part of the FSR, which in<br />
turn allows for greater possible changes in for instance the power dropped by the<br />
resonator.<br />
In most cases these problems can be solved through the use of the so called Verniereffect<br />
[64-67]. The Vernier-effect in micro-resonators is based on the principle that,<br />
for resonators of unequal radius placed in series, maximum power throughput is only<br />
possible when the positions of the maxima of the individual responses coincide. It<br />
therefore allows a large free spectral range to be created out of two or more resonators<br />
with a substantially larger radius. The benefits or technological necessity of a small<br />
FSR can therefore be combined with large FSR device requirements. For a Vernier<br />
filter comprised of two resonators the maxima coincide when:
Chapter 2<br />
M =<br />
⋅ FSR = N ⋅ FSR FSR<br />
(2.36)<br />
1 2 Tot<br />
where M and N are integers and have no common divisor. Using (2.36) it can be<br />
shown that if, for instance, one ring has a FSR of 4.5 nm and the other has a FSR of 4<br />
nm, their combined FSR is 36 nm, nearly the width of the ITU C-band. The through<br />
and drop responses of this particular arrangement are shown in Figure 2.18a for a<br />
Vernier filter comprised of two resonators placed in serial cascade as depicted in<br />
Figure 2.18b. The responses were obtained for R1=45 µm, R2=50 µm, κ1,2,3,4=0.4 and<br />
αdB=1 dB/cm.<br />
Power (dB)<br />
0<br />
-10<br />
-20<br />
-30<br />
-40<br />
-50<br />
P Drop<br />
PThrough<br />
1530 1540 1550 1560<br />
Wavelength (nm)<br />
Figure 2.18a. Through and drop response of a<br />
Vernier serial cascade resonator.<br />
30<br />
Figure 2.18b. Vernier serial cascade<br />
resonator.<br />
The drop response clearly shows that the maximum dropped power through the filter<br />
occurs only once in the 40 nm range shown, at λ=1550 nm. A potentially negative<br />
side effect of the Vernier filter, the “side lobes”, occurs in the response at those<br />
frequencies where there is still some overlap between the responses of the individual<br />
resonators. In the shown drop response the power dropped by highest side lobe is still<br />
-11 dB, enough to cause interference in most applications. By carefully choosing the<br />
radius and finesse of the comprising resonators, however, these effects may be<br />
limited. In addition cleanup filters can be added to improve the spectrum [68, 69].<br />
Another potential problem of the Vernier cascade resonator can be seen in the through<br />
response. Because the two resonators in the filter are essentially separated from each<br />
other the first resonator will simply drop all frequencies for which it is in resonance.<br />
This poses a problem in devices where many (Vernier) filters are placed along the<br />
same waveguide because power that is dropped but not used by filters on this<br />
waveguide is essentially lost for successive filters.<br />
A second (or higher) order Vernier filter, as shown in Figure 2.19b can then offer a<br />
solution. In the responses of this filter, obtained for R1=45 µm, R2=50 µm, κ1,3=0.4,<br />
κ2=0.086 and αdB=1 dB/cm, the through response now only shows a clear dip at<br />
λ=1550 nm whereas only minor notches are seen at other wavelengths.
Power (dB)<br />
0<br />
-10<br />
-20<br />
-30<br />
-40<br />
-50<br />
-60<br />
PDrop<br />
P Through<br />
1530 1540 1550 1560<br />
Wavelength (nm)<br />
Figure 2.19a. Through and drop response of a<br />
second order Vernier resonator.<br />
2.8 Resonator tuning<br />
31<br />
The Micro-Resonator<br />
Figure 2.19b. Second order Vernier<br />
resonator.<br />
In addition to the use of optical resonators in a passive filters such as those described<br />
in the previous paragraphs it is also possible to actively vary some of the parameters<br />
of the micro-resonator, thereby altering its response. This process of “tuning” can be<br />
used to compensate for errors in fabrication but is more commonly used to add some<br />
form of active functionality.<br />
In the case of the micro-resonator two main types of tuning can be distinguished. The<br />
first type alters the resonator in such a way that its resonant wavelength is shifted but<br />
does not alter the shape of its response. The second type does not shift the response of<br />
the resonator but rather changes the shape of the filter response.<br />
2.8.1 Wavelength tuning methods<br />
The resonant wavelength of a resonator can be shifted (tuned) by changing the optical<br />
roundtrip path length of the resonator. The most straightforward way to change the<br />
optical path length is to change the index in one or all of the materials of the resonator<br />
waveguide. This will change the effective index which, in turn, will alter the roundtrip<br />
phase of the light in the resonator and therefore the wavelength for which it achieves<br />
maximum resonance. A few of the effects that can change the optical index of a<br />
waveguide are:<br />
Thermo-optic:<br />
The thermo-optic effect uses heat to change the refractive index of the waveguide<br />
materials [70-76]. The thermo-optic effect in materials is relatively large when<br />
compared to other effects. Certain materials, such for instance polymers or silicon,<br />
can have a very high thermo-optic coefficient (TOC) in the order of 10 -4 °C -1 (∆n/∆T).<br />
Other materials such Si3N4 and SiO2, used to fabricate many of the devices in the<br />
following chapters, have a lower TOC in the order of 10 -5 °C -1 .<br />
Generally the thermo-optic effect is easy to use because it only requires the addition<br />
of a heating element to an already existing device. Since this element is commonly<br />
implemented using a thin-film metal resistor [73] it has to be placed at some distance<br />
from the waveguide in order to avoid optical losses. When the heater is switched on
Chapter 2<br />
the heat will therefore first have to travel some distance before it reaches the<br />
waveguide. Likewise, when the heater is switched off, the heat will have to be<br />
conducted away to a heatsink. This limits both the speed and the power efficiency of<br />
this approach. In Si3N4/SiO2 based resonators modulation frequencies of up to 10 kHz<br />
have been observed [75]. Other approaches, using for instance the waveguide itself as<br />
a heater allow for substantially higher frequencies because the heat capacity of the<br />
waveguide, instead of that of the surrounding layers is now the dominating factor. For<br />
waveguides made in silicon where this heating method is used modulation frequencies<br />
up to 700 KHz [76] have been reported. The relatively low maximum modulation<br />
frequencies make the thermo-optic effect impractical for use in modulators or<br />
applications where very high switching frequencies are required. However, in<br />
applications where a large tuning range is required or where millisecond switching<br />
times suffice, such as for instance in routing applications the thermo-optic effect can<br />
be the least complex if not the best solution.<br />
Electro-optic:<br />
The electro-optic effect is based on a change that occurs in the index of certain<br />
materials when these are subjected to an electric field. This change is created through<br />
such physical phenomena as the linear Pockels or the quadratic or DC-Kerr [77]<br />
effect. The Pockels effect is a linear electro-optic effect for which the index is<br />
proportional to an externally applied field. The effect only occurs in noncentrosymmetric<br />
crystal materials such as for instance lithium niobate (LiNbO3),<br />
DAST (4-dimethylamino-N-methyl-4-stilbazolium tosylate) [78] or in poled polymers<br />
[79]. The DC-Kerr-effect occurs in transparent isotropic materials and has its origin in<br />
a nonlinear polarization generated in the material under the influence of a relatively<br />
slowly varying external electric field. The change in refractive index due to the Kerr<br />
effect is expressed as:<br />
2<br />
∆ n = λ0<br />
. K.<br />
E<br />
(2.37)<br />
Where K (m/V 2 ) is the Kerr constant, λ0 is the wavelength in vacuum and E is the<br />
amplitude of the applied field. Both the Kerr and the Pockels effect allow for very<br />
high modulation frequencies in the gigahertz range [80-84]. In addition power is only<br />
dissipated when the strength of the applied field is altered. In a steady-state (not at<br />
high frequencies) condition this is a considerable advantage when compared to, for<br />
instance, the thermo-optic effect where power is continuously dissipated in order to<br />
maintain a certain temperature. The disadvantage of the electro-optic effect, however,<br />
is that its magnitude is generally very small, often several orders of magnitude below<br />
that of the thermo-optic effect. This makes it difficult to use this effect for anything<br />
other than modulating when used in micro-resonators. A possible compromise may be<br />
found, however, in the use of liquid crystals (LC) as the active material [85]. The<br />
electro-optic effect in these crystals manifests itself as a change in the birefringence<br />
caused by rotating molecules. This physical rotation of the molecules makes the<br />
actual process of tuning rather slow, in the order of several milliseconds in nematic<br />
liquid crystals [86]. However, the rotation of the molecules does create very large<br />
changes in refractive index, with values larger than 0.3 reported [87]. Devices based<br />
on liquid crystals would therefore allow for tuning ranges and modulation frequencies<br />
comparable to or larger than those typically found in thermally tuned devices. The<br />
power dissipation in these devices will be considerably lower, however.<br />
32
33<br />
The Micro-Resonator<br />
Plasma-dispersion:<br />
The plasma dispersion effect [88-92] uses excess free carriers to introduce a change in<br />
index. It can be used in semi-conducting materials such as for instance silicon or<br />
gallium-arsenide. In waveguides made from these materials free carriers can be<br />
introduced by external current injection, for instance through the use of a p-i-n diode<br />
configuration [89] or through optical excitation using two-photon absorption (TPA)<br />
[91, 92].<br />
The free carriers that cause the change in index have a certain lifetime in the<br />
waveguide material. The speed with which changes in index can be made is therefore<br />
ultimately limited by the lifetime of the free carriers. This can be a problem in for<br />
instance a material such as silicon for which carrier lifetime is relatively high. The<br />
maximum modulation frequencies in silicon devices that use this effect are therefore<br />
often limited to a few gigahertz.<br />
Opto-optic:<br />
In non-linear optical (NLO) materials light can be used to change the index of a<br />
material [93]. This effect is obtained at high intensities through the optical Kerr effect.<br />
The optical Kerr effect is related to the DC effect. However, in this case the electric<br />
field that creates the change in index is supplied by the light propagating in the<br />
material. The change in index is therefore dependent on the intensity of the light I:<br />
n 0 + 2<br />
= n n I<br />
(2.38)<br />
where n2 is the second-order nonlinear refractive index. In fused silica n2 is relatively<br />
low, around 3 10 -16 cm 2 /W. In semiconductors, however, it can be much higher and,<br />
when combined with the field enhancement capabilities of a micro-resonator, can be<br />
high enough for practical use. Also sub-pico second switching has been demonstrated<br />
in SOI waveguides [94] based on high-power femtosecond pulses.<br />
Micro-mechanic optical:<br />
The refractive index of a waveguide can also be changed through the use of a<br />
mechanical actuator in a Micro-Electro-Mechanical System (MEMS). This is for<br />
instance demonstrated in [29] where a cantilever beam is brought in close proximity<br />
to the resonator waveguide, thereby changing its refractive index.<br />
Chemo-optical:<br />
The chemo-optical effect is based on the change in index of refraction that occurs<br />
when a material is altered in chemical composition. This might for instance occur<br />
when a chemically active layer forms chemical bonds with ions and molecules in its<br />
environment. The added species cause a minute change in the refractive index or<br />
absorption of the active layer which can be detected [95]<br />
Another possibility is to have a solvent, such as for instance water, as the active layer<br />
in which other molecules can be dissolved. The refractive index or absorption in this<br />
layer then changes as a function of the concentration of the molecules in the solution.<br />
This has for instance been used in micro-resonator based sensors [27, 28, 30, 96].<br />
Laser-trimming: Laser trimming is a process that permanently alters the index of a<br />
waveguide. In the process a high power laser is focused on the waveguide. The<br />
intense heat will locally alter [97] the structure of the waveguide and thereby its
Chapter 2<br />
index. Although this can be a time consuming process when many resonators need to<br />
be trimmed it can be a valuable tool in the “fine tuning” process of a resonator. This<br />
can be especially important in passive micro-resonators that have no other means of<br />
tuning or in very small resonators where even small variations in the index can cause<br />
a large deviation of the resonance frequencies as will be shown later in Equation<br />
(2.44).<br />
2.8.2 Wavelength tuning range<br />
All of the effects mentioned in the previous paragraph create a change in the index in<br />
one or all of the materials that make up a waveguide. Together, these changes<br />
constitute a change in the effective refractive index Neff of the waveguide by ∆Neff.<br />
Using Equation (2.11) this can be translated to a change in group index ∆ng. An<br />
expression that determines the shift in resonance wavelength ∆λs as a function of this<br />
parameter can be found by first combining the resonance condition (2.1) and the<br />
expression of the roundtrip phase (2.10) into:<br />
( 2π<br />
)<br />
2<br />
2π<br />
ϕ r = m ⋅ 2π<br />
= ⋅ R ⋅ ng<br />
m = ⋅ R ⋅ ng<br />
λ0<br />
λ0<br />
34<br />
, m ∈ Ν<br />
(2.39)<br />
This equation can then be rearranged to provide the shift in the resonance wavelength<br />
∆λs as a function of the change in the group index ∆ng for a certain fringe order m:<br />
2π<br />
⋅ R ⋅ ( n<br />
g<br />
m<br />
+ ∆ng<br />
)<br />
= λ + ∆λ<br />
Substituting (2.39) for a given m back into in Equation (2.40) then gives:<br />
λ0.<br />
∆n<br />
∆λ<br />
s =<br />
n<br />
g<br />
g<br />
0<br />
s<br />
(2.40)<br />
(2.41)<br />
This equation shows that the resonance shift is only proportional to the change in<br />
group index of the resonator waveguide and is independent of its radius. It is therefore<br />
not possible to change the radius of the resonator in order to get a larger tuning range<br />
of the resonant wavelength. A larger radius will at most enlarge the relative tuning<br />
range ∆λmax/FSR. Ultimately the maximum tuning range is limited by the maximum<br />
of ∆ng which will be different depending on what tuning method is used.<br />
This is not a problem in most thermo-optically tuned devices where, depending on the<br />
materials and geometry used, the tuning range might be as large as 40 nm at a<br />
wavelength of 1550 nm. In fact, thermally tuned resonators with a heater on top of the<br />
resonators can actually benefit from a smaller radius as the power consumption in the<br />
proportionally smaller heater drops.<br />
In electro-optically or opto-optically tuned devices, however, the effects are generally<br />
very small. The tuning range is therefore generally limited to values well below 1 nm.<br />
Although this excludes these devices from applications where large tuning ranges of<br />
several nm are required, such as for instance add-drop multiplexers and routers the<br />
range may still be large enough for use in resonator based modulators.
35<br />
The Micro-Resonator<br />
Whether or not the tuning range is large enough can be determined by looking at the<br />
modulation depth that is possible for a given maximum ∆ng. The modulation depth<br />
∆Mod (in dB) is the difference between the power dropped by a resonator that is in<br />
full resonance at a certain wavelength λ0 and the power dropped at that same<br />
wavelength when the resonator is tuned by ∆ng, as illustrated in Figure 2.20.<br />
P Drop /P In (dB)<br />
0<br />
-5<br />
-10<br />
-15<br />
The modulation depth is given by:<br />
⎛<br />
⎜<br />
P<br />
∆Mod<br />
= 10log<br />
⎜<br />
⎝<br />
Pλ<br />
0 ,<br />
ng<br />
ng+∆ng<br />
Figure 2.20. Modulation depth and resonance shift.<br />
λ<br />
0<br />
∆n<br />
g<br />
⎞<br />
⎟<br />
⎛<br />
= 10log<br />
⎜<br />
⎜1+<br />
F<br />
⎟<br />
⎠ ⎝<br />
C<br />
2 2π<br />
⎞<br />
sin ( π ⋅ R ⋅ ∆n<br />
) ⎟ g<br />
λ0<br />
⎠<br />
(2.42)<br />
Where Pλ0 is the maximum power at resonance wavelength λ0 and Pλ0,∆ng is the power<br />
at that wavelength when ng changes by ∆ng. This equation can be rewritten to give the<br />
change in group index that is required to achieve a certain modulation depth:<br />
∆<br />
∆Mod<br />
⎛ ∆Mod<br />
⎞<br />
⎜ ⎛ ⎞<br />
⎜ 10 F<br />
⎟ 2<br />
= λ ⎟<br />
0 ⋅ arcsin ⋅ R<br />
⎜ ⎜<br />
10 −1<br />
⎟<br />
/ / 2π<br />
(∆Mod
Chapter 2<br />
resonators for instance have a radius around 10 µm. In these resonators a small 1 nm<br />
change would already cause a shift of 0.15 nm (almost 20 GHz), which is already<br />
considered as non acceptable much in many telecom applications.<br />
2.8.3 Filter shape tuning<br />
In addition to shifting the resonant wavelength of the micro-resonator by tuning its<br />
refractive index, it is also possible to tune the field coupling coefficients and the<br />
losses of the resonator. Altering either of these will result in an actual change in the<br />
shape of the filter response rather than just a shift across the spectrum.<br />
2.8.3.1 Changing the field coupling coefficients<br />
The most straightforward way of tuning the coupling coefficients of a resonator is by<br />
placing a heater on top of the coupling region between the resonator and its port<br />
waveguides as shown in Figure 2.21. The heating of the coupler will change the<br />
effective coupling length LC and therefore the field coupling coefficient. The<br />
magnitude of this change is proportional to the length of the coupling region. It is<br />
therefore important to have a sufficiently long coupling region in order to have a large<br />
tuning range of the coupling coefficient. The use of this type of tuning is therefore<br />
mainly limited to resonators with a large radius or racetrack resonators that typically<br />
have a long coupling region.<br />
Figure 2.21. Adjustment of the coupling<br />
coefficient by direct Coupler tuning.<br />
Figure 2.22. Indirect adjustment of the<br />
coupling coefficient via MZI tuning.<br />
A problem that occurs when the coupling region of the resonator is tuned directly is<br />
that it can be difficult to create a tunable coupler that can address the entire range<br />
(from zero to one) of amplitude coupling. This will often require a very long coupler<br />
which is not practical in most cases. A better way of controlling the coupling is then<br />
to use a Mach-Zehnder interferometer to tune the coupling between the resonator and<br />
port waveguide. This MZI is inserted in the coupling region as shown in Figure 2.22<br />
and generally consists of two -3dB couplers and a tunable branch. This allows for<br />
tuning across the entire range while keeping the length of the individual couplers<br />
small.<br />
By tuning the coupling coefficients of the micro-resonator, a number of parameters<br />
associated with its filter response can be adjusted. Amongst the most useful of these<br />
parameters are the power dropped by the resonator and its finesse.<br />
Figure 2.24 shows the effect of the coupling coefficients on the dropped power for a<br />
number of cavity roundtrip losses. Clearly, very large differences in dropped power<br />
36
37<br />
The Micro-Resonator<br />
can be achieved by tuning the coupling coefficients from normal (i.e. κ=0.4-0.7) to<br />
very low values. The tuning of the coupling is therefore ideal for use in wavelength<br />
selective micro-resonator based switches. In fact, this approach allows for far greater<br />
attenuation than the switch based on resonance frequency tuning presented in a later<br />
chapter. This is because the latter approach is fundamentally limited by the fixed<br />
depth of the resonance frequency response whereas the tuning of the coupling<br />
coefficients can actually change this response in its entirety. Regardless of this fact,<br />
this approach is often not practical for use in telecom applications due to the large<br />
resonator radius (and therefore small FRS) required to implement coupler tuning. In<br />
an attempt to circumvent this problem an interesting approach based on MEMS has,<br />
however, been taken by M.M.Lee et al.[98]. This approach uses a micro-electromechanical<br />
actuator to physically vary the distance between the port waveguides and<br />
the resonator. This offers a large tuning range of the coupling coefficient and can be<br />
used on micro-resonator of virtually any size.<br />
P Drop /P In (dB)<br />
0<br />
-10<br />
-20<br />
-30<br />
-40<br />
-50<br />
0.03 dB<br />
0.06 dB<br />
0.16 dB<br />
0.31 dB<br />
0.62 dB<br />
1.25 dB<br />
-60<br />
0.0 0.2 0.4 0.6 0.8 1.0<br />
Field coupling coefficient<br />
Figure 2.24. Dropped power as a function<br />
of the field coupling coefficient with the<br />
roundtrip loss αr as a parameter.<br />
Finesse (log)<br />
1000<br />
100<br />
10<br />
1<br />
0.0 0.2 0.4 0.6 0.8 1.0<br />
Field coupling coefficient<br />
0.03 dB<br />
0.06 dB<br />
0.16 dB<br />
0.31 dB<br />
0.62 dB<br />
1.25 dB<br />
Figure 2.25. Finesse as a function of the field<br />
coupling coefficient with the roundtrip loss αr as<br />
a parameter.<br />
An application where a small resonator radius is of less importance is described in<br />
[45] where micro-resonators are used to create a time delay in signals sent to a phased<br />
array antenna. The delay time in the individual resonators is dependent on their<br />
finesse. The tuning of the coupling coefficients is therefore an ideal way to change<br />
this delay time across a wide range because they can greatly affect the finesse 2.25.<br />
2.8.3.2 Changing the resonator attenuation<br />
The effect that a change in the losses inside the micro-resonator has on its filter<br />
response is largely similar to the effects seen for changes in its coupling coefficients.<br />
Like the tuning of the coupling coefficients, the tuning of the attenuation changes the<br />
finesse and the on-resonance dropped power of the resonator. This is for instance<br />
shown in Figure 2.26a where the drop response of a resonator with κ1=κ2=0.5 and<br />
R=50 µm is given for several values of the waveguide attenuation. However, there are<br />
also some fundamental differences between these two tuning methods.<br />
The first important difference lies in the complexity of the tuning method. As<br />
described in the previous paragraph the tuning of the couplers either requires a large<br />
coupling length, resulting in a comparatively large resonator radius, or, alternatively,
Chapter 2<br />
a rather complex MEMS based solution. In addition to this neither method is very fast<br />
when compared to some of the other tuning methods described in Chapter 2.6.1. Of<br />
course, instead of thermal tuning a faster method such as electro-optic tuning can be<br />
used. However, due to the significantly smaller effects involved, this would require<br />
even longer couplers. Adjusting the cavity losses on the other hand is possible using<br />
very fast methods such as for instance plasma dispersion [99] or optical pumping of<br />
the resonator waveguide doped with rare earths like erbium or neodymium [100].<br />
Also a loss tuning implementation based on MEMS [101] has been demonstrated.<br />
This device, although comparable in tuning speed to the MEMS coupling tuning<br />
solution, is easier to implement because it requires only one actuator placed on top of<br />
the resonator. In devices that require high speed modulation (tuning) loss tuning is<br />
therefore preferable to the tuning of the coupling constants.<br />
P Drop /P In (dB)<br />
0<br />
-5<br />
-10<br />
-15<br />
-20<br />
-25<br />
-30<br />
1547 1548 1549 1550 1551 1552 1553<br />
Wavelength (nm)<br />
1 dB/cm<br />
10 dB/cm<br />
100 dB/cm<br />
1000 dB/cm<br />
Figure 2.26a. Resonator Drop-port<br />
spectrum for different cavity waveguide<br />
losses.<br />
38<br />
P Through /P In (dB)<br />
0<br />
-10<br />
-20<br />
-30<br />
-40<br />
1549.0 1549.5 1550.0 1550.5 1551.0<br />
Wavelength (nm)<br />
1 dB/cm<br />
10 dB/cm<br />
100 dB/cm<br />
1000 dB/cm<br />
Figure 2.26b. Resonator Through-port<br />
spectrum for different cavity waveguide losses.<br />
The second important difference lies in the fact that when the losses in a microresonator<br />
are tuned to a very high value, thereby effectively switching the resonator<br />
off, there will always be a penalty on the signal that passes the resonator. When the<br />
coupling coefficients are tuned to zero the resonator essentially becomes invisible to<br />
this signal. When tuning the losses, however, the coupling values are fixed to a certain<br />
value κt. If it is assumed that all power is lost within the resonator at maximum<br />
resonator attenuation a fraction of the power input signal PIn.κt 2 will therefore be lost<br />
inside the resonator. This can also be seen in Figure 2.26b where, for a resonator with<br />
κ1= κ2=0.5 and R=50µm, around 1.3 dB is lost in the through port for the high losses<br />
of 1000 dB/cm. This may not be a problem when a single or only a few resonators are<br />
used in a device. It can, however, quickly become a bottleneck in telecom devices in<br />
which many resonators are present on the same bus. Although the losses could in<br />
theory be reduced by lowering κt this is often not possible due to dropped power and<br />
bandwidth requirements of these devices. The use of the loss tuning method should<br />
therefore be carefully weighed against other options in such devices.
Chapter 3<br />
Design<br />
In the previous chapter the basic principles that underlie the<br />
operation of a micro-resonator have been explained using a<br />
bottom up approach. If the resonator is to be used in a real-life<br />
application, however, it is best to start by looking at the various<br />
requirements of that application. These requirements, expressed<br />
in specifications of the performance parameters, can then be<br />
used to decide the target values of the basic parameters, such as<br />
for instance the coupling coefficients of the micro-resonator<br />
design. This chapter will begin by discussing a number of<br />
performance parameters with an emphasis on the use of the<br />
micro-resonator in telecom devices. This is followed by some<br />
guidelines for choosing the right resonator geometry. The<br />
design methodologies for both the lateral as well as the<br />
vertically coupled resonators are then given. Finally some<br />
important issues related to device design, up to the prototype<br />
level, will be discussed without going into actual device<br />
implementations.
Chapter 3<br />
3.1 Introduction<br />
The most important question that needs to be addressed when designing a microresonator<br />
or a component comprised of multiple micro-resonators is: “For what will<br />
the resonators be used ?”. Micro-resonators are often considered as the basic building<br />
blocks for optical circuitries of the future and, like their electronic counterpart, the<br />
transistor, have to be designed specifically for a certain task where its suitability for<br />
that task often makes it less suitable for another.<br />
An interesting example of this can be found in the field of all optical switching. The<br />
basic concept of all optical switching is that one optical signal can switch another<br />
optical signal because it brings about a change in the material (e.g. in index or losses)<br />
in which both signals propagate. In general this requires the switching signal to be of<br />
a very high intensity. One solution to achieving these high intensities is through the<br />
use of a micro-resonator where the intra-cavity intensities can be many orders of<br />
magnitude above the input intensities.<br />
The intra-cavity power of a micro-resonator at full resonance can be found by setting<br />
2<br />
φr=2π in Equation (2.14) and dividing the result by κ 2 :<br />
2<br />
PCav<br />
_ Max κ1<br />
χ r<br />
=<br />
2<br />
PIn<br />
( 1−<br />
µ 1µ<br />
2χ<br />
r )<br />
(3.1)<br />
In Figure 3.1 the intra cavity power of a micro-resonator has been plotted as a<br />
function of the field coupling coefficient with the intra-cavity losses as a parameter.<br />
P Cav_Max (dB)<br />
80<br />
60<br />
40<br />
20<br />
0<br />
0.0 0.2 0.4 0.6 0.8 1.0<br />
Field coupling coefficient<br />
Figure 3.1. Intra-cavity power as a function of the field coupling coefficient for several<br />
resonator roundtrip losses.<br />
40<br />
0.03 dB<br />
0.06 dB<br />
0.16 dB<br />
0.31 dB<br />
0.62 dB<br />
1.25 dB<br />
The Figure shows that in a resonator the highest power enhancement is only possible<br />
for very low field coupling coefficients and low cavity losses. For instance, for<br />
resonator roundtrip losses of 0.03 dB (equivalent to a resonator with a radius of 50<br />
µm and waveguide losses of 1 dB/cm) a maximum enhancement of ≈70 dB is<br />
achieved at κ1=κ2=0.06. The same resonator, however, will achieve only 20 dB<br />
enhancement for the moderately higher value of κ1=κ2=0.2. From the perspective of<br />
all optical switching it therefore makes sense to optimize the micro-resonator for very<br />
low losses and very small coupling coefficients. In literature such optimized
41<br />
Design<br />
resonators, based on reflown silica toroid resonators have been reported to achieve a<br />
Q>1 10 8 [102]. Although claims are sometimes made that such devices could be used<br />
in fast switching routers or modulators this can be, by the very nature of the resonator,<br />
a contradiction in terms. Resonators with a high finesse can reach very high intracavity<br />
intensities due to the many roundtrips of the light within the cavity. The same<br />
high number of roundtrips, however, also makes that the buildup to the equilibrium<br />
state in the resonator takes much longer, thereby reducing its bandwidth. This is<br />
readily shown by calculating the bandwidth and power dropped by a particular<br />
resonator in resonance from Equations (2.22) and (2.17). For the resonator in the<br />
example with κ1=κ2=0.06 these are respectively 1.5 GHz and 25% (-6 dB), both of<br />
which are wholly inadequate for state-of-the-art telecom applications.<br />
3.2 The micro-resonator used in telecom applications<br />
Telecom applications, such as for instance those presented in later chapters, are<br />
generally driven by the (increasing) demand for high bandwidth and low losses. When<br />
applying these demands to the filter characteristics of a micro-resonator, parameters<br />
such as finesse and intra-cavity power are quickly relegated to the background and<br />
other parameters become highly important. These parameters are:<br />
• Drop port Insertion Loss (ILDrop)<br />
• Filter rejection ratio (SRR)<br />
• Channel Cross-Talk (CT)<br />
• Filter bandwidth (∆λFWHM)<br />
• Through port insertion loss (ILThrough)<br />
• Through port on-resonance port residual power (PTRes)<br />
All these parameters (except the CT) and their relation to the through and drop<br />
responses of the micro-resonator have been marked in Figures 3.2a and 3.2b and will<br />
be discussed in the following paragraphs. For the value of these parameters a<br />
resonator with a radius of 50 µm is assumed because this specific radius, or a radius<br />
close to it, is used in most of the devices presented in later chapters.<br />
PDrop/PIn (dB)<br />
0<br />
-5<br />
-10<br />
-15<br />
ILDrop<br />
∆λFWHM<br />
-20<br />
1542 1544 1546 1548 1550 1552 1554 1556 1558<br />
Wavelength (nm)<br />
SRR<br />
P Through /P In (dB)<br />
-50<br />
1542 1544 1546 1548 1550 1552 1554 1556 1558<br />
Wavelength (nm)<br />
a)<br />
b)<br />
Figure 3.2. Parameters related to the drop a) and through port b) filter response of a microresonator.<br />
0<br />
-10<br />
-20<br />
-30<br />
-40<br />
ILThrough<br />
PTRes
Chapter 3<br />
3.2.1 Drop port on-resonance insertion loss<br />
The insertion loss ILDrop is a measure of the efficiency with which light of a certain<br />
frequency can be transferred by a micro-resonator from the in to the drop port. This<br />
parameter is especially important for micro-resonator based devices because of their<br />
resonant nature. Depending on the field coupling coefficient even moderate cavity<br />
losses quickly lower the power that can be dropped. Since many micro-resonator<br />
based devices can incorporate a number of MRs in cascade configuration, such as<br />
shown in Figure 3.3, the ILDrop can easily become the dominant factor in overall<br />
device losses.<br />
Figure 3.3. Drop port insertion losses can quickly add up and may largely dictate overall<br />
device IL performance.<br />
The insertion losses can be found by taking Equation (2.14) for a resonator on<br />
resonance where φr=2π.<br />
IL<br />
⎛<br />
−10<br />
⋅ log⎜<br />
⎜<br />
⎝1<br />
+ F<br />
H<br />
⋅ sin<br />
2 2<br />
⎞<br />
⎛ κ ⎞<br />
1 κ 2 χ r<br />
⎟<br />
= −10<br />
⋅ log H = −10<br />
⋅ log<br />
⎜<br />
⎟<br />
( π ) ⎠<br />
⎝ ( 1−<br />
µ 1µ<br />
2χ<br />
r ) ⎠<br />
Drop = 2<br />
2<br />
C<br />
42<br />
(3.2)<br />
Ideally ILDrop has a value as close to zero as possible. Due to resonator losses,<br />
however, not all power is extracted from the in-port in addition to the power lost<br />
within the cavity.<br />
Figure 3.4 shows the insertion loss as a function of the field coupling coefficient κ<br />
(κ1=κ2) and the roundtrip losses αr=2.π.R.αdB in the resonator. As is evident from the<br />
figure, ILDrop rises sharply for small coupling coefficients. In theory, the higher<br />
insertion losses can be reduced by lowering the roundtrip losses. In practice, however,<br />
although reduction of scattering induced losses may be possible, the bend and<br />
intrinsic material losses pose a hard lower limit.
IL Drop (dB)<br />
80<br />
60<br />
40<br />
20<br />
0<br />
0.0 0.2 0.4 0.6 0.8 1.0<br />
Field coupling coefficient<br />
43<br />
0.03 dB<br />
0.06 dB<br />
0.16 dB<br />
0.31 dB<br />
0.62 dB<br />
1.25 dB<br />
Figure 3.4. Drop insertion loss as a function of the field coupling coefficient for several<br />
resonator roundtrip losses.<br />
3.2.2 Filter rejection ratio<br />
Design<br />
In Chapter 2.4 the filter rejection ratio was first introduced. The filter rejection ratio,<br />
which was previously shown to be:<br />
S RR<br />
⎛ ( 1+<br />
µ 1µ<br />
2χ<br />
r )<br />
10.<br />
log<br />
⎜<br />
⎝ ( 1−<br />
µ 1µ<br />
2χ<br />
r )<br />
= 2<br />
2<br />
⎞<br />
⎟<br />
⎠<br />
(3.3)<br />
is plotted in Figure 3.5 as a function of the coupling coefficient and the roundtrip<br />
losses with values identical to those of Figure 3.4.<br />
S RR (dB)<br />
60<br />
50<br />
40<br />
30<br />
20<br />
10<br />
0<br />
0.0 0.2 0.4 0.6 0.8 1.0<br />
Field coupling coefficient<br />
0.03 dB<br />
0.06 dB<br />
0.16 dB<br />
0.31 dB<br />
0.62 dB<br />
1.25 dB<br />
Figure 3.5. Drop selectivity as a function of the field coupling coefficient for several resonator<br />
roundtrip losses.<br />
From Figure 3.4 it could already be concluded that the coupling coefficient should not<br />
be chosen too small because of the rise in insertion losses. However, from Figure 3.5<br />
it can be concluded that the coupling coefficient should not be chosen too high either<br />
since it will adversely affect the filter rejection ratio. Both the high insertion losses at<br />
small coupling coefficients and the low selectivity at high coupling therefore limit the<br />
useful range of the coupling coefficient in resonator based designs. This is especially<br />
true for telecom applications where both low insertion losses and a high rejection ratio<br />
are required.
Chapter 3<br />
3.2.3 Filter bandwidth<br />
In Chapter 2.5 it was already shown that there is a direct tradeoff between the<br />
resonator filter rejection ratio and its bandwidth. In Equation (2.31) the bandwidth<br />
was already expressed in terms of the free spectral range and SRR but it does not<br />
provide a clear relation to the cavity losses and coupling coefficients required. This is<br />
therefore done in Equation (3.4) which can be found by combining (2.22) and (2.30):<br />
∆ λ<br />
FWHM<br />
2<br />
FSR(<br />
1−<br />
µ 1µ<br />
2χ<br />
r ) λ0<br />
( 1−<br />
µ 1µ<br />
2χ<br />
r )<br />
≈<br />
=<br />
2<br />
π µ µ χ 2n<br />
. R.<br />
π µ µ χ<br />
1<br />
2<br />
r<br />
44<br />
g<br />
1<br />
2<br />
r<br />
(3.4)<br />
Figure 3.6 shows the filter bandwidth of a resonator with ng=1.5 at λ0=1550 nm for a<br />
number of cavity losses.<br />
FWHM (GHz)<br />
1000<br />
100<br />
10<br />
1<br />
0.03 dB<br />
0.16 dB<br />
0.62 dB<br />
0.1<br />
0.0 0.2 0.4 0.6 0.8<br />
Field coupling coefficient<br />
Figure 3.6. Filter bandwidth vs. coupling coefficient for three different roundtrip losses.<br />
For low coupling coefficients the cavity roundtrip loss is clearly an important<br />
parameter to be considered as it affects the filter bandwidth quite significantly. The<br />
increase of bandwidth for an increase in losses is, however, due to an overall<br />
reduction of resonator performance, including the finesse and the dropped power. For<br />
moderate to large coupling (>0.4) the effect of the cavity losses is relatively minor<br />
and the bandwidth is mainly determined by the coupling coefficients. In 3.1.1 and<br />
3.1.2 it was already stated that for practical uses in telecom the coupling coefficients<br />
should not be chosen too high or too low. By choosing a particular filter bandwidth<br />
this range can be narrowed down even further. A bandwidth of 10 GHz (≈0.08 nm)<br />
will for instance require the field coupling κ to be >0.2. For a bandwidth of 40 GHz<br />
the coupling needs to be increased even further to >0.4 (at a roundtrip loss of 0.03<br />
dB). Another way to increase the filter bandwidth, as follows from Equation (3.4), is<br />
to decrease the radius of the resonator. The added benefit of this is that it will keep<br />
some of the other resonator parameters, such as for instance the SRR, more or less<br />
unchanged whereas these would be greatly affected by a change of the coupling. In<br />
many instances, however, a reduction in radius will not be possible as was explained<br />
in Chapter 2.6.
3.2.4 Channel Crosstalk<br />
45<br />
Design<br />
An ideal optical telecom system provides a large bandwidth as well as a high filter<br />
rejection ratio. The high rejection ratio is required in order to keep the channel<br />
crosstalk as low as possible. The adjacent channel crosstalk (CT) is the measure by<br />
which an optical signal in one channel can interfere with a signal in an adjacent<br />
channel. This is illustrated in Figure 3.7. In which the vertical lines show the locations<br />
of different channels on, in this instance, the ITU grid [103].<br />
P Drop /P In (dB)<br />
0<br />
-2<br />
-4<br />
-6<br />
-8<br />
-10<br />
-12<br />
-14<br />
-16<br />
-18<br />
1547 1548 1549 1550 1551 1552 1553 1554<br />
Wavelength (nm)<br />
Figure 3.7. Definition of the adjacent channel crosstalk.<br />
The adjacent channel crosstalk is here defined as the relative power fraction of a<br />
signal that is present on a channel adjacent to the channel λc on which this signal is<br />
transmitted. Following the derivation given in Appendix B the crosstalk can be<br />
expressed in terms of the channel separation ∆λcs, the Finesse and the Free Spectral<br />
Range:<br />
CT<br />
≡<br />
P ( = + ∆ )<br />
2<br />
drop λ λc<br />
λcs<br />
⎛ sin ( π.<br />
∆λ<br />
/ FSR)<br />
⎞<br />
10. log(<br />
= −10log<br />
⎜<br />
⎜1+<br />
⎟<br />
2<br />
Pdrop<br />
( λ = λc<br />
)<br />
⎝ sin ( π / 2F<br />
) ⎠<br />
(3.5)<br />
Figures 3.8a and 3.8b respectively show the crosstalk of a single resonator at an ITU<br />
channel spacing of 50 GHz and 100 GHz (∆λcs≈0.8 nm) for a resonator with R=50 µm<br />
and ng=1.5 at λ0=1550 nm.<br />
These figures show that the crosstalk can potentially be a major problem when a<br />
micro-resonator is used as a filter in applications that use these channel spacings.<br />
Although very low crosstalk values of
Chapter 3<br />
(resulting in a higher bandwidth) but also offer a steeper filter “roll-off” that reduces<br />
the channel crosstalk.<br />
Crosstalk (dB)<br />
0<br />
-10<br />
-20<br />
-30<br />
-40<br />
0.03 dB<br />
0.06 dB<br />
0.16 dB<br />
0.31 dB<br />
0.62 dB<br />
1.25 dB<br />
-50<br />
0.0 0.2 0.4 0.6 0.8<br />
Field coupling coefficient<br />
a)<br />
b)<br />
Figure 3.8a. Channel crosstalk of a single resonator filter for ∆λcs=50 GHz a) and ∆λcs=100<br />
GHz b) and for several resonator roundtrip losses.<br />
3.2.5 Through port insertion loss<br />
46<br />
Crosstalk (dB)<br />
0<br />
-10<br />
-20<br />
-30<br />
-40<br />
-50<br />
0.0 0.2 0.4 0.6 0.8<br />
Field coupling coefficient<br />
0.03 dB<br />
0.06 dB<br />
0.16 dB<br />
0.31 dB<br />
0.62 dB<br />
1.25 dB<br />
In some applications, such as for instance the router described in Chapter 7, many<br />
resonators are present on the same bus waveguide as shown in Figure 3.9.<br />
Figure 3.9. When many resonators are present on the same bus it will reduce the power of<br />
the signals on that bus.<br />
Since each of these resonators extracts some of the power from the bus waveguide,<br />
even at frequencies for which they are not in resonance, the power of the signals in<br />
the bus waveguide will be reduced with every passing of a resonator. If there is only<br />
one channel on the bus waveguides then all resonators that do not drop this signal can<br />
be tuned maximally off resonance with respect to this signal ( φr=(2.m+1).π. In this<br />
case the reduction in power (insertion loss, ILThrough) on the signal on the bus for each<br />
resonator that is passed is given by:<br />
ILThrough<br />
⎛ ( µ 1 + µ 2χ<br />
r )<br />
−10log<br />
⎜<br />
⎝ ( 1+<br />
µ 1µ<br />
2χ<br />
r )<br />
= 2<br />
2<br />
⎞<br />
⎟<br />
⎠<br />
(3.6)<br />
In Figure 3.10a the through port insertion loss for this situation is shown as a function<br />
of the field coupling coefficient for a number of roundtrip losses. As can be seen the<br />
insertion loss is relatively insensitive to the roundtrip losses. At a coupling of 0.5 the<br />
ILThrough is only 0.04 dB so that, up to twenty five micro-resonators can easily be<br />
allowed to be on the same bus if a total signal loss of 1 dB is acceptable. For coupling<br />
coefficients higher than 0.7, however, the insertion loss becomes quite considerable<br />
and these should therefore be avoided in most applications.
47<br />
Design<br />
In most cases, rather than a single channel there will be multiple channels on the bus<br />
so that the resonators cannot be tuned to be maximally off for all channels. In these<br />
cases the power that is extracted from a channel on the bus can be calculated using:<br />
IL<br />
2<br />
2 2<br />
⎛ µ<br />
⎞<br />
1 − 2χ<br />
r ⋅ µ 1µ<br />
2 ⋅ cos( 2π<br />
⋅ ∆λcr<br />
/ FSR)<br />
+ χ r ⋅ µ 2<br />
= −10log<br />
⎜<br />
⎟<br />
2 2<br />
⎝1<br />
− 2χ<br />
r ⋅ µ 1µ<br />
2 ⋅ cos( 2π<br />
⋅ ∆λcr<br />
/ FSR)<br />
+ µ 1 µ 2 ⋅ χ r ⎠<br />
Through _ ∆λ 2<br />
(3.7)<br />
where ∆λcr is the difference between the center wavelength of a channel on the bus<br />
and the resonance wavelength of the resonator. In a practical application a single free<br />
channel (i.e. a channel that is not present on the bus) might be chosen to “park” all<br />
resonators that should not drop a signal. If the spacing between the channels is<br />
defined as ∆λcs then ∆λcr=∆λcs.<br />
Figure 3.10b shows the through port insertion loss for this situation calculated for this<br />
case where ∆λcr=0.8 nm (≈100 GHz @ λ=1550 nm) for a resonator with R=50 µm and<br />
ng=1.5 at λ0=1550 nm. As can be expected the losses are considerably higher in this<br />
case. For a field coupling of 0.5 the ILThrough has now risen to 0.4 dB (for αr=0.03 dB).<br />
That this can have a significant effect in the behavior of a device is for instance shown<br />
in the drop response measurements of the 1300 nm OADM presented in Chapter 7.<br />
Here the power dropped power by the fourth resonator on the bus is ≈ 2dB lower than<br />
that of the first resonator on the bus.<br />
ILThrough (dB)<br />
8 0.03 dB<br />
0.06 dB<br />
0.16 dB<br />
6<br />
0.31 dB<br />
0.62 dB<br />
1.25 dB<br />
4<br />
2<br />
0<br />
0.0 0.2 0.4 0.6 0.8 1.0<br />
Field coupling coefficient<br />
a)<br />
b)<br />
Figure 3.10. Through port insertion loss as a function of the field coupling coefficient for several<br />
resonator roundtrip losses. In a) the resonator is tuned to be maximally off-resonance for a channel<br />
on the bus while in b) the resonance wavelength of the resonator differs by 0.8 nm from the channel<br />
center wavelength.<br />
3.2.6 Through port on-resonance residual power<br />
0.2 0.3 0.4 0.5 0.6 0.7 0.8 0.9<br />
Field coupling coefficient<br />
In many applications the small power fraction that is still present in the in the through<br />
port of a resonator at resonance is not an issue. However, in some applications, this<br />
residual power can create some undesirable results.<br />
In the add-drop multiplexer shown in Figure 3.11 for instance the residual power in<br />
the through port of the first resonator can interfere with the signal that is added by the<br />
second resonator. This may result in detection errors in the added signal when its<br />
power is in the same order of magnitude as the power of the through port signal.<br />
ILThrough @100 GHz<br />
6<br />
5<br />
4<br />
3<br />
2<br />
1<br />
0<br />
0.03 dB<br />
0.06 dB<br />
0.16 dB<br />
0.31 dB<br />
0.62 dB<br />
1.25 dB
Chapter 3<br />
Figure 3.11. Residual channel power may interfere with other operations in a device.<br />
In the case of the polarization independent router described in Chapter 8 the residual<br />
through port signal will even show up as a reflection in the input signal which is<br />
highly undesirable for telecom applications. It is therefore important to design the<br />
resonators in these applications in such a way that the through port residual power is<br />
as low as possible. For a resonator in resonance this power PTRes is given by:<br />
P<br />
T Re s<br />
P<br />
In<br />
⎛ ( µ 1 − µ 2χ<br />
r )<br />
10log<br />
⎜<br />
⎝ ( 1−<br />
µ 1µ<br />
2χ<br />
r )<br />
= 2<br />
48<br />
2<br />
⎞<br />
⎟<br />
⎠<br />
(3.8)<br />
As can be seen in Figure 3.12 the residual through port power is quite sensitive to the<br />
resonator roundtrip losses. These should therefore be as low as possible. Also, from<br />
the perspective of the residual power, the coupling between the resonator and the port<br />
waveguides should be is high as possible.<br />
PTres/PIn (dB)<br />
0<br />
-10<br />
-20<br />
-30<br />
-40<br />
-50<br />
-60<br />
Drop Add<br />
0.03 dB<br />
0.06 dB<br />
0.16 dB<br />
0.31 dB<br />
0.62 dB<br />
1.25 dB<br />
-70<br />
0.0 0.2 0.4 0.6 0.8 1.0<br />
Field coupling coefficient<br />
Figure 3.12. Through port residual power as a function of the field coupling coefficient for a<br />
number of resonator roundtrip losses.<br />
X
3.2.7 Design parameter summary<br />
49<br />
Design<br />
In Table 3.1 the parameters discussed in the previous paragraphs and the requirements<br />
they place on the roundtrip losses αr and coupling κ have been summarized.<br />
Table 3.1. Parameter design rules for a micro-resonator used in telecom applications.<br />
Parameter αr κ<br />
ILDrop low medium to high<br />
PTRes low medium to high<br />
∆λFWHM not so important κ high enough to obtain<br />
desired bandwidth<br />
CT low to medium low<br />
ILThrough not important low<br />
SRR low low to medium<br />
In practice a balance will have to be found between the requirements of the three<br />
upper and the three lower parameters in this table. In most applications the lower limit<br />
of κ will be set by the bandwidth requirement while the upper limit is set by the SRR or<br />
the CT. For the micro-resonators used in the following chapters this range is often<br />
between 0.4 and 0.6. A good maximum target for the roundtrip losses in this range is<br />
then ≈0.06 dB (about 2 dB/cm for a resonator with a 50 µm radius).
Chapter 3<br />
3.3 Geometrical design choices<br />
After the most suitable values for the micro-resonator parameters, such as the<br />
roundtrip losses and the coupling coefficients, have been found through careful<br />
examination of the system parameters, the actual micro-resonator can be designed.<br />
However, before the resonator can be designed, the decision has to be made on what<br />
kind of resonator to use. Up to this point the micro-resonators used in the analytical<br />
discussion and the various figures assumed a micro-resonator geometry where the<br />
resonant cavity is formed by a ring. This is not the only useful geometry, however.<br />
Depending on the application in which the micro-resonator is used other cavity<br />
geometries are also possible and may actually be superior to that of the ring resonator.<br />
3.3.1 Micro-resonator geometry<br />
The three most commonly used resonator types are shown in Figure 3.13. These are<br />
the previously introduced ring resonator, the disc and the racetrack resonator.<br />
Figure 3.13a. Disc resonator. Figure 3.13b. Ring<br />
resonator.<br />
50<br />
Figure 3.13c. Racetrack<br />
resonator.<br />
Disc resonators, due to their single edge geometry, have inherently low losses<br />
compared to the other geometries. Disc resonators are therefore attractive for use in<br />
sensing systems [27] that, in order to achieve a high sensitivity, require many<br />
roundtrips of the light within the resonator. A downside to the disc resonator<br />
compared to the other geometries is that it is more susceptible to higher order modes<br />
which make it a less attractive option in telecom applications.<br />
In a ring-resonator these higher order modes can be suppressed by choosing the width<br />
of the ring in such a way that, while the fundamental mode is still propagating as a<br />
whispering gallery mode, higher order modes are suppressed by losses incurred<br />
through lower waveguide confinement and edge scattering.<br />
A problem that occurs for both the disc and ring geometries is that for small radii the<br />
coupling length between the resonator and port waveguides becomes very short,<br />
resulting in often undesirable low resonator coupling. Although this problem can in<br />
part be solved by reducing the coupling gap between the resonator and its port<br />
waveguides it is eventually limited by lithographical resolution and losses within the<br />
coupling section due to modal overlap losses [51].<br />
A racetrack shaped resonator is created by elongating the coupling region of a ring<br />
resonator through the addition of a straight waveguide. This makes the racetrack<br />
resonator more effective than a ring resonator at small ring radii due its comparatively<br />
higher coupling with the port waveguides. In addition the coupling strength of a<br />
racetrack resonator is easier to adjust since it requires a change in the length of the
51<br />
Design<br />
straight waveguide instead of a lithographically more challenging change in coupling<br />
gap width.<br />
A downside to using a racetrack resonator is that it can have substantially higher<br />
losses compared to disc or ring resonators. This is caused by transition losses that<br />
occur at the interfaces between the straight and ring waveguides where the<br />
propagating modes have to adapt to the changing geometry. These transition losses<br />
are of most concern at low contrasts where achieving a good modal overlap between<br />
straight and ring modes can be challenging. In high index materials such as silicon<br />
nitride and silicon, however, creating a low loss transition is less problematic because<br />
of better modal confinement.<br />
3.3.2 Vertical or lateral coupling<br />
Besides deciding on the general geometry of the resonator a choice has to be made on<br />
how the resonator will be coupled to its port waveguides. The two options that can be<br />
considered for this are vertical and lateral coupling where each option has its own<br />
advantages and disadvantages.<br />
Ring<br />
Gap<br />
Figure 3.14. Cross-section, top-view and<br />
fabricated example of a vertically coupled<br />
resonator.<br />
Figure 3.15. Cross-section, top-view and<br />
fabricated example of a laterally coupled<br />
resonator.<br />
For vertical coupling the resonator and the port waveguides are placed in different<br />
layers as is shown for a ring resonator in Figure 3.14. For lateral coupling the<br />
Ring<br />
Gap
Chapter 3<br />
resonator and the port waveguide are placed next to each other in the same layer as is<br />
shown in Figure 3.15. The main discerning factor between these configurations lies in<br />
how the gap between the resonator and port waveguides is defined. Since the gap<br />
between the port and resonator waveguides largely defines the coupling κ and thus the<br />
behavior of the resonator this gap needs to be accurately set.<br />
For vertical coupling the gap can be accurately controlled by the thickness of the layer<br />
deposited on top of the port waveguide (separation layer). The gap is therefore<br />
fabrication process dependent and can usually be controlled down to a few<br />
nanometers. An additional benefit lies in the fact that if the coupling turns out to be<br />
too small or too large only the thickness of the separation layer needs to be adjusted<br />
and no new mask design is required. Due to the fact that the resonator and the port<br />
waveguides are in different layers there is an additional degree of freedom in the<br />
choice of waveguide materials. It is for instance possible to combine low loss SiON<br />
port waveguides with a high index contrast Si3N4 ring resonator. However, it also<br />
poses some problems. The most notable of these is in the alignment of the resonator to<br />
the port waveguides. Misalignment will lead to an asymmetry between the couplers<br />
on the input and the drop side, which leads to undesirable resonator behavior or, in the<br />
worst case, an inability to couple light in or out of the resonator. Additionally the<br />
extra manufacturing steps involved in making the extra waveguide layer are time<br />
consuming (and thus expensive) and cause the device to be more susceptible to<br />
manufacturing errors.<br />
The problems that a vertical resonator design faces are essentially solved by the<br />
lateral design. The alignment between the resonator and the port waveguides is now<br />
solely defined by the mask design. Due to the fact that both the resonator and port<br />
waveguides are in one layer manufacturing is also faster and less prone to errors.<br />
However, there are also some important downsides to lateral coupling. Because the<br />
resonator and port waveguides are defined on the same mask, the resolution of the<br />
lithography can become a limiting factor in the choice of the gap-width between these<br />
waveguides. The gap cannot be too large because no coupling would occur, but also<br />
not too small because the gap might not open. Depending on the maturity of the<br />
available technology this can be an important factor in the choice between lateral or<br />
vertical coupling. Another problem is that design errors related to the coupling<br />
coefficients of the resonators require a whole new mask to be designed and fabricated,<br />
unless many variations of a design have been made on a mask to preempt these errors<br />
52
3.4 Material system<br />
53<br />
Design<br />
Besides the geometrical type of resonator the material system in which the microresonator<br />
will be fabricated also plays an important role in the resonator design. A<br />
waveguide core fabricated in a material such as silicon for instance allows for very<br />
small devices to be built due to its very high refractive index. However, as Equation<br />
(2.44) showed these devices will also be more sensitive to the fabrication process. In<br />
addition silicon is quite sensitive to changes in temperature due to its comparatively<br />
high thermo-optical coefficient of 1.84 10 -4 °C -1 . While this can be highly useful for<br />
making thermo-optical devices with a wide tuning range [104] it also makes these<br />
devices more sensitive to changes in ambient temperature.<br />
In addition to deciding which material will be used for the core, a material for the<br />
cladding layer, which will be put on top of the waveguides, also has to be chosen in<br />
many instances. This layer might be added to serve as a passivation or protective layer<br />
or, in the case of thermally tuned resonators to act as a separation layer to place the<br />
metal electrode a safe distance away from the waveguides. Since the cladding is part<br />
of the resonator waveguide its index influences the confinement of the resonator mode<br />
and thus its losses. Although it might be expected that the lowest modal losses are<br />
achieved for the highest index contrast between the ring waveguide and the cladding<br />
this is not necessarily the case. This is for example shown in Figure 3.16 where the<br />
refractive index and the modal attenuation of the TE0 mode are given as a function of<br />
the upper cladding index (the substrate is SiO2 with n=1.45). These parameters were<br />
calculated for a bend waveguide with a width of 2.5 µm, a height of 300 nm and a<br />
radius of 25 µm at a wavelength of 1550 nm.<br />
The figures show that the modal losses of the resonator can be minimized for a<br />
cladding index of about 1.4, giving losses of about 0.35 dB/cm. They also show that a<br />
cladding with nc≈1.47 has about the same pure bending losses as an air cladding with<br />
nc=1. For a cladding with an index >1.48 the losses quickly become unacceptable.<br />
The reason for the unexpected decrease of the bending losses for nc≈1.4 lies in the fact<br />
that at this value the fundamental mode has its highest confinement. At indices higher<br />
than 1.4 the reduced contrast between the core and the cladding decreases the<br />
confinement. For indices lower than 1.4 the asymmetry of the waveguide reduces the<br />
modal confinement [105].<br />
Figure 3.16. Effective refractive index (left) and attenuation (right) of the fundamental mode in<br />
a bend waveguide as a function of the upper cladding index.
Chapter 3<br />
Another important fact when comparing the losses for nc=1 and nc=1.47 is that<br />
although the bending losses are equal for these indexes, the total losses for a ring<br />
resonator with nc=1.47 will in fact be lower. This is because the scattering losses in<br />
the waveguide due to surface roughness are increased with the difference in refractive<br />
index between core and cladding [106, 107] as shown by Equation (3.9).<br />
α<br />
scatter<br />
2<br />
( ncore − n<br />
≈ 4<br />
λ<br />
54<br />
2<br />
c<br />
)<br />
2<br />
(3.9)<br />
Using this equation the losses due to scattering for an air cladded MR can be<br />
calculated to be approximately 3 and 2.2 times higher than the losses for a ring with a<br />
cladding index of 1.47 and 1.4 respectively. Depending on the fabrication process it<br />
may therefore often be favorable to add a cladding, even if this is not required by the<br />
application.
3.5 Vertical resonator design<br />
55<br />
Design<br />
The design of a vertically coupled resonator can be described in three phases. These<br />
are, in chronological order:<br />
• Decide in which material system the resonator will be fabricated.<br />
• Design the resonator such that the desired radius is reached at acceptable<br />
roundtrip losses. Then design a monomodal port waveguide that is sufficiently<br />
phase matched to the resonator to achieve the field coupling required by the<br />
device in which the resonator will be used.<br />
• Set the field coupling coefficients to their required values. For this the lateral<br />
as well as the vertical distance between the resonator and port waveguides can<br />
be varied.<br />
3.5.1 Resonator design<br />
The vertically coupled resonator consists of two optical layers. Its design strategy as<br />
shown in Figure 3.17 is therefore relatively simple because the port and resonator<br />
waveguides can be designed separately.<br />
Figure 3.17. Vertical resonator design strategy.
Chapter 3<br />
The flowchart of the design can be described as follows:<br />
1. Start by designing a monomodal waveguide geometry.<br />
2. Lower the radius of this waveguide until the bend losses become too high.<br />
3. Reduce these losses by increasing the width and/or height of the bend and<br />
continue decreasing the radius. This process repeats itself until the desired<br />
radius is reached or no further improvement is possible. This might for<br />
instance be the case if the thickness of the waveguide cannot be increased due<br />
to technological constraints. The thickness of a Si3N4 layer for instance is<br />
typically limited to 300 nm due to material stress.<br />
4. If a resonator of the desired radius is found then a waveguide has to be<br />
designed with an effective refractive index that is close to that of the resonator.<br />
The ideal case is to have full phasematching (∆Neff=0.0) because it simplifies<br />
other design aspects. However, in theory the difference in effective indices<br />
only has to be lower than ∆NeffκMax which is here defined as the maximum<br />
difference in refractive index for which certain desired field coupling<br />
coefficients are still possible (provided that the effective length of the coupling<br />
region is also long enough for the desired field coupling coefficients).<br />
3.5.2 Resonator propagation losses<br />
As was shown in Chapter 3.2 the losses in the resonator can be an important factor<br />
contributing to its performance. There are three contributing factors to the losses<br />
within the cavity:<br />
• Bending losses, also referred to as “pure” bending losses. These losses are due<br />
to the fact that the phase front of a mode needs to remain planar as it traverses<br />
a bend as is shown in Figure 3.18. This is only possible if the tangential speed<br />
of the wave front increases with increasing radius. However, at the radiation<br />
caustic the tangential speed approaches the speed of light (in the material of<br />
the waveguide). Beyond this point the tail of the mode has to break off from<br />
the guided mode and will radiate outside the waveguide causing propagation<br />
losses.<br />
Figure 3.18. Radiation losses within a bend.<br />
• Intrinsic material losses, caused by absorption of power in the materials of<br />
which the waveguides are made.<br />
56
57<br />
Design<br />
• Other material losses, such as scattering at imperfections within the waveguide<br />
or due to surface roughness of the waveguide that are often related to the<br />
fabrication process.<br />
The material and fabrication losses are determined by the quality of processing and<br />
the choice of materials and are therefore difficult to reduce without considerable<br />
effort. The pure bending losses, however, can be controlled by changing the width,<br />
height and radius of the resonator. In Section 3.2.7 it was already mentioned that<br />
acceptable roundtrip losses are in the order of 0.06 dB and these dimensions should<br />
therefore be optimized to achieve this. In many instances it may be rewarding to<br />
reduce the losses even further. Caution should then be taken, however, with respect to<br />
the first and higher order modes in the resonator. When the fundamental mode losses<br />
are reduced this will also reduce the losses of the higher order modes and while<br />
propagation losses of 200 dB/cm may seem high, this is still sufficient to create a 3<br />
dB resonance dip in the trough response of a resonator with a radius of 50 µm and<br />
κ1=κ2=0.5.<br />
3.5.3 Determination of the coupling coefficients<br />
In a vertically coupled resonator a straight waveguide couples to a bend waveguide<br />
that has an offset both in the lateral and vertical direction. Due to this complex<br />
coupling region geometry the field coupling coefficients can be very hard to<br />
determine. Typical approaches might for instance use 3D-FDTD or BPM but these are<br />
either very time consuming or, if BPM is used, not very accurate for small resonators.<br />
Hence, a faster method [48, 49, 108, 109] based on coupled mode theory (CMT) was<br />
used to calculate the coupling for coefficients. This method was developed within the<br />
NAIS framework by the AAMP group [110] at the University of <strong>Twente</strong> and typically<br />
takes less than a minute to calculate the coupling coefficient for a given coupler<br />
geometry.<br />
Vertical<br />
offset<br />
Ring<br />
resonator<br />
Lateral offset<br />
Port<br />
waveguide<br />
Figure 3.19. Definition of the vertical and lateral offset.<br />
By using this software to calculate the coupling coefficients for a number of vertical<br />
and lateral offsets, which are defined as shown in Figure 3.19, the most suitable<br />
geometry can be determined for a given coupling coefficient. That the phase matching<br />
greatly influences the coupling coefficients can be seen in the calculation results in<br />
Figure 3.20a and 3.20b. The first figure shows the coupling coefficients that were<br />
calculated for a geometry in which the resonator and the port resonators were well<br />
matched (∆Neff=0.008), allowing for a maximum power coupling of more than 0.9.<br />
When the phase matching is less perfect, however, the maximum coupled power can<br />
be greatly reduced. The results shown in the second figure were for instance obtained<br />
by slightly increasing the resonator thickness of the matched geometry to create a<br />
phase mismatch of ∆Neff=0.040.
Chapter 3<br />
While the resonator in the phase-mismatched example only has a maximum power<br />
coupling of 0.5 this is not necessarily a problem as long as the coupling coefficients<br />
required by the design can be met. However, if it is possible, a phase matched<br />
resonator is the preferred option due to increased fabrication tolerances. A comparison<br />
between the data in Figures 3.20a and 3.20b shows that the phase matched resonator<br />
is less sensitive to variations in the lateral offset at a given vertical offset. A phase<br />
matched resonator is therefore more tolerant to errors in the lateral alignment which is<br />
typically one of the biggest problems in the fabrication of vertically coupled<br />
resonators. In addition minor variations in the layer thickness between the port<br />
waveguides in the resonator also have less effect.<br />
Figure 3.20a. The power coupling coefficient<br />
(κ 2 ) as a function of the lateral and vertical<br />
offset for ∆Neff=0.008.<br />
58<br />
Figure 3.20b. The power coupling coefficient<br />
(κ 2 ) as a function of the lateral and vertical<br />
offset for ∆Neff=0.04.
3.6 Lateral resonator design<br />
59<br />
Design<br />
The laterally coupled micro-resonator, although being easier to fabricate than the<br />
vertically coupled resonator, is more complicated to design.<br />
The higher complexity is due to the fact that both the resonator and port waveguides<br />
are defined in the same optical layer and therefore inherently have the same<br />
waveguide thickness. The only variable that therefore makes the difference between a<br />
resonator and a port waveguide is their width. For a resonator the width is generally<br />
chosen large to reduce its bending losses. The width of the port waveguides on the<br />
other hand has to be small enough to ensure mono-modality. Increasing the width of<br />
the resonator, however, can only reduce the bending losses by a limited amount.<br />
Therefore, if after widening the waveguide the losses are still too high for a certain<br />
desired radius, the only option is to increase the layer thickness. This will in turn<br />
require a reduction in de width of the port waveguides so that these remain monomodal.<br />
Although this balancing act works to a certain degree it is ultimately limited<br />
by the fabrication technology that places a lower limit on the width of the<br />
waveguides.<br />
Additional complexity is added to the design process when the laterally coupled<br />
micro-resonator is a true ring-resonator. In such a resonator the phase matching<br />
between the resonator and port waveguides has to be considered in the design. This<br />
complicates the design task because the resonator and port waveguides have the same<br />
height and can therefore only be varied in width to keep the difference between their<br />
refractive indices as low as possible.<br />
The problem of the phase matching can be avoided altogether by choosing a racetrack<br />
instead of a ring resonator. As was previously mentioned in Section 3.3.1 this type of<br />
resonator has slightly higher roundtrip losses due to the overlap losses between the<br />
bend and straight waveguide sections that make up the resonator. By careful design,<br />
however, these losses can remain low and in many devices the additional losses can<br />
be compensated for by an increase of the coupling coefficients. In high index devices<br />
made in, for instance, silicon this might not even be necessary since the overlap losses<br />
are typically very small for these devices.<br />
For this reason all the lateral resonators presented in later chapters are of the racetrack<br />
type. An additional reason for doing so was the fact that the lithography at the<br />
MESA+ Research institute [111] simply cannot reliably define gaps smaller than 0.7<br />
µm. Midrange coupling coefficients (≈0.5) would therefore simply not be possible for<br />
a small-radius ring-resonator.<br />
The design of the laterally coupled racetrack resonator, like that of the vertically<br />
coupled resonator, can be described in three phases. These can be summarized as:<br />
• Decide in which material system the resonator will be fabricated.<br />
• Design the resonator and the port waveguides such that the desired radius is<br />
reached at acceptable roundtrip losses, the port waveguides are monomodal<br />
and the overlap losses are small.<br />
• Set the field coupling coefficients to their required values. For the racetrack<br />
resonator this is achieved by choosing an appropriate length of the straight<br />
waveguide section of the racetrack.
Chapter 3<br />
3.6.1 Port waveguide and resonator design<br />
After the choice of the materials in which the resonator is to be fabricated the<br />
resonator and port waveguides can be designed based on the properties of these<br />
materials such as their refractive index and fabrication restrictions (e.g. maximum<br />
layer thickness). This design process is described in the flowchart in Figure 3.21.<br />
Figure 3.21. Lateral resonator design strategy.<br />
This flowchart can be described as follows:<br />
1. Start by designing a monomodal port waveguide geometry. This will be the<br />
geometry of the port waveguides and is used as the starting point from which<br />
the bend geometry is derived.<br />
2. Lower the radius of this waveguide until the bend losses become too high.<br />
3. Reduce these losses by increasing the width of the bend and continue<br />
decreasing the radius. This process repeats itself until the desired radius is<br />
reached or no further improvement is possible.<br />
4. If it is not possible the reach the desired radius then the process has to restart<br />
at #1 with a new monomodal port waveguide that has a higher confinement if<br />
this is allowed by the chosen technology.<br />
60
61<br />
Design<br />
5. When the desired radius is finally reached the overlap losses have to be<br />
checked. If the overlap losses between the original port waveguide geometry<br />
and the new resonator geometry are acceptable the design is finished.<br />
3.6.2 Overlap loss reduction<br />
The overlap losses in a racetrack resonator are caused by a misalignment between the<br />
mode of the bend and the straight sections. As shown in Figure 3.22a the maximum of<br />
the modal field in a straight waveguide is located in the center. However, in a bend<br />
waveguide the maximum of the modal field is shifted away from the center as shown<br />
in Figure 3.22b. Therefore, if these waveguides are placed center to center the overlap<br />
is often not ideal and can result in significant losses.<br />
Figure 3.22a. Modal field in a straight<br />
waveguide.<br />
Figure 3.22b. Modal field in a bend<br />
waveguide (bend curves to the left).<br />
If the overlap losses are too high then there are three possible options to reduce these<br />
losses:<br />
1. Try to change the aspect ratio of the waveguides, and redesign the bend and port<br />
waveguides to see if there is an improvement in the overlap losses.<br />
2. Insert a bend with a slowly decreasing radius to taper between the straight and<br />
bend sections of the racetrack or replace the bend section altogether. The latter<br />
will make the racetrack into a true oval shaped resonator. Because the radius of<br />
the bend is slowly decreased the overlap losses can be greatly reduced. The<br />
downside of this method is that it requires a substantial length over which the<br />
bend radius is reduced. It will therefore increase the overall roundtrip length<br />
which will require another resonator design cycle to reduce the resonator<br />
roundtrip length back to its original value.<br />
3. Improve the overlap between the bend and the straights in the racetrack by<br />
shifting the bend laterally with respect to the straight. [112].<br />
The last method is by far the easiest since it only requires a minor shift of the<br />
waveguides. Figure 3.23a shows how this shift is applied to the design of the<br />
resonator and Figure 3.23b shows it implemented in a fabricated device. While the<br />
offset of the bend cannot remove the overlap losses entirely it can work quite well,<br />
especially for waveguides with a high index (e.g. n>1.7). Figures 3.24a and 3.24b<br />
[113] for instance show the optimum offsets and associated losses for a racetrack<br />
resonators built in Si3N4 as a function of the bend radius. At a radius of 110 µm the
Chapter 3<br />
overlap losses are only 0.06 dB at an offset of 175 nm. This is an improvement of ≈<br />
0.2 dB over the same configuration without the bend offset. Considering that the<br />
losses of racetrack with a bend radius of R=110 µm and realistic bend losses of 2<br />
dB/cm is only 0.14 dB this is quite substantial.<br />
Figure 3.23a. Shifting the bend to reduce<br />
the overlap losses (shifted on the right).<br />
62<br />
Figure 3.23b. Offset in a fabricated<br />
racetrack with some smoothing occurring at<br />
the interface between the straight and bend.<br />
In fabricated devices the overlap losses may actually be a bit lower than the<br />
calculations predict. This is due to some smoothing of the interface between the bend<br />
and the straight that functions as a (very short) taper. The smoothing, which is also<br />
visible in Figure 3.23b, is due to the lithography that cannot image the small features<br />
at this interface.<br />
Bend lateral offset (nm)<br />
450<br />
400<br />
350<br />
300<br />
250<br />
200<br />
150<br />
100<br />
175 nm<br />
Bend width = 2.0 µm<br />
Bend width = 2.3 µm<br />
50<br />
40 60 80 100 120 140 160 180 200 220<br />
Radius (µm)<br />
Figure 3.24a. Optimum lateral offset vs.<br />
bend radius.<br />
Overlap loss (dB)<br />
1.0<br />
0.8<br />
0.6<br />
0.4<br />
0.2<br />
0.12 dB<br />
0.0<br />
40 60 80 100 120 140 160 180 200 220<br />
Radius (µm)<br />
Bend width = 2.0 µm<br />
Bend width = 2.3 µm<br />
Figure 3.24b. Overlap losses, obtained at<br />
the optimum lateral offset, vs. the bend<br />
radius.
3.6.3 Setting the lateral field coupling coefficient<br />
63<br />
Design<br />
When the basic geometries of the port and resonator waveguides are known and the<br />
overlap losses have been minimized the resonator design can be finalized by setting<br />
the coupling coefficients. For a coupling region geometry as shown in Figure 3.25 the<br />
field coupling coefficients can be calculated using<br />
where<br />
L<br />
C<br />
⎛ L + L<br />
= sin<br />
⎜<br />
⎝ 2 LC<br />
π<br />
κ<br />
2π<br />
= =<br />
κ<br />
c<br />
2.<br />
1<br />
end<br />
⎞<br />
⎟<br />
⎠<br />
λ0<br />
Neff − Neff<br />
2<br />
(3.10)<br />
(3.11)<br />
is the coupling length required for completely coupling light of wavelength λ0 from<br />
one waveguide to another. The effective refractive index of the coupled modes Neffi<br />
can be readily found using a mode solver. The end length Lend is the contribution in<br />
the total coupling length of the bend sections and is given by Madsen [52] as<br />
L end<br />
= 2π . R.<br />
d<br />
(3.12)<br />
where R is the bend radius and d0 the gap width between the port waveguides and the<br />
straight sections of the racetrack.<br />
Figure 3.25. Racetrack coupling region geometry.<br />
0
Chapter 3<br />
3.7 Component design considerations<br />
In both the NAIS and Broadband Photonics projects there has been a continuous drive<br />
towards more complex and more densely integrated devices.<br />
One reason for the dense integration lies in the reduction of the cost of these devices.<br />
The router that will be discussed in a later chapter for instance has a footprint smaller<br />
than 10 mm 2 including I/O and electrodes. A four inch wafer can therefore contain<br />
approximately 750 devices while a twelve inch wafer can hold more than 7000. Even<br />
if one such wafer would cost € 100.000 to fabricate the individual router chips will<br />
only be around €15, although this calculation conveniently ignores the often<br />
considerable cost of packaging.<br />
Another far more practical reason, at least within these projects, was that the dense<br />
integration offered more variations of devices to compensate for alignment errors<br />
between the resonators to the port waveguides. As will be explained in Chapter 5<br />
these could be partially reduced by creating devices with a range of built in alignment<br />
errors. Although the alignment errors are essentially removed by the change from<br />
contact to stepper lithography the latter still requires dense integration due to the<br />
comparatively small exposure area of the stepper reticle. This area measures roughly<br />
2 by 2 cm and is copied many times across the wafer. All variations of a certain<br />
device therefore have to be built within this area.<br />
In addition to designing devices such as the OADM and the router for dense<br />
integration these have also, without exception, been designed for fiber pigtailing.<br />
Apart from the fact that pigtailed devices are more robust and easier to demonstrate it<br />
was, in the case of these devices, also a necessary requirement for full<br />
characterization.<br />
Simple devices, such as the cascaded resonator filter comprised of two resonators and<br />
the single resonator shown in Figures 3.26a and 3.13b only feature one input and one<br />
or two outputs. These devices are therefore easy to characterize using fibers or lenses.<br />
Also, if these devices require thermal tuning at most three electrode pads need to be<br />
connected which can easily be done using probe pins.<br />
Figure 3.26a. Cascaded MR filter comprised<br />
of two resonator<br />
64<br />
Figure 3.26b. Single MR filter.<br />
A more complex device such as for instance the OADM, however, has five in- and<br />
outputs. Several of these may need to be connected simultaneously for full<br />
characterization. This is difficult to do with normal fibers or lenses but a fiber array,<br />
in which several fibers are spaced at 250 µm intervals, is ideal for this task.
65<br />
Design<br />
In addition this device has five electrodes that need contacting. It is, however, very<br />
difficult to use probe pins for this due to the small size of the device. Although it is<br />
possible to create custom probe pins to solve this problem it would require a new set<br />
of these for every device type. The alternative is then to bond the electrodes to a<br />
standard carrier chip and glue the fiber array(s) to the device, thus creating a stable<br />
setup for measuring.<br />
3.7.1 Creating a design layout for pigtailing purposes<br />
Perhaps the most trivial implication of making a micro-resonator based device that<br />
can be attached to a fiber array is that a large part of the layout and size of these<br />
devices is dominated by the fiber array. This is because devices have to be at least as<br />
wide as the distance between the first and the last fiber in the array and therefore<br />
always a multiple of 250 µm. Since most of the micro-resonators discussed in this<br />
thesis have a diameter of 100 µm they can always be placed within this spacing and<br />
are therefore of lesser importance in the layout of the device.<br />
Alignment<br />
waveguides<br />
MR’s<br />
Rail alignment<br />
line<br />
Taper dice line<br />
5 mm<br />
1.5 mm<br />
Figure 3.27. Important design features required for fiber array to chip coupling.<br />
In Figure 3.27 a small section of a stepper reticle is shown. In this section two<br />
OADMs can be seen side by side, each measuring 5 by 1.5 mm (width x height). The<br />
fiber array spacing is clearly the dominant factor in this example. The layout is largely<br />
determined by the four add-drop ports that, at a spacing of 250 µm, run across the full<br />
width of the device whereas the space taken up by the resonators is negligible in<br />
comparison.<br />
The two other important features related to a design that uses fiber arrays can also be<br />
seen in this figure. These are the alignment waveguides and the glass rail alignment<br />
line. The alignment waveguides form a direct connection between the outer most<br />
fibers in the fiber array that can be used to properly align the fiber array to the chip.
Chapter 3<br />
By maximizing the power through these outermost connections the best alignment for<br />
the connections between them is also automatically found. The alignment waveguide<br />
and the right side of the OADMs shown in the example performs a dual function<br />
because it is also the input and express output of the device. In many cases, however,<br />
such a dual function is not possible so that the alignment waveguide needs to be<br />
wrapped around the device to cause the least possible interference with the operation<br />
of the device.<br />
The rail alignment line is not part of the actual device but is drawn in one of the<br />
metallization layers on top of the device. This line is therefore visible by the naked<br />
eye and can be used to accurately glue a glass rail on top of the device. This glass rail<br />
is required to increase the cross-sectional area to which the fiber array can be glued.<br />
Because the glass rail covers the device up to the rail alignment line it is important<br />
that no structures that need to be accessible are placed beyond this line.<br />
3.7.2 Tapers<br />
When standard (e.g. SMF-28) or even high numerical aperture (HNA) fibers or fiber<br />
arrays are used to couple light into high contrast waveguides significant losses can<br />
occur at the facets. However, these losses can be reduced through the use of a suitable<br />
spot-size converter. This converter can be implemented in a number of different ways,<br />
using for instance non-periodic waveguide segments [114, 115] or a y-branch [116].<br />
One of the least complicated methods, however, is to use a tapering of the port<br />
waveguides to match the spot sizes [117].<br />
Figure 3.28a. Top and side-view of a<br />
horizontal taper.<br />
Figure 3.28b. Top and side-view of a tapering<br />
in both the horizontal as well as the vertical<br />
direction.<br />
The most commonly used taper is the horizontal (lateral) taper, for instance used in<br />
the switch and early OADM designs. Since in this taper, as shown in Figure 3.28a,<br />
only the width of the waveguide is varied it can be implemented using the same mask<br />
that defines the port waveguides. In later OADM designs this taper was combined<br />
with a vertical taper section as shown in Figure 3.28b. This can improve the fiber chip<br />
coupling losses quite significantly because it allows for a mode expansion in both the<br />
lateral as well as the vertical direction. It does, however, require an additional mask<br />
66
67<br />
Design<br />
step to define the vertical slope of the waveguide as will be explained in more detail<br />
in Chapter 5.<br />
For both taper types it is important that the taper itself does not add to the coupling<br />
losses. The tapers therefore have to be designed to be adiabatic. The taper angle θt for<br />
which this can be achieved [112] is given by<br />
ρ(<br />
s).(<br />
N eff − n<br />
θ t ( s)<br />
≤<br />
λ<br />
c<br />
clad<br />
)<br />
(3.13)<br />
where nclad is the index of the cladding layer, Neff the effective index of the<br />
waveguide at position s, and ρ the half width of the waveguide at that position. The<br />
definition of these parameters is also given in Figure 3.29.<br />
Figure 3.29. Definition of taper parameters.<br />
3.7.3 Optimal port waveguide bend radius<br />
The minimum size of some devices, like the OADM, is largely dictated by the fiber<br />
array. In other devices, however, especially those made in low-contrast materials, the<br />
minimum size is directly related to the minimum achievable bend radius of the port<br />
waveguides. That this radius can affect the design size in quite a significant way is for<br />
instance shown in Figure 3.30a. In this layout of a single micro-resonator device<br />
nearly two thirds of the device is taken up by the return bend in the drop port of the<br />
device. While this particular layout can be improved by inserting an S-bend as shown<br />
in Figure 3.30b this might not be possible in many other cases.<br />
Figure 3.30a. Standard single resonator<br />
layout.<br />
s<br />
ρ(s)<br />
θt(s)<br />
Figure 3.30b. Improved layout with reduced<br />
height.<br />
From a design perspective it is therefore critical to know what the minimum bend<br />
radius of a port waveguide is to achieve the best possible layout. Not only the<br />
minimum radius is of importance, however, but also the maximum radius should be<br />
determined. At small bend radii the waveguide losses in a, for instance, 180-degree<br />
bend are largely determined by the pure bend losses. For large radii, however, these<br />
losses are relatively insignificant while the scatter and material losses become more
Chapter 3<br />
important, due to the fact that the light needs to travel a longer distance to cover a<br />
180-degree bend.<br />
Loss = π R(<br />
α + α )<br />
(3.14)<br />
Bend _ total . R S , M<br />
The total losses (in dB) incurred by a 180-degree bend are given by (3.14) in which<br />
αR (dB/cm) is the pure bending loss found through simulations and αS,M are the<br />
scattering and material losses.<br />
As an example Figure 3.31a shows the pure bend losses of a Si3N4 waveguide,<br />
calculated using the commercially available Selene bend-modesolver [50], as a<br />
function of the bend radius. This waveguide, with a width of 2 µm and a height of<br />
0.14 µm is the basic port waveguide used in nearly all of the devices described in this<br />
thesis. When the pure bend losses are combined with the material and scatter losses<br />
the 180-degree bend losses shown in Figure 3.31b are obtained. In this figure it can be<br />
observed, for instance, that a bend with a radius of 100 µm is has the same 180 degree<br />
bend loss as a bend with a radius of 500 µm for αS,M=2 dB/cm, thereby showing that a<br />
large bend radius is not necessarily better than a small bend radius. Rather, the<br />
optimal radius of this waveguide is found between 150 µm and 250 µm. All devices<br />
that use this type of port waveguide have therefore been designed with reference to<br />
these values.<br />
Simulated bend loss (dB/cm)<br />
100<br />
80<br />
60<br />
40<br />
20<br />
0<br />
60 80 100 120 140 160<br />
Bend radius (µm)<br />
Figure 3.31a. Bend loss versus the bend<br />
radius.<br />
68<br />
180 degree bend loss (dB)<br />
2.0<br />
1.8<br />
1.6<br />
1.4<br />
1.2<br />
1.0<br />
0.8<br />
0.6<br />
0.4<br />
0.2<br />
0.0<br />
0 100 200 300 400 500 600<br />
Bend radius (µm)<br />
α S,M =1 dB/cm<br />
αS,M=2 dB/cm<br />
αS,M=5 dB/cm<br />
Figure 3.31b. Bend loss in a 180-degree<br />
bend versus the bend radius.
Chapter 4<br />
Simulation and analysis<br />
During the course of both the NAIS and broadband project<br />
many programs have been created to create a better insight into<br />
the operation of micro-resonators or to simply be able to create<br />
novel devices. These programs include tools for both<br />
simulations as well as data-analysis of which the relevant<br />
aspects will be discussed in this chapter.<br />
In addition the Aurora simulation tool is presented. This tool<br />
has been specifically designed to simulate highly complex<br />
optical devices consisting of many separate or even higher<br />
order coupled resonators. Contrary to common methods the<br />
calculations of this program use a comparatively simple and<br />
possibly novel scheme based in the time domain from which<br />
the frequency response can easily be derived.
Chapter 4<br />
4.1 Introduction<br />
As was shown in the previous chapter a large number of parameters has to be<br />
considered when designing a micro-resonator. For the calculation of these parameters<br />
several tools have been used:<br />
• The commercially available modesolver Selene [50], used to calculate the<br />
effective refractive indices and waveguide attenuations of straight waveguides<br />
and bends.<br />
• The AAMP CMT3D software [108-110] that was developed within the NAIS<br />
project to calculate the coupling coefficients of a micro-resonator.<br />
• The Micro-resonator Investigator (MRI) tool that visualizes most of the<br />
parameters discussed in the previous chapters and allows for real-time<br />
interaction with these parameters.<br />
The MRI tool was created as a visualization wrapper around most of the equations<br />
that describe the different aspects of the micro-resonator. Since these equations have<br />
already been discussed in depth in the previous chapters the focus of the discussion of<br />
this program in Paragraph 4.2 will be on the alterations that were made to Equations<br />
(2.17) and (2.25) to make them faster to compute. The algorithm used to obtain the<br />
transient resonances of the micro-resonator will also be addressed as this will help to<br />
explain the algorithms that will be discussed in Paragraph 4.5 for the high level<br />
Aurora simulation tool. In addition to the simulation tool MRI additional programs<br />
were written to analyze measurement results. These were:<br />
• The RFit tool, that uses a brute-fore method to fit measured micro-resonator<br />
responses.<br />
• DropZone, a tool that provides a fast analytical method for fitting the<br />
responses of resonators with symmetric coupling coefficients.<br />
The RFit tool builds upon the computational changes in MRI to speed up the bruteforce<br />
fitting of the micro-resonator responses and is briefly discussed in Paragraph<br />
4.3. If it is assumed that a resonator is symmetrically coupled to its port waveguides<br />
and has negligible coupler losses then it is possible to calculate coupling coefficients<br />
as well as the cavity losses directly from the depth of the through and drop responses.<br />
The equations used for this have been implemented in the DropZone program and will<br />
be given in Paragraph 4.4.<br />
At an early stage during the NAIS project it was realized that, in order to quickly<br />
evaluate new designs, a specialized program for high level design would be nearly<br />
indispensable because of increasing device complexity. While the numerous basic<br />
devices simulated in the MRI tool can still be easily described in equations such as<br />
(2.17) and (2.25) this would be impossible to do for something as complex as the<br />
router. However, at that time there were no programs were available that could<br />
adequately perform these simulations. The decision was therefore made to create an<br />
entirely new program that would be specifically designed to deal with devices<br />
consisting of many resonators. This program, called Aurora, will be discussed section<br />
4.5.<br />
70
4.2 Micro-Resonator Investigator<br />
71<br />
Simulation and analysis<br />
The MRI tool, of which a screenshot is shown in Figure 4.1, offers quick interactive<br />
control of microring-resonator parameters such as the radius, loss and coupling<br />
coefficients for a number of simple microring resonator configurations. The<br />
simulations that can be performed are:<br />
• Transient drop port response of a single resonator.<br />
• Wavelength response for the through- and drop ports of a single resonator.<br />
• Bimodal response of a single resonator. This was used to study the effects of<br />
additional modes in the resonator.<br />
• Comparison between a non-tuned and a tuned (by ∆Neff) resonator.<br />
• Cascaded dual resonator response. The two resonators in cascade form the<br />
basis of the micro-resonator based switch discussed in a following chapter.<br />
The radius of the additional resonator can be set individually to allow<br />
exploration of Vernier filters.<br />
• Cascaded triple resonator response. Used to examine the effects of an<br />
additional resonator to the switch or Vernier configuration.<br />
• Second order through and drop response. This configuration can be used for<br />
improved filter performance over a single MR but also allows improvements<br />
when used as a Vernier filter or switch.<br />
• Third order through and drop response.<br />
In addition to this the program allows for the visualization of the parameters discussed<br />
in Chapter 3 as a function of the field coupling coefficients and the waveguide<br />
attenuation in the micro-resonator.<br />
Figure 4.1. MRI Screenshot showing the simulation of a first order resonator.
Chapter 4<br />
4.2.1 Transient response<br />
Although the calculation of the transient step response of a micro-resonator is a rather<br />
trivial exercise, it represents one of the most basic implementations of the algorithms<br />
used in the Aurora tool. The pseudo code of the transient response calculation<br />
algorithm is therefore given in Listing 4.1 to explain the origin of the calculation<br />
methods used in Aurora.<br />
Listing 4.1. Pseudo code for calculating the transient drop response.<br />
//Note: All port values are assumed to be complex and therefore contain both the amplitude<br />
//and the phase<br />
Set all ports to 0;<br />
Set the “In” port to 1;<br />
Calculate the delay time Td of one half of the resonator;<br />
Set the current simulation time T to 0;<br />
Set the maximum simulation time TMax to a suitable value;<br />
Loop<br />
{<br />
Calculate the values at the “Through” and “O1” ports from the “In” and “I1” ports<br />
using the coupler propagation matrix (eq. 2.8); //Coupler calculation<br />
Multiply the value at the “O1” port with the waveguide attenuation and the phase<br />
delay (eq. 2.9) to obtain the value at “I2”; //Waveguide calculation<br />
T=T+Td; //Time propagation caused by the waveguide<br />
Calculate the values at the “Drop” and “O2” ports from the “Add” and “I2” ports using<br />
the coupler propagation matrix; //Coupler calculation<br />
Save the current value at the “Drop” port for the current time (T);<br />
Multiply the value at the “O2” port with the waveguide attenuation and the phase<br />
delay to obtain the value at “I1”; //Waveguide calculation<br />
T=T+Td; //Time propagation caused by the waveguide<br />
} while T
73<br />
Simulation and analysis<br />
fundamental assumptions used in the creation of the Aurora program as will be<br />
explained further in Paragraph 4.5.<br />
Figure 4.2. Resonator port definition.<br />
The values of the drop port that have been saved at time T for each iteration can be<br />
combined to form a transient drop response as shown in Figure 4.3.<br />
Drop port power (P Drop /P In )<br />
1.0<br />
0.9<br />
0.8<br />
0.7<br />
0.6<br />
0.5<br />
0.4<br />
0.3<br />
0.2<br />
0 10 20 30 40<br />
Time (ps)<br />
Figure 4.3. Transient drop response at full resonance.<br />
As can be seen in this figure it is important that the time TMax at which the iteration<br />
ends is chosen sufficiently high to allow the drop port signal to converge to its<br />
maximum value. Simulations in MRI have shown that a good value for TMax is given<br />
by TMax≈10.τd where τd is the cavity ring down-time given by [118, 119]:<br />
τ<br />
d<br />
=<br />
F g<br />
⋅ R ⋅ n<br />
c<br />
(4.1)<br />
This cavity ring down-time relates to the rate at which the power of the light within a<br />
cavity decreases when no further power is supplied to the resonator (i.e. the signal on<br />
the input port is changed from 1 to 0):<br />
−t<br />
/ τ d<br />
(4.2)<br />
P<br />
2Td<br />
Cav<br />
( t)<br />
= P<br />
Cav,<br />
t=<br />
0 ⋅<br />
e<br />
TMax
Chapter 4<br />
Under the condition that the power of the light in the drop port has reached its<br />
maximum at T=TMax the final value of the transient response calculated at a<br />
wavelength λi will be equal to the wavelength response calculated at that wavelength:<br />
P<br />
Drop<br />
( t = T<br />
P<br />
In<br />
Max<br />
)<br />
λ<br />
i<br />
H<br />
≈<br />
2<br />
1+<br />
F . sin ( ϕ / 2)<br />
C<br />
74<br />
r<br />
λ<br />
i<br />
(4.3)<br />
This makes it possible to combine a number of time domain responses, calculated for<br />
a range of wavelengths, into a single frequency domain response. This method is<br />
therefore used in the Aurora program.<br />
4.2.2 Increasing the computational efficiency<br />
The main goal of the MRI program was to allow a user to interact with the parameters<br />
that describe the micro-resonator in real-time. It was therefore important that, if<br />
possible, the equations should be optimized for performance to keep the time lag to a<br />
minimum. In this respect the equations that describe the through and drop response<br />
are especially important since these are not only used to display the responses in the<br />
MRI program but also in the brute force fitting methods employed by RFit.<br />
The through and drop equations in their original for are written as:<br />
P<br />
P<br />
P<br />
Drop<br />
In<br />
Through<br />
P<br />
In<br />
=<br />
2 2<br />
k1<br />
κ 2 χ r<br />
2 2 2<br />
+ µ µ χ − 2µ<br />
µ χ ⋅ cos( ϕ)<br />
1 1 2 r 1 2<br />
2 2 2<br />
µ 1 + µ 2 χ r − 2µ<br />
1µ<br />
2χ<br />
r ⋅cos(<br />
ϕ)<br />
= 2 2 2<br />
1+<br />
µ µ χ − 2µ<br />
µ χ ⋅cos(<br />
ϕ)<br />
1<br />
2<br />
r<br />
These equations are fairly computationally intensive due to the large number of<br />
multiplications involved. However, since cos(φ) is the only variable during a<br />
wavelength scan, it is also easy to express these equations as a combination of partial<br />
terms. These terms are:<br />
F<br />
r<br />
1<br />
2<br />
r<br />
r<br />
(4.4)<br />
(4.5)<br />
F = 2 µ χ<br />
(4.6)<br />
1<br />
2<br />
µ 1 2<br />
2<br />
1<br />
F = 1+ 0.<br />
25F<br />
(4.7)<br />
2 2 2<br />
F κ ( µ χ −1)<br />
(4.8)<br />
5<br />
3 = 1 2 r<br />
=<br />
F χ<br />
2 2<br />
4 κ1<br />
κ 2 r = (4.9)<br />
F<br />
2<br />
1<br />
− F . cos( ϕ)<br />
Using these terms the through and drop responses can now be written as:<br />
1<br />
(4.10)
P<br />
Through<br />
P<br />
In<br />
P<br />
Drop =<br />
P<br />
In<br />
= 1+ F5.<br />
F<br />
F5.F4<br />
75<br />
3<br />
Simulation and analysis<br />
(4.11)<br />
(4.12)<br />
The partial terms F1 to F4 can be pre-calculated since they are not dependent on φ.<br />
The calculation of the through and drop response therefore only requires the<br />
recalculation of (4.10-4.12) which, assuming that φ is known, now only requires 1<br />
cosine, 3 multiplications, 1 division, 1 subtraction and 1 addition.<br />
4.3 RFit<br />
The RFit tool, used for the parameter fitting of micro-resonator through and drop<br />
responses, was based on Equations (4.6-4.12). These allowed for a significant<br />
reduction (>10 times) of the fitting time compared Equations (4.4) and (4.5) because<br />
these equations are easily called several million times during the fitting process.<br />
The fitting process uses a simple two-step brute force method that first fits the free<br />
spectral range and then the curve itself. When started the program requires a few<br />
approximate values to be set for αdB, κ, ng and R. The first three of these are not<br />
critical and are easily estimated by the user while the more critical value of the radius<br />
is almost always known from the design.<br />
The free spectral range fit calculates the sum<br />
Σ<br />
λ<br />
m<br />
[ ] 2<br />
P n , ∆λ,<br />
λ ) − P ( λ )<br />
Sim<br />
( g m Meas m<br />
(4.13)<br />
for variations in the group index ng and the response shift ∆λ within a range that has<br />
been defined by the program user. The latter variable is only used as a helper variable<br />
to shift the simulated response with respect to the measured response so that they are<br />
aligned correctly (i.e. resonances at the same wavelengths). It is added to the phase<br />
calculation of the simulated response using:<br />
( 2.<br />
π )<br />
ϕ r = ⋅ R ⋅ n<br />
λ + ∆λ<br />
m<br />
2<br />
g<br />
(4.14)<br />
The sum is only calculated for the wavelengths λm for which measurement data is<br />
available. The best fit is found for those values of ng and ∆λ at which (4.15) is at its<br />
minimum.<br />
The next step in the fitting process is then to scan the variables κ1, κ2 and αdB across a<br />
user defined range and find the values for which the sum<br />
Σ<br />
m<br />
[ ] 2<br />
log( P ( κ , κ , α , λ )) −10<br />
log( P ( λ ))<br />
λ 10 Sim 1 2 dB m<br />
Meas m<br />
(4.15)<br />
is at its minimum. A possible outcome of such a fitting process is given in Figure 4.4.
Chapter 4<br />
Figure 4.4. Screenshot of RFit showing a fit to a through response.<br />
The upper graph in this screenshot of the RFit program shows a measured through<br />
response and the best fit that could be made to this response. The bottom graph gives<br />
the fit error (in dB):<br />
(4.16)<br />
[ ] 2<br />
log( P ( κ , κ , α , λ )) − 10 log( P ( ))<br />
ESS = 10 Sim<br />
dB m<br />
Meas λm<br />
1<br />
2<br />
made at each data point (wavelength λm) in the measurement data. It is important to<br />
note that the fit error is calculated using the logarithmic values of the simulated and<br />
measured responses. This ensures that a fit error in for instance the dip of a through<br />
response is given equal weight as an error elsewhere in the response and results in a<br />
better fit. In the given screenshot for instance, a Fabry-Perot like ripple, caused by<br />
reflections within the device, is seen in the measurement data. On a linear scale this<br />
ripple has a (normalized) amplitude of nearly 0.3 which is large in comparison with<br />
the amplitude of ≈0.95 of the actual through response. This makes a good fit difficult<br />
to achieve because the relatively large contribution of the ripple to the overall shape<br />
of the spectrum. On a logarithmic scale, however, the ripple of ≈1.5 dB is quite small<br />
when compared to the more than 15 dB dip of the through response which makes it<br />
possible, as the figure shows, to get a good fit.<br />
In a measured signal that is not normalized it is impossible to separate the<br />
contribution of the insertion (ILDrop) and waveguide losses in the overall shape of the<br />
response. However, for an accurate fit it is important to know the insertion losses,<br />
especially for resonators with high losses due to their inherently higher ILDrop. The<br />
solution is then to normalize both the measured as well as the fitted response in order<br />
to remove the dependence in ILDrop altogether. This option is therefore also provided<br />
by the RFit program and, as can be seen in the upper graph of Figure 4.4, was actually<br />
used in the given fit example.<br />
76
4.4 DropZone<br />
77<br />
Simulation and analysis<br />
The brute force fitting process used by the RFit program can have some problems<br />
with very noisy measurements. While it is possible to filter some of this noise out of<br />
the measurement, for instance using a Fast Fourier-Inverse Fast Fourier transform<br />
(FFT-IFFT) based low-pass filter, this might also remove some important information<br />
from the measurement. The program is therefore best used interactively by combining<br />
computerized fitting with user experience to find the best possible fit.<br />
For an experienced user, however, it is often relatively easy to estimate the depth of<br />
both the trough and drop responses, even if these signals are subject to a lot of noise.<br />
This is of importance since, for symmetric devices, the field coupling coefficients and<br />
resonator losses can be found analytically using only these depths as the input,<br />
thereby providing a very fast alternative fitting method. It is this method that was<br />
implemented in the DropZone tool. The user interface of this tool, shown in Figure<br />
4.4 allows a user to determine the field coupling coefficients and waveguide losses<br />
from the through and drop responses or, if the drop response is not available, to at<br />
least estimate the waveguide losses.<br />
Figure 4.5. Dropzone user interface.
Chapter 4<br />
The equations required to find the values of αdB and κ can be found by using the<br />
expressions that give the depth of the through and drop responses as a starting point.<br />
The depth of the drop response ∆OnOffDrop (in dB) is equal to the resonator rejection<br />
ratio and was earlier defined in Chapter 3.2.2 as:<br />
S<br />
RR<br />
This can be rewritten into:<br />
2<br />
⎛ ( 1+<br />
µ ⎞<br />
1µ<br />
2χ<br />
r )<br />
= ∆OnOff<br />
= ⋅<br />
⎜<br />
⎟<br />
Drop 10 log<br />
2<br />
⎝ ( 1−<br />
µ 1µ<br />
2χ<br />
r ) ⎠<br />
M Drop −1<br />
µ 1µ<br />
2χ<br />
r =<br />
M Drop + 1<br />
where the drop response depth ratio MDrop is given as:<br />
M Drop<br />
= 10<br />
∆OnOffDrop<br />
10<br />
The depth of the through response ∆OnOffThrough (in dB) can be found by combining<br />
Equations (3.6) and (3.7) into Equation 4.20:<br />
∆OnOff<br />
Through<br />
OnOff<br />
⎛ P<br />
= 10 ⋅ log<br />
⎜<br />
⎝ P<br />
Off Re s<br />
On Re s<br />
⎛ ( µ<br />
⎜ 1 + µ 2χ<br />
r )<br />
= 10 ⋅ log<br />
⎜<br />
⎝ ( 1+<br />
µ 1µ<br />
2χ<br />
r )<br />
2<br />
⎛ ( µ ⎞<br />
1 + µ 2χ<br />
r )<br />
⎜<br />
⎟<br />
2<br />
⎞ ⎜ ( 1+<br />
µ 1µ<br />
2χ<br />
r ) ⎟<br />
⎟ = 10 ⋅ log⎜<br />
⎟ ⇔ 2<br />
⎠ ( µ 1 − µ 2χ<br />
r )<br />
⎜<br />
⎟<br />
⎜<br />
2 ⎟<br />
⎝ ( 1−<br />
µ 1µ<br />
2χ<br />
r ) ⎠<br />
78<br />
( 1−<br />
µ 1µ<br />
2χ<br />
r )<br />
⋅<br />
( µ − µ χ<br />
∆ Through<br />
2<br />
2<br />
1 2 r<br />
Taking the square root of (4.20) and substitution with (4.18) then leads to:<br />
M<br />
Through Drop M ⋅<br />
( µ 1 + µ 2χ<br />
r )<br />
=<br />
( µ − µ χ )<br />
where the through response depth ratio MThrough is given as:<br />
M Through<br />
= 10<br />
1<br />
2<br />
∆OnOffThrough<br />
10<br />
2<br />
r<br />
2<br />
⎞<br />
⎟<br />
⎠<br />
(4.17)<br />
(4.18)<br />
(4.19)<br />
(4.20)<br />
(4.21)<br />
(4.22)<br />
By rearranging (4.21) the coupling coefficients and resonator roundtrip losses can be<br />
written as a function of the through and drop response resonance ratios:<br />
µ 2 χ r =<br />
µ<br />
1<br />
M<br />
M<br />
Through<br />
Through<br />
⋅ M<br />
⋅ M<br />
Drop<br />
Drop<br />
−1<br />
+ 1<br />
(4.23)
For symmetrically coupled (κ1= κ2) resonators this reduces to:<br />
χ =<br />
r<br />
M<br />
M<br />
Through<br />
Through<br />
⋅ M<br />
⋅ M<br />
79<br />
Drop<br />
Drop<br />
−1<br />
+ 1<br />
Simulation and analysis<br />
(4.24)<br />
which can be combined with Equation (4.18) to find the desired parameters.<br />
For an asymmetrically coupled resonator, however, only κ1 can be found directly and<br />
is given by:<br />
(<br />
κ 1 = 1−<br />
(<br />
M<br />
M<br />
Drop<br />
Drop<br />
−1)<br />
(<br />
+ 1)<br />
(<br />
M<br />
M<br />
Through<br />
Through<br />
⋅ M<br />
⋅ M<br />
Drop<br />
Drop<br />
+ 1)<br />
−1)<br />
(4.25)<br />
The other coupling coefficient, κ2, can only be found if the losses are already known.<br />
This coupling coefficient can then be determined using:<br />
(<br />
κ 2 = 1−<br />
χ r<br />
(<br />
M<br />
M<br />
Drop<br />
Drop<br />
−1)<br />
(<br />
+ 1)<br />
(<br />
M<br />
M<br />
Through<br />
Through<br />
⋅ M<br />
⋅ M<br />
Drop<br />
Drop<br />
−1)<br />
+ 1)<br />
(4.26)<br />
In some devices accurate determination of the depth of the drop response might not be<br />
possible. Part of the measured drop response can for instance be below the detection<br />
limit of the measurement equipment or be overshadowed by stray light within the<br />
device. A measured response similar to the simulated drop response 4.6 may then for<br />
instance be found.<br />
P Drop /P In (dB)<br />
-5<br />
-10<br />
-15<br />
-20<br />
-25<br />
1545 1546 1547 1548 1549 1550 1551 1552 1553 1554 1555<br />
Wavelength (nm)<br />
Figure 4.6. A simulated drop response to which random noise has been added, making it<br />
impossible to determine the depth of the drop response.<br />
This is especially true if the devices incorporate micro-resonators that have high<br />
losses and relatively low coupling coefficients as this results in a large drop port<br />
insertion loss (ILDrop) combined with a large filter rejection ratio (SRR). In such cases,<br />
however, it is often still possible to determine the losses and coupling coefficients
Chapter 4<br />
using an approach based on the values of the FSR and the ∆λFWHM, which is only<br />
slightly more difficult than the one used above. This is done by rewriting (2.31) into:<br />
S<br />
RR<br />
⎛ 2.<br />
FSR<br />
= 10.<br />
log<br />
⎜<br />
⎝ π∆λ<br />
FWHM<br />
Substituting this Equation into (2.29) then gives:<br />
µ µ . χ =<br />
1<br />
2<br />
r<br />
⎛ 2.<br />
FSR<br />
⎜<br />
⎝ π∆λ<br />
FWHM<br />
⎛ 2.<br />
FSR<br />
⎜<br />
⎝ π∆λ<br />
FWHM<br />
80<br />
⎞<br />
⎟<br />
⎠<br />
⎞<br />
⎟<br />
⎠<br />
⎞<br />
⎟<br />
⎠<br />
2<br />
2<br />
2<br />
+ 1<br />
+ 1 −1<br />
+ 1 + 1<br />
(4.27)<br />
(4.28)<br />
which is a drop in replacement for Equation (4.18). Combining this expression with<br />
(4.19) and (4.23) then leads to the desired values of the losses and the coupling<br />
coefficients.
4.5 Aurora<br />
81<br />
Simulation and analysis<br />
The Aurora program was developed over the course of several years. Initially it was<br />
created as a proof of principle of the underlying numerical simulation method. It soon<br />
became clear, however, that the method could also be used to quickly create and<br />
simulate complex optical circuits. It therefore proved a solution for problems related<br />
to the increasing complexity of new devices as these could no longer be implemented<br />
in the MRI tool.<br />
While the equations that describe simple optical components such as the switch which<br />
is discussed in Chapter 6 could easily be formulated (see Chapter 2.6 for instance) and<br />
programmed into the MRI program the time required to do the same for more<br />
complex devices became a real problem. In a simple router as shown in Figure 4.7<br />
and further described in Chapter 7, for instance up to eleven resonators may influence<br />
the signals passing through an individual resonator. If all signals are assumed to travel<br />
in only one direction it is still possible to find a practical analytical description of this<br />
device. However, if bi-directional propagation through the waveguides is required, for<br />
instance to include back reflected light, the interactions between the resonators also<br />
need to be considered. The very high order filter interactions that result from this then<br />
make it impossible to find a practical analytical solution.<br />
Figure 4.7. Resonator interaction in a 1x3x3 optical router. The numbers show the number of<br />
other MRs that affect the signals entering a certain MR.<br />
The numerical method by the Aurora program, however, is relatively unaffected by<br />
such interactions as it can calculate each optical component individually based on<br />
well defined optical input signals. The “glue” between the components that takes the<br />
place of the higher order filter equations that would otherwise be required is instead<br />
provided by a time based scheduler that forwards optical signals in a parallel fashion<br />
between the components.
Chapter 4<br />
4.5.1 Architecture<br />
The Aurora program, like the programs discussed in the previous paragraphs, was<br />
created using Microsoft Visual C++ [120]. The program was intentionally designed to<br />
be modular; relying heavily on object oriented programming to achieve this goal.<br />
This is also reflected in the simplified architecture of the program, shown in Figure<br />
4.8. All tasks of a certain nature, such as component management or simulation<br />
regulation have been assigned to a specific manager module. These modules interact<br />
with the program user and, based on user input, regulate the internal flow of data or<br />
invoke other modules to perform specific operations on this data.<br />
Load<br />
components<br />
Token<br />
Compiler<br />
Component<br />
Template<br />
Library<br />
Component<br />
Manager<br />
Design Core Analysis<br />
Primitive<br />
Library<br />
Component<br />
List<br />
Project<br />
Manager<br />
Load/Save<br />
project<br />
Saved<br />
Simulation<br />
Data<br />
Primitive<br />
List<br />
Execution<br />
Engine<br />
Time-list<br />
User Interaction/Visualization<br />
Figure 4.8. Aurora architecture.<br />
On a super-modular level the program has been divided into three distinct parts that<br />
can be identified as design, core and analysis. Between these parts the interaction was<br />
intentionally kept to a minimum. Although this also provides a clear benefit to<br />
program maintainability the main reason for doing so lies in the nature of scientific<br />
simulation software. Typically such software is based on a comparatively small but<br />
highly complex algorithm or set of equations. These calculation algorithms are<br />
82<br />
Data<br />
Miner<br />
Simulation<br />
Manager<br />
Graph<br />
Manager
83<br />
Simulation and analysis<br />
generally required to be as fast a possible and should therefore be devoid of anything<br />
not related to the calculations. This is especially true for the user interface that is often<br />
required to change data that can be understood by the user into data that is easy to<br />
process by the algorithms. While the user interface and the simulation algorithms are<br />
sometimes intentionally placed in separate programs it is common practice to<br />
integrate these together in a single program. In addition to this a data visualization<br />
backend is often included to provide a user easy access to the output data of the<br />
algorithms.<br />
The three parts of the Aurora program also reflect this strong separation of tasks:<br />
• The design section serves as the main user interface. It allows the user to<br />
create a complex optical circuit out of “components”. At the most basic level<br />
these components can represent single waveguides or couplers but higher level<br />
components, comprised of several other components are also possible.<br />
The components are essentially no more than localized user interfaces that are<br />
dynamically created from a template and added to an internal list when the<br />
user creates the component. They provide both the visualization of a<br />
component (e.g. show a circle for a resonator) as well as easy access, through<br />
the use of variables, to the actual mathematical representation of these<br />
components. This representation resides externally of these components in so<br />
called “primitives” that will be discussed in detail in Paragraph 4.5.2. In<br />
addition, a component takes care of the linkage between these primitives if the<br />
user connects one or more components. Although the primitives are created<br />
and maintained by the components they are separate entities that belong to and<br />
are part of the actual simulation algorithms.<br />
• The core section of Aurora, which currently makes up less than 1% of the<br />
overall code, contains all the algorithms and management routines required to<br />
perform a time domain simulation. The core was designed to operate as a<br />
separate entity that takes the primitives created by the user interface and, after<br />
simulating the optical circuit represented by these, saves all relevant data to<br />
disk.<br />
• The analysis section has a dual task. It serves both as a simulation manager,<br />
setting up the simulation core for a certain type of simulation, as well as a<br />
data-miner that extracts useful information from the output of a simulation and<br />
displays it to the user. Although it might seem cumbersome to put the<br />
simulation setup in the analysis section rather than combining it directly with<br />
the simulation core there is in fact a very good reason for doing so based on<br />
computational performance.<br />
The simulation algorithms that are used by the core are fundamentally timedomain<br />
based. It is therefore only possible to find the frequency response of an<br />
optical circuit by combining the results of several of these simulations.<br />
However, because the individual time-domain simulations have no<br />
interdependencies, it is possible to calculate all these simulations in parallel on<br />
different threads, processors or even computers which makes the calculation<br />
method used by Aurora extremely fast. In light of this distributed calculation it<br />
makes more sense to place the management of the simulation outside of the<br />
core. Based on the simulation settings by the user the simulation manager can<br />
then create a number of cores in different threads (on the same or other<br />
computers) that each simulate a small number of wavelengths and combine<br />
their outputs into a single result.
Chapter 4<br />
4.5.2 Simulation method<br />
As was already shown in Chapters 2.3 a complex optical device such a microresonator<br />
can be reduced into a combination of basic optical constructs such as<br />
waveguides and couplers that are calculated individually. As long as the results of the<br />
individual calculations are properly forwarded between the constructs their combined<br />
behavior will be identical to that of the original component as was shown in<br />
Paragraph 4.2.1.<br />
It is this observation that forms the fundamental principle behind the simulation<br />
method used by Aurora. Because many calculations are combined to simulate a<br />
component the simulation method is quite different from a simulation method in the<br />
traditional sense. Usually a simulation method refers to the type of algorithm that is<br />
used to perform the simulation (e.g. BPM, FDTD or Transfer Matrix). However, the<br />
simulation method of Aurora does not use any specific algorithm but leaves it up to<br />
the individual optical constructs to provide their own simulation algorithms. The<br />
simulation method can therefore be classified as a meta-algorithm that creates a<br />
framework in which many different simulation algorithms can be properly combined<br />
rather than providing a simulation algorithm itself. It is then these algorithms that<br />
together act as a single (but distributed) algorithm that can be used to simulate the<br />
component.<br />
4.5.2.1 Primitives<br />
In the simulation of the transient drop response all the basic optical constructs were<br />
still combined into a single algorithm for which the step time was fixed and precalculated.<br />
As mentioned in the above, however, Aurora treats these constructs as<br />
separate entities that forward the results of their internal calculations between one<br />
another.<br />
The entities that are used to represent the basic optical constructs, such as waveguides<br />
or couplers, within Aurora are the so-called “primitives”. These primitives have a dual<br />
function:<br />
1. The primitives are used to represent constructs, the links between them as well<br />
as their characteristics (coupling length, attenuation etc.). They are therefore<br />
comparable to data in that they completely describe a certain component.<br />
2. The primitives are used to encapsulate the calculations (equations) that<br />
describe the operation of the constructs that they represent. This makes that<br />
they are also an integral part of the simulation algorithm with which the<br />
component is simulated.<br />
Because the simulation method used by Aurora is based on the individual calculation<br />
of the optical constructs, and therefore of the primitives, there is a very large<br />
flexibility in the nature of these calculations. This gives it a large advantage over<br />
other simulation methods. A simulation method based on transfer matrices for<br />
instance would require that all individual constructs are defined using these matrices<br />
as they are all combined into a single large matrix that describes the entire optical<br />
component. The calculations encapsulated by the primitives, however, may contain<br />
any type of calculation (BPM, Transfer matrix etc.) as long as the in and output of<br />
these calculations consist of a complex number (representing the light that enters and<br />
exits the optical construct). It is therefore possible to optimize the individual<br />
84
85<br />
Simulation and analysis<br />
calculations in the best possible way instead of being forced to use a single (such as<br />
the mentioned transfer matrix method) approach that might be sub-optimal in some<br />
cases.<br />
Because the primitive has to be combined with many other primitives and operate as<br />
part of the simulation algorithm there are certain requirements placed on its<br />
implementation:<br />
• Each primitive has one or more nodes. These nodes maintain the connections<br />
between the primitives. The primitives are only aware of these connections,<br />
not of the type of the primitives they connect to. On the input side the nodes<br />
store the complex data (phase amplitude) forwarded from the primitives that<br />
these nodes are connected to. On the output side the nodes point out the nodes<br />
of the connected primitive where the results of the calculations are to be<br />
stored.<br />
• Each node is input sensitive. A calculation routine may (should) be attached to<br />
each input node. When data is placed on this node the correct calculation<br />
routine is called. This ensures bi-directional propagation of the signals in the<br />
system when implemented correctly.<br />
• There is a single calculation function that is called after a signal has been<br />
placed on a node. Any kind of implementation of the calculation function is<br />
allowed as long as there is a calculation method for all ports. As the input for<br />
the calculation the complex data present on all nodes may be used as well as<br />
the contents of several variables that have been set through the user interface<br />
provided by the components.<br />
• If other primitives are connected to the outputs of a primitive the results of the<br />
internal calculations have to be forwarded to these primitives.<br />
• Each primitive provides an initialization function that is called at the start of a<br />
simulation by the scheduler. While these functions can be used for the precalculation<br />
of internal variables they are mainly intended as a starting point for<br />
signals in a simulation as will be explained in the next paragraph.<br />
The method used to forward the calculation results between the primitives depends<br />
entirely on the type of construct that the primitive represents. As was already<br />
mentioned in Paragraph 4.2.1 optical constructs can be classified as being either<br />
instantaneous or time propagating. The results of instantaneous constructs can be<br />
forwarded immediately while the results of time propagating constructs can only be<br />
forwarded after a certain time delay.<br />
If the primitive represents an instantaneous optical construct as shown in Figure 4.9<br />
then a calculation is performed for each signal change on one of the inputs Ii. The<br />
results of this calculation are placed directly into the nodes of the connected<br />
primitives after which their calculation functions are executed.
Chapter 4<br />
Figure 4.9. A Primitive with instantaneous result forwarding.<br />
A pseudo code implementation of a coupler with a port configuration as shown in<br />
Figure 4.10 is given in Listing 4.2. The coupler is typically an instantaneous optical<br />
construct as was pointed out in Chapter 4.2.1. This is reflected by the code where,<br />
after the actual calculation, the calculation functions of the connected primitives are<br />
called directly. Although only one direction of the signal forwarding is shown in<br />
Figure 4.9 the data between the primitives is actually allowed to be forwarded in any<br />
direction as dictated by the implementation rules. In Listing 4.2 this bi-directionality<br />
is implemented using two separate calculations where one is called for data entering<br />
port 1 or 2 and the other for data entering port 3 or 4.<br />
Figure 4.10. A coupler primitive and its nodes.<br />
Listing 4.2. Pseudo code for the calculation function of coupler primitive.<br />
(instantaneous primitive)<br />
Calculate()<br />
{<br />
If a new value has been placed on ports 1 or 2<br />
{<br />
Calculate the values at ports 3 and 4 the using the coupler<br />
propagation matrix (eq. 2.8);<br />
}<br />
}<br />
Primitive<br />
n1<br />
n2<br />
I1<br />
Im<br />
Primitive<br />
F ( x .. xn<br />
, I1..<br />
I<br />
1 m<br />
Find the ports that are connected to ports 3 and 4 and place the values<br />
calculated for port 3 and 4 in these ports;<br />
Call the Calculation() function of the primitives that are the parent of these ports<br />
If a new value has been placed on ports 3 or 4<br />
{<br />
……………………<br />
}<br />
86<br />
)<br />
n3<br />
n4<br />
O1<br />
Primitive
87<br />
Simulation and analysis<br />
If the primitive represents a time propagating construct then a time delay has to be<br />
taken into account between the instant that a signal enters one of the inputs Ii and the<br />
moment when the results of the calculation can be forwarded to the next primitive.<br />
Instead of calling the calculation function of the next primitive directly this call is<br />
therefore redirected through a scheduler as shown in Figure 4.11. This scheduler will<br />
then ensure that at the correct time the result data belonging to output O1 is placed on<br />
the port connected to this output. After this the process is finalized by once again<br />
calling the calculation function of the parent of this port.<br />
Primitive<br />
I1<br />
Im<br />
O1, dT,<br />
Port#<br />
Primitive<br />
F ( x .. xn<br />
, I1..<br />
I<br />
1 m<br />
Figure 4.11. A Primitive with delayed (through the scheduler) result forwarding.<br />
The pseudo code implementation of a waveguide, being a typical example of a time<br />
propagating element, is given in Listing 4.3. The time propagating section of the<br />
calculation is code written out in bold and is largely dedicated to gathering all the data<br />
required to build a “call” for the scheduler. As was the case for the coupler the<br />
waveguide also uses a split calculation for each direction of the signal through the<br />
waveguide (entering n1 or n2).<br />
)<br />
Scheduler<br />
t<br />
t+ dT<br />
O1<br />
Primitive
Chapter 4<br />
Listing 4.3. Pseudo code for the calculation function of waveguide primitive. (time<br />
propagating primitive)<br />
Calculate()<br />
{<br />
If a new value has been placed on port 1<br />
{<br />
Multiply the value at port 1 with the waveguide attenuation and the phase delay<br />
(eq. 2.9) to obtain the value ‘V2’ at port 2;<br />
}<br />
}<br />
Calculate the time delay dT of the signal within the waveguide;<br />
Find the port ‘C2’ that is connected to port 2;<br />
Find the primitive ‘P2’ that is the parent of this port;<br />
Tell the scheduler to put the value V2 into port C2 after expiration time<br />
delay dT; //The scheduler will call Calculate() of primitive P2<br />
If a new value has been placed on port 2<br />
{<br />
……………………<br />
}<br />
4.5.2.2 The execution engine<br />
Although the primitives perform all the important calculations the scheduler is critical<br />
to the flow of these calculations. The scheduler performs only three simple but very<br />
important tasks:<br />
• The initialization of the dataflow.<br />
One of the main strengths of the simulation method used by Aurora is that it<br />
only reacts to changes within the optical system that is being simulated. Each<br />
primitive can only call (directly or through the scheduler) the calculation<br />
functions of the primitives that are connected to it. A change in a signal on one<br />
of the ports of a primitive (followed by calling the calculate() function of that<br />
primitive) will therefore only ever affect the signals going through all the<br />
primitives that are directly or indirectly connected to this primitive. This<br />
makes the method highly efficient at simulating large components or even<br />
large optical networks where there may be many subsections that are not<br />
connected in any way.<br />
Because the simulation is change driven this also implies that a simulation can<br />
only start after an initial signal change is made on one of the nodes in the<br />
optical system that is being simulated. At the start of a simulation the<br />
execution engine therefore gives an initial change to designated nodes to<br />
initialize the flow of data.<br />
• Callback storage and execution.<br />
When the simulation is running the execution engine accepts the calls of all<br />
timed primitives and stores these calls in order in a list as shown in Figure<br />
4.12. In this list all the calls are sorted by time. When the simulation time has<br />
progressed to a time that is equal to the call-time of these calls the engine<br />
88
89<br />
Simulation and analysis<br />
executes all the calls of equal time simultaneously and calls the calculation<br />
functions of the proper primitives.<br />
Primitive<br />
Callback<br />
request<br />
Calculate()<br />
Primitive<br />
Execution<br />
engine<br />
Call list<br />
t<br />
t+dT1<br />
t+dT2<br />
t+dTn<br />
tMax<br />
Figure 4.12. Diagram of the dataflow within the scheduler. A primitive asks the execution<br />
engine to place call in the call list. After a certain time has elapsed (equivalent to the<br />
propagation time of the light through the primitive) the execution engine places this call in the<br />
next primitive and calls its calculate() function.<br />
• Timekeeping.<br />
The primitives intentionally do not store the current time data but only notify<br />
the execution engine of the delay in the signal they cause. It is therefore up to<br />
the execution engine to calculate the actual execution time of the call from this<br />
delay. In addition to this task the current time is also continuously checked<br />
against a maximum execution time at which the simulation needs to end. For<br />
the same reason that the simulation requires an initial change to start the<br />
simulation process it is also, under certain circumstances, unable to stop by<br />
itself. Since each primitive calls (directly or indirectly) the calculation<br />
function of a primitive it is connected to, feedback loops can be created for<br />
certain components such as the micro-resonator in which initial signal changes<br />
can be forwarded infinitely. This is in a way an integral part of the simulation<br />
method as it allows the simulation of optical components that contain many<br />
feedback loops. As was mentioned in Chapter 4.2.1, however, the output<br />
values of a resonant system are usually stable after a certain time TMax. The<br />
execution engine therefore allows the simulation to end at that time (this has to<br />
be determined by the user).<br />
In Listing 4.4 a highly simplified version of the execution engine is given in pseudo<br />
code. The algorithms shown in this code consists of two functions. The first,<br />
AddCall() is used by the primitives to place a call into the call list. The second,<br />
Simulate() is the actual simulation algorithm.<br />
When a simulation is started all the primitives are first initialized. This initialization is<br />
important as the flow of signals within the simulation originates here through the use<br />
of source primitives. These primitives do not operate differently from the other<br />
primitives except that they already create a call (with time delay zero) in the call list<br />
when their initialization functions are executed. As can be seen in the core loop of the<br />
algorithm these first calls are crucial as the simulation would simply end without<br />
them.
Chapter 4<br />
Listing 4.4. Pseudo code implementation of the execution engine.<br />
AddCall(dT, V, C)<br />
{<br />
Create the call with value V and port target C to the call list at time TCurr+dT;<br />
}<br />
Simulate()<br />
{<br />
Set the current time TCurr to 0;<br />
Initialize all the primitives;<br />
Find the first call in the call list;<br />
TCurr is now equal to the time in this call;<br />
}<br />
loop //Simulation loop<br />
{<br />
Execute all the calls that have time TCurr by<br />
First placing the forwarded signal values V in these calls on their<br />
target nodes C;<br />
Then calling the Calculate() functions of the parent primitives of these nodes;<br />
Find the first call that has a time> TCurr in the call list;<br />
TCurr is now equal to the time in this call;<br />
} until TCurr>TMax or until there are no more calls;<br />
With these first calls, however, the core loop of the algorithm becomes self<br />
sustaining: If the algorithm executes the calculate functions of the primitives that<br />
these first calls refer to, these in turn will either generate one or more new calls<br />
themselves or, if they are instantaneous, call another primitives that do so. When the<br />
core loop has finished executing all the calls placed at TCurr=0 it can then simply<br />
continue with the newly created calls that are next on the time line. These calls in turn<br />
will then generate their own new calls and so forth and so on.<br />
Once the core loop has started itself there are only two ways in which the simulation<br />
can be ended. In optical circuits that have no feedback loops, like the fictitious circuit<br />
shown in Figure 4.13, the signals and calls will simply propagate from the point<br />
where the change in signal originated (the wave source) to where they can propagate<br />
no further (the right coupler in this example). After these last calls have been executed<br />
the call list will be empty and the core loop will terminate by itself.<br />
Figure 4.13. Self terminating optical circuit. (Image created from an Aurora screenshot). Unused<br />
ports in the simulation do not participate in the simulation.<br />
In circuits with feedback loops, however, like the one shown in Figure 4.14 new calls<br />
are continuously generated, allowing the inner loop to continue forever. In such cases<br />
90
91<br />
Simulation and analysis<br />
the simulation is therefore forced to end at a predefined maximum simulation time<br />
TMax as has already been explained in the preceding text.<br />
Figure 4.14. Self perpetuating optical circuit with many feedback loops.<br />
(the arrows show the internal propagation directions of the light)<br />
4.5.3 Validation of the simulation method<br />
In order to test the stability and correctness of the numerical solutions given by<br />
Aurora some optical devices for which the analytical solutions were available (in<br />
MRI) have been compared with their Aurora counterparts. These comparisons were so<br />
far only performed in the frequency domain as the time-domain visualization<br />
functions of Aurora were not yet fully stable (i.e. the program crashed) at the time of<br />
this writing. Also, whereas the frequency spectra could be compared with the<br />
analytically calculated responses of MRI, no such comparison could be made for the<br />
transient response.<br />
Four components, each allowing the testing of a different aspect of the simulation<br />
method, have been used to test the correctness of the method. These were:<br />
• A Mach-Zehnder Interferometer to test an optical circuit without a feedback<br />
loop.<br />
• A single micro-resonator to test a circuit with a single feedback loop.<br />
• A second order micro-resonator to test a circuit with multiple feedback loops.<br />
The simulation of a second order filter differs significantly from a first order<br />
filter in that it can generate a large number of calls that need to be executed<br />
simultaneously without creating errors.<br />
• A reflector based on a single micro-resonator to test the bi-directional<br />
propagation of signals.<br />
The MZI test.<br />
The MZI was created as shown in the Aurora screenshot in Figure 4.15 The upper<br />
waveguide branch has a length of 400 µm while the lower has a length of 100 µm.<br />
Both waveguides have an effective refractive index of 1.5. Figure 4.16 shows the
Chapter 4<br />
simulated output spectra calculated for the lower and upper branch of this device. This<br />
simulation, which calculated the response across 20 nm at 0.01 nm intervals, took<br />
only 0.093s (timed using the internal clock on an Athlon 64, 3000+ based system).<br />
92<br />
Output Power (dB)<br />
0<br />
-10<br />
-20<br />
-30<br />
-40<br />
-50<br />
-60<br />
1540 1545 1550 1555 1560<br />
Wavelength (nm)<br />
Figure 4.15. MZI circuit. Figure 4.16. MZI simulation results.<br />
Lower branch<br />
Upper branch<br />
Although these results have not been compared with an analytical solution the shape<br />
of the responses conforms to that of an MZI and its free spectral range of 5.33 nm is<br />
equal to that given by theory:<br />
2<br />
λ<br />
FSR =<br />
∆L<br />
⋅ Neff<br />
(4.29)<br />
The Single micro-resonator test.<br />
The correct simulation of a circuit with a single feedback loop was tested using the<br />
optical circuit shown in Figure 4.17. This circuit is equivalent to a resonator with a<br />
radius of 50 µm, κ1=κ2=0.55 and αdB=1 dB/cm. Figure 4.18 compares the drop<br />
response of this circuit, simulated across 2000 wavelength points in 0.12s, with the<br />
analytical response calculated using MRI. As can be seen the two responses are<br />
identical. A comparison of the raw simulation data showed a mean error ≈0.02 dB,<br />
with a standard deviation σ = 0.057, between the two simulations. This difference is<br />
partly due to the numerical method used by Aurora which can accumulate errors made<br />
in individual calculations. The major part of the difference is, however, due to the fact<br />
that the two simulation results are not perfectly wavelength-aligned. The analytical<br />
results are shifted by about -0.02 nm with respect to the Aurora results.<br />
Figure 4.17. Single micro-resonator<br />
circuit.<br />
P Drop /P In (dB)<br />
0<br />
-5<br />
-10<br />
-15<br />
Aurora<br />
MRI<br />
-20<br />
1540 1544 1548 1552 1556 1560<br />
Wavelength (nm)<br />
Figure 4.18. Comparison of the single MR drop<br />
responses produced by MRI (analytical) and Aurora.
93<br />
Simulation and analysis<br />
The Second order micro-resonator test.<br />
The MZI and single resonator simulations can be seen as validations of the equations<br />
used to calculate the individual optical constructs. However, the second order microresonator<br />
is also a test of the ability of the scheduler to correctly handle multiple<br />
signals that enter a single construct. In the second order resonator circuit shown in<br />
Figure 4.19 for instance two calls (signifying a change in the signal) may arrive at the<br />
middle coupler at the same time. The interaction between the light resonating in the<br />
upper ring with that which resonates in the lower ring is crucial to the operation of the<br />
filter as a whole. Therefore any error or incorrect handling of these two calls, that in<br />
effect link the signals (light) between the two resonators, will immediately have an<br />
effect in the simulated response.<br />
Figure 4.20 shows, however, that this situation is well handled. The response of the<br />
second order MR, with R1=R2=50 µm, κ1=κ3=0.5, κ2=0.143 and αdB=1 dB/cm<br />
simulated by Aurora is nearly identical to the response returned by the analytical<br />
simulation in MRI. The mean difference (error) between the two simulations was a<br />
mere 0.024 dB with a standard deviation σ = 0.044.<br />
call<br />
call<br />
Figure 4.19. The second order MR<br />
circuit.<br />
P Drop /P In (dB)<br />
0<br />
-10<br />
-20<br />
-30<br />
-40<br />
Aurora<br />
MRI<br />
1540 1544 1548 1552 1556 1560<br />
Wavelength (nm)<br />
Figure 4.20. Comparison of the 2 nd order MR drop<br />
responses produced by MRI (analytical) and<br />
Aurora.<br />
The Reflector test.<br />
The reflector is a single micro-resonator based device in which an input signal is<br />
divided by a y-splitter and coupled into the resonator in opposing directions as shown<br />
in Figure 4.21. If the bi-directional propagation is not handled correctly by the Aurora<br />
simulation then the reflected calls (optical signals) might not, or not at the same time,<br />
appear at the right side of the splitter. This would instantly show up in the response<br />
measured at the left side of the splitter by the probe.<br />
A proper frequency response of the light that is reflected by this device is identical to<br />
the drop response of a single MR. The correctness of the bi-directional simulation<br />
can therefore be assessed by comparing the response of the reflected light, as<br />
simulated by Aurora, with the analytical single MR drop response given by MRI. If,<br />
for instance, there is an error in the bi-directional propagation these responses would<br />
not be the same. The results of this comparison, for a resonator with a radius of 50<br />
µm, κ1=κ2=0.55 and αdB=1 dB/cm are, as can be expected, identical to those shown in<br />
Figure 4.18. With a mean difference of 0.051 dB and a standard deviation σ = 0.057<br />
found between these simulations it can be concluded the bi-directional propagation<br />
offered by the Aurora simulation method also works properly.
Chapter 4<br />
Figure 4.21. The reflector MR circuit.<br />
It would be wrong to state that, based on these four tests, the simulation method used<br />
by Aurora performs flawlessly. However, the tests do address all the critical aspects<br />
of the simulation method and the underlying engine and would have exposed many if<br />
not all problems. Because complex optical circuits composed of a huge number of<br />
optical constructs are not much different from simple circuits from the perspective of<br />
the engine (since all calculations are localized), the results of the simulations<br />
performed on such circuits can also be trusted to a high degree. Nonetheless, since it<br />
is impossible to test every possible optical circuit for correct behavior, the program<br />
user should always be careful when interpreting the results, as is the case for nearly all<br />
(scientific) simulation software.<br />
If incorrect behavior of simulations in Aurora does occur it is relatively easy to detect.<br />
Incorrect behavior can be categorized under two types: simulation core failure and<br />
incorrect simulation timing. A failure in the simulation core is exclusively the result<br />
of bad programming and should be detected while debugging the program. Incorrect<br />
simulation timing however is the result of bad simulation settings by the user.<br />
• A failure in the simulation core can be detected quite easily using the four tests<br />
given above. The nature of the simulation method makes that these tests are<br />
either a success or go horribly wrong as for instance shown in Figure 4.22.<br />
This figure should have shown the drop response of a new optical construct<br />
that was introduced into the program to simulate an analytical drop response.<br />
This construct was for instance used in the OADM simulation discussed in<br />
Chapter 4.5.4.1. Due to a few minor mistakes made while programming the<br />
construct, however, the response showed only “noise”.<br />
P Drop /P In (dB)<br />
0<br />
-5<br />
-10<br />
-15<br />
-20<br />
1546 1548 1550 1552 1554<br />
Wavelength (nm)<br />
Figure 4.22. The result of a failed simulation.<br />
94<br />
-3 dB<br />
-3 dB
Power (a.u.)<br />
1.0<br />
0.8<br />
0.6<br />
0.4<br />
0.2<br />
95<br />
Simulation and analysis<br />
• A flaw in the simulation timing is the direct result of a simulation that is not<br />
allowed to run long enough. It can affect the simulation results to varying<br />
degrees, ranging from quite subtle to severe. However, the timing problem can<br />
only occur in resonant devices. As pointed out in Chapter 4.2.1 a frequencydomain<br />
response, created by combining multiple time-domain responses<br />
simulated at different wavelengths, is only valid when the time-domain<br />
responses have converged to a stable value. Since the time-domain responses<br />
of resonant devices will only converge to a stable value after a certain<br />
simulation time has passed, erroneous results will therefore be returned if the<br />
simulation time is too short. If the time domain simulation of a resonator at<br />
maximum resonance (φr=m.2π), shown in Figure 4.23, ends prematurely at<br />
T=20 for instance then the maximum dropped power reported by the<br />
frequency response will be systematically too low. For wavelengths offresonance<br />
even stranger effects can be observed. Because the time-domain<br />
responses at these wavelengths might oscillate before they stabilize, as shown<br />
in Figure 4.24 the frequency response may show both higher as well as lower<br />
dropped power values depending on the end-time of the simulation. At time T<br />
= T1 for instance certain values will be too low whereas they might be too<br />
high at time T = T2.<br />
Incorrect<br />
final value<br />
0.0<br />
0 10 20 30 40 50 60<br />
Time<br />
Correct<br />
final value<br />
Figure 4.23. Time-domain drop response<br />
for a resonator at full resonance.<br />
P Drop /P In<br />
0.7<br />
0.6<br />
0.5<br />
0.4<br />
0.3<br />
0.2<br />
0.1<br />
T1<br />
T2<br />
0.0<br />
0 20 40 60 80<br />
Simulation time T<br />
Figure 4.24. Time domain drop responses at<br />
off-resonance wavelengths showing oscillatory<br />
behavior.<br />
These oscillations in the time-domain simulations are transferred to the<br />
frequency response as high frequency oscillations such as those shown in the<br />
MR drop response in Figure 4.25. As might be expected the magnitude of<br />
these oscillations is dependent on the maximum simulation time and becomes<br />
more severe for shorter simulations.<br />
Behavior of the frequency response such as that shown for the drop response<br />
in Figure 4.25 is typical to a micro-resonator. However, similar behavior will<br />
also occur in other resonant devices such as gratings. Timing errors are<br />
therefore easy to detect for a user with experience in the field of integrated<br />
optics, for instance by running two simulations with different the maximum<br />
simulation time. If a simulation timing issue is found a suitable increase of the<br />
maximum simulation time will then suffice to create correct simulation results.<br />
λ1<br />
λ2<br />
λ3<br />
λ4
Chapter 4<br />
P Drop /P In (dB)<br />
0<br />
-10<br />
-20<br />
-30<br />
-40<br />
1546 1548 1550 1552 1554<br />
Wavelength (nm)<br />
96<br />
0.2 ns<br />
0.1 ns<br />
0.05 ns<br />
0.02 ns<br />
Figure 4.25. Drop response as a function of the user defined maximum simulation time.<br />
4.5.4 Strengths and weaknesses of the simulation method<br />
Although the basic concept behind the simulation method is quite simple it is<br />
nonetheless very powerful and possesses several strengths due to the distributed<br />
calculation by the individual primitives. However, the fact that some of the signals<br />
that are forwarded between these primitives need to be inserted into a call-list as<br />
explained in Chapter 4.5.2.2 also acts as an Achilles heel, causing the simulation run<br />
very slow under certain circumstances.<br />
4.5.4.1 Simulation strengths<br />
The strengths of the simulation method are largely due to the fact that each optical<br />
system automatically creates its own simulation algorithm and the fact that this<br />
algorithm is time-domain based. This creates several advantages that might not be<br />
available to other simulation methods:<br />
Event driven calculation.<br />
Because the algorithms are event driven, only those optical constructs of the system<br />
that are active during the simulation will be involved in the calculations. In fact, the<br />
non-active parts are totally invisible. This is a clear advantage over a transfer matrix<br />
based simulation that needs to consider (and therefore calculate) all the constructs<br />
since it is difficult to predict in advance which constructs will or will not be active.<br />
The “removal” of certain parts of the optical system can lead to significant reductions<br />
in simulation time.
In<br />
Figure 4.26a. Router calculated from left to<br />
right.<br />
97<br />
Matrix<br />
connections<br />
Simulation and analysis<br />
Figure 4.26b. Router calculated from right to<br />
left.<br />
For instance, a simulation of the router configuration shown in Figure 4.26a will take<br />
≈20.3s to calculate 50 wavelength points if a signal enters the matrix from the left.<br />
However, if the probe used to record the signal on the express port and the wave<br />
source are swapped, as show in Figure 4.26b, the simulation will take only ≈0.1s to<br />
complete. This is because it is impossible for the signal to enter the lower four rows of<br />
the matrix from this direction. These are therefore automatically excluded from the<br />
simulation. The simulation in this case is in fact similar to that of a 4-resonator<br />
OADM as the removal of the matrix connections indicated in the figure does not alter<br />
the 0.1s simulation time.<br />
Freedom of construct calculation algorithms.<br />
Each optical construct defines its own calculation algorithms. Since the simulation<br />
method requires that only the in-and output values of these calculations are well<br />
defined, the actual calculations can be implemented using whatever algorithm<br />
performs the most optimal for a given situation. This offers great flexibility, allowing<br />
the use of for instance BPM in one construct and a transfer matrix in another. Some<br />
constructs may even be optimized for a specific task in order to decrease the<br />
calculation time of the simulation. That such a targeted optimization can reduce the<br />
simulation time quite considerably is for example shown by comparing two different<br />
OADMs built in Aurora.<br />
The Aurora screenshot in Figure 4.27a shows the optical circuit of a regular OADM.<br />
The individual resonators in this circuit are high level components that are internally<br />
comprised of several waveguides and couplers. A simulation using this layout would<br />
therefore be able to return both the time- as well as the frequency domain response as<br />
all the required timing is handled by the internal optical constructs. However, it is<br />
easily seen that if a correct time domain response is not required the individual microresonators<br />
might just as well be described by their analytical expressions (in this case<br />
where there is no higher order interaction between the resonators). This offers an<br />
alternative way of creating the OADM as shown in Figure 4.27b. The resonators used<br />
in this circuit do not contain the waveguides and couplers but instead implement<br />
Equations (2.13) and (2.23), that describe the resonator drop- and through responses,<br />
directly.<br />
In
Chapter 4<br />
Figure 4.27a. OADM with resonators that<br />
are internally comprised of couplers and<br />
waveguides.<br />
98<br />
Figure 4.27b. Optimized OADM with<br />
resonators that directly implement the<br />
analytical through and drop response<br />
equations.<br />
Figure 4.28a shows the simulated express through responses of both OADMs<br />
obtained for the configuration shown in Figure 4.28b. These two responses are<br />
virtually identical with a mean difference between the responses of only 0.013 dB.<br />
P Express /P In (dB)<br />
0<br />
-10<br />
-20<br />
-30<br />
-40<br />
-50<br />
Express through<br />
-60<br />
1540 1545 1550 1555 1560<br />
Wavelength (nm)<br />
OADM Analytical<br />
OADM Numeric<br />
Figure 4.28a. Comparison between the express through<br />
response of an OADM in which the resonators are comprised<br />
of couplers and of an optimized OADM that uses analytically<br />
solved resonator responses.<br />
Express through<br />
All resonators:<br />
ng=1.5<br />
κ1=κ2=0.5<br />
αdB= 1 dB/cm<br />
R=50 µm<br />
R=55 µm<br />
R=60 µm<br />
R=75 µm<br />
Figure 4.28b. OADM<br />
configuration used for the<br />
simulation in Figure 4.28a.<br />
Although the frequency responses of both OADMs are identical, as can be expected,<br />
the time required to calculate this configuration differs quite substantially. Table 4.1<br />
shows the calculation time required to calculate this and three other configurations.<br />
The beneficial effects of targeted optimization of a construct (in this case a microresonator)<br />
are clearly seen in this table. The OADM built with the optimized<br />
resonators (that internally use Eqs. (2.13) and (2.23) ) simulates each of the given
99<br />
Simulation and analysis<br />
configurations within 25 ms. The calculation time Treg of the non-optimized OADM,<br />
however, is highly dependent on the radius of the resonators causing it to calculate up<br />
to 270 times slower. This makes that, if a correct time domain responses are not<br />
required, the optimized OADM is the preferred choice.<br />
Table 4.1. OADM Calculation time comparison (calculation across 500 wavelengths, timed<br />
on an Athlon 64 3000+ system)<br />
R1 (µm) R2 (µm) R3 (µm) R4 (µm) TReg (s) TAna (s)<br />
50 50 50 50 0.067 0.025<br />
50 55 50 50 1.68 0.025<br />
50 55 60 50 3.45 0.025<br />
50 55 60 75 6.8 0.025<br />
Parallel execution.<br />
As was already stated in Chapter 4.5.1 the simulation method used by Aurora is<br />
intrinsically highly suitable for parallel computation when calculating the frequency<br />
response of an optical system. Because the method is based in the time-domain and<br />
creates its frequency-domain responses by combining multiple time-domain<br />
simulations at the very last stage of the simulation, the time-domain simulations are<br />
easily scaled to run on multiple processors. Apart from this shallow-level<br />
parallelization, deep-level optimization on the optical construct level is also possible<br />
due to individual calculation of these constructs. A construct may for instance<br />
represent a non-linear waveguide for which the calculation is offloaded to a separate<br />
micro-processor.<br />
4.5.4.2 Simulation weakness<br />
The simulation method used in Aurora is fundamentally dependent on the use of a call<br />
list in which calls, created by one primitive to forward a signal to another, are inserted<br />
in chronological order. The current algorithm used to insert a call is highly inefficient,<br />
however, as it simply traverses down the list until the right position for insertion is<br />
found. The time required to insert a new call therefore currently increases almost<br />
linearly ( T ( n)<br />
∈ O(<br />
n)<br />
) with the number of calls in the list. As the insertion procedure<br />
can be called many times (e.g. the OADM simulation in the previous paragraph<br />
required >51.000 calls) during a simulation, it is easily seen that the overall<br />
calculation time is greatly dependent on the number of calls in the list.<br />
That this dependency is currently a major weakness of the simulation method is<br />
clearly evidenced by the simulation calculation times given in Table 4.1. The table<br />
shows that the calculation time rises quite steeply with the number of resonators of<br />
unequal radius in the OADM. The reason for this is that an optical circuit with loops<br />
of differing optical path lengths will inevitably generate many more calls than an<br />
optical circuit in which the loops are of equal length. This can be explained by<br />
comparing two different second order MR filters: One in which the micro-resonators<br />
are of equal radius and one in which the radii are not equal.<br />
In Figure 4.29 a second order resonator filter is shown in which the upper and lower<br />
resonators are of equal radius. If a signal enters this resonator at the first coupler it
Chapter 4<br />
will propagate through the first half of the lower resonator and will reach the second<br />
coupler at time T=Td1 (with Td1 the time delay in one half of the resonator). From here<br />
the signal will now propagate into the lower as well as the upper resonator. After the<br />
signals have propagated a full roundtrip through the respective lower and upper<br />
resonators, however, each will return at the second coupler at exactly T=3Td1 due to<br />
the identical roundtrip time of the resonators. This means that at T=3Td1 two calls are<br />
present in the execution list. Each contains signal data that needs to be forwarded to<br />
the coupler and each requires that the coupler calculation procedure is executed<br />
afterwards.<br />
Figure 4.29. Call timing in a 2 nd order<br />
resonator with rings of equal radius.<br />
100<br />
Figure 4.30. Call timing in a 2 nd order<br />
resonator with rings that differ in radius.<br />
At this point the call combiner of the execution engine comes into play to handle<br />
these two calls efficiently. This is important because of the behavior of multi-port<br />
constructs such as the coupler. For a single execution of this constructs will always<br />
create two or more calls to other constructs it is connected to. A coupler will for<br />
instance create two new calls at its outputs for each call at its input as shown in Figure<br />
4.31a. Two calls that arrive simultaneously at different ports would therefore result in<br />
four new calls as shown in Figure 4.31b.<br />
However, this is very inefficient because the two new sets of calls will have a time<br />
difference of zero between them. Since a change that takes place in 0 seconds is<br />
undetectable (and makes no sense) in the simulation of the optical system it is better<br />
that a construct sends out only one call for a specific time.<br />
Even worse is the fact that this may also cause a massive increase in the number of<br />
calls. The resonator filter of Figure 2.29 would see a doubling of the calls after each<br />
roundtrip when the signals from the lower and upper resonator meet up in the second<br />
coupler.<br />
In order to avoid this undesirable behavior the execution engine therefore detects and<br />
combines all the calls that arrive at a construct at the same time into a single new call.<br />
This guarantees that the calculation procedure of the construct is executed only once<br />
so that no redundant calls are created. This combining of calls works very efficient if<br />
many calls arrive at a construct at the same time. The resonator filter of Figure 2.29 is<br />
an almost ideal example of this because the two calls generated by the second coupler
101<br />
Simulation and analysis<br />
can be combined again after every roundtrip. Due to this the total number of calls in<br />
the call list will never exceed four, making the simulation of this particular device<br />
very fast.<br />
Figure 4.31a. A single call made to a<br />
coupler will result in two new calls.<br />
Figure 4.31b. Two calls that arrive<br />
simultaneously at a coupler are combined so<br />
that still only two new calls are generated.<br />
If the radius of the resonators is not equal, however, far fewer calls can be combined.<br />
In Figure 4.30 for instance the signal returning from the upper resonator to coupler 2<br />
will have a delay of Td1+2.Td2 whereas the signal returning from the lower resonator<br />
will have a delay of 3.Td2. In this second order MR therefore only those calls can be<br />
combined where<br />
m . Td1<br />
= n.<br />
Td<br />
2 with m ∈ N,<br />
n ∈ N<br />
(4.30)<br />
Because fewer calls can be combined, more calls will be present in the call-list which<br />
results in longer list insertion times. The effect of this is clearly seen in Table 4.2 that<br />
shows the calculation time of this filter for variations in the radius of the top<br />
resonator. Only those radii of the top resonator for which Equation (4.30) is true for<br />
small values of m and n, such as for instance 25, 75 or 100 µm, calculate very fast<br />
whereas all other values show considerably longer calculation times.<br />
Table 4.2. 2 nd Order resonator calculation time for different radii of the upper<br />
resonator. The lower resonator is set at 50 µm (calculation across 500 wavelengths, timed on<br />
an Athlon 64 3000+ system)<br />
Upper resonator radius (µm) Simulation calculation time (s)<br />
25 0.05<br />
50 0.04<br />
51 0.57<br />
52 0.34<br />
53 0.59<br />
75 0.05<br />
100 0.04
Chapter 4<br />
As demonstrated by these two second order micro-resonator filter examples the<br />
current simulation method is very sensitive to optical circuits with loops of differing<br />
optical path lengths. This sensitivity is largely due to the currently used call-insertion<br />
algorithm of which the time required for insertion scales with the number of calls in<br />
the call-list as T ( n)<br />
∈ O(<br />
n)<br />
. However, the use of more efficient algorithms, such as<br />
the B-Tree [121], the Binary tree [122] or Skip lists [123] that scale according to<br />
T ( n)<br />
∈ O(log<br />
n)<br />
, can greatly reduce this sensitivity and easily improve the simulation<br />
time by an order of magnitude for complex optical circuits.<br />
4.5.5 Simulations on complex structures<br />
The strength of Aurora and other similar tools [124, 125] is that optical circuits can be<br />
evaluated with a minimum in effort and often in a fraction of the simulation time<br />
required by more rigorous methods. This also allows a user to quickly test a new idea<br />
and even stimulates “play-time”: just try random optical circuits and see if any<br />
interesting effects occur.<br />
4.5.5.1 The hyper-resonator<br />
One optical circuit that emerged form this “play” is the “Hyper-resonator” which<br />
features on the cover of this thesis and shown again here in Figure 4.32a. While this<br />
device may seem quite simple at first glance, closer inspection reveals a highly<br />
complex high-order filter device in which light propagates in two directions in all<br />
waveguide sections. The complex behavior for such a seemingly simple geometry<br />
made this device a prime candidate for simulation in Aurora as such devices might<br />
display interesting and perhaps useful filter properties.<br />
A simulation was therefore created as shown in Figure 4.32b. Although the ratio of<br />
the resonators radii in Figure 4.32a is by definition given by:<br />
3 + 2 3<br />
ROuter = RInner<br />
≈ 2.<br />
15RInner<br />
(4.31)<br />
3<br />
a ratio of 3 was chosen instead. This ratio is more realistic from the perspective of<br />
fabrication and removes any wide-range Vernier effects between the resonators that<br />
may obfuscate some of the more interesting effects in this device.<br />
In<br />
Reflected<br />
Figure 4.32a. “Hyper-resonator”<br />
layout.<br />
Figure 4.32b. Aurora simulation circuit to simulate the<br />
hyper-resonator. All lengths are in micrometers.<br />
102
103<br />
Simulation and analysis<br />
For the given waveguide lengths this translates to an inner ring radius of 47.7 µm and<br />
an outer ring radius of 143.2 µm. The coupling coefficients were all set at 0.707 and<br />
the waveguide losses at 1 dB/cm. Figure 4.33 gives the spectra resulting from the<br />
simulation of this device. The spectrum of the reflected light is particularly interesting<br />
as it shows that light is reflected across a wide band for certain wavelengths.<br />
Port power/P In (dB)<br />
0<br />
-10<br />
-20<br />
-30<br />
-40<br />
-50<br />
-60<br />
-70<br />
Reflected<br />
Transmitted<br />
1546 1548 1550 1552 1554<br />
Wavelength (nm)<br />
Figure 4.33. “Hyper-resonator” transmission and reflection.<br />
The wide band reflection was further investigated by varying the coupling coefficient<br />
of all couplers in the circuit apart from the coupler with the port waveguide, which<br />
was held at a coupling of 0.707. Figure 4.34 shows that the returned signal becomes<br />
more flat for lower coupling coefficients at the expense of bandwidth and filter<br />
rejection ratio.<br />
P Reflected /P In (dB)<br />
0<br />
-10<br />
-20<br />
-30<br />
-40<br />
-50<br />
-60<br />
Peak shift<br />
1546 1548 1550 1552 1554<br />
Wavelength (nm)<br />
κ=0.4<br />
κ=0.5<br />
κ=0.6<br />
κ=0.7<br />
Figure 4.34. “Hyper-resonator” reflection as a function of the internal resonator coupling<br />
coefficients.
Chapter 4<br />
What is more interesting about the spectra, however, is the behavior of the sideband<br />
peaks. As indicated in the figure these peaks shift as a function of the coupling<br />
strength. This shift of the peaks is somewhat similar to the peak tuning effect seen in a<br />
second- (and also higher) order filter. As was shown in Figure 2.15 two peaks appear<br />
when the resonator is over coupled. While these peaks also shift as a function of the<br />
coupling coefficient of the center coupler, the peak shift and the rejection ratios that<br />
can be achieved are not as high as shown in the circuit presented here.<br />
In Figure 4.35a a different simulation setup is given. Here the assumption was made<br />
that, at least to some degree, the internal resonators could be seen as three paired<br />
resonators. The internal coupling coefficients were therefore set equal to the critical<br />
coupling of a second order filter (κ=0.143). Figure 4.35b shows that the spectra are<br />
now quite different from those given in Figures 4.33 and 4.34. A wider reflection or<br />
“stop” band is now occurring. This may indicate that, given the proper settings of the<br />
couplers, this circuit can act as a wide-band reflector.<br />
Figure 4.35a. Aurora simulation circuit<br />
showing coupler settings.<br />
Port power/P In (dB)<br />
104<br />
0<br />
-10<br />
-20<br />
-30<br />
-40<br />
-50<br />
-60<br />
Reflected<br />
Transmitted<br />
1546 1548 1550<br />
Wavelength (nm)<br />
1552 1554<br />
Figure 4.35b. Aurora simulation results for<br />
the circuit on the left.<br />
The overall behavior of this device was quite unexpected and, due to its complexity,<br />
has so far not been investigated in more detail (although it certainly warrants further<br />
examination). The early simulation tests have already been presented here, however,<br />
in part because of the interesting properties of this device but also because it shows<br />
how a program like Aurora can quickly identify novel and interesting devices.<br />
4.5.5.2 Simulation of a waveguide grating<br />
Another complex device of interest is the waveguide grating shown in Figure 4.36.<br />
Figure 4.36. Schematic representation of a waveguide grating.
105<br />
Simulation and analysis<br />
The light propagation through this device can be simulated in 2D or 3D using a<br />
number of simulation methods, such as FDTD, Finite Element (FEM), Bi-directional<br />
Eigenmode Propagation (BEP) or Coupled Mode Theory (CMT) [126, 127]. These<br />
methods can provide an accurate simulation of the grating in the time- as well as the<br />
frequency domain but are also computationally intensive and therefore slow. If the<br />
grating consists of a shallow etched waveguide, however, the propagating modes are<br />
weakly confined. This allows the grating to be approximated by a 1D Bragg stack<br />
[113]. This approximation replaces the alternating sections in the waveguide grating<br />
with a film that has a refractive index n i<br />
~ and thickness di equivalent to the respective<br />
effective refractive index Ni and length Li of that section.<br />
The transmission, reflection and absorption of a 1D Bragg stack can be calculated<br />
using the transfer matrix method. To do this each film of the Bragg stack is first<br />
described by its characteristic matrix [128]:<br />
M<br />
i<br />
⎡ ⎛ 2π<br />
. n~<br />
i.<br />
d i ⎞<br />
⎢ cos⎜<br />
⎟<br />
= ⎢ ⎝ λ ⎠<br />
⎢ ⎛ 2π<br />
. n~<br />
i.<br />
d<br />
⎢<br />
− jN i sin⎜<br />
⎣ ⎝ λ<br />
i<br />
⎞<br />
⎟<br />
⎠<br />
j ⎛ 2π<br />
. n~<br />
i.<br />
d i ⎞⎤<br />
− sin⎜<br />
⎟<br />
N<br />
⎥<br />
i ⎝ λ ⎠⎥<br />
⎛ 2π<br />
. n~<br />
i.<br />
d i ⎞ ⎥<br />
cos⎜<br />
⎟<br />
⎝ λ ⎠<br />
⎥<br />
⎦<br />
(4.32)<br />
where n i<br />
~ is the complex refractive index n~ i = n − jk of the i-th layer. The matrix that<br />
describes the complete matrix is then found by multiplying the individual matrices:<br />
M<br />
tot<br />
= M<br />
1<br />
⋅ M<br />
2<br />
⋅⋅<br />
⋅<br />
M<br />
p<br />
=<br />
⎡m<br />
p<br />
11 12<br />
∏ M i = ⎢<br />
i=<br />
1 m21<br />
m22<br />
⎣<br />
m<br />
⎤<br />
⎥<br />
⎦<br />
(4.33)<br />
Using this matrix the transmitted (T), reflected (R) and absorbed (A) power in the<br />
Bragg stack are given by:<br />
( m<br />
R =<br />
( m<br />
T<br />
11<br />
11<br />
=<br />
( m<br />
11<br />
+ m<br />
+ m<br />
+ m<br />
12<br />
12<br />
12<br />
n ) n − ( m<br />
s<br />
s<br />
a<br />
a<br />
21<br />
n ) n + ( m<br />
s<br />
2n<br />
a<br />
a<br />
n ) n − ( m<br />
21<br />
21<br />
+ m<br />
+ m<br />
+ m<br />
22<br />
22<br />
22<br />
. n<br />
s<br />
. n<br />
. n<br />
s<br />
s<br />
)<br />
)<br />
)<br />
2<br />
2<br />
(4.34)<br />
(4.35)<br />
A = 1 − R − T<br />
(4.36)<br />
where na and ns are the refractive indices of the air and substrate respectively.<br />
With these equations the frequency response of a Bragg stack, and therefore of a<br />
shallow etched grating, can be calculated in a very fast and memory efficient manner.<br />
The downside of the approach, however, is that it cannot be used to examine the<br />
behavior of the grating in the time-domain.<br />
Alternatively, the grating can also be implemented using Aurora. Although the<br />
simulation of a grating in Aurora cannot calculate as fast as the given transfer matrix
Chapter 4<br />
method it does allow time domain simulations and will still outperform more rigorous<br />
simulation methods such as FDTD and BEP in calculation time.<br />
L1, N1<br />
Figure 4.37. The implementation of a single<br />
grating period in Aurora.<br />
106<br />
Figure 4.38. Definition of reflected and<br />
transmitted fields at an interface.<br />
A single grating period of a grating can be implemented in Aurora as shown in Figure<br />
4.37. Here the tooth and the groove section of the grating period are replaced by two<br />
waveguides of similar length and effective refractive index. The reflections that occur<br />
at the interface between the two sections are modeled by using the facet construct.<br />
This construct uses the transfer matrix:<br />
⎡E<br />
⎢<br />
⎣E<br />
1R<br />
1T<br />
L2, N2<br />
⎤ ⎡ RE<br />
⎥ = ⎢<br />
⎦ ⎣−<br />
j.<br />
T<br />
E<br />
− j.<br />
T<br />
R<br />
E<br />
E<br />
⎤ ⎡E<br />
⎥ ⋅ ⎢<br />
⎦ ⎣E<br />
where the fields Exx are defined as shown in Figure 4.38.<br />
The field reflection and transmission coefficients RE and TE are given by:<br />
n1<br />
− n2<br />
R =<br />
n1<br />
+ n2<br />
2<br />
T = 1− R<br />
12<br />
21<br />
⎤<br />
⎥<br />
⎦<br />
(4.37)<br />
(4.38)<br />
(4.39)<br />
By combining several of these grating periods a grating circuit can be created as<br />
shown in Figure 4.39. This grating consists of 11 periods, has a period length Λ of 2<br />
µm and a duty cycle of 50%. The indices of the grating periods, as indicated in the<br />
figure, were set at 1.5 and 3. It needs to be noted that these values are not in<br />
accordance with the condition of weak confinement that allows the 1D simplification<br />
of a 2D grating. However, a small index contrast would require a grating comprised of<br />
many more periods than the 11 used here to show a significant effect in the<br />
transmitted and reflected light. Since the user interface (not the underlying simulation<br />
method) of Aurora currently makes this nearly impossible a shortcut using a higher<br />
index contrast was opted for instead.<br />
E12<br />
E1R<br />
Interface<br />
E21<br />
E1T
100 µm<br />
107<br />
Simulation and analysis<br />
Figure 4.39. Implementation of an eleven period grating in Aurora.<br />
Power/P In (dB)<br />
0<br />
-20<br />
-40<br />
-60<br />
Aurora Reflected<br />
Simulayer Reflected<br />
Aurora Transmitted<br />
3500 4000 4500 5000 5500<br />
Wavelength<br />
Figure 4.40. Grating transmission and reflection as a function of the wavelength (The<br />
simulated reflection spectra calculated with Aurora and SimuLayer lie perfectly on top of each<br />
other. Therefore only two curves can be discerned in the figure).<br />
In Figure 4.40 the simulated transmission and reflection spectra of the grating circuit<br />
are given. The spectrum of the reflection has been calculated using Aurora as well as<br />
SimuLayer [129]. SimuLayer implements the transfer matrix method described in<br />
Equations (4.27-4.31), and can therefore be used to determine if the simulation results<br />
produced by Aurora are correct. By looking at the figure it can be concluded that this<br />
is clearly the case as the overlap between the reflection spectra is near perfect.<br />
The simulations in Aurora of this particular grating (across 400 wavelength points)<br />
took 18 seconds to calculate. While this is several orders of magnitude slower than the<br />
time required by SimuLayer it is still fast in comparison with the other methods<br />
mentioned. The real advantage of Aurora, however, is in the simulation of the timedomain<br />
step responses of which the results are given in Figures 4.41 and 4.42. The<br />
first figure shows the step responses of the transmitted and reflected light at the<br />
second maximum in the transmission, located just below the bandgap of the grating at<br />
a wavelength of 3965 nm. The responses do not begin at T=0. This is mainly due to<br />
the fact that some waveguides in the circuit, as indicated in Figure 4.39, have a length<br />
of 100 µm. This results in a delay of the signals by ≈1.5 ps.<br />
More interesting than the responses shown in Figure 4.41, are the step-responses<br />
shown in Figure 4.42 that were calculated for the center of the bandgap, at 4455 nm.<br />
Clearly, the interaction of the light within the grating at this wavelength is much more
Chapter 4<br />
complex than the interaction at a wavelength of 3965 nm, as can be concluded from<br />
the many oscillations in this figure.<br />
Power/P In (dB)<br />
0<br />
-5<br />
-10<br />
-15<br />
Reflected<br />
Transmitted<br />
-20<br />
0 2 4 6 8<br />
Time (ps)<br />
Figure 4.41. Step responses of the transmitted and reflected light outside the bandgap at<br />
3965 nm.<br />
Power/P In (dB)<br />
0<br />
-20<br />
-40<br />
-60<br />
Power/P In (dB)<br />
2<br />
0<br />
-2<br />
-4<br />
-6<br />
-8<br />
-10<br />
1.4 1.6 1.8<br />
Time (ps)<br />
2.0 2.2<br />
0 2 4 6 8 10<br />
Time (ps)<br />
Figure 4.42. Step responses of the transmitted and reflected light in the middle of the<br />
bandgap at 4455 nm. Inset: a close-up of the reflected step response showing a slight signal<br />
overshoot.<br />
108<br />
Reflected<br />
Reflected<br />
Transmitted<br />
Interestingly the reflected light reflects more power than is put into the grating for a<br />
short duration, as is shown in the inset. This might be an actual physical effect as it<br />
was for instance also seen in a different simulation that used grating indices of 1.5 and<br />
4. However, none of the results of the time-domain simulations have currently been<br />
compared with the results of other simulation methods. The effect might therefore<br />
also be caused by unpredictable behavior of the simulation method used by Aurora,<br />
although this is not very likely.<br />
For reasons of simplicity only the time domain responses at the in- and output of the<br />
grating have been recorded using the two probes placed in these locations. However,<br />
the probes are just as easily inserted at different locations in the grating. This could be<br />
used for instance, to analyze slow light or other phenomena within the grating. As<br />
such Aurora might prove to be a valuable tool in examining this particular class of<br />
complex optical devices.
Chapter 5<br />
Fabrication<br />
The majority of the devices that will be discussed in the<br />
following chapters have been realized in the Si3N4/SiO2<br />
materials system. Depending on the type of resonator that has<br />
been fabricated and the type of lithography that was used in this<br />
fabrication a different fabrication process was used. In this<br />
chapter three fabrication processes, one for lateral and two for<br />
vertically coupled resonators will be discussed. For the<br />
definition of the waveguides of the vertically coupled<br />
resonators contact as well as projection lithography has been<br />
used. The different requirements of these methods, both in<br />
mask design and fabrication, are also addressed.
Chapter 5<br />
5.1 Introduction<br />
The material system in which most of the resonators presented in this thesis have been<br />
fabricated is the silicon nitride/silicon oxide system (Si3N4/SiO2) [130]. The silicon<br />
nitride is used to fabricate the core of the waveguides while silicon oxide (e.g.<br />
thermal, TEOS or PECVD) is used in both the substrate and cladding layers. Both<br />
materials are highly compatible with CMOS technologies and can therefore benefit<br />
from all the advances made in these technologies.<br />
Silicon nitride was chosen due to its high refractive index of ≈1.98 at 1550 nm which,<br />
combined with silicon oxide as substrate or cladding layer, allows for potentially very<br />
small resonators, down to a radius of approximately 15 µm. In addition, the material<br />
is optically transparent from 400 nm to 2 um which makes it suitable for a wide range<br />
of applications and allows for low-loss high index waveguides with reported losses<br />
lower than 0.1 dB/cm [131]. Silicon nitride can be deposited in multiple layers of<br />
which the thickness can be controlled to within a few nanometers. Also, because the<br />
silicon nitride precursor gasses can be chosen to react to form stoichiometric Si3N4,<br />
the process is very stable concerning the refractive index. This opposed to for instance<br />
the SiliconOxiNitride process (SiON) where the ratios of the various precursors need<br />
to be carefully controlled during layer deposition to obtain a uniform refractive index,<br />
and from deposition to deposition for reproducibility. The use of silicon nitride,<br />
however, does place a constraint on the thickness of the silicon nitride layer. Due to<br />
tensile stress within the material it will crack and become unusable. The maximum<br />
safe deposition thickness of a silicon nitride layer is therefore no more than ≈340 nm.<br />
This thickness, however, allows for resonators as small as 15 µm which is more than<br />
sufficient for many applications.<br />
In total, three different fabrication processes have been used to realize different types<br />
of silicon nitride based devices. The characteristics of these processes have been<br />
summarized in Table 5.1. As shown, the process used to fabricate laterally coupled<br />
resonators is the simplest while the process that uses projection lithography to<br />
fabricate vertically coupled resonators is the most complex. The differences between<br />
these processes, however, are not limited to the processing itself but also have an<br />
effect on a higher level: in the layout of the masks and design choices made for the<br />
various devices. In the following sections the fabrication processes and their<br />
repercussions in the design of devices will be discussed in more detail.<br />
Table 5.1. Comparison of the fabrication processes used to create Si3N4 based<br />
devices.<br />
Lateral Vertical I Vertical II<br />
#guiding layers 1 2 2<br />
#metal layers Zero or 1 1 2 (Cr, Au)<br />
Litho type Contact Contact Contact + Projection<br />
# mask exposure<br />
steps<br />
1 3 6<br />
Tapers Horizontal Horizontal Horizontal, Vertical<br />
CMP No No Yes<br />
#major<br />
processing steps<br />
7 (etching, deposition,<br />
litho and anneal)<br />
14 (etching, deposition,<br />
litho and anneal)<br />
25 (etching, deposition,<br />
litho, CMP and anneal)<br />
110
5.2. Fabrication and mask design of laterally coupled<br />
resonators<br />
5.2.1 Fabrication<br />
111<br />
Fabrication<br />
The most basic fabrication process is that which is used for the fabrication of devices<br />
based on laterally coupled resonators. Only contact lithography is used to define the<br />
waveguides and typically only two layers, a core and a cladding layer are required to<br />
build the device. This makes the process highly suitable for the testing of new MR<br />
based devices because a typical fabrication run can be performed in less than a week.<br />
The only critical step in the process lies in the accurate definition of the small coupler<br />
gaps typically associated with laterally coupled resonators. Good control of the<br />
lithography is therefore highly important.<br />
Figure 5.1. Process flow with the major fabrication steps required to fabricate laterally<br />
coupled Si3N4 microring resonators.<br />
The process flow with the major fabrication steps used to fabricate a laterally coupled<br />
resonator is shown in Figure 5.1. As a substrate a thermally oxidized 4 inch silicon
Chapter 5<br />
wafer is used (step 1). The SiO2, with a thickness of 6-8 µm, serves as a buffer layer<br />
between the waveguides and the silicon substrate to prevent leakage of light into the<br />
substrate. On top of the SiO2 a 140-145 nm thick (varies slightly per application) layer<br />
of Si3N4 is deposited (step 2) using low-pressure chemical vapor deposition (LPCVD)<br />
at 800 °C. In this layer the waveguides are defined by first spinning a 1.5 µm thick<br />
layer of photoresist on top of the Si3N4 (step 3). After a pre-exposure bake of 1 minute<br />
at 95 °C this layer is exposed to UV light for 5.5 seconds through a chrome mask on a<br />
KARL SUSS MA 56M mask aligner (step 4). This mask, of which a small portion is<br />
shown in Figure 5.2 contains the definition of the waveguides, ring resonators, test<br />
structures and several supporting structures such as dice lines.<br />
Figure 5.2. Small section of a mask that is used to define laterally coupled resonators. The<br />
layout shows reflectors (left), normal micro-resonators (right), waveguide test structures (loop<br />
and several straight waveguides) and dice lines (vertical)<br />
After exposure the resist is baked at 120 °C for two minutes after which the resist is<br />
developed. The developed resist is then baked at 120 °C for 5 minutes to increase its<br />
resistance to dry plasma etching (step 5). Next the waveguides are created by<br />
completely etching through the Si3N4 in the areas not protected by resist using<br />
reactive ion etching (RIE) with a mixture of CHF3/O2 (step 6). After etching the resist<br />
is removed using fuming nitric acid (100% HNO3) (step 7). A 1 µm thick layer of<br />
tetra-ethyl-ortho-silicate (TEOS SiO2) is then deposited (step 8) at 700 °C. To densify<br />
the TEOS silicon oxide and anneal out loss-inducing NH and OH groups the wafer is<br />
annealed at 1100 °C for three hours (step 9). On top of the TEOS SiO2 an additional<br />
top cladding of 3 µm SiO2 is deposited (step 11) using plasma enhanced chemical<br />
vapor deposition (PECVD) after which the wafer is annealed for the second time at<br />
1100 °C for three hours (step 11). As a final step the wafer with the completed<br />
devices is diced using a high precision dicing saw with a blade thickness of 50 µm.<br />
In Figure 5.3 microscope images of a realized racetrack resonator and a racetrack<br />
based reflector are shown. The width of these devices is 220 µm. The inset in the<br />
image on the left shows a close-up of the coupling region of the racetrack resonator.<br />
The gap between the port waveguide and the resonator in the coupling region<br />
measures only 800 nm which is the minimum gap width which can be opened reliably<br />
using the fabrication process described above.<br />
112
113<br />
Fabrication<br />
Figure 5.3. Realized MR based reflector (left) and a single resonator (right). The inset shows<br />
a close-up of the coupling region of the resonator. The gap between the waveguides is 800<br />
nm.<br />
5.2.2 Mask layout<br />
Figure 5.4 shows the layout of a typical mask used to define laterally coupled<br />
resonators. This layout of this mask, like the masks used to define the vertically<br />
coupled resonators, follows a set of strict layout rules. The mask layout consists of<br />
several columns of which the width is an integer multiple of 5 mm. In each column<br />
there are 6 device groups and in each group are up to 20 individual microringresonators,<br />
depending on the size of these resonators.<br />
Alignment bar<br />
Minor dice line<br />
Major dice line<br />
Gap width:<br />
Figure 5.4. Mask layout used to define laterally coupled resonators.<br />
Within the groups the devices are created in pairs (two of each for redundancy) and<br />
only one parameter is varied. The two racetrack resonators in the right image of<br />
Figure 5.3, for instance, are identical but for the length of their coupling regions: the<br />
upper resonator has a coupler length of 180 µm whereas the lower has a coupler<br />
length of 200 µm.<br />
The groups within a single column are used to implement variation in the gap width<br />
but are otherwise identical. For laterally coupled silicon nitride racetrack resonators<br />
with a waveguide thickness of 140 nm a range in gap widths from 0.8 to 1.3 µm is<br />
used as shown in the Figure 5.4. Best performance of the resonators is usually in the<br />
0.8<br />
0.9<br />
1.0<br />
1.1<br />
1.2<br />
1.3
Chapter 5<br />
range of 0.9 to 1.1 µm. The 0.8 µm gaps are sometimes not fully opened while for<br />
gaps wider than 1.1 µm the coupling is normally too low. The addition of gap sizes<br />
beyond the useful range, however, makes the devices more resistant to variations<br />
(intentional or accidental) in the fabrication process.<br />
The columns that contain the groups are used to implement different types of devices.<br />
The outer four columns in the mask layout, for instance, contain MR-based reflectors<br />
while the inner twelve columns contain several different types of racetrack resonators.<br />
Also shown in the mask layout are the major and minor dice lines and the center<br />
alignment bar. In the mask layouts used for laterally coupled resonators the major dice<br />
lines are placed every 15 mm while the minor lines are spaced at 5 mm. The center<br />
alignment bar contains the alignment markers and several test structures. In Figure 5.5<br />
a small section of this bar is shown. The structures in grey belong to the waveguide<br />
layer while the structures in black belong to an additional design layer used to define<br />
chromium heaters.<br />
Figure 5.5. Close-up of the alignment bar. This bar contains the alignment markers (left) and<br />
several test structures (right).<br />
As shown in Figure 5.5 each layer has its own set of test structures. These structures,<br />
shown in more detail in Figure 5.6, are used to monitor several aspects of the<br />
fabrication process such as the lithography and the etch process. The resonator gap<br />
test shown in Figure 5.7 for instance can instantly tell which resonator gaps (could)<br />
have been opened in the fabrication process.<br />
Figure 5.6. Test structure set with patterns to<br />
test the lithography and etching of straight<br />
waveguides, ring resonators and several<br />
other structures.<br />
114<br />
“closed”<br />
“open”<br />
Figure 5.7. Resonator gap test.
5.3. Fabrication and mask design of vertically coupled<br />
resonators defined using contact lithography<br />
5.3.1 Fabrication<br />
115<br />
Fabrication<br />
The fabrication process used to build the first generation of vertically coupled<br />
resonators which is described here uses contact lithography to define the port<br />
waveguides and micro-ring resonators. Although the lithography for these devices is<br />
not as critical as that used for laterally coupled resonators, there are no small gaps<br />
between waveguides, this issue is replaced with the problem of correctly aligning the<br />
microring resonators to the port waveguides. This, combined with the fact that these<br />
devices consist of many more layers than devices based on laterally coupled<br />
resonators makes this process overall more complicated and time-consuming.<br />
Figure 5.8. Process flow with the major fabrication steps required to fabricate vertically coupled Si3N4<br />
microring resonators. (Vertical I, using contact lithography)
Chapter 5<br />
The process flow with the major fabrication steps used to fabricate a vertically<br />
coupled resonator is shown in Figure 5.8. As a substrate a thermally oxidized 4 inch<br />
silicon wafer is used (step 1). On top of the SiO2 a 140 nm thick layer of LPCVD<br />
Si3N4 is deposited (step 2) at 800 °C. In this layer the waveguides are defined by<br />
contact lithography using the KARL SUSS MA 56M (for more details see Paragraph<br />
5.2.1 and Figure 5.1) mask aligner (step 3) and by subsequent etching of the Si3N4<br />
using reactive ion etching (RIE) with a mixture of CHF3/O2 (step 4). A 1 µm thick<br />
layer of TEOS SiO2 is then deposited at 700 °C and annealed at 1100 °C for three<br />
hours (step 5). On top of the TEOS SiO2 a 180-190 nm thick layer of LPCVD Si3N4 is<br />
deposited (step 6). In this layer the microring resonators are defined using contact<br />
lithography by subsequent RIE etching (step 7). An additional 0.5 µm thick layer of<br />
TEOS SiO2 is then deposited and annealed (step 8). On top of the TEOS SiO2 a top<br />
cladding of 3.5 µm PECVD SiO2 is deposited after which the wafer is annealed for<br />
the third time (step 9). Next, a 200 nm thick layer of chromium is deposited on top of<br />
PECVD SiO2 in which the heaters are defined using contact lithography (step 10)<br />
after which the heaters are etched using chrome etch (step 11).<br />
5.3.2 Packaging<br />
After completion of the fabrication process some of the vertically coupled resonator<br />
based devices have been “pigtailed” and packaged. The process of attaching one or<br />
more fiber arrays and packaging a device is shown in Figure 5.9. First, a wafer is<br />
glued below the wafer with the devices (step 1). Next, 4 mm wide glass rails are glued<br />
on top, centered on the dice lines (step 2). The bottom wafer and the glass rails<br />
provide the “body” to attach the fiber arrays to the side of the chip. The wafer<br />
assembly is then diced in single columns using a 300 µm thick dicing saw. These<br />
columns are then measured and a properly working device is selected. The column<br />
with the working device is then diced again below and above the working device to<br />
create a chip with a width of 7-10 mm (step 4). This chip is then placed in a special<br />
fiber pigtailing measurement setup. In this setup the fibers can be glued to the device<br />
whilst simultaneously optimizing the fiber-chip coupling loss (step 5). The chip with<br />
the attached fibers is then glued onto a ceramic carrier substrate (step 6) followed by<br />
the wire bonding of the chip using aluminum bond wires. A packaged chip is shown<br />
in Figure 5.10. Clearly visible are the fiber arrays that have been glued to both sides<br />
of the chip and the glass rails on top. Also the ceramic chip carrier and the bond wires<br />
that lead from the optical chip to the carrier can be identified. The small scale of the<br />
optical devices is also evident from this picture: the chip measures only 10 by 7 mm<br />
but already contains 10 individual devices. In the inset 3 devices consisting of 8<br />
resonators each are shown. The bondpads measure 300 by 350 µm.<br />
116
3<br />
1<br />
6<br />
5<br />
7<br />
Figure 5.9. Pigtailing of an optical chip.<br />
117<br />
Fabrication<br />
Figure 5.10. Pigtailed and packaged chip. The fiber arrays (white arrows) are glued to the<br />
glass rails on top of the chip. The inset shows a close-up of the wirebonds that connect to the<br />
carrier chip.<br />
2<br />
4
Chapter 5<br />
5.3.3 Mask layout<br />
The biggest concern when fabricating vertically coupled micro-resonators using<br />
contact lithography lies in the alignment of the resonator to the port waveguides. With<br />
the KARL SUSS MA 56M mask aligner that was used for the lithography an<br />
alignment error of less than 0.5 µm can be achieved in theory (specification says 0.25<br />
µm). This, however, often requires many attempts before succeeding, making it a very<br />
laborious and unreliable process. More often than not alignment errors in excess of 1<br />
µm were obtained, and could be as bad as the 2 µm misalignment shown in Figure<br />
5.11.<br />
Figure 5.11. A misaligned microring resonator<br />
The effect of this misalignment can be quite severe as shown in Figure 5.12a. If for<br />
instance the TEOS SiO2 layer between the resonator and the port waveguide is 1 µm<br />
and the resonator power coupling coefficient (=κ 2 ) designed to be ≈0.5 then a<br />
misalignment of 0.5 µm can lead to a ∆κ 2 as high as 0.3. In Figure 5.12b where the<br />
dropped power is plotted as a function of the two coupling coefficients for a resonator<br />
with R=50 µm and αdB=1.5 dB/cm it can be seen that such differences can lead to a<br />
very large reduction of the dropped power.<br />
a)<br />
Max Drop<br />
118<br />
1.2<br />
1.0<br />
0.8<br />
0.6<br />
0.4<br />
0.2<br />
0.0<br />
0.7<br />
0.6<br />
0.5<br />
0.4<br />
0.3<br />
0.2<br />
0.1<br />
0.0<br />
0.20.30.40.50.60.7<br />
0.1<br />
0.0<br />
Figure 5.12. Close-up of Figure 3.20a showing the coupling κ 2 as a function of the lateral and<br />
vertical offset a). A difference in coupling coefficients can have a detrimental effect to the<br />
maximum dropped power of the resonator b).<br />
κ2<br />
b)<br />
κ1<br />
0.0<br />
0.2<br />
0.4<br />
0.6<br />
0.8<br />
1.0
119<br />
Fabrication<br />
To reduce this problem a built in misalignment, where the resonator is offset in one<br />
direction with respect to the port waveguides, was introduced into the masks that were<br />
used to create the vertically coupled resonator devices. The layout of these masks, of<br />
which two types are shown in Figures 5.13 and 5.14, is similar to the layout used for<br />
the laterally coupled devices with a standardized column width and device group size,<br />
a central alignment bar with test structures, and dice lines. Instead of varying the gap<br />
for the 6 device groups in a single column, however, a variation in the alignment error<br />
is introduced. Within a single group the devices are all equal but for a variation of the<br />
lateral distance between the resonator and port waveguides called the “symmetric<br />
offset” which is also shown for reference in Figure 5.13b. In Figure 5.13a a mask is<br />
shown that was used to create resonators that have port waveguides on opposing sides<br />
as shown in Figure 5.13b. In this mask the alignment is varied in increments of 0.5<br />
µm between -1.5 µm and 1.0 µm. Although this implies, by definition, that 5/6 th of the<br />
devices will always be misaligned it also reduces the misalignment for one set of<br />
devices in the column to 0.25 µm or better. However, due to the fact that there are<br />
four columns in the mask and the small size of the resonators, meaning that many are<br />
present in a single group, this can still lead to a substantial number of working<br />
devices. The same approach of using built in misalignments is also used in the mask<br />
layout of newer devices with port waveguides that are cross-coupled to the resonator<br />
as shown in Figure 5.14b. Due to that fact that the waveguides are now susceptible to<br />
alignment errors in the vertical as well as the horizontal direction, however, the<br />
alignment has to be varied in two directions as shown in Figure 5.14a. This means<br />
that although properly aligned devices can be fabricated these represent only 1/36 th of<br />
the total number of fabricated devices.<br />
a)<br />
-1.5<br />
-1.0<br />
-0.5<br />
Symmetric<br />
offset<br />
Figure 5.13. Mask layout a) for side coupled<br />
resonators b). Also shown is the definition of<br />
the symmetric offset of a resonator. This is<br />
the distance between the center of the<br />
resonator guide and the center of the port<br />
waveguides.<br />
0<br />
0.5<br />
1.0<br />
-1.5 -1.0 -0.5 0 0.5<br />
b) b)<br />
Figure 5.14. Mask layout a) for cross coupled<br />
resonators b).<br />
a)<br />
-1.5<br />
-1.0<br />
-0.5<br />
0<br />
0.5<br />
1.0
Chapter 5<br />
5.4. Fabrication and mask design of vertically coupled<br />
resonators defined using stepper lithography<br />
5.4.1 Stepper lithography and mask design<br />
As pointed out in the previous section, only 1/36 th of the total number of fabricated<br />
devices can be properly aligned when building cross-coupled micro-resonators using<br />
contact lithography. This is not necessarily a problem when small devices, consisting<br />
of one or two microring-resonators, are built. Assuming a realistic average device<br />
height of 500 µm then, when using 6 columns, 20 devices can fit in the 1 cm 2 area<br />
allotted to a single group. Because the devices are, on average, only 1.5 mm in width<br />
(largely due to bends, tapers etc), the number of columns can even be tripled to 18,<br />
giving a total number of 60 functional devices per wafer, which gives more than<br />
enough devices for redundancy and parameter variations. More complex devices such<br />
as for instance the later discussed OADM and λ-Router, have a height between 1.5<br />
and 2 mm and a width of about 5 mm. At most 10 to 12 of these devices can therefore<br />
be put on 1 cm 2 which leaves almost no room for redundancy. Considering the fact<br />
that inevitably some of these devices will be damaged during fabrication [132],<br />
getting sufficient yield (or even functional devices) can be a problem.<br />
In collaboration with ASML Netherlands B.V [133] a solution was therefore sought in<br />
the use of wafer stepper lithography. Contrary to contact lithography where a single<br />
mask exposes an entire wafer in a single step, a wafer stepper exposes only a small<br />
fraction of the wafer by projecting a selected area (the image) of the mask (the reticle)<br />
onto the wafer through a series of lenses as is shown in Figure 5.15. By moving the<br />
wafer in the x- or y- direction several locations on the wafer can by exposed in this<br />
fashion, producing many identical copies.<br />
Figure 5.15. Wafer stepper concept: An image located on the reticle is reduced through a<br />
series of lenses and projected on a wafer. The wafer can be moved to expose several areas<br />
on the mask with this image.<br />
The main benefits of using wafer stepper lithography for vertically coupled microring<br />
resonator devices lies in the alignment accuracy of the images projected onto the<br />
wafer and the high resolutions that can be achieved. The ASML PAS 5500/275 [134]<br />
stepper used to fabricate the OADM and router devices has a resolution better than<br />
120<br />
Mirror<br />
UV Light source<br />
Filter<br />
Condenser<br />
Lens system<br />
Reticle<br />
Reduction<br />
Lens system<br />
Wafer
121<br />
Fabrication<br />
280 nm and an alignment accuracy better than 40 nm. The problems related to the<br />
accurate positioning of the resonator with respect to the waveguides are therefore<br />
essentially removed. The downside of using a stepper however lies in the maximum<br />
mask area that can be exposed. To achieve the high optical resolution the wafer<br />
stepper reduces the image(s) present on the reticle linearly by a factor of five. Due to<br />
this reduction and the image space available on the reticle the maximum area that can<br />
be exposed on the wafer is 22 x 27.4 mm for this specific stepper tool. This, however,<br />
is the maximum area that can be exposed in a single exposure step and uses up all the<br />
image space on the reticle. This poses a problem since the fabrication of a typical<br />
microring resonator based device with heaters requires at least three or four mask<br />
exposures. The solution is then to either use 4 expensive reticles or use a single<br />
reticle with 4 smaller images instead of a single large image. The latter solution then<br />
still allows for a roughly 10 by 10 mm area to be exposed by these images.<br />
Router image, guide layer Router image, ring layer<br />
1<br />
ROADM image, guide layer ROADM image, ring layer<br />
2<br />
Marker image<br />
Figure 5.16. Layout of a mask (reticle) used in the PAS 5500/275 wafer stepper. In total 5<br />
images are present in this reticle. The stepper can select one of these images to expose a<br />
certain area on a wafer.<br />
Instead of using the stepper lithography for the definition of all layers in the device a<br />
more efficient method can also be found, based on alignment accuracy requirements.<br />
Based on the results of the OADM devices fabricated in the “Vertical I” process the<br />
decision was made to improve the OADM and router devices built using the stepper<br />
lithography by adding an additional gold electrode layer on top of the heaters. In<br />
addition the newer designs added vertical tapers to reduce the fiber–chip coupling<br />
losses. A total of 5 mask exposure steps are therefore required:<br />
5<br />
3<br />
4
Chapter 5<br />
1. Definition of the vertical tapers<br />
2. Port waveguide definition<br />
3. Resonator waveguide definition<br />
4. Definition of the chromium heaters<br />
5. Definition of the gold electrodes<br />
Of these five steps, however, only the alignment of the second and the third layers is<br />
critical. It is therefore possible to use a hybrid approach, using stepper as well as<br />
contact lithography. With this hybrid approach only two stepper wafer exposures are<br />
required per device. Using a total of four images on the reticle it is therefore possible<br />
to create two unique device groups that each measure 10 by 10 mm instead of only<br />
one of that size. The layout of the images on the stepper reticle is shown in Figure<br />
5.16. Images 1 and 3 define the port waveguides and resonators of a device group that<br />
contains several routers respectively. Images 2 and 4 are used for a device group that<br />
contains several routers in addition to several types of test structures.<br />
If in the original 5 mask exposure steps only step 2 and 3 use stepper litho then a<br />
problem will occur since the stepper cannot align to the vertical taper structures<br />
defined by the first exposure step. However, it is possible to do the reverse: aligning a<br />
contact mask to structures defined with the stepper. An additional exposure step is<br />
therefore added to create the exposure sequence written in Table 5.2.<br />
Table 5.2. Mask exposure sequence. The router does not use vertical tapers.<br />
Exposure step 2 is therefore left open for the router.<br />
OADM Router<br />
1 Stepper reticle, Image 5 Stepper reticle image 5<br />
2 Contact mask, Vertical tapers --<br />
3 Stepper reticle, Image 2 Stepper reticle, Image 1<br />
4 Stepper reticle, Image 4 Stepper reticle, Image 3<br />
5 Contact mask, Chromium heaters Contact mask, Chromium heaters<br />
6 Contact mask, Gold leads Contact mask, Gold leads<br />
a)<br />
b)<br />
Figure 5.17. Alignment markers in the reticle images help to align the contact mask.<br />
122<br />
Alignment<br />
markers
123<br />
Fabrication<br />
In the first exposure step the wafer stepper is used to define ASML-specific alignment<br />
markers that are used to align all future images. In addition a special marker, located<br />
in reticle image 5 (see fig. 5.16) and shown enlarged in Figure 5.17a, is placed on the<br />
wafer in two locations: -25000, -500 and +25000, -500 (x,y-in microns, offset relative<br />
to the center of the wafer). To these markers the contact mask that defines the vertical<br />
tapers is then aligned.<br />
During the second exposure step the contact mask, which defines the vertical tapers<br />
for the OADM devices, is aligned to these markers. The following two critical stepper<br />
exposure steps 3 and 4 that define the waveguide and resonator layers use the ASML<br />
markers created in step 1. Next, in the fifth exposure step, the mask used by the<br />
contact lithography to define the chromium heaters is aligned to the markers present<br />
in the OADM resonator reticle image which is shown enlarged in Figure 5.17b. The<br />
mask used in this step is also shown in Figure 5.18 to show how the various device<br />
groups are positioned across a wafer. Each of the squares visible on the mask<br />
represents a device group: 58 OADM groups and 2 router groups. The layout follows<br />
the typical pattern of a wafer stepper where many identical device groups are created<br />
adjacent to one another in consecutive exposure steps. The sixth and final exposure<br />
uses a similar mask to define the gold electrodes. In this instance the mask is aligned<br />
to alignment markers created in the chromium heater layer.<br />
Figure 5.18. Layout of a mask used for contact lithography. The typical pattern produced by<br />
the stepper, creating many of the same images side by side which also dictates the layout of<br />
this mask, is clearly visible.
Chapter 5<br />
5.4.2 Fabrication<br />
The fabrication process used to build vertically coupled resonators using stepper<br />
lithography is by far the most complicated due to the fact that the contact and stepper<br />
lithography have to be combined in a single process. In addition vertical tapers, an<br />
additional gold electrode layer and chemical mechanical polishing (CMP) have been<br />
added to improve overall device performance. Due to the many processing steps the<br />
fabrication flow described in the following text is separated into three sections. In the<br />
first section the processing steps for creating the initial alignment markers and vertical<br />
tapers are discussed. The second section discusses the steps required to create the port<br />
and resonator waveguides and in the final section the steps required to create the<br />
heaters and electrodes are described.<br />
Figure 5.19. Process flow showing the steps required to make the alignment markers and the<br />
vertical tapers in the Si3N4 layer that will hold the port waveguides.(Process: Vertical II, using<br />
contact+stepper lithography)<br />
Figure 5.19 shows the process flow to create the markers and vertical tapers.<br />
The process commences with a 4 inch silicon wafer (step 1). Using the wafer stepper<br />
the ASML specific alignment markers and contact-to-stepper alignment markers are<br />
patterned in resist (step 2). These patterns are then etched to a depth of 120 nm using<br />
RIE on a PlasmaTherm 790 with a mixture of CHF3/O2 (step 3). The etch depth in the<br />
silicon is critical for the alignment performance of the wafer stepper. The alignment<br />
procedure uses the differences in optical path length between the etched and non-<br />
124
125<br />
Fabrication<br />
etched regions in the marker, shown in Figure 5.20. A deviation of the 120 nm etch<br />
depth will therefore result in degraded alignment performance.<br />
Figure 5.20. Optical microscope image of an ASML alignment marker etched in silicon used<br />
for the alignment of the wafer stepper.<br />
After etching the markers the wafer is thermally oxidized at 1100 °C in a steam<br />
oxidation furnace until an oxide thickness of 6 µm is reached (step 4). Normally an<br />
oxide thickness of 8 µm is preferred to ensure that there is no leakage of light into the<br />
silicon substrate. However, alignment tests with the stepper showed a degraded<br />
performance of the alignment at this thickness. Since simulations showed no increase<br />
in leakage to the substrate for a thinner oxide buffer layer of 6 µm, this thickness was<br />
used instead of the 8 µm to improve the alignment accuracy. On top of the thermal<br />
SiO2 a 140 nm thick layer of LPCVD Si3N4 is deposited (step 5). On top of this layer<br />
a sacrificial layer is then deposited (step 6). In this layer holes and slots are defined<br />
using contact lithography and subsequently etched down to the Si3N4 layer using wet<br />
etching (step 7). Wet etching of the Si3N4 is then used to create a slowly tapering<br />
region by under etching of the Si3N4 masked by the sacrificial layer (step 8). After<br />
removal of the sacrificial layer (step 9) the unmasked region of the Si3N4, which is<br />
etched down to a thickness of 70 nm, will form (after etching of the waveguides) a<br />
thin lead-in waveguide that is well matched to the modal field of a small core fiber.<br />
The tapered region etched in the masked Si3N4 then forms a vertical taper that, in<br />
combination with a horizontal taper, adapts this modal field to the modal field of the<br />
140 nm thick port waveguides.<br />
Figure 5.21 shows the next steps, used to create the port and ring resonator<br />
waveguides, of the fabrication process. In the Si3N4 layer with vertical tapers (the<br />
actual tapers are not shown in the figure) created in process step 9 the waveguides are<br />
defined in resist using stepper lithography (step 10). Subsequently the waveguides are<br />
etched by etching through of the Si3N4 using RIE (step 11). A 1 µm thick layer of<br />
TEOS SiO2 is then deposited at 700 °C and annealed at 1100 °C for three hours (step<br />
12). This layer is then chemically mechanically polished for 90 seconds using a<br />
colloidal suspension of ≈30% amorphous silica, with a diameter of 25 nm, stabilized<br />
in an acid medium (step 13). The CMP removes ≈33 nm of TEOS while smoothing<br />
the “bumps” in the TEOS, made by the Si3N4 waveguides underneath, from a height<br />
of ≈150 nm down to a height of ≈5 nm.<br />
On top of the TEOS SiO2 a 180 nm thick layer of LPCVD Si3N4 is deposited (step<br />
14). In this layer the microring resonators are defined in resist using stepper<br />
lithography (step 15) and are etched using RIE (step 16).
Chapter 5<br />
Figure 5.21. Process flow showing the steps required to make the port and resonator<br />
waveguides in Si3N4. (Process: Vertical II, using contact+stepper lithography)<br />
A 0.5 µm thick layer of TEOS SiO2 is then deposited and annealed (step 17). On top<br />
of the TEOS SiO2 a top cladding of 3.5 µm PECVD SiO2 is deposited after which the<br />
wafer is annealed for the third time (step 18).<br />
In microscope images taken of the devices after processing step 15 the advantages of<br />
the stepper lithography are clearly visible. In Figure 2.22 a perfectly aligned<br />
microring resonator is shown which would be difficult to achieve when using only<br />
contact lithography. In Figure 2.23 the high resolution of the stepper is demonstrated:<br />
the gap between the two resonators measures less than 300 nm but is fully opened.<br />
126
Figure 5.22. Stepper lithography provides<br />
perfect alignment of the resonator and port<br />
waveguides.<br />
127<br />
Fabrication<br />
Figure 5.23. An open gap in the coupling<br />
region between two resonators of less than<br />
300 nm can be created.<br />
Figure 5.24. Final steps of the process flow showing the steps required to make the chromium<br />
heaters and gold electrodes. (Process: Vertical II, using contact+stepper lithography)<br />
Figure 5.24 shows the final steps of the fabrication process. The chromium and gold<br />
metallization layers used to create the heaters and electrode wires are created using<br />
lift-off. For the chromium heaters the layout is first patterned in resist (step 19) using<br />
contact lithography. Next a 200 nm chromium layer is deposited (step 20) which is
Chapter 5<br />
removed using lift-off of the resist (step 21).The gold electrodes are fabricated in a<br />
similar fashion (steps 22-24) after which the fabrication process is completed.<br />
The SEM micrograph in Figure 5.25a shows a top view of a second order microring<br />
resonator that has been realized using this process in which the heater and electrode<br />
metallization layers can be discerned. A close-up of the coupling region between the<br />
two resonators is given in Figure 5.25b. Here the different layers of the device, from<br />
thermal SiO2 to chromium metallization are clearly visible.<br />
Gold<br />
Chromium<br />
Figure 5.25. Top view of a second order resonator filter showing the metallization layers a) and<br />
a cross-section b) of the coupling region of this resonator showing the numerous layers in the<br />
device.<br />
A top view of a completed wafer is shown in Figure 5.26. Some of the devices on this<br />
wafer, like those fabricated using only contact lithography, have been packaged. For<br />
this the same process was used as described in Section 5.3.2. However, due to the<br />
increased number of bondwires and the long distances that need to be made to connect<br />
these to the pads on the ceramic carried that are required for these devices an<br />
“extender board” was designed. This extender board, which is also visible in the<br />
pigtailed and packaged device shown in Figure 5.27, consists of several gold leads on<br />
a glass substrate. Because the bondwires only need to bridge the gap between the<br />
extender and router bondpads on one side and the extender and pads on the carrier on<br />
the other side the length of the bondwires remains small.<br />
Figure 5.26. Fully processed wafer. Figure 5.27. Pigtailed<br />
and packaged<br />
device.<br />
128<br />
TEOS SiO2<br />
Chromium<br />
PECVD SiO2<br />
Si3N4<br />
Thermal SiO2
Chapter 6<br />
Microring-resonator building blocks<br />
In this chapter the basic microring resonator building block is<br />
introduced. This building block forms the basis of more<br />
complex devices such as the ROADM and λ-router described in<br />
the following chapter. It is also used in the wavelength<br />
selective switch which, because it is used as a subcomponent in<br />
the NAIS transceiver and the λ-router, is a building block in its<br />
own right and is therefore also discussed in this chapter.
Chapter 6<br />
6.1 Introduction<br />
About half of the work that is described in this thesis was carried out within the NAIS<br />
project. This project, which was previously described in Chapter 1.4.1, aimed to<br />
create an integrated optic WDM-Transceiver for application PON-Networks. As was<br />
already shown in Figure 1.5 this transceiver is a highly integrated, highly complex<br />
component that combines many functions, such as modulators, filters and switches on<br />
a single chip. A simple implementation of this device, able to receive and send data<br />
on four different channels (using a total of 8 channels), in which all functions have<br />
been implemented using microring resonators is given in Figure 6.1 [135] The main<br />
features on the chip are a λ-filter and modulator section used for outgoing (upstream)<br />
communication and a section with a channel selector comprised of several wavelength<br />
selective switches that can select a single channel from incoming (downstream)<br />
communication.<br />
The section for upstream communication uses an array comprised of four MRs to<br />
filter out distinct wavelengths from a broadband light source. One or several of these<br />
wavelengths are then modulated to create the upstream signal.<br />
For the downstream signal a point of concern is the fact that the polarization state of<br />
this signal is not known. This is no problem when the microring resonators used, have<br />
polarization independent behavior. However, it is difficult to make polarization<br />
independent microring resonators in silicon nitride, the material of choice for this<br />
device. The channel selector is therefore implemented using polarization diversity<br />
(also see Chapter 8) where the TE and TM polarization of the signal are operated on<br />
individually. To this end the polarizations are first separated after which the TM<br />
signal is converted to TE. The two TE polarized signals are then operated on by two<br />
identical switch matrices as shown in the figure.<br />
Figure 6.1. Implementation of the NAIS 4-channel WDM-Transceiver for use in PON<br />
Networks that is exclusively comprised of microring resonators.<br />
The separation of the TE and TM polarization with a resonator is fairly<br />
straightforward since it only requires a resonator that cannot go in resonance for the<br />
TM polarization, for instance by ensuring very high cavity losses for the TM<br />
polarization. Making a polarization converter based on a microring resonator is more<br />
complicated, however, but can be achieved by using a microring resonator that has<br />
sloped resonator sidewalls [136-138]. Because of the polarization diversity approach<br />
the resonators only have to be optimized for the TE polarization, making the overall<br />
130
131<br />
Microring-resonator building blocks<br />
design simpler and easier to fabricate. In fact, in the implementation that is shown<br />
most resonators, except those used for modulation and polarization conversion, can<br />
then be implemented using the same type of resonator.<br />
This resonator is the basic “resonator building block” used in most devices described<br />
in this thesis. In Section 6.2 the design of this resonator is presented, followed by the<br />
characterization of a number of different resonators in Section 6.3. In this section the<br />
thermal tuning of these resonators is also investigated. In Section 6.4 the design and<br />
characterization of a wavelength selective switch are discussed. This switch is one of<br />
the realized sub-components of the NAIS transceiver, where it is used in the channel<br />
selector. The basic principle behind the switch, which is based on the overlap of the<br />
resonance wavelengths of two cascaded resonators, is also found in the λ-router which<br />
is presented in the next chapter. As such the switch can also be seen as a building<br />
block because the same considerations that go into the design of a single switch also<br />
largely apply to the switch matrix used in the router.<br />
6.2 A vertically coupled microring resonator based building<br />
block<br />
The basic microring resonator building block referred to in the introduction consists<br />
of a vertically coupled microring resonator that is made tunable using a thin-film<br />
metal heater. The ring and port waveguides of this resonator are made in Si3N4<br />
embedded in SiO2. As stated in Chapter 5.1 these materials were chosen for their high<br />
index contrast of ≈0.55, their low optical loss and high material stability.<br />
a)<br />
Figure 6.2. Isometric rendering a) and a realized version b) of a vertically coupled MR building<br />
block that has side-coupled port waveguides. The marker next to the resonator is used to<br />
check the vertical alignment of the resonator.<br />
a)<br />
b)<br />
Figure 6.3. Isometric rendering a) and a realized version b) of a vertically coupled tunable MR<br />
building block that is cross-coupled to the port waveguides. The marker next to the resonator<br />
measures the vertical as well as the horizontal alignment of the resonator.<br />
b)
Chapter 6<br />
In early, comparatively simple devices such as the wavelength selective switch, the<br />
microring resonator in the building block used side-coupled port waveguides as<br />
shown in Figure 6.2. In more recent devices such as the OADM and the λ-router<br />
mainly cross-coupled resonators [25], as shown in Figure 6.3, have been used because<br />
of the ease with which these resonators can be placed in a compact mxn matrix<br />
configuration [139]. Aside from the coupling to the waveguides, however, the<br />
geometrical design of both resonators is identical.<br />
The cross-section of the coupling region with all the relevant design parameters<br />
relating to the geometrical design of the microring resonator building block is shown<br />
in Figure 6.4. A description of these parameters is given in Table 6.1 and Table 6.2<br />
gives the refractive index of the materials that are used. In the following sections the<br />
choices made to arrive at the values of these parameters are discussed in more detail.<br />
Figure 6.4. Si3N4/SiO2 microring resonator cross-section across the coupling region. All<br />
relevant parameters and materials are depicted.<br />
Table 6.1. Microring resonator design parameters used for the building block<br />
Parameter Description Typical value (µm)<br />
htclad PECVD top cladding thickness 3.5<br />
hrclad TEOS top cladding thickness 0.5<br />
hsep TEOS separation layer thickness 1.0<br />
hbuff Thermal SiO2 Buffer layer thickness >5.0<br />
hg Port waveguide thickness 0.14<br />
wg Port waveguide width 2.0<br />
hr Ring resonator waveguide thickness 0.18 – 0.19<br />
wr Ring resonator waveguide width 2.5<br />
s Offset between ring resonator and port<br />
waveguide<br />
R Ring resonator radius 50<br />
132<br />
1.0 -2.5
133<br />
Microring-resonator building blocks<br />
Table 6.2. Refractive index of the materials used in the microring resonator building<br />
block<br />
Material Refractive index @1550 nm<br />
Silicon 3.47<br />
Thermal SiO2<br />
1.452<br />
Si3N4<br />
1.979<br />
TEOS SiO2 (Annealed) 1.45<br />
PECVD SiO2<br />
1.46<br />
Chromium (for heater) 4.13+j5.03<br />
Gold (for electrodes) 0.357+j10.4<br />
6.2.1 Dimensions of the oxide layers<br />
The vertically coupled microring resonator consists of several layers of silicon oxide<br />
in which the Si3N4 ring and port waveguides are embedded. The thickness of the<br />
various layers of silicon oxide is largely independent of the resonator design as the<br />
thickness of these layers is mainly determined by materials constraints and the need to<br />
avoid leakage to the substrate and heater.<br />
The thermal oxide buffer layer between the port waveguide and the silicon substrate<br />
has to be thick enough to prevent leakage. For the given port waveguide dimensions<br />
this leakage becomes noticeable (i.e. significant change in propagation loss) for the<br />
TE mode at a thickness of ≈4 µm and for the TM mode at tbuff≈4.5 µm. At the facets,<br />
where these waveguides are tapered and the mode expands this distance becomes<br />
even larger. To be on the safe side it is therefore a rule of thumb to use a thermal<br />
oxide buffer layer with a thickness >5 µm. All devices discussed in this thesis used a<br />
buffer with a thickness of 8 µm with an exception of 6 µm made for the devices<br />
fabricated in the “Vertical II” fabrication process due to stepper requirements. An<br />
even thicker thermal oxide layer was not used because it has little effect on the losses<br />
while significantly increasing the time to grow the layer by wet oxidation of the<br />
silicon.<br />
For the resonator there is a similar problem with leakage due to the chromium thin<br />
film metal heater on top. Due to the higher confinement of the field in the resonator, a<br />
combined thickness of the TEOS and PECVD SiO2 top cladding layers of >3 µm is<br />
sufficient in this case and has been used in some older building block realizations.<br />
However, because leakage from the port waveguides also needs to be considered, an<br />
additional 1 µm was added to this for safety in more recent building blocks, used in<br />
the OADM and router for instance. The top cladding should not be too thin, but also<br />
not too thick because this will adversely affect the heater efficiency. The thickness of<br />
the top cladding is therefore to a certain extent dependent on the design of the<br />
resonator because a more confined field allows a thinner cladding and thus higher<br />
efficiency.<br />
In the design TEOS SiO2 is used as the intermediate layer between the resonator and<br />
port waveguides as well as on top of the resonator because of the high optical quality<br />
and very good step coverage of this material. This avoids the “voids” directly near the<br />
waveguide that may occur when growing other materials such as PECVD SiO2 and<br />
which may increase the propagation losses in the waveguide. As can be seen the total<br />
thickness of the two TEOS layers combined is 1.5 µm which is because of the fact
Chapter 6<br />
that the TEOS has a very high material stress which may cause cracking at a larger<br />
thickness.<br />
The coupling between the resonator and port waveguide is largely determined by the<br />
lateral offset s, the radius R of the resonator, and the thickness hsep of the separation<br />
layer. As shown in Table 6.1 a thickness of 1 µm was chosen for the separation layer.<br />
Although this layer can be thinner, experiments on a number of fabricated devices<br />
have shown that this thickness usually gives the best MR performance in the range of<br />
lateral offsets that are also given in the table. In addition, if for some reason the<br />
coupling of turns out to be lower than expected then it is still possible to increase the<br />
coupling by reducing hsep and no new mask design is required.<br />
6.2.2 Dimensions of the resonator and port waveguides<br />
As discussed in Chapter 3.5.1 the design of the waveguide dimensions in a vertically<br />
coupled resonator starts with the design of the resonator and then tries to match this<br />
resonator to a port waveguide with well chosen dimensions. This design strategy<br />
assumes that the dimensions of the port waveguide can be adjusted such that its<br />
effective refractive index can be made to match that of the ring resonator.<br />
Neff<br />
1.58<br />
1.56<br />
1.54<br />
1.52<br />
1.50<br />
1.48<br />
1.46<br />
0.5 1.0 1.5 2.0 2.5 3.0 3.5<br />
Guide Width (µm)<br />
134<br />
h = 0.110<br />
h = 0.120<br />
h = 0.130<br />
h = 0.140<br />
h = 0.150<br />
h = 0.160<br />
h = 0.170<br />
h = 0.180<br />
h = 0.190<br />
h = 0.200<br />
h = 0.220<br />
h = 0.260<br />
Figure 6.5. Port waveguide Neff versus the waveguide height<br />
and width. The indicated areas show the dimensions for best<br />
phase matching and the best dimensions when tolerances are<br />
included.<br />
1 st order cut-off<br />
Best design dimensions<br />
when including tolerances<br />
Figure 6.6. Waveguide<br />
stitching.<br />
Figure 6.5 shows that, in theory, it is indeed possible to design a monomodal<br />
waveguide for a wide range of effective refractive indices. In practice, however, the<br />
useful design range was much more limited for several reasons:<br />
• Most of the devices that have been fabricated use masks made at the MESA+<br />
institute for the lithography. One problem of these masks is that stitching in<br />
the waveguides may occur, as shown in Figure 6.6. Because the additional<br />
waveguide losses induced by this stitching are proportional to the waveguide<br />
width, the waveguides should not be chosen too narrow. Another reason for<br />
doing so is the fact that, for widths in the order of 1.5 µm, defects sometimes<br />
occurred in the masks which can be avoided for larger dimensions.<br />
• Bi-modality in the waveguides needed to be avoided at all cost. For fabricated<br />
waveguides a deviation in width and height with respect to the original design
135<br />
Microring-resonator building blocks<br />
of 0.2 µm and 5 nm respectively is not uncommon. This should therefore be<br />
taken into account in the design of the waveguide so that there is some<br />
tolerance in the dimensions before the waveguide becomes bi-modal.<br />
• Tests with waveguides of 150 nm and a width of 2.0 µm had shown bimodal<br />
behavior in some cases. Although part of this could be attributed to a widening<br />
of the waveguides during fabrication, the simulations used to design the<br />
waveguide are also not to be trusted completely. The plots shown in Figure<br />
6.5 have been created using the Film Mode Matching solver of Selene. This<br />
solver finds a cut-off for the first order mode for a waveguide with a thickness<br />
of 140 nm near a width of 2.6 µm. However, the FD generic solver of the<br />
same program already shows a first order occurring for a width of 2.2 µm.<br />
Taking all these reasons into account the useful design range, offering sufficient<br />
tolerance in the design as well as an Neff that is as high as possible, is roughly for a<br />
width of 1.7 to 2.2 µm and a height of 130 and 150 nm as indicated in Figure 6.5. In<br />
particular a waveguide with a height of 140 nm and a width of 2 µm was chosen out<br />
of this range as it offers sufficient tolerance in the waveguide dimensions and still has<br />
a reasonably high effective refractive index of ≈1.50. These dimensions also allow for<br />
a fairly small bend radius of the port waveguide. As shown in Figure 6.7, the optimum<br />
bend radius for this waveguide is around 170 µm. A small radius, as was discussed in<br />
Chapter 3.7.3, can be important for the miniaturization of the devices. In most<br />
designs, however, instead of the 170 µm radius a more conservative radius between<br />
220 to 250 µm was used. This is because of the fact that a fabricated waveguide can<br />
not only be thicker than designed, potentially causing bimodality, but also thinner. As<br />
shown in Figure 6.7 for a waveguide with a thickness of 130 nm and a width of 2 µm<br />
this can lead to a considerable increase in bend loss if a radius of 170 µm is used. For<br />
a radius between 220 to 250 µm, however, the increase in loss is much less severe.<br />
180 Bend loss (dB)<br />
0.50<br />
0.45<br />
0.40<br />
0.35<br />
0.30<br />
0.25<br />
0.20<br />
0.15<br />
0.10<br />
0.05<br />
0.00<br />
100 150 200 250 300<br />
Radius (um)<br />
t=140 nm, α Mat = 0.5 db/cm<br />
t=140 nm, α Mat = 1.0 db/cm<br />
t=140 nm, α Mat = 2.0 db/cm<br />
t=130 nm, α Mat = 0.5 db/cm<br />
t=130 nm, α Mat = 1.0 db/cm<br />
t=130 nm, α Mat = 2.0 db/cm<br />
Figure 6.7. Port waveguide 180 degree bend losses as a function of the bend radius for a<br />
number of intrinsic waveguide losses (material + scatter loss).<br />
Because the port waveguide has effectively reached its maximum effective refractive<br />
index of ≈1.50 at the dimensions of 0.14 by 2 µm it is not possible to follow the<br />
design strategy given in Figure 3.17 because the Neff cannot be raised without<br />
sacrificing the tolerances in the design. Therefore, the ring resonator for the thermally<br />
tunable resonator building block had to be designed to match the port waveguide<br />
instead of the other way around.
Chapter 6<br />
The most important aspect in the design of the ring resonator was to achieve good<br />
phase matching with the port waveguide. This is important because it allows for more<br />
freedom in the design, due to the fact that a wider range of coupling coefficients is<br />
available. Another strong benefit, as was previously discussed in Chapter 3.5.3, is that<br />
good phase matching can also reduce the sensitivity to an error in the alignment of the<br />
resonator to the port waveguides.<br />
In Figures 6.8a and 6.8b the Neff and bend loss of several resonators, with a width of<br />
2.5 µm and a thickness between 175 and 195 nm are given as a function of the bend<br />
radius. When looking purely at the phase matching and the bend losses the resonator<br />
waveguides with a thickness of 175 nm and a radius of 65 µm would be a good option<br />
as these dimensions allow for ∆Neff 0.012 and a bend loss of ≈2 dB/cm. However, in<br />
the design of the building block it was also important to have a large FSR and<br />
therefore a resonator with a small radius. A resonator with a radius of 50 µm and a<br />
thickness between 180 nm and 190 nm was therefore chosen instead.<br />
Neff<br />
1.53<br />
1.52<br />
1.51<br />
1.50<br />
1.49<br />
40 45 50 55 60 65<br />
Resonator Radius (µm)<br />
t = 175 nm<br />
t = 180 nm<br />
t = 185 nm<br />
t = 190 nm<br />
t= 195 nm<br />
a)<br />
b)<br />
Figure 6.8. Ring resonator effective refractive index a) and bend loss b) as a function of its<br />
radius and thickness.<br />
Amplitude coupling κ<br />
0.8<br />
0.7<br />
0.6<br />
0.5<br />
0.4<br />
0.3<br />
0.2<br />
0.1<br />
0.0<br />
136<br />
Bend loss (dB/cm)<br />
100<br />
0.0 0.5 1.0 1.5 2.0 2.5 3.0 3.5<br />
80<br />
60<br />
40<br />
20<br />
0<br />
Lateral offset (µm)<br />
40 45 50 55 60 65<br />
Ring t=180 nm<br />
Ring t=190 nm<br />
Ring t=200 nm<br />
Resonator Radius (µm)<br />
t = 175 nm<br />
t = 180 nm<br />
t = 185 nm<br />
t = 190 nm<br />
t = 195 nm<br />
Figure 6.9. Amplitude coupling coefficient as a function of the lateral offset s for a resonator<br />
with a thickness of 180, 190 and 200 nm. All resonators have a width of 2.5 µm and a vertical<br />
distance to the port waveguide hsep of 1 µm.<br />
Figure 6.9 shows that for both the 180 nm as well as the 190 nm thick resonator an<br />
amplitude coupling of at least 0.6 can be achieved. This is important since one of the<br />
goals in the design of the building block was to use it for the transmission of 40 Gbit/s<br />
signals which, at a radius of 50 µm, requires a κ of at least 0.4. (As a simplification it
137<br />
Microring-resonator building blocks<br />
is assumed that the maximum capacity of a signal that is sent through the MR is<br />
roughly equivalent to the ∆λFWHM bandwidth of this resonator which, for κ=0.4 is ≈40<br />
GHz. In practice, however, the actual bitrate will also depend on the signaling scheme<br />
that is used.)<br />
For the 180 nm thick resonator a coupling higher than this can be achieved across a<br />
range for the lateral offset of 1.8 µm while this is 1.4 µm for the 190 nm thick<br />
resonator.<br />
Although the usable range of the lateral offset is fairly large for both resonators the<br />
180 nm resonator is the slightly more attractive option since it allows for more<br />
variations of the coupling coefficient, through a variation in the symmetric (lateral)<br />
offset s as discussed in Chapter 5.3.3, to be implemented in the design. Typically<br />
values of s in the range of 1.0 to 2.5 um have been used which, as shown in Figure<br />
6.9, results in a variation of the coupling coefficients of the realized devices between<br />
0.2 and 0.75. In addition the 180 nm resonator is more tolerant to the variations in<br />
width and height that inevitably occur in fabricated devices. For instance, if the<br />
thickness of the 190 nm resonator is increased by 10 nm then the range in which the<br />
coupling of 0.4 can be achieved becomes very small as shown in the figure. When this<br />
is combined with a possible misalignment error then a working device at 40 Gbit/s is<br />
nearly impossible to obtain. Conversely, when the 180 nm waveguide is reduced in<br />
thickness to 170 nm this would increase the bend loss from 10 dB/cm to 34 dB/cm.<br />
Although this does for instance increase the insertion loss from 1.1 dB to 3.1 dB (at<br />
κ=0.5) this is acceptable because the increase of 2 dB is small compared to the total<br />
loss in a device. This loss is typically in excess of 14 dB and is predominantly caused<br />
by the not yet optimized fiber chip coupling losses. For these reasons the 180 nm<br />
resonator was used as the basic resonator in the thermally tunable resonator building<br />
block.<br />
The group index of the resonator waveguide with dimensions of 2 x 0.180 µm is<br />
≈1.747. For the designed resonator with a radius of 50 µm this corresponds to a FSR<br />
of ≈4.37 nm (using eq. 2.21). Although this fits the initial design requirement to have<br />
the largest FSR possible for the resonator, in retrospect a radius of 55 µm would have<br />
been a better choice. At this radius the FSR is 4 nm (500 GHZ) which allows the<br />
resonator to be positioned exactly on the 100 GHz channel grid that has been defined<br />
for the OADM and Router within the Broadband Photonics project.<br />
In addition the stepper lithography used to fabricate these devices makes the majority<br />
of the reasons for designing the port waveguide with the 0.140 x 2 µm dimensions<br />
invalid. This is because of the fact that the stepper can image much smaller features in<br />
a much more controlled manner (i.e. no large variations in width of the waveguides).<br />
It would therefore have been possible to raise the Neff of the port waveguide by going<br />
to narrower and higher waveguides, thus allowing for smaller resonators.<br />
The reason why neither of these design changes were made in the OADM and Router<br />
devices is that, in order to learn from a certain change in the design or fabrication of a<br />
device, the number of changes made in this device should remain small. Doing so<br />
ensures that at least some devices may work or, if no device works, that the problem<br />
can be easily located. Since the OADM and Router were already fabricated in a<br />
process that introduced many changes such as vertical tapers, stepper lithography and<br />
CMP (which already resulted in a large number of problems during the fabrication of<br />
these devices), making further changes to the design of the resonators was considered<br />
to be unwise.
Chapter 6<br />
6.2.3 Chromium heater design<br />
The devices in which the vertically coupled microring resonator building blocks have<br />
been used typically required a tuning range equal to their free spectral range to allow<br />
for the selection of any wavelength within this range. Of all the methods of tuning that<br />
have been discussed in Chapter 2.8 only thermal and mechanical tuning allow for<br />
such large tuning ranges. Of these two methods thermal tuning has been chosen<br />
because of the fact that it is considerably easier to implement than MEMS based<br />
tuning. In addition the telecom devices such as the OADM and the Router that use<br />
these resonators will rarely be reconfigured (change or switch channels) more than a<br />
few times per second (or even in a day). The millisecond switching times offered by<br />
thermal tuning are therefore more than sufficient.<br />
Heaters used on top of optical waveguides generally consists of a thin-film metal<br />
resistor [70] but can also be made using heavily doped poly-silicon [72] for instance.<br />
When designing a heater for a ring resonator the general requirements are the same as<br />
those for heaters used for straight waveguides:<br />
• The use of a heater should not introduce additional losses in the microring<br />
resonator. Since the presence of a metal in the field of a mode introduces very<br />
high losses the heater should be placed outside the field of the propagating<br />
mode. As shown in Figure 6.9 the losses in the resonator start to noticeably<br />
increase below a cladding thickness of 2 µm. With the addition of 1 µm for<br />
safety a cladding thickness of ≈3 µm can then be considered as the minimum<br />
cladding thickness that is required.<br />
Bend loss (dB/cm)<br />
100<br />
80<br />
60<br />
40<br />
20<br />
0<br />
Increase of<br />
loss due to<br />
heater<br />
proximity<br />
1.0 1.5 2.0 2.5 3.0 3.5 4.0<br />
Cladding thickness h rclad +h tclad (µm)<br />
Figure 6.9. Bend losses in a 180 nm thick resonator with a radius of 50 µm as a function of<br />
the total upper cladding thickness.<br />
• The heater should also be low power. This means that the change ∆Neff/∆T<br />
should be as high as possible in order to reduce the power required to induce a<br />
certain change in Neff. The low-power criterion is not of essential importance<br />
in devices consisting of only a few resonators such as for instance a microresonator<br />
based switch. However, it does become an issue in designs of greater<br />
complexity, such as for instance in the WDM router proposed in the<br />
Broadband Photonics project, where multiple resonators need to be tuned<br />
simultaneously. The power dissipated in the heaters can then cause problems,<br />
such as the heating of the device as a whole (requiring temperature<br />
138
139<br />
Microring-resonator building blocks<br />
compensation), or increased requirements for the electronics that drive the<br />
heaters. Also, the effects of thermal crosstalk, which may occur when two or<br />
more devices with heaters are located in close proximity of each other, are<br />
reduced when less power is dissipated in the heaters.<br />
• The thermal tuning should be reasonably fast. Although, as mentioned in the<br />
preceding text, fast tuning is not an absolute requirement it does widen the<br />
application range of a device if it offers faster tuning of switching. Fast tuning,<br />
however, can come at the price of power consumption. A very efficient heater<br />
will most likely use some means, such as for instance trenching, to limit the<br />
flow of heat away from the waveguide that is tuned. Due to this the cool-down<br />
time will also be slower. In the design the need for speed and the low-power<br />
requirements will therefore have to be balanced.<br />
• The heater should be reliable: the heater characteristics should not change over<br />
time. The choice of the heater material is therefore important as it should<br />
allow for high heater temperatures without breaking down and have a good<br />
adhesion to the silicon oxide cladding layer. A material that allows for a<br />
higher heater temperature can also increase the available tuning range.<br />
• In order to achieve a large tuning range and tuning efficiency it is also<br />
important that the heater on top of the heater has a uniform heating<br />
distribution. This is because the heater can only be heated up to a certain<br />
temperature without damage. The hottest locations in the heater therefore<br />
determine the maximum tuning range.<br />
When the heaters were designed the use of a polymer instead of the PECVD and<br />
TEOS SiO2 top cladding was shortly considered due to the high thermo-optic<br />
coefficients found in these materials. Typically, polymers have a thermo-optic<br />
coefficient that is an order of magnitude larger than the thermo-optic coefficient of<br />
silicon oxide or silicon nitride [140]. Since the thermo-optic coefficient of the<br />
cladding material influences the total ∆Neff that may be obtained for a certain heater<br />
temperature, it is therefore worth investigating these materials. The main problem<br />
with the use of polymers as a cladding layer, however, is that they generally exhibit<br />
higher losses than SixOyNz materials. In addition the thermo-optic coefficient of these<br />
materials is negative. When combined with SixOyNz materials that have a positive<br />
thermo-optic coefficient, the changes in the index of the layers may then cancel each<br />
other out, effectively creating a temperature insensitive device.<br />
In order to find the effects of using a polymer for the cladding layer a simulation was<br />
performed in TempSelene [50] using the geometry described in Figure 6.3 where the<br />
PECVD and TEOS oxide cladding were replaced with a PMMA layer (n=1.47). The<br />
heater width used in this simulation was 10 µm. The simulation showed a change in<br />
effective refractive index of approximately -5.4 10 -4 for a heater with a temperature of<br />
100 °C (the silicon substrate, serving as a heatsink, was set at 0 °C in the simulation).<br />
The negative sign shows that the polymer has not only cancelled out the positive<br />
changes in index in the silicon nitride core and oxide substrate, but in fact dominates<br />
the tuning of the effective index of the waveguide. Although the change in Neff is<br />
substantial it was still smaller than the 7.6 10 -4 change that could be obtained using an<br />
oxide cladding. The polymer option was therefore discarded. Even if the polymer<br />
cladding had resulted in a change equal to or slightly higher than that of a silicon<br />
oxide cladding the latter would have been a more favorable option. This is because<br />
most polymers have a low glass transition temperature. (100-160 °C for PMMA).
Chapter 6<br />
Therefore, even if the silicon dioxide had had a lower change in refractive index, this<br />
would have been offset by the larger possible thermal tuning range for this material.<br />
For the actual geometry a number of heater geometries were investigated [141]. This<br />
resulted into two viable heater candidates, shown in Figure 6.10a and 6.10b. Both<br />
heaters geometries have a radius R equal to the radius of the resonator underneath and<br />
a heater width of 10 µm.<br />
R<br />
Figure 6.10. An omega a) and circular b) shaped heater geometry for use on top of a<br />
microring resonator.<br />
The omega shaped heater shown in Figure 6.10a consists of a single metal strip that is<br />
lain out in the shape of the letter Ω. Due to the fact that the strip has a uniform width,<br />
the current that runs though it will heat up the strip to the same temperature in all<br />
locations. Therefore also most of the resonator underneath, except the part underneath<br />
the small gap in the foot of the Ω, will be heated uniformly.<br />
The heating of the resonator underneath the circular heater shown in Figure 6.10b is<br />
less uniform. This is because the circular heater is connected from both sides with<br />
leads that necessarily have to be twice as wide as the rest of the heater in order to<br />
avoid hotspots in the location of the lead connection. Because most of the current in<br />
these locations will flow along the edges of this connection, the center part of the<br />
connection is heated less. This results in an uneven heating of the heater and the<br />
resonator underneath, as is well illustrated by Figure 6.13b. This is especially a<br />
problem when the circular heater is used on top of small resonators, for instance with<br />
a radius of 25 µm. Here the heater connection can cover a large portion of the<br />
resonator. The reduced heating at these locations can then significantly affect the<br />
overall tuning performance of the resonator. For larger resonators, however, this is<br />
less of an issue. In fact, the positioning of the leads makes the circular heater type<br />
more easy to use than the omega heater in certain designs such as the second order<br />
resonator filter that was shown in Figure 5.25 or in the racetrack resonator based<br />
tunable reflector discussed in Section 6.5.<br />
The omega shaped heater is used as the default heater in the resonator building block<br />
design because it is more efficient than the circular heater. One point of concern in the<br />
geometry of this heater, however, is the small gap between the two leads. If this gap is<br />
too small then the heater may malfunction due to dielectric breakdown, causing<br />
sparking between the two leads, when a high voltage is applied to the heater. This can<br />
be avoided by careful design of the gap between the leads, however, which can be<br />
140<br />
R
141<br />
Microring-resonator building blocks<br />
chosen such that the heater will melt long before the dielectric breakdown threshold is<br />
reached. For instance, if a gap of 10 µm is chosen then the dielectric breakdown will<br />
occur at 30 V (the dielectric strength of air is 3 x 10 6 V/m [142] ). At this voltage a<br />
heater with a resistance of 200 Ohm would theoretically dissipate 4.5W. This,<br />
however, is well beyond the point where parts of the heater start to melt.<br />
6.2.4 Heater characterization<br />
Both heater geometries have been implemented using chromium [143]. This material<br />
was chosen for its good adhesion properties to silicon oxide and its high melting point<br />
of 1907 °C. In addition it has a relatively high resistivity of 1.25 10 -7 Ω/m (at 20 °C),<br />
making it a highly suitable material for use as a heater.<br />
Before using the heaters on actual microring resonator devices they were first<br />
fabricated separately, on a test wafer. By testing the maximum allowed heat<br />
dissipation in these heaters before the heaters would be damaged a safe operation<br />
range could be determined to avoid damaging thermally tunable resonator devices in<br />
the future. In addition these heaters were used to determine the temperature dependent<br />
resistance of the heaters. This is useful since it is very difficult to measure the<br />
temperature of the heaters in situ, on top of a resonator. However, because the<br />
resistance of the chromium of the heater changes as a function of its temperature it is<br />
possible to measure the temperature indirectly.<br />
To make this possible the test wafer was first heated indirectly in a controlled fashion<br />
on top of a hot plate, using thermal paste for improved heat conduction. The<br />
temperature of the wafer, and therefore also of the heaters, was measured using an<br />
infrared thermometer.<br />
Simultaneously the resistance of a heater was measured using a multimeter. Figure<br />
6.11 shows the measured change in heater resistance relative, normalized to the<br />
resistance on an unheated heater, as a function of the applied temperature.<br />
Normalized heater resistance<br />
1.14<br />
1.12<br />
1.10<br />
1.08<br />
1.06<br />
1.04<br />
1.02<br />
1.00<br />
0.98<br />
measurement 1<br />
measurement 2<br />
50 100 150 200 250<br />
Temperature ( o C)<br />
Figure 6.11. Normalized change in heater resistance as a function of its temperature.<br />
As shown in the figure, the change in temperature in the first measurement of the<br />
heater is much larger than in the second measurement of the same heater. This change<br />
is due to the passivation of the heater during the first measurement run. After this<br />
initial “burn-in”, however, the heater response is largely stable.
Chapter 6<br />
Next, the heater was heated directly, by connecting it to an adjustable power supply.<br />
The dissipation in and resistance of the heater were determined by measuring the<br />
current through and voltage across the heater. Figure 6.12a shows the measurement<br />
results of several measurement runs performed on the same omega shaped heater with<br />
a radius of 50 µm. As was the case for the indirect heating, the resistivity increases<br />
between the first and the second run due to passivation of the heaters but is then stable<br />
for the subsequent third and fourth runs. In the fourth run the power dissipation in the<br />
heater was increased beyond 300 mW (equivalent to ≈1 mW/µm heater length) at<br />
which a further passivation effect was observed, this time decreasing the resistance as<br />
shown by the fifth measurement run.<br />
Resistance (W)<br />
260<br />
240<br />
220<br />
200<br />
180<br />
run 1<br />
run 2<br />
run 3<br />
run 4<br />
run 5<br />
0 200 400 600 800<br />
Dissipated power (mW)<br />
a)<br />
b)<br />
Figure 6.12. Measured a) and normalized b) heater resistance as a function of the heater<br />
dissipation.<br />
In the fifth run the limits of the heater were tested by increasing the applied voltage<br />
until heater breakdown. Until a dissipation of 500 mW (≈0.63 mW/µm) the heater<br />
showed no signs of breaking down. Beyond this value, however, the resistance was<br />
seen to decrease, resulting in a runaway increase of the heater dissipation until the<br />
heater finally broke down at 870 mW in this case.<br />
Point of failure<br />
142<br />
Normalized heater resistance<br />
1.20<br />
1.15<br />
1.10<br />
1.05<br />
1.00<br />
0.95<br />
0 100 200 300 400 500 600<br />
Dissipated power (mW)<br />
Heating pattern shows<br />
that the current flows<br />
along the edges<br />
a) b)<br />
Figure 6.13. Microscope images of a broken down omega a) and circular b) heater showing<br />
the heat distribution and the points of failure.<br />
All breakdowns in the heaters were the result of single point failures as shown in<br />
Figure 6.13a and 6.13b for the omega and circular heater respectively. These pictures
143<br />
Microring-resonator building blocks<br />
also clearly show the distribution of the heat by means of the discoloration. Using the<br />
data from the thirds and fourth measurement run the plot in Figure 6.12b was<br />
compiled. This plot shows the normalized heater resistance as a function of the<br />
dissipated power in the heater. By finally combining the data in this plot with the<br />
measurement data given earlier in Figure 6.11 the plot in Figure 6.14 can drawn,<br />
which gives a rough estimate of the temperature of the heater as a function of the<br />
dissipated power.<br />
Temperature ( o C)<br />
300<br />
250<br />
200<br />
150<br />
100<br />
50<br />
0<br />
From measurement<br />
Fit<br />
0 50 100 150 200 250 300 350<br />
Dissipated power (mW)<br />
Figure 6.14. Temperature in the measured heater as a function of the power dissipation in<br />
the heater.<br />
A fit to the curve in this figure gives a temperature dependence of ≈0.79 K/mW for<br />
this heater. Therefore, using the ∆Neff/∆T of ≈7.6 10 -6 K -1 calculated for the resonator<br />
waveguide in the preceding section, the tuning of the effective refractive index of the<br />
waveguide resonator can be predicted to be 6.0 10 -6 mW -1 . This, using Equations 2.11<br />
and 2.41, corresponds to a shift in resonance frequency of. 6.1 pm/mW
Chapter 6<br />
6.3 Characterization of single, vertically coupled microring<br />
resonators<br />
Apart from the resonator building block of which the design was described in the<br />
preceding section other vertically coupled microring resonators, with for instance a<br />
different radius or cladding thickness, have also been realized. In this section several<br />
measurements performed on these devices will be presented. These measurements<br />
were specifically chosen to illustrate certain important or interesting aspects in the<br />
design and application of the resonator:<br />
• The importance of phase matching and the ability to identify a misalignment<br />
of the resonator through extraction of the basic parameters from the resonator<br />
measurements.<br />
• The effect of cladding layer thickness on the heater efficiency and a method to<br />
improve the thermal tuning speed.<br />
First, however, the measurement setups used to perform these measurements will be<br />
discussed.<br />
6.3.1 Measurement setup<br />
The lens setup shown in Figure 6.15 is mainly used for “difficult devices” i.e. those<br />
devices that are hard to couple into. This may for instance occur for experimental<br />
devices where no tapers have been added or in devices that have damage facets. By<br />
choosing the right input objective it is then often still possible to characterize the<br />
device.<br />
Figure 6.15. Measurement setup for the characterization of optical devices using lenses.<br />
For the characterization of a device first a HeNe laser is used to align the sample. A<br />
switch is then made to a Hewlett Packard 8168C tunable laser, with a maximum<br />
resolution of 1 pm, to perform the actual measurement. The light from the lasers is<br />
first polarized and then focused on the input facet of the devices using a 40x<br />
objective. The light at the output facet is collected using a 20x objective and focused<br />
144
145<br />
Microring-resonator building blocks<br />
on a 50 µm wide multi mode fiber. The light is then measured using a HP 81521B<br />
photo-detector.<br />
Aside from the measurements with the tunable laser this setup was also used in<br />
combination with a Sensors Unlimited 320 MX-1.7 RT infrared camera. The camera<br />
provides unique information that cannot be obtained through other means, e.g. by<br />
measuring the different ports of a device. Figure 6.16a and 6.16b for instance, show<br />
an infrared image of a cross coupled microring resonator. The orientation and heater<br />
placement in these images is similar to that of the resonator shown in Figure 6.3b. In<br />
Figure 6.16a the resonator is off-resonance. Most of the light propagates past the<br />
resonator to the through port and only a minor fraction of the light is coupled into the<br />
drop port.<br />
In In<br />
Through<br />
Drop<br />
Through<br />
Drop<br />
Figure 6.16. Infrared image (inverted) of a vertically coupled resonator in the off a) and onresonance<br />
b) state.<br />
In Figure 6.16b where the resonator is in the on-resonance state the reverse can be<br />
seen. Most of the light propagates through the resonator to the drop port and only a<br />
minor fraction of the light is present in the through port. Of special interest in this<br />
image is the “scatter” point that appears near the input (pointed to by the diagonal<br />
arrow). This point is only seen when the resonator is in resonance and is caused by<br />
light that radiates out of the resonator and then hits the port waveguide where it<br />
scatters to all directions. Another scatter point, seen in both images, is located at the<br />
crossing between the two waveguides.<br />
Although the lens setup is highly useful for the measurement of devices that would<br />
otherwise be difficult to characterize, the adjustment of the lenses to off-axis port<br />
waveguides, i.e. waveguides that are not in the same line from input to output, can be<br />
quite difficult. Also it is not possible to measure an output port that is on the same<br />
side as the input. In these cases or when devices are relatively easy to measure then it<br />
is useful to use a fiber setup as shown in Figure 6.17a. This setup can be equipped<br />
with single fibers or fiber arrays which are relatively easy to align to port waveguides,<br />
thereby speeding up the measurements. Also, the fiber arrays make it possible to<br />
measure ports that are on the same side of a device. Where possible small core fibers<br />
have been used to coupled light into the devices in order to reduce the fiber-chip<br />
coupling loss. The setup, of which a photograph is shown in Figure 6.17b, uses a<br />
HeNe laser for the alignment of the fibers to the port waveguides. Two laser sources<br />
have been used in this setup, depending on the resolution required. The previously<br />
mentioned tunable laser source in combination with the power meter is used for slow<br />
but high resolution measurements down to 1 pm. The Erbium Doped Fiber Amplifier<br />
with Amplified Spontaneous Emission Source (EDFA ASE) in combination with an<br />
Optical Spectrum Analyzer (OSA) on the other hand is used for near real-time<br />
measurements with a resolution down to 100 pm. On the input port of the device a
Chapter 6<br />
polarization maintaining fiber (PMF) is used in combination with a polarization filter<br />
to ensure that only one polarization is coupled into the device. This, however, was<br />
only a requirement for devices with a port waveguide that allows, besides the TE, the<br />
propagation of the TM mode, either by design or due to enlargement of the waveguide<br />
during fabrication. For devices where the design did not allow for the propagation of<br />
the TM mode and where the fabrication process was more tightly controlled, such as<br />
in the OADM and the λ-Router, no polarizer was required.<br />
a)<br />
b)<br />
Figure 6.17. Measurement setup for the characterization of optical devices using fiber buttcoupling<br />
a). The photograph b) shows the part of the setup with the piezo-actuated alignment<br />
stages. An optical chip is placed on the stage in the middle.<br />
146<br />
Optical chip
147<br />
Microring-resonator building blocks<br />
6.3.2 The importance of phase-matching and the fitting of<br />
resonator responses<br />
In Figure 6.18 the shift in the through response of a resonator is shown as a function<br />
of the applied heater voltage. This measurement was of one of the very first tunable<br />
microring resonators to be realized, in the first year (2002) of the NAIS project. The<br />
Si3N4 resonator had a radius of 25 µm and bend waveguide dimensions of 2.5 x 0.3<br />
µm, giving it a Neff of ≈1.58. The resonator combined with the standard Si3N4 port<br />
waveguide measuring 2 x 0.14 µm.<br />
Although these measurements conclusively showed that an omega heater on top of a<br />
resonator could be used to tune the resonance frequency, the performance of the<br />
resonator was very poor in all other respects. The main reason for the poor<br />
performance of this device was the phase mismatch of ≈0.08 between the ring<br />
resonator and port waveguides. Although the importance of phase matching was<br />
known at the time, its effects on the coupling coefficients could not yet be quantified<br />
due to the lack of suitable simulation software. Hence it was not foreseen that such a<br />
phase mismatch would for these resonators result in a maximum coupling coefficient<br />
well below 0.1, as was shown by simulations performed at a later stage. Due to the<br />
bend loss of ≈ 10 dB/cm in these resonators it was therefore not possible to achieve a<br />
power extraction of more than ≈0.3 at resonance.<br />
Through port power a.u.<br />
1.1<br />
1.0<br />
0.9<br />
0.8<br />
0.7<br />
0.6<br />
0 V<br />
1.01 V<br />
1.98 V<br />
3.02 V<br />
3.95 V<br />
1561 1562 1563 1564 1565 1566 1567 1568<br />
Wavelength (nm)<br />
Figure 6.18. A tuning measurement performed on one of the very first tunable microring<br />
resonator in the NAIS project. The resonance wavelength in the through responses shifts as a<br />
function of the applied heater voltage<br />
The significance of phase matching became fully clear when a resonator that was<br />
fabricated using the same design was accidentally fabricated with a resonator<br />
waveguide thickness of only 200 nm. Although this increased the bend loss to ≈200<br />
dB/cm, corresponding to a roundtrip loss of 3.1 dB, it also decreased the phase<br />
mismatch to ≈0.006. The high coupling coefficients that this phase matching allowed<br />
could fully compensate for the high losses, making it possible to achieve through and<br />
drop responses with a depth up to 14 and 12 dB respectively. These measured<br />
responses, plotted as a function of the port waveguide offset s, are given in Figure<br />
6.19. All these measurements were taken from devices in the same device group, of<br />
which the mask design is shown in Figure 6.20. Therefore the (mis)alignment of all
Chapter 6<br />
the resonators in this group is identical and it becomes possible to not only determine<br />
the resonator parameters κ1, κ2 and αdB for a given response but also its alignment.<br />
Normalized drop response (dB)<br />
Normalized through response (dB)<br />
0<br />
-2<br />
-4<br />
-6<br />
-8<br />
-10<br />
-12<br />
-14<br />
-16<br />
0<br />
-2<br />
-4<br />
-6<br />
-8<br />
-10<br />
-12<br />
-14<br />
1542 1544 1546 1548 1550 1552 1554 1556 1558<br />
Wavelength (nm)<br />
s = 0<br />
s = 0.4<br />
s = 0.8<br />
s = 1.2<br />
s = 1.6<br />
148<br />
s = 0<br />
s = 0.4<br />
s = 0.8<br />
s = 1.2<br />
s = 1.6<br />
-16<br />
1542 1544 1546 1548 1550 1552 1554 1556 1558<br />
Wavelength (nm)<br />
Figure 6.19. Through (bottom) and drop (top) response<br />
as a function of the port waveguide offset s for a Si3N4<br />
microring resonator with a radius of 25 µm.<br />
Coupling coefficient κ 2<br />
0.8<br />
0.6<br />
0.4<br />
0.2<br />
0.0<br />
2 κ1 2<br />
κ2 @ 100 dB/cm<br />
2<br />
κ2 @ 140 dB/cm<br />
2<br />
κ2 @ 185 dB/cm<br />
0.0 0.4 0.8 1.2 1.6 2.0<br />
Heater +heater pads<br />
Figure 6.20. Mask layout of the<br />
group of resonators that was<br />
measured.<br />
Offset s (µm)<br />
a) b)<br />
Figure 6.21. Fitted coupling coefficients κ1 and κ2 (κ1≠κ2) as a function of the offset s of the<br />
fabricated resonator (that has a misalignment) a). In b) the coupling coefficients of a simulated<br />
resonator have been calculated as a function of the offset s for a resonator that is perfectly<br />
aligned (κ1=κ2). The arrows indicate offset positions that are roughly equivalent in the fabricated<br />
and simulated resonators.
149<br />
Microring-resonator building blocks<br />
In Figure 6.21a the values of the coupling coefficients κ1 and κ2 are given as a<br />
function of the port waveguide offset s. To obtain these values the DropZone tool was<br />
used to solve Equations 4.22 and 4.23. As was previously discussed in Chapter 4.4,<br />
only κ1 can be determined directly. In order to determine the other coupling constant,<br />
κ2, an estimate of the losses has to be made. Using the Selene mode solver these losses<br />
were determined to be 200 dB/cm. However, when fitting the responses for the offset<br />
of 1.6 µm, the maximum limit for the loss is 185 dB/cm because κ2 then becomes<br />
zero. Therefore the actual losses have to be at least below 185 dB/cm but, considering<br />
the Selene simulation results, probably not far below that value. Figure 6.21a shows<br />
the fitted values of κ2 for the maximum loss of 185 dB/cm as well as for two lower<br />
bend losses of 140 and 100 dB/cm. As can be seen in the figure, there is a spread of<br />
0.3 in the values of κ2 at s=1.6 µm. However, at s=0 µm there is a convergence for all<br />
bend losses to a value of ≈0.7, making the uncertainty in the fitted value κ2 less for<br />
this offset.<br />
Interestingly, the maximum values of κ1 and κ2 are not equal, as might be expected<br />
based on resonator symmetry, but show values of 0.5 and 0.7 respectively. In fact, the<br />
maximum of κ2 is likely to be even higher for a negative offset but no resonators with<br />
that offset were available. The difference can be explained by examining the CMT<br />
simulations of this resonator shown Figure 6.21b where the coupling coefficient is<br />
plotted as a function of the offset s and the thickness of the separation layer hsep.<br />
These simulations show that when to coupling between the resonator and port<br />
waveguides is very high, which in these simulations occurs for h=0.8 µm, there can be<br />
more than one maximum. The reason for this is that within a certain range of offsets<br />
the coupling length is so long that part of the power is coupled back into the port<br />
waveguide. Although this effect is seen only for a thickness of 0.8 µm in the<br />
simulations and the thickness of the separation layer in the fabricated device was 1.0<br />
µm, neither the device not the simulations are perfect. For the fabricated device there<br />
will always be a variation in thickness and, since many approximations are used in the<br />
CMT simulation tool, coupling coefficients predicted by the simulation also been seen<br />
as an indication rather than solid fact. Keeping this in mind it is then possible to<br />
estimate the offset of the resonator from the measurement data. Assuming that the<br />
maximum in the curve of κ2 at s=0 µm corresponds to the simulated offset of 2 µm<br />
and that the maximum of κ1 at s=0.8 µm corresponds to the simulated offset of -3 µm<br />
as indicated by the arrows, then the misalignment can be estimated to be ≈2.1 µm<br />
towards the second coupler. To give a better idea of this misalignment it is illustrated<br />
by the drawing in Figure 6.22. For reference the arrows indicate the positive axis of<br />
all parameters.<br />
Figure 6.22. Exaggerated drawing of a resonator with a misalignment of 2.1 and an offset<br />
s=0 for both port waveguides.
Chapter 6<br />
Although the fitted coupling coefficients seem to indicate a shift of 2.1 µm, this could<br />
not be verified due to the heaters on top of the resonators (removal of the heaters was<br />
not an option). This was partly the reason why later microring resonator based devices<br />
also included alignment marker structures like those shown in Figures 6.2 and 6.3.<br />
Apart from being able to determine the coupling coefficients and resonator alignment<br />
from measurements shown in Figure 6.19, these measurements also give information<br />
about how similar the dimensions of the resonators on a given wafer are. By<br />
comparing the resonance frequencies of the resonators it is possible to determine the<br />
differences in ng or the radius between the resonators using:<br />
∆ R ⋅ ∆n<br />
g<br />
∆<br />
=<br />
⋅ R ⋅ n<br />
λ<br />
λ g<br />
150<br />
(6.1)<br />
For the given through and drop responses the maximum resonance shift ∆λ is 0.75<br />
nm. If it is assumed, for simplicity, that this shift is caused entirely by a variation in<br />
the radius of the resonator then this shift corresponds to a change in radius of only 21<br />
nm. Considering that the maximum on-chip distance between the measured resonators<br />
was almost 0.8 mm this value indicates a very high uniformity in the fabrication<br />
process. This result was in fact quite surprising since these particular devices had<br />
resonators with considerable roughness as shown in Figure 6.23. It is suspected,<br />
however, that although the localized roughness can be quite considerable, this<br />
roughness averages out on the scale of the circumference of the resonator.<br />
Figure 6.23. Part of a ring resonator, showing a considerable waveguide roughness.
151<br />
Microring-resonator building blocks<br />
6.3.3 Microring resonator thermal tuning and modulation frequency<br />
A number of measurements have been made to investigate the resonance tuning as a<br />
function of the applied heater power for different types of tunable resonator<br />
geometries. The results of these measurements have been summarized in Figure 6.24.<br />
For the resonator with a 25 µm radius and a top cladding of 3 µm, of which the tuning<br />
measurements were presented earlier in Figure 6.18, the shift in the resonance<br />
wavelength is approximately 21 pm/mW. In Figure 6.25 the tuning of a 200 nm thick<br />
resonator, which was also discussed in the previous section, is shown. This resonator<br />
was fabricated with a slightly thicker cladding layer of 4 µm. Because of this the<br />
tuning of the resonance wavelength of this resonator was reduced to 16 pm/mW.<br />
Resonant Peak shift (nm)<br />
4<br />
3<br />
2<br />
1<br />
0<br />
0 100 200 300 400<br />
Power (mW)<br />
R= 50 µm, cladding = 3 µm<br />
R= 25 µm, cladding = 3 µm<br />
R= 25 µm, cladding = 4 µm<br />
R= 50 µm, cladding = 4 µm<br />
Figure 6.24. Resonance shift versus heater<br />
power dissipation for four different<br />
resonators.<br />
Normalized through response (dB)<br />
0<br />
-2<br />
-4<br />
-6<br />
-8<br />
-10<br />
-12<br />
-14<br />
0 mW<br />
76 mW<br />
168 mW<br />
1542 1544 1546 1548 1550 1552 1554 1556 1558<br />
Wavelength (nm)<br />
Figure 6.25. Tuning of the through port<br />
response of an MR with a 25 µm radius and a<br />
top cladding of 4 µm.<br />
According to Equation 2.41 the only factor that determines the tuning is the change in<br />
effective index that can be achieved by the tuning method that is used. In the case of<br />
thermal tuning the change in the resonance frequency is therefore dependent on the<br />
power density in the heater and not on the overall power that is dissipated. This means<br />
that for an omega heater that is twice as long, twice as much power will be dissipated<br />
to achieve the same shift in resonance frequency.<br />
Normalized drop response (dB)<br />
0<br />
-2<br />
-4<br />
-6<br />
-8<br />
-10<br />
-12<br />
-14<br />
-16<br />
-18<br />
0 mW<br />
39 mW<br />
68 mW<br />
106 mW<br />
145 mW<br />
1546 1548 1550<br />
Wavelength (nm)<br />
1552 1554<br />
Figure 6.26. Tuning of the drop port<br />
response of an MR with a 50 µm radius and a<br />
top cladding of 3 µm.<br />
Normalized through response (dB)<br />
0<br />
-2<br />
-4<br />
-6<br />
-8<br />
-10<br />
-12<br />
-14<br />
-16<br />
0 mW<br />
-18<br />
-20<br />
173 mW<br />
296 mW<br />
1546 1548 1550 1552 1554<br />
Wavelength (nm)<br />
Figure 6.27. Tuning of the through port<br />
response of an MR with a 50 µm radius and a<br />
top cladding of 4 µm.<br />
This was verified by the measurements given in Figures 6.26 and 6.27. The first<br />
figure shows the tuning of the drop response of a resonator with a radius of 50 µm and
Chapter 6<br />
a cladding thickness of 3 µm. The shift in the resonance frequency is 10 pm/mW for<br />
this resonator which is about half the shift that was found for the resonator with a<br />
radius of 25 µm. The second figure shows the shift in the through response of the<br />
same resonator with a cladding thickness of 4 µm. In this case a shift of 7 pm/mW<br />
was found which is almost half the shift obtained for the 25 µm resonator. This value<br />
is also very close to the value of 6.1 pm/mW that was predicted for this resonator in<br />
Section 6.2.4.<br />
Besides the tuning efficiency and the tuning range, which was more than 4.3 nm for<br />
all these resonators, the maximum thermal modulation frequency was also analyzed<br />
[75]. Typically, thermal modulation is limited by the heat capacity and thermal<br />
resistance of the layers that make up the device: the lower the resistance and heat<br />
capacity, the faster the modulation will be. In the microring resonator geometries that<br />
have been discussed the heater is placed at a small distance of 3 to 4 µm from the<br />
waveguide. Therefore, even though the thermal conductivity of the SiO2 is only 1.4<br />
Wm -1 K -1 , the waveguide can be heated quite rapidly. Likewise the silicon substrate<br />
allows for a fast cooling of the waveguide due to its very high conductivity of 150<br />
Wm -1 K -1 .<br />
It is possible to maximize the modulation frequency by decreasing the thickness of the<br />
various layers so that the heat is transferred as fast as possible or to choose layers with<br />
a high thermal conductivity. However, decreasing the layer thickness is often not an<br />
option due to leakage of the light in the waveguides to the heater or the silicon<br />
substrate and suitable optical materials with a higher conductivity are most likely not<br />
available. Even if such materials can be found they might still not be desirable<br />
because the increased conductivity would decrease the heater efficiency.<br />
Another, more suitable, method of increasing the modulation frequency is to drive the<br />
heater with an overshoot in the modulation signal. The principle behind the overshoot<br />
is that a high voltage burst, that would otherwise damage the device if used for a<br />
prolonged time, is used for a short period on the rising flank of the drive signal. This<br />
allows the heater temperature to increase more rapidly without damaging it because<br />
the overshoot can be proportioned such that the maximum temperature in the heater<br />
does not rise above the temperature that would have occurred for a normal, square<br />
wave, signal.<br />
Heater drive signal (a.u.)<br />
Square wave drive signal<br />
Drive signal with overshoot<br />
-4 -2 0<br />
Time (ms)<br />
2<br />
Figure 6.28. A normal rectangular drive signal<br />
and a signal containing an overshoot on the<br />
rising flank.<br />
152<br />
Optical modulation (a.u.)<br />
Response to square wave<br />
Response to overshoot<br />
-4 -3 -2 -1 0 1 2 3<br />
Time (ms)<br />
Figure 6.29. Optical modulation measured for<br />
the rectangular drive signal and the signal with<br />
an overshoot.
153<br />
Microring-resonator building blocks<br />
In Figure 6.28 the square wave signal and the signal with the overshoot are shown.<br />
Both signals have a frequency of 500 Hz. In Figure 6.29 the corresponding optical<br />
responses are given. As can be seen the rising flank of the response created using the<br />
overshoot in the drive signal is much steeper. The rise time has decreased from 0.93<br />
to 0.54 ms., an improvement of 42%. In addition the drive voltage after the initial<br />
peak can be much lower, although the same modulation depth is reached which leads<br />
to a 44% improvement in the power consumption.<br />
Besides increasing the rise time it is also possible to decrease the fall time. This<br />
requires a biased drive signal as shown in Figure 6.30. This bias makes it possible to<br />
also have an overshoot on the falling edge of the modulation signal. As can be seen in<br />
Figure 6.31 this can decrease the fall time quite significantly.<br />
Heater drive signal (a.u.)<br />
Square wave drive signal<br />
Drive signal with overshoot<br />
-4 -3 -2 -1<br />
Time (ms)<br />
0 1 2<br />
Figure 6.30. A normal rectangular drive<br />
signal and a biased drive signal containing an<br />
overshoot on the rising flank and falling flank.<br />
Optical modulation (a.u.)<br />
Response to square wave<br />
Response to overshoot<br />
-4 -3 -2 -1<br />
Time (ms)<br />
0 1 2<br />
Figure 6.31. Optical modulation measured<br />
for the rectangular drive signal and the<br />
biased signal with an overshoot.<br />
In fact, by optimizing the overshoots and the bias voltage of the drive signal it was<br />
possible to increase the modulation frequency to 10 kHz, as shown in Figure 6.32.<br />
Heater drive signal (a.u.)<br />
-0.1 0.0<br />
Time (ms)<br />
0.1 0.2<br />
-0.1 0.0 0.1 0.2<br />
Time (ms)<br />
a)<br />
b)<br />
Figure 6.32. Heater drive signal a) and the measured optical modulation for this signal b).<br />
Optical modulation (a.u.)
Chapter 6<br />
6.4 A wavelength selective optical switch based on microring<br />
resonators<br />
The vertically coupled microring resonator building block with a radius of 50 µm has<br />
been used to implement a number of different devices. The simplest of these devices<br />
is the wavelength selective optical switch. As was shown in Figure 6.1 this switch can<br />
for instance be used as part of a channel selection array in a transceiver.<br />
The switch is based on the first order resonator cascade filter comprised of two<br />
resonators that was discussed in Chapter 2.6. The first resonator of the switch, which<br />
is shown in Figure 6.33a, is used to select a certain wavelength channel from a WDM<br />
input signal and drop it to the waveguide between the resonators. If the resonant<br />
wavelength of the second resonator matches that of the first, the signal on the channel<br />
will be transported to the drop port of the switch. The switch is then in the “on” state.<br />
However, if the resonance frequencies are shifted with respect to each other then less<br />
power will be dropped. The least power is dropped when the shift between the<br />
resonance frequencies is equal to half the FSR of the resonator. The switch is then in<br />
the “off” state. The “on”, “off” responses of the switch as well the response for an<br />
intermediate state, where the shift ∆λ between the resonances is ≈1.46, are given in<br />
Figure 6.33b.<br />
Power dropped by the switch (dB)<br />
-30<br />
1547 1548 1549 1550 1551<br />
a)<br />
b)<br />
Figure 6.33. Schematic drawing of an MR based switch a) and simulated responses for this<br />
switch b).<br />
6.4.1 Switch design<br />
0<br />
-5<br />
-10<br />
-15<br />
-20<br />
-25<br />
154<br />
Switch "on"<br />
Almost off<br />
Switch "off"<br />
Wavelength (nm)<br />
The filter rejection ratio SRR which was discussed in Chapter 2.5 is an important<br />
parameter for the switch since the difference between the “on” and “off” state of the<br />
switch is equal to the SRR of the first resonator in the switch. Increasing this<br />
parameter, for instance by lowering the coupling coefficients, will therefore improve<br />
the “on/off” attenuation of the switch. Lowering the coupling will also increase the<br />
steepness of the response. This is beneficial to the power consumption of the device<br />
since it reduces the shift in the resonance wavelength that is required to reach a<br />
certain “on/off” attenuation. There is, however, a trade-off to be made since lower<br />
coupling will also reduce the bandwidth of the switch. In addition it has to be taken<br />
into account that the bandwidth of two cascaded resonators combined will be<br />
approximately ≈0.7 [149] of the bandwidth of a single resonator.
155<br />
Microring-resonator building blocks<br />
In Figure 3.34 the filter bandwidth is given as a function of the “on/off” attenuation<br />
for a number of effective radii (R.ng). The values were calculated using Equation 2.31<br />
and multiplying the results with ≈0.7.<br />
Switch bandwidth (GHz)<br />
250<br />
225<br />
200<br />
175<br />
150<br />
125<br />
100<br />
75<br />
50<br />
25<br />
0<br />
5 10 15 20 25 30 35 40<br />
"On/Off" switch attenuation (dB)<br />
20 µm<br />
50 µm<br />
75 µm<br />
100 µm<br />
Figure 6.34. Maximum achievable bandwidth as a function of the switch “On/Off” attenuation<br />
for a number of effective radii (simulated for λ0=1550nm)<br />
For the design of the MR based switch the goal was to have a -3 dB band width of 50<br />
GHz. The switch was based on the “standard” building block with the parameters as<br />
described in Table 6.1. The resonator in the building block has an effective radius of<br />
≈87 µm. Therefore the maximum “on/off” attenuation is ≈12 dB. If it is assumed that<br />
the bend loss in the resonator is 10 dB/cm, then field coupling coefficients of ≈0.6 are<br />
required.<br />
6.4.2 Characterization<br />
The switch was fabricated using the “Vertical I” fabrication process that was<br />
discussed in Chapter 5. A photograph of the realized switch is shown in Figure 6.35a.<br />
The size of the switch is about 200 x 200 µm excluding the heaters. The measured<br />
responses for the “on” and “off” state of the switch are given in Figure 6.35b.<br />
To switch the device off, 225 mW was dissipated in the heater of the first resonator<br />
which was used for the tuning. For the observed shift in the resonance frequency of<br />
1.46 nm this implies a tuning of 6.5 pm/mW, which is close to the value predicted for<br />
these resonators. A comparison with the simulated curve in Figure 6.33b which was<br />
also shifted by 1.46 nm shows that the simulated and measured values look very<br />
similar apart from a difference in the insertion loss.<br />
The responses have been normalized to the measured power in the through port while<br />
the switch was in the “off” state. The responses therefore also show the drop-port<br />
insertion loss. The “on/off” attenuation of the switch is 12 dB. When the switch is<br />
“on” the crosstalk with the adjacent channels is ≈-20 dB (channel spacing of 0.8 nm).<br />
The on chip insertion loss of the switch is around 5 dB. Using the DropZone tool the<br />
bend loss and coupling coefficients were determined to be in the order of 44 dB/cm<br />
and 0.54 respectively. For these parameters the insertion loss of a single resonator can<br />
be calculated to be about 3.2 dB which fits quite well with the 6 dB measured for the<br />
two resonators combined.
Chapter 6<br />
A possible explanation for the considerable bend losses might be sought in a resonator<br />
waveguide that either has a lot of roughness or has been fabricated too thin. More<br />
likely, however, these losses are due to the “lifting” of the resonator in the coupling<br />
region as is shown in Figure 3.36 for a different resonator. Here the required modal<br />
adjustment can cause significant losses.<br />
Dropped power (dB)<br />
a)<br />
b)<br />
Figure 6.35. Microscope image of a realized switch a) and the “on” and “off” responses b)<br />
measured for this device.<br />
156<br />
0<br />
-5<br />
-10<br />
-15<br />
-20<br />
-25<br />
-30<br />
-35<br />
1548 1549 1550 1551 1552 1553<br />
Wavelength (nm)<br />
Figure 6.36. The lifting of the resonator in the coupling region due to the waveguide<br />
underneath. This lifting can increase the losses considerably.<br />
6.4.3 Vernier switch<br />
“Lifted” resonator<br />
Port waveguide<br />
One of the problems of the presented switch is that the 12 dB “on/off” attenuation is<br />
too low for practical applications. As shown in Figure 6.34, however, nothing can be<br />
done about this for the given configuration. The only possible solutions are then to<br />
decrease the radius, which is not possible for this resonator, or go to higher order<br />
filters [53-68]. Another problem is that the free spectral range of 4.2 nm of the switch
157<br />
Microring-resonator building blocks<br />
is also limited. By introducing the Vernier effect as was discussed in Chapter 2.7,<br />
however, the FSR can be increased significantly. In order to test this, a switch-like<br />
device was fabricated with two different resonators. The resonators in this device,<br />
which is shown in Figure 6.37a have a radius of 46 µm and 55 µm. This corresponds<br />
to a FSR of 4.66 and 4 nm respectively. The combined FSR, which can be calculated<br />
using Equation (2.36) is therefore ≈28 µm. The measurement of the drop response of<br />
this Vernier switch shows that this FSR was indeed obtained. Although this Vernier<br />
resonator is clearly not state-of-the-art it clearly demonstrates the problem of the side-<br />
lobes that typically occurs for Vernier-type devices. These side-lobes that are<br />
typically close to the main resonance peak can significantly interfere with device<br />
operation if, for instance, adjacent channels of a certain wavelength band are also<br />
dropped to a certain extent.<br />
a)<br />
Dropped power (a.u.)<br />
1.0<br />
0.8<br />
0.6<br />
0.4<br />
0.2<br />
0.0<br />
FSR = 28 nm<br />
side lobes<br />
1520 1525 1530 1535 1540 1545 1550 1555 1560<br />
Wavelength<br />
Figure 6.37. Realized Vernier resonator comprised of two microring resonators with a radius<br />
of 46 and 55 µm. The drop measured response b) has a FSR of 28 nm.<br />
b)
Chapter 7<br />
Densely integrated devices for WDM-PON<br />
In this chapter the design and characterization of two types of<br />
optical add-drop multiplexer and a λ-router are discussed.<br />
These devices combine a large functionality with a small<br />
footprint and are therefore promising candidates for making<br />
WDM-PON networks more cost-effective.
Chapter 7<br />
7.1 Introduction<br />
In Chapter 1 the WDM-PON was introduced as a possible successor of traditional<br />
passive optical networks. In a traditional PON, as shown in Figure 7.1, only two<br />
wavelengths are used to transport data. This severely limits the bandwidth available to<br />
each user because the information going to- and coming from multiple users has to be<br />
multiplexed onto a single wavelength. Another problem is that when the network is<br />
upgraded, it is likely that all connected users have to upgrade as well because they all<br />
share the same wavelength channels.<br />
Head Office<br />
OLT<br />
Figure 7.1. Traditional PON architecture.<br />
A WDM-PON uses multiple wavelengths, as shown in Figure 7.2. Since the network<br />
is still based on a passive splitter all users receive the downstream wavelengths.<br />
However, the ONUs at the user’s premises can now filter out a specific wavelength<br />
with a service for which they have a subscription. This allows the provider to run<br />
many services, for instance providing different bandwidths, side by side. In addition,<br />
if an upgrade is required, this can be run on a different wavelength to which the users<br />
can then migrate gradually.<br />
Head Office<br />
OLT<br />
λ1<br />
λ2<br />
λ1, λ2, λ3<br />
λ1, λ2, λ3<br />
λx ,λy ,λz<br />
λ1 λ2<br />
Figure 7.2. WDM PON architecture using a passive splitter (for use with the NAIS<br />
transceiver).<br />
λ2<br />
λz<br />
The WDM-PON therefore has the potential to be more cost effective than the<br />
traditional PON. Currently, however, the cost of the required optical components is<br />
one of the factors limiting the adoption of the WDM-PON. This is especially true for<br />
the ONUs for which the cost cannot be shared amongst multiple users. The WDM-<br />
PON ONUs can be very expensive because they have to be able to receive and send<br />
data in multiple wavelengths which requires optical filtering and a tunable laser<br />
160<br />
λ1<br />
λx<br />
λ1<br />
λ2<br />
λ1, λ2, λ3<br />
λ1, λ2, λ3<br />
λy
Densely integrated devices for WDM-PON<br />
source. The NAIS and Broadband Photonics projects, within which the work<br />
presented in this thesis was carried out, have in common that they both approach the<br />
problem of cost (amongst other issues) through the miniaturization and integration of<br />
the required network components. The approach to the actual implementation of the<br />
ONUs, however, is quite different, even though both are intended for the WDM-PON,<br />
and has implications for the rest of the components in the network.<br />
The transceiver at the ONU proposed in the NAIS project takes an active approach.<br />
Each user receives all downstream channels as shown in Figure 7.2. From these<br />
channels a single channel is then selected. For the upstream signal a single<br />
wavelength channel is used which has to be set explicitly (by the user or the Head<br />
Office H.O.), through the hardware configuration of the transceiver. The light of the<br />
required wavelength for this channel is then generated on chip, by spectral slicing of a<br />
broadband source. This has the advantage that old PON networks are easily upgraded<br />
because the passive splitters can still be used.<br />
The Broadband Photonics project on the other hand has a semi-passive approach<br />
using colorless transceivers. From the head-office each ONU transceiver receives two<br />
paired wavelength channels. One channel contains the downstream data signal while<br />
the other is a continuous wave (CW) signal which is amplified (using a SOA),<br />
modulated and returned as the up stream data signal as is shown in Figure 7.3.<br />
Head Office<br />
OLT<br />
λ1, λ3, λ5<br />
λ1, λ2<br />
λ2 ,λ4 ,λ6<br />
Figure 7.3. WDM PON architecture using a wavelength filter (AWG, OADM etc.) in<br />
combination with reflective SOA transceivers.<br />
λ6<br />
The main advantage of this is that the wavelength can be changed transparently,<br />
without the need to reconfigure the transceiver because the transceiver will modulate<br />
and reflect any wavelength that is sent down stream (with the exception of the<br />
designated downstream wavelengths). This also poses a problem, however, since each<br />
transceiver should receive no more than two wavelengths which is not possible when<br />
passive splitters are used.<br />
In order to send only specific channels to a transceiver the Broadband Photonics<br />
network therefore uses reconfigurable optical λ-routers instead of the passive splitters<br />
(in the strictest sense of the word this network is no longer a PON network but is<br />
nonetheless regarded as such in the following text). These optical routers are useful<br />
for several reasons. First of all only those channels that are used by a specific user are<br />
sent to that user. This is not only a requirement for the use of the colorless transceiver<br />
but it also improves the power budget since no power is wasted in sending a signal to<br />
a user that does not require it. It is also beneficial to the network security as a whole<br />
since it is more difficult if not impossible for users to “eavesdrop” on signals destined<br />
for other users. Another important reason is the fact that, since the device can be<br />
reconfigured, the network can be better balanced. It is for instance possible to allocate<br />
161<br />
λ2<br />
λ5 , λ6<br />
λ3 ,λ4<br />
λ4
Chapter 7<br />
more channels (i.e. bandwidth) to work office locations during the day, while at night<br />
more are allocated to domestic areas. In its most fundamental form the router is no<br />
more than an optical add-drop multiplexer which can drop (or add) a single channel<br />
per port. Even with such a simple router, however, a complex network as shown in<br />
Figure 7.4 becomes possible. In this network a traditional PON network is used side<br />
by side with a WDM-PON network. Customers 2 through 4 are all connected to the<br />
PON network where data on λ3 is sent downstream and data is returned on λ4.<br />
Customers 1, 5 and 6 on the other hand all use a colorless transceiver and therefore<br />
have 2 wavelengths sent downstream. For customers 1 and 5 the router is using<br />
multicasting to send the same wavelengths to both users that do not require a lot of<br />
bandwidth. For customer 6 the network can be regarded as being no different than a<br />
point to point network with all its benefits.<br />
Head Office<br />
OLT<br />
1<br />
λ1, λ2<br />
λ2<br />
λ1, λ3, λ5<br />
λ2 ,λ4 ,λ6<br />
λ3 λ4<br />
Figure 7.4. A possible complex network topology that is made possible when a<br />
(reconfigurable) OADM is used.<br />
λ6<br />
In Section 7.2 the design and characterization of a reconfigurable 1x4 OADM are<br />
discussed. This OADM has the required functionality to operate as a simple router.<br />
The design and characterization of a more complex 1x4x4 router, capable of sending<br />
up to four channels to a single customer, are discussed in Section 7.3.<br />
162<br />
λ3 λ4<br />
λ4<br />
λ5, λ6<br />
λ3<br />
λ1, λ2<br />
6<br />
λ2<br />
2<br />
λ3<br />
λ4<br />
4<br />
5<br />
3<br />
Traditional PON
Densely integrated devices for WDM-PON<br />
7.2. A reconfigurable Add-Drop Multiplexer based on<br />
microring resonators<br />
An OADM can be implemented using for instance arrayed waveguide gratings or<br />
Mach-Zehnder interferometers (MZI). However, OADMs based on AWGs are<br />
generally large devices since AWGs can only split one channel into multiple channels<br />
or vice versa. An OADM based on AWGs would therefore require additional<br />
components like optical switches. Likewise, a considerable number of MZIs would be<br />
required to drop even a few channels [144]. An OADM based on microring resonators<br />
[145] with radii in the order of tens of µm, however, allows for extremely small–area<br />
devices. Due to the highly selective MR filter characteristic a minimum component<br />
implementation of a 4-channel OADM can already be realized with four microring<br />
resonators while additional switching functionality is easily implemented.<br />
7.2.1 Design and fabrication<br />
The OADM was designed as shown in Fig. 7.5 It consists of a central bus waveguide<br />
(with the ports IIn and IOut) and four add-drop port waveguides that intersect the bus<br />
waveguide at right angles with a single MR placed at each intersection. In addition to<br />
the waveguides that are shown, an alignment waveguide, as discussed in Chapter<br />
3.7.1, was also included to aid in the alignment of fiber arrays.<br />
The cross-grid (Manhattan) [139] arrangement of the bus and add-drop waveguides<br />
allows for a very efficient and simple design, requiring only two bends in the central<br />
bus waveguide. All other waveguides can be implemented using straights.<br />
Figure 7.5. Schematic layout of a 4-channel<br />
OADM.<br />
163<br />
Figure 7.6. Close-up of a realized OADM.<br />
The waveguides and the omega shaped<br />
heaters on top of the four resonators can<br />
be discerned.<br />
A downside to the cross-grid approach, however, is that minor losses and reflections<br />
occur at the intersections between the bus and add-drop waveguides. In addition some<br />
crosstalk between the signals propagating in these waveguides may occur. This can be
Chapter 7<br />
largely solved, however, by placing the bus and add-drop waveguides in different<br />
layers [146] The vertical distance between the add-drop and bus waveguides is 250<br />
µm so that the device can be used in combination with standard fiber-arrays. The size<br />
of the OADM, 1.5 mm by 0.2 mm, is mainly determined by this spacing. All<br />
waveguides are horizontally tapered down to 1.5 µm at the facets. As shown in Figure<br />
7.7 this can reduce the fiber chip-coupling losses from 6.5 to 6.0 dB for a standard<br />
(SMF, Mode Field Diameter 10.2) fiber and from 4.3 to 3.9 dB for a small-core (HI-<br />
1060, MFD 5.6) fiber.<br />
For the resonators in the OADM the standard vertically coupled microring resonator<br />
building block described in Chapter 6 was used, following the design parameters<br />
described in Table 6.1 except for the thickness of the resonator which was set at 190<br />
nm.<br />
Fiber chip coupling loss (dB)<br />
7<br />
6<br />
5<br />
4<br />
3<br />
2<br />
0 1 2 3 4 5 6<br />
Waveguide width (µm)<br />
164<br />
Overlap with SMF<br />
Overlap with smallcore<br />
Figure 7.7. Fiber-chip coupling loss with a standard or a small-core fiber as a function of the<br />
waveguide width for a Si3N4 SiO2 waveguide with a thickness of 140 nm.<br />
The OADM was fabricated using the “Vertical I” fabrication process and<br />
subsequently pigtailed and packaged so that the device could be fully characterized<br />
[147]. Figure 7.6 shows a close-up of a fabricated OADM. The four add/drop and<br />
central waveguides are clearly discernable as well as the omega shaped heater<br />
elements on top of the four micro-ring resonators.<br />
Two photographs of the pigtailed OADM chip are given in Figure 7.8 In these<br />
photographs the fiber arrays, glued to both sides of the chip, can be seen. Also<br />
discernable are the glass rails on top of the chip as well as the bond wires. The chip<br />
measures 10 mm by 9 mm. Although the actual OADM measures only 10 mm by 1.5<br />
mm, the width of 9 mm is required to provide the fiber arrays with enough space to be<br />
glued onto. The chip that is shown therefore actually contains 4 OADMs.
Densely integrated devices for WDM-PON<br />
a)<br />
b)<br />
Figure 7.8. Side a) and top view b) of a pigtailed OADM.<br />
7.2.1 Spectral measurements<br />
The pigtailed OADM was measured using an EDFA ASE broadband source and an<br />
OSA with a resolution of 0.1 nm. For the responses shown in Figure 7.9 the EDFA<br />
ASE was connected to the IIn port of the OADM. The OSA was connected to the IOut<br />
port. In this configuration the OADM acts as a de-multiplexer by dropping the<br />
channels present on IIn to the drop ports IDrop1-IDrop4. These dropped channels are<br />
visible as dips in the IOut port. The two different responses that are shown in the figure<br />
were created by tuning the resonators so that 1) they either all had the same resonance<br />
wavelength, or 2) that the resonance wavelengths of the individual resonators were all<br />
different.<br />
Normalized power (dB)<br />
0<br />
-5<br />
-10<br />
-15<br />
-20<br />
-25<br />
-30<br />
-35<br />
1546 1548 1550 1552 1554 1556<br />
Wavelength (nm)<br />
165<br />
λ−resonances spaced 0.8 nm<br />
All λ−resonances equal<br />
Figure 7.9. OADM through responses measured at IOut for two different OADM configurations,<br />
set by the thermal tuning of the resonance wavelength of the MRs
Chapter 7<br />
To obtain the response that shows four distinct resonance dips, a total heater power of<br />
446 mW was required in order to tune the MR resonance wavelengths to a 100 GHz<br />
ITU Grid (spaced at 0.8 nm). The minima of the individual MR through responses are<br />
≈12dB below the normalized input power level.<br />
For the configuration that shows the single large dip the resonance wavelengths of the<br />
individual MRs were carefully tuned to overlap each other. This increased the power<br />
extracted from the channel to give a minimum of -30 dB relative to the normalized<br />
input power level. This configuration could be set while dissipating only 20 mW due<br />
to the fact that the un-tuned MRs already had nearly overlapping resonance<br />
frequencies. This indicates a good fabrication uniformity of the microring resonators<br />
in the OADM (and potentially across the wafer). The change between the two<br />
configurations could be made in < 1 ms.<br />
For the configuration where the resonators were tuned to different wavelengths the<br />
responses at the drop ports IDrop1-IDrop4 were also measured with the OSA. In Figure<br />
7.10 the normalized drop responses, measured at the four drop ports are shown. The<br />
depth of the individual MR drop responses is ≈12dB. As can be expected some drop<br />
responses also show the (filtered) through responses of the preceding resonators. This<br />
effect is especially pronounced in the drop response measured at the fourth drop port<br />
in which the through port resonances of three other resonators can be discerned.<br />
The responses of the add-ports, shown in Figure 7.11, were measured by connecting<br />
the EDFA ASE to the IAdd1-IAdd4 ports and measuring the wavelength response at the<br />
IOut port using the OSA. As can be seen, the overall behavior of the OADM when<br />
adding or dropping signals is the same. However, a direct comparison between the<br />
individual responses cannot be made because the measured add response of a certain<br />
resonator is quite different from the drop response of that resonator. The response of<br />
the fourth drop port for instance shows three dips because the broadband input signal<br />
first has to pass three other resonators before it can be dropped by the fourth MR.<br />
Conversely, when a signal is added to the fourth add port which is connected to the<br />
same MR no such dips are present because the added signal passes no other<br />
resonators.<br />
By fitting the individual MR drop- and through responses to a MR model (using RFit)<br />
the field coupling constants κ1 and κ2 were determined to be 0.56 ±0.04 and 0.44<br />
±0.04 respectively. For the loss in the resonator a value of 1.5±0.5 dB/cm was found.<br />
Using these parameters the channel crosstalk of the device was calculated to be -11.7<br />
dB. The measured FSR and Finesse were 4.18 nm and 10.3 respectively, giving the<br />
MRs in the OADM a ∆λFWHM of 0.41 nm (=51 GHz).<br />
Normalized power (dB)<br />
0<br />
-5<br />
-10<br />
-15<br />
-20<br />
-25<br />
-30<br />
-35<br />
1546 1548 1550 1552 1554 1556<br />
Wavelength (nm)<br />
Figure 7.10. Measured OADM drop<br />
responses.<br />
Drop 1<br />
Drop 2<br />
Drop 3<br />
Drop 4<br />
166<br />
Normalized power (dB)<br />
0<br />
-5<br />
-10<br />
-15<br />
-20<br />
-25<br />
-30<br />
-35<br />
1546 1548 1550 1552 1554 1556<br />
Wavelength (nm)<br />
Add 1<br />
Add 2<br />
Add 3<br />
Add 4<br />
Figure 7.11. Measured OADM add responses.
7.2.2 Spectral measurements<br />
Densely integrated devices for WDM-PON<br />
In addition to the spectral measurements the operation of the OADM was also<br />
characterized at bitrates of 40 Gbit/s to determine the eye patterns and BER [148]. For<br />
this a measurement setup as shown in Figure 7.12 was used. The setup consists of a<br />
high-speed Pseudo-Random-Bit-Sequence (PRBS) generator that generates to<br />
generate a random data pattern at 40 Gbit/s. This data pattern is then used to drive a<br />
high-speed (Electro-Absorption) modulator which modulated the output of a tunable<br />
CW source. The modulated signal which is amplified using an EDFA, is then fed into<br />
the OADM. The output signals of the OADM are amplified and detected using a highspeed<br />
(U2T) photodetector. The modulated and amplified input signal is also<br />
measured via a high-speed photodetector. From the photodetectors the signals can be<br />
sent to an wide- bandwidth Agilent 86100B oscilloscope to visualize the eye diagrams<br />
or to a Bit-Error-Rate-Tester (BERT) to measure the BER.<br />
Tunable CW<br />
laser<br />
Sampling<br />
oscilloscope<br />
40 Gbit/s<br />
BERT<br />
40 GBit/s<br />
PRBS<br />
RZ<br />
modulator<br />
High Speed<br />
Detectors<br />
clock<br />
Figure 7.12. Measurement setup for the analysis of 40 Gbit/s RZ signals.<br />
To measure the eye pattern of a dropped signal an optical 40 Gbit/s PRBS return-tozero<br />
(RZ) data signal with a bit word sequence of 2 31 -1 was encoded via the<br />
modulators onto the CW laser source which had a wavelength of 1550 nm. If Figure<br />
7.13 the eye diagrams of the amplified signal measured at IDrop1 (bottom) as well as<br />
the input signal (top), which was connected to IIn, are shown. For this measurement<br />
the resonance wavelength of the first resonator was tuned to match the wavelength of<br />
the tunable laser (so the input signal is dropped by the resonator). Although the eye<br />
pattern of the signal at IDrop1 shows an increase in noise, which is caused by the<br />
EDFAs, the eye clean and is open, allowing for error free detection at this bitrate. This<br />
was corroborated by BER measurements that showed error free detection down to 10 -9<br />
with a minor power penalty of 1 dB [149, page 102]. When the resonator was tuned<br />
out of resonance, as shown in Figure 7.14, the eye was almost completely closed. The<br />
difference between the on- and off resonance amplitudes of the eye pattern was 11 dB<br />
which is close to the 12 dB drop response resonance depth that was determined in the<br />
spectral measurements.<br />
167<br />
EDFA<br />
EDFA<br />
OADM
Chapter 7<br />
Figure 7.12. Measured eye patterns of the<br />
input signal (top) and the signal at IDrop1<br />
(bottom). The resonator is tuned “on<br />
resonance”.<br />
168<br />
Figure 7.13. The Measured eye patterns of<br />
the signal at IDrop1 when the resonator is tuned<br />
“off resonance”.<br />
The multicasting feature of the OADM as it was shown in Figure 7.4 (for customers 1<br />
and 5) was tested by tuning the first two resonators in the OADM such that each drops<br />
an equal part of the input signal as is illustrated in Figure 7.14 (the figure is idealized,<br />
typically MR1 is tuned so that it drops 50 % while MR2 is tuned to be on-resonance<br />
to drop the rest of the signal). Figure 7.15 shows the two eye patters that were<br />
measured at IDrop1 and IDrop2 and for this configuration. Although the amplitude of the<br />
measured signals was lower compared to a single dropped signal, as can be expected,<br />
the eye-patterns are still open. This shows that, at a bitrate of 40 Gbit/s, this OADM is<br />
indeed capable of multicasting.<br />
Dropped power (dB)<br />
0<br />
-3<br />
-6<br />
-9<br />
-12<br />
-15<br />
MR1<br />
MR 2<br />
-18<br />
1548 1549 1550<br />
Wavelength (nm)<br />
1551 1552<br />
Figure 7.14. Multicasting principle: Each<br />
resonator is tuned such that only part of the<br />
signal (at λ=1550 nm) is dropped.<br />
Figure 7.15. Multicasting principle: Each<br />
resonator is tuned such that only part of the<br />
signal (at λ=1550 nm) is dropped.
Densely integrated devices for WDM-PON<br />
7.3 Flexible λ-multicasting Router for use in Access networks<br />
The OADM that was described in the previous section can only be used to drop a<br />
single channel to a certain customer. It may, however, be useful to be able to drop<br />
multiple channels to a single customer. For instance, multiple channels may be<br />
combined to offer a higher overall bandwidth to that customer. Also, different<br />
channels could be used for different services. One channel may be used to provide all<br />
customers with the same data, such as digital television, while other channels are used<br />
by one, or only a few customers. In stead of a 1⋅ m demultiplexer such as the OADM a<br />
more general 1 ⋅ n ⋅ m router solution (i.e. a router with a single input and express<br />
output that can drop n channels to m drop ports) is then required which can drop not<br />
one channel but any combination of channels to a single node (e. g. a customer).<br />
Such a router was developed within the context of the Broadband Photonics project<br />
[14]. This router is to become part of the reference network architecture as shown in<br />
Figure 7.16. The architecture consists of up to 4 routers (3 shown) that each connect<br />
up to 256 users to a ring network.<br />
Multi-λ BM Tx<br />
Multi-λ BM Rx<br />
Multi-λ CW Tx<br />
tuning<br />
WDM mux/demux<br />
{ { λλ down, down, i i , , λλ up,j up,j CW CW } }<br />
{ { λλ up,j up,j } }<br />
Multi-casting λ-router<br />
node 4<br />
Multi-casting λ-router<br />
169<br />
node 1<br />
WDM<br />
WDM<br />
BM Rx<br />
BM Tx<br />
refl. mod.<br />
node 2<br />
BM Rx<br />
BM Tx<br />
refl. mod.<br />
Multi-casting λ-router<br />
bidir.<br />
EDFA<br />
ONU<br />
Figure 7.16.The Broadband reference network architecture.<br />
7.3.1 Router implementation using micro-resonators<br />
1<br />
BM Rx<br />
256<br />
WDM<br />
BM Tx<br />
refl. mod.<br />
CWDM<br />
The typical (targeted) characteristics of the reference network are given in Table 7.1.<br />
The parameters of highest importance to the design of the router are the insertion loss,<br />
the multicasting insertion loss, the number of users per node (router) and the number<br />
of frequency pairs.
Chapter 7<br />
Table 7.1: access network key characteristics<br />
Parameter Value<br />
Fiber type Standard Single-mode (e.g. ITU<br />
G.652)<br />
Ring circumference Typical 20 km<br />
Inter-node distance < 20 km<br />
Maximum number of users per headend<br />
1024<br />
Maximum number of users per node 256<br />
Distance node to user < 5 km<br />
Number of frequencies/wavelengths 20 on a 200 GHz grid<br />
Number of frequency pairs 10<br />
Maximum wavelength window 1530 - 1561 nm<br />
λ-Router insertion loss 6 dB<br />
λ-Router multicasting loss (256 ch.) 24 dB<br />
Of the parameters that are of importance to the router the number of nodes is the most<br />
difficult parameter to meet, especially when using conventional optical components.<br />
Figure 7.17, for instance, shows a 1x20x256 router implementation using Arrayed<br />
Waveguide Gratings (AWG) [150] and switch matrices [151]. This implementation<br />
consists of 258 1x20 AWG’s and 20 1x256 switch matrices. Given the relatively large<br />
size of these components it is evident that this implementation is difficult to realize.<br />
Figure 7.17. A 1x20x256 router implementation using conventional components<br />
170
Densely integrated devices for WDM-PON<br />
Figure 7.18. A 1x8x8 router implementation that uses micro-resonators<br />
As an alternative the router can be realized using microring-resonators [139, 152]. An<br />
implementation of a 1x8x8 router that uses micro-resonators is shown in Figure 7.18.<br />
In this router a WDM signal enters the bottom row from the left side. The microringresonators<br />
on this row demultiplex this signal so that a single channel is dropped to<br />
each of the columns in the routing matrix. The micro-resonators located in each of in<br />
these columns can then switch the channel onto one of the outputs (to the ONU’s). If<br />
it is assumed that one micro-resonator “cell” in the matrix measures 250x250 µm then<br />
the full router will measure only 2.0x2.25 mm. In fact, the 1x20x256 router can be<br />
implemented ≈1x2 cm. The micro-resonator based router thus offers a clear advantage<br />
over more conventional implementations.<br />
7.3.2 Router design<br />
Although a 1x20x256 router is practically feasible when micro-resonators are used,<br />
the implementation still requires >2500 micro-resonators. Such a router is therefore<br />
extremely complex to design and fabricate. In addition, if all resonators require<br />
tuning, the power consumption would be prohibitively high if thermal tuning is used<br />
(see Chapter 6). On grounds of feasibility it was therefore decided that, as a first<br />
prototype, a relatively simple 1x4x4 router would be designed and fabricated. With<br />
this router any combination of 4 channels can be sent to 4 output ports. The choice for<br />
a 1x4x4 router had the added advantage part of the router had already been<br />
characterized, in the form of the OADM described in the previous section. As shown<br />
in Figure 7.19 five of these OADMs can be combined to form the 1x4x4 router.<br />
According to the original network specifications [153] that were drawn up for the<br />
Broadband reference network, the router should have been designed for a channel<br />
spacing of 200 GHz (1.6 nm) with up- and downstream channels placed in adjacent<br />
positions as shown in Figure 7.20. However, this scheme proved to highly impractical<br />
when combined with the MR building block that, because it had proven itself in the<br />
OADM, was also seen as the best MR design to use in the router.<br />
171
Chapter 7<br />
a)<br />
b)<br />
Figure 7.19. A 1x4x4 router a) can be implemented using five 4-channel OADMs b).<br />
Because this resonator has a FSR of ≈4 nm the channel spacing scheme would have<br />
limited the number of channels within the FSR of a single resonator to at most 3<br />
channels (i.e. two up and one downstream channel). The maximum number of<br />
channels that can be uniquely addressed using this scheme is therefore limited to<br />
three. A possible solution to this problem is to increase the FSR of the microresonators<br />
but, due to technological constraints, this is only possible through the use<br />
of Vernier-like schemes that utilize multiple micro-resonators and is therefore not<br />
very efficient.<br />
An alternate solution however is found by realizing that the channels are always used<br />
in pairs. For instance, if a user requires more bandwidth then two additional channels<br />
are routed to the user: one upstream and one downstream. It is therefore possible to<br />
use one ring resonator to switch the up- and downstream channels simultaneously<br />
providing that the distance between them is equal to the FSR of the micro-resonator.<br />
A new channel configuration that uses the FSR in such a fashion was therefore<br />
proposed [154]. This new channel configuration, shown in Figure 7.21 has 8 up and<br />
downstream channels placed in pairs at a distance of 500 GHZ (utilizing the 4 nm<br />
FSR of the MR). The spacing between the individual channels is 50 GHZ, leaving 150<br />
GHz for a guard band between up/downstream. The added bonus of the new<br />
configuration is that the number of required ring resonators in the router is effectively<br />
halved compared to the original channel configuration because each resonator is now<br />
used to drop two channels instead of one. Under the new scheme the 1x4x4 router<br />
shown in Figure 7.19 therefore effectively operates as a 1x8x4 router and is therefore<br />
referred to as such in the rest of this discussion.<br />
Power<br />
Upstream<br />
Downstream<br />
1 1 2 2 9 9 10 10<br />
Channel #<br />
Figure 7.20. Original channel configuration with alternating up and downstream channels<br />
spaced at 200 GHz.<br />
172
Power<br />
Densely integrated devices for WDM-PON<br />
Figure 7.21. New channel configuration with 8 alternating up and downstream channels<br />
which have a 50 GHz channel spacing.<br />
The schematic layout and the mask design of the 1x4x4 (1x8x4) router are shown in<br />
Figure 7.22. The router consists of a 4x4 microring-resonator router matrix and a 4<br />
microring-resonator demultiplexer. For the individual resonators in the design the<br />
basic building block described in Chapter 6 was used with a resonator waveguide<br />
thickness of 180 nm. Because the router essentially consists of a large number of<br />
wavelength selective switches the individual resonators in the matrix can be designed<br />
using the same design rules as described in Chapter 6.4.1. Therefore, in order to<br />
achieve a bandwidth of ≈50 GHz, the target for the coupling coefficients in the design<br />
was ≈0.6.<br />
Bond pads<br />
In<br />
Upstream<br />
500 GHz<br />
1 2 3 4 5 6 7 8<br />
Test waveguides<br />
Router matrix<br />
5 mm<br />
Figure 7.22. Schematic layout of the 1x8x4 router (top) and the equivalent mask design<br />
(bottom).<br />
As indicated in the mask design the router matrix is situated in the center of a chip<br />
that measures only 5 x 2 mm. The vertical distance between the resonators in the<br />
173<br />
Guard band<br />
Channel #<br />
Downstream<br />
1 2 3 4 5 6 7 8<br />
2 mm<br />
Out1<br />
Out2<br />
Out3<br />
Out4<br />
Express through<br />
Tapers
Chapter 7<br />
matrix is 300 µm and the horizontal distance is 250 µm. These distances were<br />
required to be able to fit the wiring of all the electrodes. Also, having some distance<br />
between the resonators will reduce the thermal crosstalk between the resonators. Also<br />
indicated in the figure are the horizontal taper sections and the electrode bonding<br />
pads. From the bond pads gold on chromium wires extend to the chromium heaters on<br />
top of the resonators in the router matrix. Because many of the resonators in the<br />
matrix interact with each other it can be difficult to interpret initial measurement<br />
results. Additional test waveguides were therefore incorporated in the design to help<br />
determine the resonance frequencies of the individual micro-resonators in each<br />
column.<br />
7.3.3 Improved OADM design<br />
The router design was to be fabricated in the new “Vertical II” fabrication process that<br />
used stepper lithography for the alignment and exposure of the resonator and port<br />
waveguides. Since not all of the image space on the reticle had been used for the<br />
router design the rest of the available image space was not only filled with several test<br />
structures but also with a new, slightly improved OADM design. This design, of<br />
which a schematic is shown in Figure 7.23, is largely identical to the OADM<br />
discussed in Section 6.2. In the new layout, however, the in- and output ports are<br />
placed on the same side of the OADM (compare, for instance, with fig.7.5).<br />
Therefore, if the OADM is only used as a de-multiplexer in a test-network situation,<br />
only one side requires pigtailing, saving considerable time in the fabrication process.<br />
By the wrapping around of this waveguide as shown in the figure it performs a dual<br />
function: it is both an in- and output as well as an alignment waveguide. A similar<br />
alignment waveguide is also present on the left side of this device. Vertical tapers<br />
were also for the first time implemented in this design.<br />
Align<br />
Add1<br />
Add2<br />
Add3<br />
Add4<br />
Align<br />
Figure 7.23. Re-designed OADM schematic<br />
174<br />
In<br />
Drop1<br />
Drop2<br />
Drop3<br />
Drop4<br />
Out
7.3.4 Characterization<br />
Densely integrated devices for WDM-PON<br />
The OADM and the router were both fabricated in the “Vertical II” fabrication<br />
process. However, due to a currently not yet fully understood interaction of the resist<br />
used for the stepper lithography (which is normally not used within MESA+) with the<br />
gasses used in the RIE etching process the etch rate of the nitride dropped<br />
dramatically. Regrettably this was not detected on time.<br />
As a result most waveguides were only etched to a depth of 70 nm. Therefore, in stead<br />
of having rib waveguides for the resonators only a ridge was etched in stead. This is<br />
clearly visible in Figure 7.24b where a cross-section is shown of coupling region<br />
between two resonators of the second order microring resonator filter in Figure 7.24a.<br />
Also visible in this figure is a thin slab of Si3N4 underneath the resonator waveguides<br />
This is the layer used for creating the port waveguides which normally would have<br />
been etched away completely in this location.<br />
175<br />
Si3N4<br />
b)<br />
Figure 7.24. Top view a) and zoomed in cross-section of the coupling region of two<br />
microring resonators in a second order filter.<br />
The etching down of the resonator waveguides proved to be especially dramatic in the<br />
case of the resonator which should have been etched down 180 nm. Therefore, instead<br />
of a bend loss in the order of ≈10 dB/cm at 1550 nm, measurements performed on<br />
single (test) resonators showed a bend loss in excess of 400 dB/cm, which made these<br />
resonators unusable at this wavelength. At 1310 nm, however, the results were<br />
relatively good due to the significant decrease in bend loss at this shorter wavelength<br />
a)
Chapter 7<br />
From the through and drop responses of single resonators that were fabricated along<br />
side of the OADM and Router devices a bend loss of ≈34 dB/cm was determined for<br />
these devices at this wavelength. In Figure 7.25 the drop responses measured around<br />
1310 nm are shown for a number of resonators for a number of different port<br />
waveguide offsets so (and therefore for different field coupling coefficients). The<br />
resonators have a FSR of 3 nm and a finesse between 5.5 (for so=1.0 µm) and 15 (for<br />
so=2.0 µm). Using DropZone the resonator losses were determined to be 33 ±3<br />
dB/cm.<br />
Normalized drop power (dB)<br />
0<br />
-5<br />
-10<br />
-15<br />
-20<br />
-25<br />
1300 1302 1304 1306 1308 1310 1312 1314<br />
Wavelength (nm)<br />
176<br />
so 1.0<br />
so 1.2<br />
so 1.4<br />
so 1.6<br />
so 1.8<br />
so 2.0<br />
Figure 7.25. Drop responses measured for a number of resonators having different<br />
port waveguide offsets so (in µm).<br />
7.3.4.1 Characterization of the OADM<br />
The realized OADM, of which a picture is shown in Figure 7.26, was measured using<br />
a broadband source and an optical spectrum analyzer with a resolution of 0.05 nm.<br />
Figure 7.27 shows the normalized drop responses measured when the broadband<br />
source was connected the “In” port of the OADM (see Figure 7.23). The resonance<br />
frequency of each resonator has been tuned to a different wavelength to demonstrate<br />
the dropping of four different channels. In the drop responses of the resonators the<br />
individual effects of the adjacent MRs can be observed, for instance in the response at<br />
the fourth drop port. The three dips in the response of this port are the through<br />
responses of the three preceding resonators as has been shown previously in the<br />
measurements of the 1550 nm router. For the drop port responses shown, the filter<br />
rejection ratio of the individual resonators is ≈16.7 dB. From the measurements the<br />
amplitude coupling constants of the individual resonators were determined to be<br />
κ1=κ2=0.40 ±0.01 at resonator losses of 33 ±3 dB/cm. The FSR and Finesse are 3.0<br />
nm and 10.6 respectively, giving a ∆λFWHM of 0.28 nm (=46 GHz @1310 nm). The<br />
channel crosstalk for channels spaced at 100 GHz (0.6 nm @1300 nm) is ≈-12dB. The<br />
on-chip insertion losses of the resonators are ≈5 dB which is due to the relatively high<br />
losses in the resonator. The consecutive drop responses from Drop1 to Drop4 show a<br />
steady decline of the maximum output power of around 0.25 dB per resonator that is<br />
passed.<br />
With the known parameters of κ1=κ2=0.40 ±0.01 and αdB=33 ±3 dB/cm a simulation<br />
of the OADM was created in Aurora. The results from this simulation are given in
Densely integrated devices for WDM-PON<br />
Figure 7.28. As can be seen the measured and simulated responses look very similar,<br />
showing the good quality of the fabricated OADM as well as the usefulness of Aurora<br />
as a simulation tool. In the Aurora simulations The steady decline of dropped power<br />
from Drop1 to Drop4 is also seen. However, here it is about 0.2 dB for each resonator<br />
that is passed. In Aurora these losses are due to the fact that there is some crosstalk<br />
between the channels which lowers the dropped power from one resonator to the next.<br />
In the measured OADM this same effect is occurring but also the losses incurred by<br />
each waveguide crossing (of the center bus waveguide with a port waveguide)<br />
between the resonators need to be taken into account. Since these losses were not<br />
included in the simulated OADM this leads to the conclusion that around 0.05 dB is<br />
lost at each waveguide crossing. It has to be noted, however, that there is significant<br />
uncertainty involved in this number since the simulated and measured OADM are not<br />
exactly identical.<br />
Normalized drop power (dB)<br />
0<br />
-5<br />
-10<br />
-15<br />
-20<br />
-25<br />
1304 1306 1308 1310 1312 1314 1316<br />
Wavelength (nm)<br />
Figure 7.26. Realized OADM. Figure 7.27. Drop Responses of Drop1-Drop4 (see Fig<br />
7.23) for a broadband source connected to the “In”<br />
port.<br />
Dropped power (dBm)<br />
0<br />
-5<br />
-10<br />
-15<br />
-20<br />
-25<br />
177<br />
Drop 1<br />
Drop 2<br />
Drop 3<br />
Drop 4<br />
Drop 1<br />
Drop 2<br />
Drop 3<br />
Drop 4<br />
-30<br />
1294 1296 1298 1300 1302 1304 1306<br />
Wavelength (nm)<br />
Figure 7.28. The drop responses of the OADM simulated using Aurora<br />
A system level measurement at 1.25 Gbit/s was also performed on this OADM by<br />
Patryk Urban of the TUE. For this measurement, a reference measurement was first<br />
performed using the setup as shown in Figure 7.29a in order to find the sensitivity of<br />
the receiver. The extinction ratio of the modulator that was used is 7,7dB at 1305.2
Chapter 7<br />
nm. Next, the setup as shown in Figure 7.29b was used to measure a signal going<br />
through the Drop1 port of the OADM. As can be seen in the BER (PRBS = 2 31 -1 @<br />
1,25Gb/s) measurement results of these two setups shown in Figure 7.30 no<br />
significant power penalty was measured. As can be seen in eye patterns shown in<br />
Figure 7.31 the OADM has no significant effect on the opening of the eye.<br />
PRBS<br />
BERT<br />
PRBS<br />
BERT<br />
PPG<br />
MOD<br />
MOD<br />
SOA<br />
178<br />
Receiver<br />
ATT<br />
Power<br />
Received<br />
Meter Optical Power<br />
Power<br />
Meter<br />
ATT<br />
PPG DRV<br />
SOA<br />
SOA<br />
Power<br />
Received<br />
Meter Optical Power<br />
Input<br />
Optical Power<br />
ATT<br />
a)<br />
OADM<br />
Receiver b)<br />
Figure 7.29. Reference measurement setup a) and the setup with the OADM<br />
inserted b) that was used to measure the BER at 1.25 Gbit/s.<br />
BER<br />
1,00E-04<br />
1,00E-05<br />
1,00E-06<br />
1,00E-07<br />
1,00E-08<br />
1,00E-09<br />
BER = f(ROP)<br />
1,00E-10<br />
-38 -37 -36 -35<br />
ROP [dBm]<br />
-34 -33 -32<br />
Figure 7.30. BER at 1.25 Gbit/s.<br />
Ref . (Rx+MOD)<br />
OADM+SOA
Figure 7.31a. Eye pattern of the reference<br />
setup.<br />
7.3.4.2 Characterization of the Router<br />
Densely integrated devices for WDM-PON<br />
179<br />
Figure 7.31b. Eye pattern of the setup with<br />
the OADM.<br />
The λ-router, shown in Figure 7.32, was also characterized using the broadband<br />
source at the input and the OSA to measure the wavelength response of the first drop<br />
port as indicated in Figure 7.33.<br />
Figure 7.32. Realized 1x4x4 λ-router. Figure 7.33. Router layout<br />
In Figure 7.34a the responses measured at this port are given for three different<br />
“tuning” configurations of the router. In the first configuration the heaters on all<br />
resonators are switched off and all resonators are in resonance at the same<br />
wavelength. The spectral response of this configuration shows a single broad peak,<br />
with a FSR of 3 nm. This peak is predominantly the result of the power dropped by<br />
the first resonator in the de-multiplexer section of the router (M1 in Figure 7.33). The<br />
minor dip in the center of the peak is due to the interaction with the (smaller) power<br />
fractions dropped by subsequent resonators in the de-multiplexer. For the second<br />
configuration the first resonator was tuned half a FSR. The power dropped by this<br />
resonator shows up as the minor peak in the response. The major peak is now the<br />
result of the power dropped by the second resonator in the de-multiplexer and the<br />
interactions with the third and fourth resonators. For the third and final router<br />
configuration resonator M2 was tuned to the same wavelength as M1. This causes the<br />
channel selected by M1 to be dropped by M2 onto the first drop port. The channel is<br />
therefore effectively switched “on” on this port for this configuration as is shown by
Chapter 7<br />
the large peak in the response measured for this configuration. A comparison with the<br />
response of the second configuration shows that the “on” / “off” switch ratio that can<br />
be obtained for this router is ≈15 dB. The ∆λFWHM of the dropped channel is 0.22 nm<br />
(=37 GHz @1310 nm).<br />
Normalized drop power (dB)<br />
0<br />
-5<br />
-10<br />
-15<br />
-20<br />
-25<br />
1306 1308 1310 1312 1314 1316 1318<br />
Wavelength (nm)<br />
Figure 7.34. Switching of a single channel in the router.<br />
180<br />
All Off<br />
MR1 On<br />
MR1 and MR2 On<br />
Following these measurements the router was pigtailed, wirebonded and packaged in<br />
a compact box as shown in Figure 7.35. This box contained all necessary hardware to<br />
drive control the router via USB.<br />
Figure 7.35. The 1300 nm router packaged in a compact box.<br />
After packaging all heaters on the router could be driven on more complex switching<br />
measurements could be performed. Unfortunately, however, some heaters were<br />
damaged in the initial router tests. In addition, the high power output of the broadband<br />
source damaged the glue after prolonged measurements, resulting in a drop in the
Densely integrated devices for WDM-PON<br />
measured power of more than 15 dB. The preliminary measurement results shown in<br />
Figure 7.36 that show the switching of two or three channels to the first drop port of<br />
the router are therefore quite noisy. Nonetheless, these measurements do show the<br />
powerfull capability of the router to select and switch multiple channels to a certain<br />
output channel.<br />
Normalized Drop (dB)<br />
0<br />
-2<br />
-4<br />
-6<br />
-8<br />
-10<br />
-12<br />
-14<br />
-16<br />
3 channels dropped<br />
2 channels dropped<br />
1304 1306 1308 1310 1312 1314 1316<br />
Wavelength (nm)<br />
Figure 7.36. Output spectra measured at the first drop port of the router showing the dropping<br />
of 2 and 3 channels.<br />
181
Chapter 8<br />
Polarization independent devices<br />
One of the greatest concerns in the design of optical devices<br />
that have an application in Telecom is that these devices need<br />
to be polarization independent. This property is especially hard<br />
to achieve in micro-resonator based devices as their design and<br />
fabrication tolerances often don’t allow for a practical solution.<br />
In this chapter an approach based on polarization diversity is<br />
discussed. The strength of the proposed solution lies in the fact<br />
that only a minor increase in the number of components is<br />
required instead of the traditional doubling normally associated<br />
with the diversity scheme. The main ideas presented in this<br />
chapter have been filed at the US patent office.
Chapter 8<br />
8.1 Introduction<br />
In most optical communication networks, fibers are used to connect between the<br />
optical nodes. The polarization state of the transported optical signal in these fibers is<br />
undefined and often changes over time. However, for reliable operation of the<br />
network the behavior of the nodes should not vary with the state of the polarization.<br />
Therefore, polarization-independent performance of the (integrated) optical devices at<br />
the nodes of the network is of major importance.<br />
In devices without microring-resonators that have relatively low birefringence, in the<br />
order of 10 -3 , several techniques have been proposed to reduce the birefringence.<br />
Stress induced birefringence has for instance been reduced by using stress releasing<br />
grooves [155] or stress compensating layers [156, 157]. Other techniques use<br />
carefully designed polarization independent ridge waveguides [158, 159]. Also<br />
birefringence compensating layers of high index materials have been incorporated in<br />
the waveguide geometry [160, 161].<br />
In devices based on high index contrast microring resonators, however, the<br />
birefringence and polarization dependent loss (PDL) can be quite substantial. The<br />
standard resonator building block that was described in Chapter 6, for instance has a<br />
birefringence of ≈0.04 and TM mode propagation losses that are about 3 orders of<br />
magnitude larger the losses for the TE mode. In addition, the coupling strength of the<br />
couplers of a resonator is also highly polarization dependent.<br />
The high birefringence and PDL in these devices are mainly the result of choices<br />
made in the design of the resonator. Merely compensating for stress induced<br />
birefringence is therefore insufficient, as well as the use of compensating layers.<br />
Altering the waveguide of the resonator geometry can, in theory, improve the<br />
birefringence. However, there are a number of problems with this.<br />
Firstly not all materials allow the resonator to be fabricated in the dimensions that are<br />
required for polarization independence. This might for instance be due to material<br />
stress, its refractive index or technological constraints such as lithographical<br />
resolution or maximum etch depth.<br />
Furthermore, even if the materials pose no problem, it may be highly challenging to<br />
find waveguide dimensions for which:<br />
a) the port and resonator waveguides have zero birefringence,<br />
b) the resonator is phase-matched to its port waveguides, and<br />
c) the coupling coefficient of the directional couplers is polarization independent.<br />
The design of polarization independent racetrack resonators is slightly less<br />
complicated in this respect as these devices are intrinsically phase-matched. Proposed<br />
solutions [162-164] for these resonators, however, often result in a substantially<br />
higher resonator radius which is often undesirable.<br />
Even if these two problems can be overcome there is still the issue of fabrication<br />
tolerance. Micro-resonators with a small radius have to be fabricated in high indexcontrast<br />
materials. This, on the basis of mono-modality, implies small waveguides<br />
that are far less tolerant to variations in the fabrication process. It may therefore be<br />
very difficult to fabricate devices in which the microring resonator waveguides and<br />
couplers consistently show polarization independent behavior.<br />
184
8.2 Polarization diversity<br />
185<br />
Polarization independent devices<br />
Instead of designing a resonator in such a way that its behavior is polarization<br />
independent, it is also possible to use a polarization diversity approach [135, 165]. In<br />
a polarization diversity device, such as for instance the polarization diverse<br />
implementation of a single microring resonator shown in Figure 8.1, the TE and TM<br />
polarized signals are separated at the input of the optical device. The polarization of<br />
one signal is then converted (for instance TM to TE) after which both signals are led<br />
through two identical parts of the device. The main advantage of this is that the<br />
resonators need to be optimized for one polarization only, thereby solving many of the<br />
problems related to the design and fabrication of polarization independent devices.<br />
At the output of the device the polarization of one signal is again converted –to avoid<br />
interference between the signals- after which the TE and TM polarized signals are<br />
combined.<br />
Figure 8.1. The polarization diverse implementation of a single resonator filter (right) consists<br />
of two copies of the original non-diverse implementation (left). Each resonator is then used to<br />
filter only one polarization of the light that enters the device.<br />
Although polarization diversity has clear advantages over non-polarization diverse<br />
approaches it also introduces several new problems.<br />
The polarization diverse approach effectively doubles the number of resonators and<br />
requires the use of polarization converters. While the larger number of resonators<br />
might increase the footprint, it is generally not a problem due to the small size of the<br />
resonators. Also, as discussed in Chapter 3.7, factors other than the size and number<br />
of the resonators determine overall device size at high levels of integration. In<br />
addition, polarization diversity requires the use of polarization converters which add<br />
to the complexity of the circuit in both design and fabrication. However, several<br />
converters have been proposed that can be integrated efficiently, using for instance<br />
half-wave plates [166], angled waveguides [167, 168], bends [169], gratings [170,<br />
171] and micro-resonators [136-138].<br />
A problem of greater concern, especially in devices with a large number of resonators,<br />
is controlling the resonance wavelength of each micro-resonator.<br />
Micro-resonators with a predefined resonance wavelength are difficult to fabricate<br />
and therefore nearly always require some form of “tuning” to make them resonate at<br />
the desired wavelength. In addition the “tuning” might also be required to implement<br />
some form of functionality, e.g. switching or modulation. This tuning requires an<br />
electronic driver for each individual micro-resonator and in each resonator a certain
Chapter 8<br />
amount of power will be dissipated. The power requirements and the number of<br />
drivers for a polarization diverse implementation are therefore roughly twice that of<br />
an implementation that uses polarization independent micro-resonators. A larger<br />
number of devices that require tuning will also increase the pin count of the devices<br />
(since each micro-resonator has to be connected to a driver) which can add<br />
significantly to the manufacturing costs. Furthermore the polarization diversity<br />
scheme requires that the resonance frequencies of the micro-resonators that perform<br />
identical functions in the TE and TM polarized light sections of the device are<br />
perfectly matched in order to avoid signal degradation (e.g. due to Polarization Mode<br />
Dispersion or Polarization Dependent Loss). These strict requirements increase the<br />
complexity of the driver electronics and add to the number of device parameters to be<br />
validated during manufacturing, resulting in an overall increase in cost.<br />
8.3 Polarization independence through bi-directional use of<br />
the micro-resonator<br />
The problems associated with the tuning, matching, power consumption and<br />
packaging can severely limit the usefulness of the polarization diversity approach,<br />
especially in large scale integrated optical devices that consist of many components.<br />
Under the right conditions it is possible, however, to implement polarization diversity<br />
in such a way that the required number of resonators is only slightly higher than that<br />
used by non-diverse approaches whilst completely removing the matching problems.<br />
The solution is found in the fact that the micro-resonator (or any four port element<br />
with equivalent functionality) can be used bi-directionally for two signals at the same<br />
wavelength without having these signals interfere with each other. This is illustrated<br />
in Figure 8.2 where two signals, both with wavelength λ1, enter the micro-resonator<br />
from opposite sides. The signal originating from port 1 will propagate through the<br />
micro-resonator in the counter clockwise direction and (when in resonance) will be<br />
dropped to port 3. A signal that originates from port 2, however, will propagate<br />
through the micro-resonator in the clockwise direction and will be dropped onto port<br />
4. As the two signals within the microring-resonator propagate in opposite directions,<br />
there is no interference between these signals, even though they are of the same<br />
wavelength.<br />
Figure 8.2. Bidirectional use of the same micro-resonator by two signals<br />
x and y, each having wavelength λ1. (The through ports of input ports 1 and 2 are ports 2 and<br />
1 respectively but are not shown to keep the figure simple)<br />
Although this concept can be applied to any two signals of equal wavelength that<br />
require the same optical operation it is especially useful for implementing polarization<br />
diversity. This is due to the fact that, by definition, the TE and TM polarized signals<br />
186
187<br />
Polarization independent devices<br />
are of equal wavelength and require exactly the same optical operations under the<br />
polarization diversity approach. Instead of making use of one resonator per filter<br />
function per polarization it is therefore possible to implement polarization diversity<br />
using only one resonator per filter function for both polarizations.<br />
Figure 8.3. Polarization diversity using a single resonator.<br />
Figure 8.3 shows how this new approach can be applied to a single resonator filter. In<br />
this filter an incoming signal is separated into the TE and TM polarization states. The<br />
TM polarized light is converted into TE polarized light (TEy) and then enters the<br />
micro-resonator from the left side. The TE polarized light (TEx) enters the microresonator<br />
from the right side. At the backend of the micro-resonator TEy is converted<br />
back to TM polarized light and combined with TEx.<br />
Figure 8.4. Possible problems when using the bidirectional<br />
approach to polarization diversity: reflections<br />
and up/downstream signal interference.<br />
Figure 8.5. Up- and downstream<br />
propagate in different directions<br />
through the MR<br />
The approach can significantly reduce the total number of resonators in addition to<br />
solving several other problems. However, it is not without its limitations. One<br />
problem, as shown in Figure 8.4, is that light that is not dropped by a resonator will<br />
inevitably propagate back to the input of the device, in effect creating a reflection.<br />
This is even true for light that is dropped because, as was discussed in Chapter 3.2.6, a<br />
minor fraction of the input light of a resonator will always remain in the through port<br />
at resonance. The returned light does not have to be a problem, however, because<br />
many implementations of optical networks already include optical isolators to filter<br />
out unwanted reflections.
Chapter 8<br />
Another problem that may occur is when the device is intentionally used in an up- and<br />
downstream configuration. In a normal resonator, as shown in Figure 8.5, the up- and<br />
downstream signals circulate in opposite directions through the resonator, making<br />
interference between the signals impossible. However, in a polarization diverse<br />
resonator signals from one direction already circulate in two directions. Since the<br />
downstream signal will also circulate in both directions interference may therefore<br />
occur if these signals are coherent.<br />
It also needs to be noted that not all devices are equally suitable for implementation<br />
using the bi-directional diversity approach: some devices can be implemented very<br />
efficiently while the required functionality of other devices makes it impossible.<br />
The regular polarization diverse implementation of a 1xn multiplexer shown in Figure<br />
8.6, for instance, can be implemented very efficiently using the bi-directional<br />
approach as shown in Figure 8.7. This is because in the de-multiplexer the signals<br />
only need to be dropped from a central bus waveguide. It is therefore possible to<br />
create an optical circuit in which the two polarizations (TE and the converted TM) can<br />
enter the resonator from opposing directions by adding the “loops” indicated in the<br />
figure.<br />
Figure. 8.6. A polarization independent 1xn de-multiplexer (left) and the regular polarization<br />
diverse alternative that uses unidirectional micro-resonators (right).<br />
Figure 8.7. Bi-directional polarization diverse implementation of a 1xn wavelength demultiplexer.<br />
188
189<br />
Polarization independent devices<br />
If signals also need to be added to the bus waveguide, however, as is the case for the<br />
1xn optical add-drop multiplexer, the bi-directional use of the resonators is no longer<br />
possible. This is because it is impossible to create the add- and express through ports<br />
without opening the loops that were added in Figure 8.7 to create the bi-directional<br />
propagation through the resonators. The OADM therefore needs to be implemented as<br />
shown in Figure 8.8, using the unidirectional polarization diversity approach.<br />
Figure. 8.8. A polarization independent 1xn Add-Drop multiplexer (left) and the polarization<br />
diverse alternative that uses unidirectional micro-resonators (right).<br />
8.4 Polarization diverse Router<br />
Fortunately the router is one of the components that can benefit significantly from bidirectional<br />
polarization diversity. Figure 8.9 shows the unidirectional polarization<br />
diversity implementation of a 1 ⋅ m ⋅ n router. The router consists of two identical<br />
Figure 8.9. Polarization diverse implementation of an 1 ⋅ m ⋅ n wavelength router that uses<br />
unidirectional micro-resonators.
Chapter 8<br />
halves that are each comprised of a de-multiplexer, which can be implemented using<br />
for instance micro-resonators or an AWG, and a routing matrix as was discussed in<br />
Chapter 7. The de-multiplexer filters out the n individual channels on the input port<br />
and directs these into the routing matrix. In the routing matrix these channels can then<br />
be combined in any required combination and sent to one of the m output ports.<br />
Because the individual channels are only dropped to an output waveguide and no<br />
adding of channels is required as was the case for the OADM, it is possible to<br />
redesign the router for bi-directional use of the resonators, resulting in the<br />
implementation given in Figure 8.10.<br />
Figure 8.10. Polarization diverse implementation of a 1 ⋅ m ⋅ n wavelength router that uses bidirectional<br />
micro-resonators.<br />
This router uses only a few more optical components than a polarization independent<br />
implementation. Assuming that the de-multiplexers are created using resonators the<br />
additional number of components (MR+ pol. splitters/combiners + pol. converters)<br />
will scale as Numcomp = 2 ( 1+<br />
m)<br />
+ n . A 16 by 16 router would therefore have a<br />
component overhead of only ≈18% with respect to a router implemented using<br />
polarization independent resonators.<br />
Figure 8.11. Polarization diverse implementation of a 1 ⋅ m ⋅ n wavelength router that uses bidirectional<br />
micro-resonators.<br />
190
191<br />
Polarization independent devices<br />
While this router implementation guarantees that signals for each polarization are<br />
filtered by the resonators in the matrix in exactly the same way, there is still a timedelay<br />
between the arrivals of the two polarizations at the output of the router. This<br />
polarization mode dispersion (PMD) can be quite high depending on which channel is<br />
dropped and which output port it is dropped to. For instance, it can be assumed that a<br />
router design can be created where the grid spacing between the resonators in the<br />
horizontal and vertical directions is L. If it is then also assumed that the return bends<br />
can be created with length 2L, as shown in Figure 8.11, then the path length difference<br />
between the polarizations is ∆Path = L(<br />
m + 2(<br />
n −1)<br />
+ 1)<br />
for the resonator at position<br />
[n,1]. For L=250 µm and m=n=4 this is a difference of 2750 µm or, assuming an<br />
effective refractive index of 1.5 for the waveguides, a PMD of ≈6.1 ps. For<br />
convenience, the PMD that might be incurred by the polarization splitters and<br />
converters is not taken into account. The high PMD can significantly affect the biterror<br />
rate in high bandwidth applications. It can be compensated for, however, as is<br />
shown in the 1x 3x3<br />
router example given in Figure 8.12. Here the waveguides that<br />
exit the lower de-multiplexer, as well as the return bends, have been given additional<br />
length so that the path lengths from the de-multiplexers to the outputs are identical for<br />
both polarizations.<br />
Figure 8.12. Polarization diverse implementation of a 1x 3x3<br />
wavelength router that uses bidirectional<br />
micro-resonators and has PMD compensation. (The arrow markers indicate equal<br />
grid distances)<br />
Generalizing the example it can be said that, for a router matrix with m outputs, n<br />
channels, a grid-size L and a minimum return bend length of 2L a PMD compensated<br />
matrix can be created when the length of the return bends is set following the rule:<br />
2i<br />
LRe turn _ bend _ i = (i=1..m) (8.1)<br />
and the length of the waveguides at the lower de-multiplexer as:<br />
LDemux _ guide _ j<br />
= m + 2 + 2 j (j=1..n) (8.2)
Chapter 9<br />
Discussion and Conclusions<br />
During the four years in which the work presented in this thesis was carried out the<br />
quality and complexity of the microring resonators steadily progressed from single<br />
resonators showing very bad responses (see for instance Figure 6.18) to multiresonator<br />
devices such as the OADM and router presented in Chapter 7 that show<br />
spectra that nearly look like simulations. In this thesis an attempt was made to not<br />
only show the results obtained from the devices that have been fabricated but to also<br />
give most of the tools and information required to continue the work on even more<br />
complex devices.<br />
Normalized dropped power (dB)<br />
0<br />
-5<br />
-10<br />
-15<br />
-20<br />
-25<br />
-30<br />
1538 1540 1542 1544 1546 1548 1550 1552<br />
Wavelength (nm)<br />
Figure 9.1. Response measured at the drop port of a 1550 nm OADM fabricated in<br />
the Vertical II fabrication process.<br />
Regrettably the problems with the fabrication of the router, although resulting in a few<br />
highly interesting devices in the 1300 nm telecom window, caused such a delay<br />
devices that the intended devices, designed to operate at 1550 nm, were not yet
Chapter 9<br />
available for full characterization and are therefore absent from this thesis. Many of<br />
the technology and design improvements made when moving from the Vertical I to<br />
the Vertical II fabrication process could therefore not yet be verified to work as<br />
intended. A last minute measurement, shown in figure 9.1, made on a drop port of an<br />
OADM from a new batch of 1550 nm devices however, shows the best drop response<br />
ever measured (and this is not a typical best result) in a Si3N4/SiO2 OADM. This<br />
therefore holds great promise for the operation of the complete OADM and Router<br />
devices in the 1550 nm window.<br />
Concerning the work presented in this thesis the following conclusions and<br />
recommendations can be made:<br />
• Silicon nitride is a highly suitable material for the fabrication of microring<br />
resonator based components. Although it does not allow for the fabrication of<br />
resonators as small as is possible in for instance silicon this will often not be a<br />
problem because it is more likely that the size of the devices is limited by<br />
external factors such as the fiber chip coupling with a fiber array than by the<br />
size of the resonators. Also, given the right technology, very low loss<br />
waveguides can be made (
Appendix A. Mason’s rule<br />
Several optical components have been solved using Mason’s rule [172, 173]. Mason’s<br />
rule can be used to find the transfer function of a linear system by representing this<br />
system as a signal-flow graph in which each node is a variable. The transfer function<br />
Hij between two nodes xi and xj is given by:<br />
where:<br />
H<br />
ij<br />
∑<br />
=<br />
k<br />
Pijk<br />
∆<br />
∆<br />
Pijk = the k th path that leads directly from variable xi to xj,<br />
∆ = the determinant of the graph,<br />
∆ijk = the co-factor of the patch Pijk.<br />
195<br />
ijk<br />
(A.1)<br />
The summation is taken over all possible k paths from xi to xj. The co-factor ∆ijk is the<br />
determinant of the system that remains when direct path Pijk is removed. The<br />
determinant ∆ is given by:<br />
∆ 1 2 3<br />
= 1− ∑ L + ∑ L − ∑ L ⋅⋅<br />
⋅<br />
(A.2)<br />
where Ln is the product of n loops in the graph that do not touch. Loops do not touch<br />
when they have no node (variable) in the loop in common. In words (A.2) can be<br />
written out as:<br />
∆=1-(sum of all the individual loop gains)<br />
+(sum of the products of all combinations of two loops that don’t touch)<br />
- (sum of the products of all combinations of three loops that don’t touch)<br />
+ …..etc.
196
Appendix B. Crosstalk Derivation<br />
The adjacent channel crosstalk is the relative power fraction of a signal that is present<br />
on a channel adjacent to the channel on which this signal is transmitted and is defined<br />
as:<br />
⎛ PDrop<br />
( λ = λc<br />
+ ∆λcs<br />
) ⎞<br />
CT = 10log⎜<br />
⎟<br />
⎜<br />
⎟<br />
(B.1)<br />
⎝ PDrop<br />
( λ = λc<br />
) ⎠<br />
where λc is the wavelength of the channel for which the resonator is in full resonance<br />
and ∆λcs is the separation between the channels.<br />
Then with φ1 the roundtrip phase of a resonator in resonance:<br />
( 2π<br />
)<br />
ϕ 1 =<br />
λ<br />
c<br />
2<br />
. R.<br />
Neff<br />
and φ2 the roundtrip phase of the adjacent channel:<br />
2<br />
( 2π<br />
)<br />
ϕ2<br />
= . R.<br />
Neff<br />
λ + ∆λ<br />
Combined with the drop response of the resonator:<br />
P<br />
Drop<br />
c<br />
cs<br />
H<br />
=<br />
1+<br />
F . sin<br />
The expression for the crosstalk then becomes:<br />
C<br />
197<br />
(<br />
2 ϕ<br />
⎛ H ⎞<br />
⎜<br />
2 ⎟<br />
2<br />
⎜ 1+<br />
F<br />
⎟ ⎛<br />
C . sin ( ϕ 2 / 2)<br />
1+<br />
FC<br />
. sin ( ϕ1<br />
/<br />
CT = 10log<br />
= 10log<br />
⎜<br />
⎜<br />
⎟<br />
2<br />
H<br />
⎝1<br />
+ FC<br />
. sin 2<br />
⎜<br />
2 ⎟<br />
⎝ 1+<br />
FC<br />
. sin ( ϕ1<br />
/ 2)<br />
⎠<br />
/<br />
2)<br />
2)<br />
( ϕ / 2)<br />
The phase φ2 is equal to m.2π because λc is the resonance frequency. In addition FC<br />
can be written as:<br />
F C<br />
1<br />
= 2<br />
sin ( π / 2F<br />
)<br />
Combining (B.5) with (B.6) then gives the expression:<br />
⎛<br />
⎞<br />
⎜<br />
⎟<br />
2<br />
⎜<br />
1<br />
⎟ ⎛ sin ( π / 2F<br />
) ⎞<br />
CT = 10log<br />
= 10log<br />
⎜<br />
⎟<br />
⎜<br />
⎟<br />
2<br />
2<br />
1<br />
2<br />
⎝ sin ( π / 2F<br />
) + sin ( ϕ / 2)<br />
⎜1<br />
+<br />
. sin ( ϕ / 2)<br />
2<br />
⎟<br />
⎠<br />
2<br />
2<br />
⎝ sin ( π / 2F<br />
)<br />
⎠<br />
Then, since<br />
⎞<br />
⎟<br />
⎠<br />
(B.2)<br />
(B.3)<br />
(B.4)<br />
(B.5)<br />
(B.6)<br />
(B.7)
= ϕ + ϕ ITU = m. 2π<br />
+ ϕcs<br />
ϕ<br />
(B.8)<br />
2 1<br />
cs<br />
ϕ =<br />
and realizing that φcs can be written in terms of the FSR and the cannel separation ∆λcs<br />
as:<br />
The crosstalk CT can be written as:<br />
CT<br />
=<br />
= ϕ ITU = ( 2.<br />
π / FSR). λ<br />
(B.9)<br />
2 cs<br />
ϕ ∆<br />
⎛<br />
log⎜<br />
⎜<br />
⎝ sin<br />
2<br />
sin ( π / 2F<br />
) ⎞<br />
⎟<br />
( π / 2F<br />
) + sin ( π.<br />
∆λ<br />
/ FSR)<br />
⎟<br />
cs ⎠<br />
10 2<br />
2<br />
Simplifying this equation then leads to:<br />
CT = −<br />
2 ⎛ sin ( π.<br />
∆λ<br />
⎞<br />
cs / FSR)<br />
log⎜<br />
⎟<br />
⎜<br />
1 +<br />
⎟<br />
⎝ sin ( π / 2F<br />
) ⎠<br />
10 2<br />
198<br />
(B.10)<br />
(B.11)
List of Acronyms<br />
ADSL - Asymmetric Digital Subscriber Line<br />
AN - Access Network<br />
ASE - Amplified Spontaneous Emission<br />
AWG - Array Waveguide Gratings<br />
BEP - Bi-directional Eigenmode Propagation<br />
BER - Bit Error Rate<br />
BPM - Beam Propagation Method<br />
BW - Bandwidth<br />
CAGR - Compound Annual Growth Rate<br />
CMT - Coupled Mode Theory<br />
CT - Cross Talk<br />
CW - Continuous wave<br />
DMT - Discrete Multi-Tone<br />
DOS - Digital Optical Switch<br />
DSL - Digital Subscriber Line<br />
DWDM - Dense Wavelength Division Multiplexing<br />
EDFA - Erbium Doped Fiber Amplifier<br />
FEM - Finite Element Method<br />
FDTD - Finite Difference Time Domain<br />
FP - Fabry-Perot Resonator<br />
FSR - Free Spectral Range<br />
FTTB - Fiber To The Building<br />
FTTC - Fiber To The Curb (or Cabinet)<br />
FTTH - Fiber To The Home<br />
FTTS - Fiber To The Squirrel<br />
FWHM - (also ∆λFWHM) Full Width at Half Maximum<br />
HDTV - High Definition Television<br />
HNA - High Numerical Aperture (fiber), also called smallcore fiber<br />
HO - Head Office<br />
IL - Insertion Loss<br />
LPCVD - Low-Pressure Chemical Vapor Deposition<br />
MAN - Metropolitan Area Networks<br />
MEMS - Micro Electro-Mechanical Systems<br />
MFD - Mode Field Diameter<br />
MMI - Multi-Mode Interferometer<br />
MR - Microring Resonator<br />
MRI - Micro-Resonator Investigator tool<br />
MZI - Mach-Zehnder Interferometer<br />
NAIS - Next-generation Active Integrated-optic Subsystems<br />
NRZ - Non Return to Zero<br />
NTT - Nippon Telegraph and Telephone Corporation<br />
OLT - Optical Line Termination<br />
ONU - Optical Network Unit<br />
OSA - Optical Spectrum Analyzer<br />
OXC - Optical (WDM) Cross Connect<br />
PDL - Polarization dependent loss<br />
PMD - Polarization mode dispersion<br />
199
PON - Passive Optical Network<br />
PECVD - Plasma-Enhanced Chemical Vapor Deposition<br />
RIE - Reactive Ion Etching<br />
ROADM - Reconfigurable Optical Add-Drop Multiplexer<br />
SiON - Silicon Oxy-Nitride<br />
SOA - Semiconductor Optical Amplifier<br />
SOI - Silicon on Insulator<br />
TDM - Time Division Multiplexing<br />
TE - Transverse Electric<br />
TEOS - Tetra-Ethyl-Ortho-Silicate (An SiO2-like material)<br />
TFF - Thin Film Filter<br />
TM - Transverse Magnetic<br />
VLSI - Very Large-Scale Integration<br />
VDSL - Very high bit-rate Digital Subscriber Line<br />
WAN - Wide Area Networks<br />
WDM - Wavelength Division Multiplexing<br />
xDSL - ADSL, ADSL2, ADSL2+, VDSL, VDSL2 etc.<br />
200
List of Symbols<br />
Q - Quality Factor [-]<br />
κc - Coupling constant [m -1 ]<br />
κ - Field coupling coefficient (cross) [-]<br />
µ - Field coupling coefficient (bar): µ 2 =1-κ 2 [-]<br />
αdB - Waveguide losses [dB/m]<br />
αr - Resonator roundtrip loss [dB]<br />
χc - Directional coupler loss [-]<br />
χr - Resonator roundtrip loss factor [-]<br />
λ - Wavelength [m]<br />
R - Radius [m]<br />
F - Finesse [-]<br />
FC - Finesse Factor [-]<br />
P - Power [W]<br />
Neff - Effective refractive index [-]<br />
T, t - Time [s]<br />
ng - Group index [-]<br />
201
202
Bibliography<br />
[1] Dan Schiller, “End of the telecom revolution,” Le Monde Diplomatique,<br />
August 2003.<br />
[2] Lawrence Gasman, “Who killed Telecom?,” Cato Institute, Executive<br />
Summary No. 533, February 7, 2005.<br />
[3] Paul Starr, “What Killed the Boom,” The American Prospect Online Edition,<br />
September 10 th 2001.<br />
[4] Eli M. Moam, “The Telecom bust? Get ready for the next one,” Telecom Asia,<br />
October 2003.<br />
[5] Alain Puissochet, “Do we need Fiber to the home?,” Communications &<br />
Strategies, No. 57, 1 st quarter 2005, pp. 187-194<br />
[6] “VDSL Tutorial, Fiber – Copper access for the information highway,”<br />
http://www.dslforum.org/aboutdsl/vdsl_tutorial.html<br />
[7] Aware Inc, “ADSL2 and ADSL2+ the new ADSL standards,”<br />
http://www.dslprime.com/a/adsl21.pdf<br />
[8] “ADSL2 en ADSL2+. Wat moet je ermee?,”<br />
http://www.tekstenuitleg.net/artikelen/adsl2/1<br />
[9] Richard Sekar, “New VDSL2 standard will bring fiber fast Broadband,”<br />
Ikanos Communications, <strong>Jan</strong>uary 2005.<br />
[10] Wikipedia, http://en.wikipedia.org/wiki/Passive_optical_network<br />
[11] Barry Kantner, “The FTTP Battlefield: Active Ethernet vs. PON,” Lightwave<br />
Online, July 6 th , 2004.<br />
[12] Meghan Fuller, “Industry mulls over WDM-PON technology,” Lightwave,<br />
August 1 st , 2006.<br />
[13] A. Driessen, “NAIS: Next-generation Active Integrated-optic Subsystems,”<br />
Project introduction, http://www.mesaplus.utwente.nl/nais.<br />
[14] H. de Waardt, “Dynamically reconfigurable broadband photonic access<br />
networks,”<br />
http://www.freeband.nl/uploadedFiles/Projectflyer%20BBPhotonics%20EN.p<br />
df.<br />
[15] E. A. J. Marcatili, “Bends in optical dielectric waveguides, ” BSTJ, Vol. 48,<br />
pp. 2103-2132, 1969.<br />
[16] K. Jackson, S. Newton, B. Moslehi, M. Tur, C. Cutler, J. Goodman and H.<br />
Shaw, “Optical Fiber Delay-Line Signal Processing,” IEE Trans. Microwave<br />
Theory Techniques, Vol. 33, No. 7, pp. 909-930, 1984.<br />
[17] N. Ngo and L. Binh, “Novel Realisation of Monotonic Butterworth Type<br />
Lowpass, Highpass, and Bandpass Optical Filters Using Phase-Modulated<br />
Fiber-Optic Interferometers and Ring Resonators,” Journal of Lightwave<br />
Technology, Vol. 12, No. 5, pp. 827-841, 1994.<br />
[18] L. Collot, V. Lefe`vre-Seguin, M. Brune, J.-M. Raimond, and<br />
S. Haroche, ‘‘Very high-Q whispering gallery modes resonances observed on<br />
fused silica microsphere,’’ Europhys. Lett., Vol. 23, 327–333, 1993.<br />
[19] M. L. Gorodetsky and V. S. Ilchenko, “Optical microsphere resonators:<br />
optimal coupling to high-Q whispering-gallery modes,” J. Opt. Soc. Am. B,<br />
Vol. 16, No. 1, pp. 147-154, <strong>Jan</strong>uary 1999.<br />
[20] H. C. Tapalian, J.-P. Laine, and P. A. Lane, “Thermooptical Switches Using<br />
Coated Microsphere Resonators,” IEEE Photonics Technology Letters, Vol.<br />
14, No. 8, pp. 1118-1120, August 2002.<br />
203
[21] W. Bogaerts, P. Dumon, D. Taillaert, V. Wiaux, S. Beckx, B. Luyssaert, J.<br />
Van Campenhout, D. Van Thurhout, R. Baets, “SOI nanophotonic waveguide<br />
structures fabricated with deep UV lithography,” Photonics and<br />
Nanostructures: Fundamentals and Applications, Elsevier, 2(2), pp. 81-86,<br />
September 2004.<br />
[22] A. Morand, Y. Zhang, B. Martin, K. P. Huy, D. Amans, P. Benech, J. Verbert<br />
and E. Hadji, “Ultra-compact microdisk resonator filters on SOI substrate,”<br />
Optics Express, Vol. 14, No. 26, pp. 12814-12821, 25 December 2006.<br />
[23] A. Driessen, D. H. Geuzebroek, H. J. W. M. Hoekstra, H. Kelderman, E. J.<br />
<strong>Klein</strong>, D. J. W. Klunder, C. G. H. Roeloffzen, F. S. Tan, E. Krioukov, C. Otto,<br />
H. Gersen, N. F. Van Hulst, L. Kuipers, “Microresonators as building blocks<br />
for VLSI Photonics” in “Microresonators as building blocks for VLSI<br />
Photonics,” F. Michelotti, A. Driessen, M. Bertolotti (Eds.), Proceedings<br />
International School of Quantum Electronics, Melville, New York, USA :<br />
American Institute of Physics (ISBN 0-7354-0184-5), pp. 1-18, 2004.<br />
[24] B. E. Little, “A VLSI Photonics platform,” OFC 2003.<br />
[25] B. E. Little, S. T. Chu, W. Pan, and Y. Kokobun., “Microring resonator arrays<br />
for VLSI photonics,” IEEE Photonic Technology Letters, Vol. 12, No. 3, pp.<br />
323-325, 2000.<br />
[26] B. E. Little, S. T. Chu, “Toward Very Large Scale Integrated Photonics,”<br />
Optics and Photonics News, November 2000.<br />
[27] Robert W. Boyd and John E. Heebner, “Sensitive disk resonator photonic<br />
biosensor,” Applied Optics, Vol. 40, No. 31, pp. 5742-5747, November 2001.<br />
[28] I. M. White, H. Zhu, J. D. Suter, N. M. Hanumegowda, H. Oveys, M. Zourob,<br />
and X. Fan, “Refractometric Sensors for Lab-on-a-Chip Based on Optical<br />
Ring Resonators,” IEEE Sensors Journal, Vol. 7, No. 1, pp.28 -35, <strong>Jan</strong>uary<br />
2007.<br />
[29] P. K. Pattnaik, Bh. Vijayaaditya, T. Srinivas and A. Selvarajan, “Optical<br />
MEMS Pressure and Vibration Sensors Using Integrated Optical Ring<br />
Resonators,” Sensors, 2005 IEEE, 30 Oct-3 Nov 2005, pp.636-639.<br />
[30] A. Yalcin, K. C. Popat, J. C. Aldridge, T. A. Desai, J. Hryniewicz, N.<br />
Chbouki, B. E. Little, O. King, V. Van, S. Chu, D. Gill, M. Anthes-Washburn,<br />
M. S. Ünlü, and B. B. Goldberg, “Optical Sensing of Biomolecules Using<br />
Microring Resonators,” IEEE Journal of selected topics in Quantum<br />
Electronics, Vol. 12, No. 1, pp. 148-155, 2006.<br />
[31] P. Rabiei, W. H. Steier, C. Zhang, and L. R. Dalton, “Polymer Micro-Ring<br />
Filters and Modulators,” Journal of Lightwave Technology, Vol. 20, No. 11,<br />
November 2002.<br />
[32] A. Leinse, M. B. J. Diemeer, A. Rousseau, and A. Driessen, “A Novel High-<br />
Speed Polymeric EO Modulator Based on a Combination of a Microring<br />
Resonator and an MZI,” IEEE Photonics Technology Letters, Vol. 17, No. 10,<br />
pp. 2074-2076, October 2005.<br />
[33] Q. Xu, B. Schmidt, S. Pradhan and M. Lipson, “Micrometre-scale silicon<br />
electro-optic modulator,” Nature, Vol. 435, pp. 325-327, May 2005.<br />
[34] T. Sadagopan, S. J. Choi, S. J. Choi, K. Djordjev and P. D. Dapkus, “Carrier-<br />
Induced Refractive Index Changes in InP-Based Circular Microresonators for<br />
Low-Voltage High-Speed Modulation,” IEEE Photonics Technology Letters,<br />
Vol. 17. No. 2, pp. 414-416, February 2005.<br />
[35] K. Djordjev, Seung-June Choi, Sang-Jun Choi, and P. D. Dapkus, “Vertically<br />
Coupled InP Microdisk Switching Devices With Electroabsorptive Active<br />
204
Regions,” IEEE Photonics Technology Letters, Vol. 14. No. 8, pp. 1115-1117,<br />
August 2002.<br />
[36] R. Grover, K. Amarnath, T. A. Ibrahim, P. Ho, “Nonlinear and active optical<br />
III-V semiconductor micro-resonators,” Optical Fiber Communication<br />
Conference, Technical Digest (ISBN: 1-55752-783-0), Vol.5, pp. 3, March<br />
2005.<br />
[37] J. P. Hohimer, D. C. Craft, G. R. Hadley, G. A. Vawter, and M. E. Warren,<br />
“Single frequency continuous-wave operation of ring resonator diode lasers,”<br />
Applied Physics Letters, Vol. 59, No. 26, pp. 3360-3362, December 1991.<br />
[38] B. Liu, A. Shakouri, and J. E. Bowers, “Wide Tunable Double Ring Resonator<br />
Coupled Lasers,” IEEE Photonics Technology Letters, Vol. 14, No. 5, pp. 600-<br />
602, May 2002.<br />
[39] K. Amarnath, R. Grover, S. Kanakaraju, and P. Ho, “Electrically Pumped<br />
InGaAsP–InP Microring Optical Amplifiers and Lasers With Surface<br />
Passivation,” IEEE Photonics Technology Letters, Vol. 17, No. 11, pp. 2280-<br />
2282, November 2005.<br />
[40] G. Griffel, J. H. Abeles, R. J. Menna, A. M. Braun, J. C. Connolly, and M.<br />
King, “Low-Threshold InGaAsP Ring Lasers Fabricated Using Bi-Level Dry<br />
Etching,” IEEE Photonics Technology Letters, Vol. 12, No. 2, pp. 146-148,<br />
February 2000.<br />
[41] T. F. Krauss, R. M. De La Rue, and P. J. R. Laybourn ,” Impact of Output<br />
Coupler Configuration on Operating Characteristics of Semiconductor Ring<br />
Lasers,” Journal of Lightwave Technology, Vol. 13, No. 7, pp. 1500-1507,<br />
July 1995.<br />
[42] D. G. Rabus, Z. Bian, and A. Shakouri, “A GaInAsP–InP Double-Ring<br />
Resonator Coupled Laser,” IEEE Photonics Technology Letters, Vol. 17, No.<br />
9, pp. 1770-1772, September 2005.<br />
[43] H. Takahashi, R. Inohara, K. Nishimura, and M. Usami, “Expansion of<br />
Bandwidth of Tunable Dispersion Compensator Based on Ring Resonators<br />
Utilizing Negative Group Delay,” Journal of Lightwave Technology, Vol. 24,<br />
No. 6, pp. 2276-2286, June 2006.<br />
[44] G.L. Bona, F. Horst, R. Germann, B.J. Offrein, D. Wiesmann, “Tunable<br />
Dispersion Compensators Realized High-Refractive-Index-Contrast SiON<br />
Technology,” Proceedings ECOC 2002, European Conference on Optical<br />
Communications, Vol. 2, 8-12 September 2002.<br />
[45] C. G. H. Roeloffzen, L. Zhuang, R. G. Heideman, A. Borreman, and W. van<br />
Etten, “Ring resonator-based Tunable Optical Delay Line in LPCVD<br />
Waveguide Technology,” Proceedings Symposium IEEE/LEOS Benelux<br />
Chapter, Mons, pp. 79-82, 2005.<br />
[46] A. Takagi, K. Jinguji and M. Kawachi, “Silica-Based Waveguide-Type<br />
Wavelength-Insensitive Couplers (WINC’s) with Series-Tapered Coupling<br />
Structure,” Journal of Lightwave Technology, Vol. 10. No. 12, pp. 1814-1824,<br />
December 1992.<br />
[47] M. Hammer, “Coupled mode model for 3D directional couplers”, NAIS<br />
internal manuscript, September 2002.<br />
[48] M. Lohmeyer, N. Bahlmann, O. Zhuromskyy, and P. Hertel, “Radiatively<br />
coupled waveguide polarization splitter simulated by wave-matching based<br />
coupled mode theory,” Optical and Quantum Electronics, Vol. 31 pp 877-891,<br />
1999.<br />
205
[49] WMM based coupled mode theory: Adiabatic directional couplers.<br />
http://www.math.utwente.nl/_hammerm/Nais/WmmCmt/.<br />
[50] OlympIOs Integrated Optics Software. C2V, P.O. Box 318, 7500 AH<br />
Enschede, The Netherlands. http://www.c2v.nl/software/.<br />
[51] F. Xia, L. Sekaric and Y. A. Vlasov, “Mode conversion losses in silicon-oninsulator<br />
photonic wire based racetrack resonators,” Optics Express, Vol. 14,<br />
No. 9, pp. 3872-3885, May 2006.<br />
[52] C.K. Madsen and J. H. Zhao, “Optical Filter Design and Analysis: A Signal<br />
Processing Approach,” John Wiley & Sons (ISBN: 0-471-18373-3), May<br />
1999.<br />
[53] B. E. Little, S. T. Chu, P. P. Absil, J. V. Hryniewicz, F. G. Johnson, F.<br />
Seiferth, D. Gill, V. Van, O. King, and M. Trakalo, “Very High-Order<br />
Microring Resonator Filters for WDM Applications,” IEEE Photonics<br />
Technology Letters, Vol. 16, No. 10, pp. 2263-2265, October 2004.<br />
[54] J. V. Hryniewicz, P. P. Absil, B. E. Little, R. A. Wilson, and P.-T. Ho,<br />
“Higher Order Filter Response in Coupled Microring Resonators,” IEEE<br />
Photonics Technology Letters, Vol. 12, N0. 3, pp. 320-322, March 2000.<br />
[55] R. Orta, P. Savi, R. Tascone, and D. Trinchero, “Synthesis of Mu1tiple-Ring-<br />
Resonator Filters for Optical Systems,” IEEE Photonics Technology Letters,<br />
Vol. 7, No. 12, pp. 1447-1449, December 1995.<br />
[56] D. G. Rabus, M. Hamacher, H. Heidrich, “Resonance frequency tuning of a<br />
double ring resonator in GaInAsP/InP:Experiment and simulation,” Japanese<br />
Journal of Applied Physics, Vol. 41, No. 2b, pp. 1186-1189, February 2002.<br />
[57] C. K. Madsen and J. H. Zhao, “A General Planar Waveguide Autoregressive<br />
Optical Filter,” Journal of Lightwave Technology, Vol. 14, No. 3, pp. 437-447,<br />
March 1996.<br />
[58] A. Melloni and Mario Martinelli, “Synthesis of Direct-Coupled-Resonators<br />
Bandpass Filters for WDM Systems,” Journal of Lightwave Technology, Vol.<br />
20, No. 2, pp. 296-303, February 2002.<br />
[59] K. Oda, N. Takato, H. Toba, “A Wide-FSR Waveguide Double-Ring<br />
Resonator for Optical FDM Transmision Systems,” Journal of Lightwave<br />
Technology, Vol.9, No. 6, pp. 728-736, June 1991.<br />
[60] A. Melloni, “Synthesis of a parallel-coupled ring-resonator filter,” Optics<br />
Letters, Vol. 26, No. 12, pp. 917-919, June 2001.<br />
[61] S. T. Chu, B. E. Little, W. Pan, T. Kaneko, and Y. Kokubun, “Second-Order<br />
Filter Response From Parallel Coupled Glass Microring Resonators,” IEEE<br />
Photonics Technology Letters, Vol. 11, No. 11, pp. 1426-1428, November<br />
1999.<br />
[62] R. Grover V. Van, T. A. Ibrahim, P. P. Absil, L. C. Calhoun, F. G. Johnson,<br />
J. V. Hryniewicz, and P.-T. Ho, “Parallel-Cascaded Semiconductor Microring<br />
Resonators for High-Order and Wide-FSR Filters,” Journal of Lightwave<br />
Technology, Vol. 20, No. 5, pp. 900-904, May 2002.<br />
[63] G. Griffel, “Synthesis of optical filters using ring resonator arrays,” IEEE<br />
Photonics Technology Letters, Vol. 12, No. 7, pp. 810-812, July 2000.<br />
[64] G. Griffel, “Vernier effect in asymmetrical ring resonator arrays,” IEEE<br />
Photonics Technology Letters, Vol. 12, No. 12, pp. 1642-1644 December<br />
2000.<br />
[65] C. J. Kaalund and G. Peng, “Pole-Zero Diagram Approach to the Design of<br />
Ring Resonator-Based Filters for Photonic Applications,” Journal of<br />
Lightwave Technology, Vol. 22, No. 6, pp. 1548-1559 June 2004.<br />
206
[66] B. E. Little, S. T. Chu, J. V. Hryniewicz and P. P. Absil, “Filter synthesis for<br />
periodically coupled microring resonators,” Optics Letters, Vol. 25, No. 5, pp.<br />
344-346, March 2000.<br />
[67] S. T. Chu, B. E. Little, V. Van, J. V. Hryniewicz, P. P. Absil, F. G. Johnson,<br />
D. Gill, O. King, F. Seiferth, M. Trakalo and J. Shanton, “Compact full Cband<br />
tunable filters for 50 GHz channel spacing based on high order microring<br />
resonators,” Optical Fiber Communication Conference, 2004. OFC 2004,<br />
23-27 Feb. 2004.<br />
[68] S. T. Chu, B. E. Little, W. Pan, T. Kaneko and Y. Kokubun, “Cascaded<br />
Microring Resonators for Crosstalk Reduction and Spectrum Cleanup in Add–<br />
Drop Filters,” IEEE Photonics Technology Letters, Vol. 11, No. 11, pp. 1423-<br />
1425, November 1999.<br />
[69] Z. Wang, W. Chen and Y. J. Chen, “Unit cell design of crossbar switch matrix<br />
using micro-ring resonators,” ECOC 2004, Page We 3.7.2.<br />
[70] Y. Inoue, M. Katoh and M. Kawachi, ”Polarization Sensitivity of a<br />
SilicaWaveguide Thermooptic Phase Shifter for Planar Lightwave circuits,”<br />
IEEE Photonics Technology Letters, Vol. 4, No. 1, pp. 36-38, <strong>Jan</strong>uary 1992.<br />
[71] D.J.W. Klunder, “Thermo-optical tuning of Mach-Zehnder interferometers,”<br />
Internship report, IBM, Zurich, Switzerland, 1997.<br />
[72] P. Heimala, P. Katila, J. Aarnio and A. Heinämäki, “Thermally tunable<br />
Integrated Optical Ring Resonator with Poly-Si Thermistor,” Journal of<br />
Lightwave Technology, Vol. 14, No. 10, pp. 2260-2267, October 1996.<br />
[73] M. B. J. Diemeer, “Polymeric thermo-optic space switches for optical<br />
communications,” Optics Materials, Vol. 9, pp. 192-200, 1998.<br />
[73] D. H. Geuzebroek, E. J. <strong>Klein</strong>, H. Kelderman, and A. Driessen, “Wavelength<br />
tuning and switching of a thermo-optic resonator,” Proceedings ECIO 2003,<br />
pp. 395-398, 2003.<br />
[74] P. Rabiei and W. H. Steier, “Tunable Polymer Double Micro-Ring Filters,”<br />
IEEE Photonics Technology Letters, Vol. 15, No. 9, pp. 1255-1258,<br />
September 2003.<br />
[75] R. Meijerink, D. H. Geuzebroek, E.J. <strong>Klein</strong>, H. Kelderman, R. Dekker, M. B.<br />
J. Diemeer, A. Driessen, “Optimization of driving signal forthermal<br />
modulation of a microring resonator,” Proceedings 8 th annual symposium<br />
IEEE/LEOS Benelux Chapter, pp. 85-88, 2003.<br />
[76] G. Cocorullo, M. Iodice, I. Rendina and P. M. Sarro, “Silicon Thermooptical<br />
Micromodulator with 700-kHz - 3-dB Bandwidth,” IEEE Photonics<br />
Technology Letters, Vol. 7, No. 4, pp. 363-365, April 1995.<br />
[77] Wikipedia, http://en.wikipedia.org/wiki/Kerr_effect.<br />
[78] A. Schneider, I. Biaggio and P. Günther, “Teraherz-induced lensing and its use<br />
for the detection of teraherz pulses in a birefringent crystal,” Applied Physics<br />
Letters, Vol. 84, No. 13, pp. 2229-2231, March 29, 2004.<br />
[79] M. J. B. Diemeer, “Polymeric Components for Optical Communications,”<br />
PhD Thesis, University of <strong>Twente</strong>, ISBN 90-365-1869-5, 2003.<br />
[80] A. Leinse, M. B. J. Diemeer, A. Rousseau and A. Driessen, “High speed<br />
polymer e-o modulator based on a combination of a microring resonator and<br />
an MZI,” Proceedings European Conference on Integrated Optics, Grenoble,<br />
France, 2005.<br />
[81] I.L. Georma, “Fundamental limitations of optical resonator based high-speed<br />
EO modulators,” IEEE Photonics Technology Letters, Vol 14, No. 6, pp. 795-<br />
797, 2002.<br />
207
[82] A. Leinse, M. B. J. Diemeer, A. Rousseau and A. Driessen, “A novel high<br />
speed polymeric EO modulator based on a combination of a microring<br />
resonator and an MZI,” IEEE Photonics Technology Letters, Vol. 17, No. 10,<br />
pp. 2074-2076, October 2005.<br />
[83] S. Lee, S. M. Garner, V. Chuyanov, H. Zhang, W. H. Steier, F. Wang, L. R.<br />
Dalton, A. H. Udupa and H. R. Fetterman, “Optical Intensity Modulator Based<br />
on a Novel Electrooptic Polymer Incorporating a High µβ Chromophore,”<br />
IEEE Journal of Quantum Electronics, Vol. 36, No. 5, pp. 527-531, May<br />
2000.<br />
[84] R. Dekker, A. Driessen, T. Wahlbrink, C. Moormann, J. Niehusmann and M.<br />
Först, “Ultrafast Kerr-induced all-optical wavelength conversion in silicon<br />
waveguides using 1.55 µm femtosecond pulses,” Optics Express, Vol. 14, No.<br />
18, pp. 8336-8346, 2006.<br />
[85] Wikipedia, http://en.wikipedia.org/wiki/Liquid_crystal<br />
[86] B. Maune, R. Lawson, C. Gunn, A. Scherer and L. Dalton, “Electrically<br />
tunable ring resonators incorporating nematic liquid crystals as cladding<br />
layers,” Applied Physics Letters, Vol. 83, No. 23, pp. 4689-4691, December<br />
2003.<br />
[87] S. Wua, C.-S. Hsu and K.-F. Shyu, “High birefringence and wide nematic<br />
range bis-tolane liquid crystals,” Applied Physics Letters, Vol. 74, No. 3, pp.<br />
344-346, <strong>Jan</strong>uary 1999.<br />
[88] R. A. Soref and B. R. Bennett, “Electrooptical effects in silicon,” IEEE<br />
Journal of Quantum Electronics, Vol. 23, pp. 123–129, 1987.<br />
[89] P. D. Hewitt and G. T. Reed, “Improved Modulation Performance of a Silicon<br />
p-i-n Device by Trench Isolation,” Journal of Lightwave Technology, Vol. 19,<br />
No. 3, pp. 387-390, March 2001.<br />
[90] T. A. Ibrahim, W. Chao, Y. Kim, J. Li, J. Goldhar, P.-T. Ho and C. H. Lee,<br />
“All-optical switching in a laterally coupled microring resonator by carrier<br />
injection,” IEEE Photonics Technology Letters, Vol. 15, No. 1, pp. 36-39,<br />
2003.<br />
[91] V. R. Almeida, C. A. Barrios, R. R. Panepucci and M. Lipson, “All-optical<br />
control of light on a silicon chip,” Nature, Vol. 28, pp. 1081-1084, October<br />
2004.<br />
[92] C. Manolatou, M. Lipson, “All-Optical Silicon Modulators Based on Carrier<br />
Injection by Two-Photon Absorption,” Journal of Lightwave Technology, Vol.<br />
24, No. 3, pp. 1433-1439, March 2006.<br />
[93] F. C. Blom, D. R. van Dijk, H. J. W. M. Hoekstra, A. Driessen and T. J. A.<br />
Popma, “Experimental study of integrated-optics microcavity resonators:<br />
Towards an all-optical switching device,” Applied Physics Letters, Vol. 71,<br />
pp. 747-749, 1997.<br />
[94] J. Niehusmann, M. Först, H. Kurz, R. Dekker, T. Wahlbrink, C. Moormann.<br />
“Sub-picosecond all-optical switching via cross-phase modulation in siliconon-insulator<br />
waveguides,” submitted to IEEE Photonics Technology Letters,<br />
2006.<br />
[95] P. V. Lambeck, “ Integrated optical sensors for the chemical domain,”<br />
Measurement Science & Technology, Vol. 17, No. 8, pp. 93-116, August<br />
2006.<br />
[96] E. Krioukov, D. J. W. Klunder, A. Driessen, J. Greve and C. Otto, “Sensor<br />
based on an integrated optical microcavity,” Optics Letters, Vol. 27, No. 7, pp.<br />
512-514, 2002.<br />
208
[97] H. Haeiwa, T. Naganawa and Y. Kokobun, “Wide range center wavelength<br />
trimming of vertically coupled microring resonator filter by direct UV<br />
radiation to SiN ring core,” IEEE Photonics Technology Letters, Vol. 16, No.<br />
1, pp. 135-137, 2004.<br />
[98] M.-C. M. Lee and M. C. Wu, “MEMS-Actuated Microdisk Resonators With<br />
Variable Power Coupling Ratios,” IEEE Photonics Technology Letters, Vol.<br />
17, No. 5, pp. 1034-1036, May 2005.<br />
[99] K. Djordjev, S. J. Choi and P.D. Dapkus, “Active semiconductor microdisk<br />
devices,” IEEE Journal of Lightwave Technology, Vol. 20, No. 1, pp. 105-<br />
113, 2002.<br />
[100] R. Dekker, D. J. Klunder, A. Borreman, M. B. J. Diemeer, K. Wörhoff, A.<br />
Driessen, F. C. J. M. van Veggel and J. W. Stouwdam, “Stimulated emission<br />
and optical gain in LaF3 : Nd nanoparticle-doped polymer-based waveguides,”<br />
Applied Physics Letters, Vol. 85, No. 25, pp. 6104-6106, 2004.<br />
[101] G. N. Nielson, D. Seneviratne, F. Lopez-Royo, P. T. Rakich, F. Giacometti, H.<br />
L. Tuller and G. Barbastathis, “MEMS based wavelength selective optical<br />
switching for integrated photonic circuits,” Lasers and Electro-Optics, 2004.<br />
(CLEO). Vol. 1, 16-21 May 2004.<br />
[102] D. K. Armani, T. J. Kippenberg, S. M. Spillane and K. J. Vahala, “Ultra-high-<br />
Q toroid microcavity on a chip,” Nature, Vol. 421, pp. 925-928, February<br />
2003.<br />
[103] ITU Grid specification, http://www.bayspec.com/pdf/ITU-DWDM.pdf<br />
[104] Isa Kiyat, Atilla Aydinli and Nadir Dagli, “Low-Power Thermooptical Tuning<br />
of SOI Resonator Switch,” IEEE Photonics Technology Letters, Vol. 18, No.<br />
2, pp. 364-366, <strong>Jan</strong>uary 2006.<br />
[105] D. J. W. Klunder, “Photon Physics in Integrated Optics Microresonators,”<br />
PhD Thesis, University of <strong>Twente</strong>, ISBN 90-365-1802-4, 2002.<br />
[106] Ladouceur and Love, “Silica-based buried channel waveguides and devices,”<br />
Springer, ISBN 978-0412579301, 1995.<br />
[107] B. E. Little, J.-P. Laine and S. T. Chu, “Surface-roughness-induced contradirectional<br />
coupling in ring and disk resonators,” Optics Letters, Vol. 22, No.<br />
1, pp. 4-6, <strong>Jan</strong>uary 1997.<br />
[108] K. R. Hiremath, R. Stoffer, M. Hammer, “Modeling of circular integrated<br />
optical microresonators by 3-D frequency domain coupled mode theory,”<br />
Optics Communications, Vol. 257, No. 2, pp. 277-279, 2006.<br />
[109] R. Stoffer, K. R. Hiremath, M. Hammer, L. Prkna, J. Ctyroky, “Cylindrical<br />
integrated optical microresonators: Modeling by 3-D vectorial coupled mode<br />
theory,” Optics Communications (ISSN 0030-4018), Vol. 256, pp. 46-67,<br />
2005.<br />
[110] AAMP group Homepage, http://www.math.utwente.nl/aamp/<br />
[111] MESA+ Research Institute Homepage, http://www.mesaplus.utwente.nl/<br />
[112] F. Ladouceur and P. Labeye, “A New General Approach to Optical<br />
Waveguide Path Design,” Journal of Lightwave Technology, Vol. 13, No. 3,<br />
pp. 481-492, March 1995.<br />
[113] R. Dekker, “All-Optical Processes in Integrated Optical Devices Using<br />
Materials with Large Third-Order Nonlinearities and Gain,” PhD Thesis,<br />
University of <strong>Twente</strong>, ISBN 90-9021436-4, 2006.<br />
[114] M. M. Spühler, B. J. Offrein, G.-L. Bona, R. Germann, I. Massarek and D.<br />
Erni, “A Very Short Planar Silica Spot-Size Converter Using a Nonperiodic<br />
209
Segmented Waveguide,” Journal of Lightwave Technology, Vol. 16, No. 9,<br />
pp. 1680-1685, September 1998.<br />
[115] B. Luyssaert, P. Vandersteegen, D. Taillaert, P. Dumon, W. Bogaerts, P.<br />
Bienstman, D. van Thourhout, V. Wiaux, S. Beckx and R. Baets, “A Compact<br />
Photonic Horizontal Spot-Size Converter Realized in Silicon-on-Insulator,”<br />
IEEE Photonics Technology Letters, Vol. 17, No. 1, pp. 73-75, <strong>Jan</strong>uary 2005.<br />
[116] Q. Wang, J. He and S. He, “Y-branch spot-size converter for a buried silica<br />
waveguide with large index difference,” Applied Optics, Vol. 43, No. 16, pp.<br />
3315-3318, June 2004.<br />
[117] G. Jeong, D. Kim, J. Choi, D. Lee, M.-Y. Park, J.-B. Kim, H. J. Lee and H.-Y.<br />
Lee, “Low-Loss Compact Arrayed Waveguide Grating with Spot-Size<br />
Converter Fabricated by a Shadow-Mask Etching Technique,” ETRI Journal,<br />
Vol. 27, No. 1, pp. 89-94, February 2005.<br />
[118] A. Leinse, “Polymeric microring resonator based electro-optic modulator,”<br />
PhD Thesis, University of <strong>Twente</strong>, ISBN 90-365-2168-8, 2005.<br />
[119] J. T. Verdeyen, Laser Electronics, third edition, Prentice Hall, New Jersey<br />
1881, ISBN 013706666X.<br />
[120] Microsoft Visual C++, http://msdn2.microsoft.com/en-us/visualc/default.aspx<br />
[121] Rudolf Bayer, “Binary B-Trees for Virtual Memory,” ACM-SIGFIDET<br />
Workshop 1971, San Diego, California, Session 5B, pp. 219-235.<br />
[122] Donald Knuth, “Fundamental Algorithms,” Third Edition. Addison-Wesley,<br />
1997. ISBN 0-201-89683-4. Section 2.3, pp.318–348.<br />
[123] William Pugh, “Skip lists: a probabilistic alternative to balanced trees,”<br />
Communications of the ACM, June 1990, 33(6), pp. 668-676.<br />
[124] OptiSystem Simulation Software,<br />
http://www.optiwave.com/2007/products/optisystem/index.htm<br />
[125] ASPIC Simulation Software,<br />
http://www.phoenixbv.com/product.php?prodid=50010401&prodname=ASPI<br />
C<br />
[126] J. H. Berends, Ph.D. Thesis, “Integrated optical Bragg Reflectors as<br />
Narrowband Wavelength Filters”, University of <strong>Twente</strong>, Enschede 1997.<br />
[127] H. J. W. M. Hoekstra, W. C. L. Hopman, J. Krautz, R. Dekker and R. M. De<br />
Ridder, “A simple coupled mode model for near band-edge phenomena in<br />
grated waveguides,” Optical and Quantum Electronics – Special issue on<br />
optical waveguide modeling, Article in press, 2006.<br />
[128] A. Thelen, “Design of Optical Interference Coatings,” McGraw-Hill, ISBN<br />
0070637865, 1989.<br />
[129] Simulayer, http://www.daglain.com<br />
[130] K.Wörhoff, L. T. H. Hilderink, A. Driessen, P. V. Lambeck, “Silicon<br />
oxinitride – a versatile material for integrated optics applications,” J.<br />
Electrochemical Society, Vol. 149, No 8, pp. 85-91, 2002.<br />
[131] R.G. Heideman, A. Melloni, M. Hoekman, A. Borreman, A. Leinse and F.<br />
Morichetti, “Low loss, high contrast optical waveguides base don CMOS<br />
compatible LPCVD processing: technology and experimental results,”<br />
Proceedings IEEE/LEOS Symposium Benelux Chapter, p.71-74, December.<br />
2005.<br />
[132] Murphy’s Law, http://en.wikipedia.org/wiki/Murphy's_law<br />
[133] ASML Homepage, http://www.asml.nl<br />
[134] PAS 5500/275 Stepper information,<br />
http://www.asml.nl/asmldotcom/show.do?ctx=6677&rid=7787<br />
210
[135] A. Driessen, D. H. Geuzebroek, D. J. W. Klunder, F. S. Tan, “Analysis of a<br />
microring resonator based ultra-compact transceiver for the access network,”<br />
In (Ed), Proceedings IEEE / LEOS, ISBN 90-548727-0, pp. 25-28, Brussel,<br />
Belgie.<br />
[136] B. E. Little, and S. T. Chu, “Theory of Polarization Rotation and Conversion<br />
in Vertically Coupled Microresonators,” IEEE Photonics Technology Letters,<br />
Vol. 12, No. 4, pp. 401-403, April 2000.<br />
[137] F. Morichetti, A. Melloni, and M. Martinelli, “Effects of Polarization Rotation<br />
in Optical Ring-Resonator-Based Devices,” Journal of Lightwave Technology,<br />
Vol. 24, No. 1, pp. 573-585, <strong>Jan</strong>uary 2006.<br />
[138] M.C. Larciprete, E.J. <strong>Klein</strong>, A.Belardini, D.H. Geuzebroek, A.Driessen and<br />
F.Michelotti, "Polarisation conversion in vertically coupled Si 3 N 4 /SiO 2<br />
microring resonators," in Microresonators as building block for VLSI<br />
photonics, M. Bertolotti, A. Driessen, F. Michelotti (Eds.), AIP, NY 2004.<br />
[139] B. E. Little, S. T. Chu, W. Pan, and Y. Kokobun., “Microring resonator arrays<br />
for VLSI photonics,” IEEE Photonic Technology Letters, Vol. 12, No. 3, pp.<br />
323-325, 2000.<br />
[140] M.B. J. “Polymeric thermo-optic space switches for optical communications,”<br />
Optical Materials, Vol. 9, No. 1-4, pp. 329-333, <strong>Jan</strong>uary 1998.<br />
[141] E.J.<strong>Klein</strong>, “Wavelength selective switching using thermally tunable microring<br />
resonators,” MSc. Thesis, University of <strong>Twente</strong>, 2002.<br />
[142] Alice Hong, “Electric field to produce spark in air,”<br />
http://hypertextbook.com/facts/2000/AliceHong.shtml<br />
[143] Chromium properties and articles<br />
http://web.mit.edu/6.777/www/materials/chromium/source1.html<br />
[144] C. G. H. Roeloffzen, F. Horst, B. J. Offrein, R. Germann, G. L. Bona, H. W.<br />
M. Salemink and R. M. de Ridder, “Tunable passband flattened 1-from-16<br />
binary-tree structured add-after-drop multiplexer using SiON waveguide<br />
technology,” IEEE Photonics Technology Letters, Vol. 12, No. 9, pp. 1201-<br />
1203, September 2000.<br />
[145] S. T. Chu, B. E. Little, W. Pan, T. Kaneko, S. Sato, and Y. Kokobun, “An<br />
Eight Channel Add-Drop Filter Using Vertically Coupled Microring<br />
Resonators over a Cross Grid,” IEEE Photonic Technology Letters, Vol. 11.<br />
No. 6, pp. 691-693, June 1999.<br />
[146] Y. Kokubun, Y. Hatakeyama, M. Ogata, S. Suzuki and N. Zaizen,<br />
“Fabrication Technologies for Vertically Coupled Microring Resonator With<br />
Multilevel Crossing Busline and Ultracompact-Ring Radius,” IEEE Journal of<br />
Selected Topics in Quantum Electronics, Vol. 11, No. 1, <strong>Jan</strong>uary/February<br />
2005.<br />
[147] E. J. <strong>Klein</strong>, D. H. Geuzebroek, H. Kelderman, G. Sengo, N. Baker, and A.<br />
Driessen, “Reconfigurable optical add-drop multiplexer using microring<br />
resonators,” IEEE Photonics Technology Letters, Vol. 17, No. 11, pp. 2358-<br />
2360, November 2005.<br />
[148] D.H. Geuzebroek, E. J. <strong>Klein</strong>, H. Kelderman, C. Bornholdt and A. Driessen,<br />
“40 Gbis/s Reconfigurable Optical Add-Drop Multiplexer based on Microring<br />
Resonators,” Proceedings European Conference on Optical Communications<br />
ECOC 2005, Glasgow, UK, Invited.<br />
[149] D. H. Geuzebroek, “Flexible Optical Network Components based on Densely<br />
Integrated Microring Resonators,” PhD Thesis, University of <strong>Twente</strong>, ISBN<br />
90-365-2258-7, 2005.<br />
211
[150] M. K. Smit and C. van Dam, “Phasar based WDM devices: Principles, design<br />
and applications,” IEEE Journal of Selected Topics in Quantum Electronics,<br />
Vol. 2, No. 2, pp. 236-250, 1996.<br />
[151] T. Shibata, M. Okuno , T. Goh, T. Watanabe, M. Yasu, M. Itoh, M. Ishii, Y.<br />
Hibino, A. Sugita and A. Himeno, “Silica-BasedWaveguide-Type 16 16<br />
Optical Switch Module Incorporating Driving Circuits,” IEEE Photonics<br />
Technology Letters, Vol. 15, No. 9, pp. 1300-1302, September 2003.<br />
[152] R. A. Soref and B. E. Little, “Proposed N-Wavelength M-Fiber WDM<br />
Crossconnect Switch Using Active Microring Resonators,” IEEE Photonics<br />
Technology Letters, Vol. 10, No. 8, pp. 1121-1123, August 1998.<br />
[153] “Preliminary specifications of system components and modules,” Broadband<br />
Photonics Deliverable 1.2, April 2005.<br />
[154] T. Koonen, P. Urban, E. Pluk, H. de Waardt, G. van den Hoven, “First design<br />
of reconfigurable access network, first specifications for components and<br />
modules,” Broadband Photonics Deliverable 1.3, December 2005.<br />
[155] M. Kawachi, “Silica waveguides on silicon and their application to integrated<br />
optics,” Optical and Quantum Electronics, Vol. 22, pp. 391-416, 1990.<br />
[156] M.Okuno, A. Sugita, K. Jinguji, and M. Kawachi, “Birefringence Control of<br />
Silica Waveguides on Si and Its Application to a Polarization-Beam<br />
Splitter/Switch,” Journal of Lightwave Technology, Vol. 12, No. 4, pp. 625-<br />
633, April 1994.<br />
[157] H. Takahashi, Y. Hibino, Y. Ohmori, and M. Kawachi, “Polarization-<br />
Insensitive Arrayed-Waveguide Wavelength Multiplexer with Birefringence<br />
Compensating Film,” IEEE Photonics Technology Letters, Vol. 5, No. 6, pp.<br />
707-709, June 1993.<br />
[158] H. Bissessur, F. Gaborit, B. Martin and G. Ripoche, “Polarisation-independent<br />
phased-array demultiplexer on InP with high fabrication tolerance,” Electronic<br />
Letters, Vol. 31, No. 16, pp 1372-1373, August 1995.<br />
[159] M. Hoffmann, P. Kopka, and E. Voges, “Low-Loss Fiber-Matched Low-<br />
Temperature PECVD Waveguides with Small-Core Dimensions for Optical<br />
Communication Systems,” IEEE Photonics Technology Letters, Vol. 9, N0. 9,<br />
pp. 1238-1240, September 1997.<br />
[160] K. Worhoff, B. J. Offrein, P. V. Lambeck, G. L. Bona, and A. Driessen,<br />
“Birefringence Compensation Applying Double-Core Waveguiding<br />
Structures,” IEEE Photonics Technology Letters, Vol. 11, No. 2, pp. 206-208,<br />
February 1999.<br />
[161] H. H. Yaffe, C. H. Henry, R. F. Kazarinov, and M. A. Milbrodt, “Polarization-<br />
Independent Silica-on-Silicon Mach-Zehnder Interferometers,” Journal of<br />
Lightwave Technology, Vol. 12, No 1, pp. 64-67, <strong>Jan</strong>uary 1994.<br />
[162] M. K. Chin, “Polarization dependence in waveguide-coupled microresonators,”<br />
Optics Express, Vol. 11, No. 15, pp. 1724-1730, July 2003.<br />
[163] W. R. Headley, G. T. Reed, S. Howe, A. Liu and M. Paniccia, “Polarizationindependent<br />
optical racetrack resonators using rib waveguides on silicon-oninsulator,”<br />
Applied Physics Letters, Vol. 85, No. 23, pp. 5523-5525, December<br />
2004.<br />
[164] D. Xu, S. <strong>Jan</strong>z, and P. Cheben, “Design of Polarization-Insensitive Ring<br />
Resonators in Silicon-on-Insulator Using MMI Couplers and Cladding Stress<br />
Engineering,” IEEE Photonics Technology Letters, Vol. 18, No. 2, pp. 343-<br />
345, <strong>Jan</strong>uary 2006.<br />
212
[165] T. Barwicz, M. R. Watts, M. A. Popovic, P. T. Rakich, L. Socci, F. X.<br />
Kärtner, E. P. Ippen and H. I. Smith, “Polarization-transparent microphotonic<br />
devices in the strong confinement limit,” Nature Photonics, Vol. 1, No. 1, pp.<br />
57-60, <strong>Jan</strong>uary 2007.<br />
[166] Y. Inoue, Y. Ohmori, M. Kawachi, S . Ando, T. Sawada, and H. Takahashi,<br />
“Polarization Mode Converter With Polyimide Half Waveplate in Silica-Based<br />
Planar Lightwave Circuits,” IEEE Photonics Technology Letters, Vol. 6, No.<br />
5, pp. 626-628, May 1994.<br />
[167] J. J. G. M. van der Tol, F. Hakimzadeh, J. W. Pedersen, D. Li, and H. van<br />
Brug, “A New Short and Low-Loss Passive Polarization Converter on InP,”<br />
IEEE Photonics Technology Letters, Vol. 7, No. 1, pp. 32-34, <strong>Jan</strong>uary 1995.<br />
[168] H. El-Refaei, D. Yevick , and T. Jones , “Slanted-Rib Waveguide InGaAsP–<br />
InP Polarization Converters,” Journal of Lightwave Technology, Vol. 22, No.<br />
5, pp. 1352- 1357, May 2004.<br />
[169] C. van Dam, L. H. Spiekman, F. P. G. M. van Ham, F. H. Groen, J. J. G. M.<br />
van der Tol, I. Moerman, W. W. Pascher, M. Hamacher, H. Heidrich, C. M.<br />
Weinert, and M. K. Smit, “Novel Compact Polarization Converters Based on<br />
Ultra Short Bends,” IEEE Photonics Technology Letters, Vol. 8, No. 10, pp.<br />
1346-1348, October 1996.<br />
[170] D. J. W. Klunder, C. G. H. Roeloffzen and A. Driessen, “A Novel<br />
Polarization-Independent Wavelength-Division-Multiplexing Filter Based on<br />
Cylindrical Microresonators,” IEEE Journal of Selected Topics in Quantum<br />
Electronics, Vol. 8, No. 6, pp. 1294-1299, November/December 2002.<br />
[171] T. Koster and P. V. Lambeck, “Passive Polarization Converter in SiON<br />
Technology,” Journal of Lightwave Technology, Vol. 19, No. 6, pp. 876-883,<br />
June 2001.<br />
[172] M. C. Zhou, C.-H. Wang and X. Zhao, “Automating Mason’s Rule and Its<br />
Application to Analysis of Stochastic Petri Nets,” IEEE Transactions on<br />
Control Systems Technology, Vol. 3, No. 2, pp. 238-244, June 1995.<br />
[173] J. van Amerongen, “Regeltechniek”, Open <strong>Universiteit</strong>, Heerlen, 1990, ISBN<br />
90 358 0705 7.<br />
213
214
Publication List<br />
Patents (pending)<br />
E. J. <strong>Klein</strong>, D. H. Geuzebroek and A. Driessen, “Device comprising a polarizationindependent<br />
micro-resonator,” Patent filed at the United States Patent Office,<br />
December 2006.<br />
G. v/d Hoven, E. Pluk, D. H. Geuzebroek, E. J. <strong>Klein</strong>, R. Dekker, “Werkwijze voor<br />
het bedrijven van een communicatiesysteem en communicatiesysteem geschikt voor<br />
het uitvoeren van een dergelijke werkwijze”, Patent filed at the Dutch Patent Office,<br />
May 2006.<br />
Book Chapter<br />
E. J. <strong>Klein</strong>, A. Driessen, “Densely integrated optical micro-resonator based<br />
components for the access network,” in A. Matsko (Eds.), Title currently unknown, to<br />
be published in 2008.<br />
Peer reviewed journals<br />
E. J. <strong>Klein</strong>, D. H. Geuzebroek, H. Kelderman, G. Sengo, N. Baker and A. Driessen,<br />
“Reconfigurable optical add-drop multiplexer using microring resonators,” IEEE<br />
Photonics Technology Letters, Vol. 17, No. 11, pp. 2358-2360, 2005.<br />
D. H. Geuzebroek, E.J. <strong>Klein</strong>, H. Kelderman, N. Baker and A. Driessen, “Compact<br />
Wavelength-Selective Switch for Gigabit Filtering in Access Networks,” IEEE<br />
Photonics Technology Letters, Vol. 17, No. 2, pp. 336-338, 2005.<br />
A. Driessen, D. H. Geuzebroek, E. J. <strong>Klein</strong>, R. Dekker, R. Stoffer and C. Bornholdt,<br />
“Propagation of short lightpulses in microring resonators: ballistic transport versus<br />
interference in the frequency domain,” Optics Communications, 2006<br />
Oral contributions<br />
E. J. <strong>Klein</strong>, G. Sengo, L. T. H. Hilderink, M. Hoekman, R. Pellens, P. W. L. van Dijk<br />
and A. Driessen, “Densely integrated photonic devices based on microring resonators<br />
for use in access networks,” In (Ed.), Proceedings of the 13 th European Conference on<br />
Integrated Optics (ECIO), Kopenhagen, Denmark, 2007.<br />
E. J. <strong>Klein</strong>, D. H. Geuzebroek, H. Kelderman, G. Sengo, N. Baker, and A. Driessen<br />
“Reconfigurable Optical Add-Drop Multiplexer Using Microring Resonators,” In<br />
Proceedings of the 12 th European Conference on Integrated Optics (ECIO), Grenoble,<br />
France, 2005.<br />
E.J. <strong>Klein</strong>, D. H. Geuzebroek and A. Driessen, “Optical Microring Resonators: One of<br />
the key components for the BBP network testbed”, Invited, Freeband annual meeting,<br />
June 16 th 2005.<br />
215
E. J. <strong>Klein</strong>, D. H. Geuzebroek, H. Kelderman and A. Driessen, “Wavelength selective<br />
switch using thermally tunable resonators,” In (Ed.), Proceedings 2004 Symposium<br />
LEOS Annual Meeting 2003 (pp. MM1), Tucson, Arizona, U.S.A., ISBN issn:1092-<br />
8081.<br />
Conference proceedings<br />
E. J. <strong>Klein</strong>, G. Sengo, L. T. H. Hilderink, M. Hoekman and A. Driessen,<br />
“Reconfigurable λ-Router based on thermally tunable vertically coupled microring<br />
resonators in Si3N4/SiO2,” poster at the ePIXnet Winterschool 2007, 11-16 March,<br />
Pontresina, Switzerland, 2007.<br />
E. J. <strong>Klein</strong>, D. H. Geuzebroek, H. Kelderman, C. Bornholdt and A. Driessen, “40<br />
Gbit/s Optical Add-Drop Multiplexer in Si3N4 based on Microring Resonators,”<br />
Poster at the Mesa+ Meeting 2005, University of <strong>Twente</strong>, Enschede, The Netherlands,<br />
29 September 2005.<br />
E. J. <strong>Klein</strong>, D. H. Geuzebroek, H. Kelderman and A. Driessen, “Integrated Optical<br />
adddrop multiplexer using thermally tunable microring resonators,” In (Ed.),<br />
Proceedings 2004 Symposium LEOS/LEOS Benelux Chapter, University of Ghent,<br />
ISBN: 9076546061.<br />
M. Balakrishnan, E. J. <strong>Klein</strong>, M. Faccini, M. B. J. Diemeer, W. Verboom, A.<br />
Driessen, D. N. Reinhoudt, A. Leinse, “Fabrication of an electro-optic polymer<br />
microring resonator,” In (Ed.), Proceedings of 11th annual symposium of IEEE/LEOS<br />
Benelux, pp. 73-76, 2006, ISBN:90-6144-989-8.<br />
R. Dekker, E. J. <strong>Klein</strong>, J. Niehusmann, M. Först, F. Ondracek, J. Ctyroky, N. Usechak<br />
and A. Driessen, “Self Phase Modulation and Broadband Raman Gain in Silicon-on-<br />
Insulator Waveguides,” poster at the ePIXnet Winterschool 2006, 13-17 March,<br />
Pontresina, Switzerland, 2006.<br />
R. Dekker, E. J. <strong>Klein</strong>, J. Niehusmann, M. Forst, F. Ondracek, J. Ctyroky, N.<br />
Usechak and A. Driessen, “Self phase modulation and stimulated raman scattering<br />
due to high power femtosecond pulse propagation in silicon-on-insulator<br />
waveguides”, Poster in Proceedings of the Symposium IEEE LEOS Benelux, Mons,<br />
Belgium, 1-2 December 2005, Pp. 197-200, Editors: P. Mégret, M. Wuilpart, S. Bette,<br />
N. Staquet, ISBN: 2-9600226-4-5.<br />
R. Dekker, M. B. J. Diemeer, E. J. <strong>Klein</strong>, L. T. H. Hilderink, K. Wörhoff and A.<br />
Driessen, “Photo-Patternable Polymer Waveguides for microring Resonators,”<br />
Proceedings of the 31 st European Conference on Optical Communications (ECOC),<br />
Glasgow, Scotland, 25-29 September 2005, Vol. 2, Paper Tu 1.6.7, pp. 187-188,<br />
ISBN 0-86341-544-X.<br />
R. Dekker, E. J. <strong>Klein</strong>, A. Driessen, J. Niehusman, M. Forst, F. Ondracek and J.<br />
Ctyroky, “Femtosecond pulse propagation through nanophotonic structures,” Poster<br />
at the Mesa+ Meeting 2005, University of <strong>Twente</strong>, Enschede, the Netherlands, 29<br />
September 2005.<br />
216
R. Dekker, L.T.H.Hilderink, M.B.J. Diemeer, E.J. <strong>Klein</strong>, K. Wörhoff and A. Driessen,<br />
“Rare-earth-doped nanoparticles dispersed in photo-definable polymers for use in<br />
microring resonator devices,” LEOS Benelux Workshop, Eindhoven, May 20 th 2005.<br />
A. Driessen, D. H. Geuzebroek, H. J. W. M. Hoekstra, H. Kelderman, E. J. <strong>Klein</strong>, D.<br />
J. W. Klunder, C. G. H. Roeloffzen, F. S. Tan, E. Krioukov, C. Otto, H. Gersen, N. F.<br />
van Hulst and L. Kuipers, “Microresonators as building blocks for VLSI photonics,”<br />
In F. Michelotti, A. Driessen, M. Bertolotti (Eds.), Proceedings 39 th Course of the<br />
International School of Quantum Electronics “Microresonators as building blocks for<br />
VLSI photonics,” pp. 413-414, Melville, New York, USA: American Institute of<br />
Physics, 2004.<br />
A. Driessen and E.J. <strong>Klein</strong>, “Optical microring resonators as promising building<br />
blocks for VLSI photonics”, Invited talk, 3rd International Symposium on VLSI<br />
Photonics, 2006, Opera-Inha University, Inha, South Korea.<br />
A. Driessen and E.J. <strong>Klein</strong>, “Photonic integration technology of silicon oxynitride<br />
based microring devices”, Invited talk, WAPITI/PICMOS workshop, 7-12-2006,<br />
Halle, Germany.<br />
A. Driessen, D.H. Geuzebroek and E.J. <strong>Klein</strong>, “Optical network components based on<br />
microring resonators,” Invited talk, In (Ed.), Proceedings ICTON 2006, Nottingham,<br />
2006, IEEE Catalog Number: 06EX1326, ISBN: 1-4244-0236-0, Library of Congress:<br />
2006921097.<br />
A. Driessen, D.H. Geuzebroek and E.J. <strong>Klein</strong>, “High index contrast photonics<br />
components for optical data communication,” Invited talk, OFC 2006, Anaheim (Ca),<br />
paper OThE3. 9-3-2006.<br />
A. Driessen, R. Dekker, M. B. J. Diemeer, D. H. Geuzebroek, H. J. W. M. Hoekstra,<br />
E. J. <strong>Klein</strong>, A. Leinse, “Microresonators as promising building blocks for VLSI<br />
photonics,” Invited paper, Proceedings of SPIE, Conference on Integrated Optics:<br />
Theory and Applications, Warsaw, Poland, 31 August – 2 September 2005, Vol.<br />
5956, Pp. 59560Q-1 – 59560Q-14, ISBN number: 0-8194-5963-1, ISSN: 0277-786X,<br />
Editors: P.V. Lambeck, C. Gorecki. Organized by SPIE Poland Chapter, SPIE Europe<br />
and Warsaw University of Technology, Poland.<br />
D. H. Geuzebroek, R. Dekker, E. J. <strong>Klein</strong>, C. Bornholdt, J. Niehusmann and A.<br />
Driessen, “Behavior of picosecond and femtosecond pulses in SiO2/Si3N4 microring<br />
resonator filters,” In (Ed.), Proceedings of the Symposium IEEE LEOS Benelux,<br />
Mons, Belgium, 1-2 December 2005, Pp. 51-54, Editors: P. Mégret, M. Wuilpart, S.<br />
Bette, N. Staquet, ISBN: 2-9600226-4-5.<br />
D. H. Geuzebroek, E. J. <strong>Klein</strong>, H. Kelderman, C. Bornholdt and A. Driessen, “40<br />
Gbit/s Reconfigurable Add-Drop Multiplexer base don Microring Resonators,” In<br />
(Ed.), Proceedings of the 31 st European Conference on Optical Communications<br />
(ECOC), Glasgow, Scotland, 25-29 September 2005, Vol. 4, Invited Paper Tu 3.6.1,<br />
pp. 983-986, ISBN 0-86341-544-X.<br />
217
D. H. Geuzebroek, E. J. <strong>Klein</strong>, H. Kelderman and A. Driessen, “Wavelength selective<br />
switch using thermally tunable microring resonators,” In F. Michelotti, A. Driessen,<br />
M. Bertolotti (Eds.), Proceedings 39 th Course of the International School of Quantum<br />
Electronics “Microresonators as building blocks for VLSI photonics,” pp. 413-414,<br />
Melville, New York, USA: American Institute of Physics, 2004.<br />
D. H. Geuzebroek, E.J. <strong>Klein</strong>, H. Kelderman and A. Driessen, “Compact wavelength<br />
selective switch,” In (Ed.) Proceedings of the 30 st European Conference on Optical<br />
Communications (ECOC), Stockholm, Sweden, 2004, pp. 580-581, ISBN 91-<br />
975291-3-3.<br />
D. H. Geuzebroek, E. J. <strong>Klein</strong>, H. Kelderman and A. Driessen, “Wavelength tuning<br />
and switching of a thermo-optic micro ring resonator,” In J. Ctyroky, M. Hubalek, F.<br />
Ondrcek (Eds.), In (Ed.) Proceedings of the 11 th European Conference on Integrated<br />
Optics (ECIO) 2003, pp. 395-398, Prague, Czech Republic: Czech Technical<br />
University Prague, ISBN 80-01-02729-5.<br />
D. H. Geuzebroek, E. J. <strong>Klein</strong>, H. Kelderman, F. S. Tan, D. J. W. Klunder and A.<br />
Driessen, “Thermal tunable, Wide FSR switch based on Microring Resonators,” In<br />
(Ed.), T. D. Visser, D. Lenstra, H. F. Schouten (Eds.), Proceedings of IEEE/LEOS<br />
2002, pp. 155-158, Amsterdam: IEEE/LEOS Benelux Chapter, c/o Vrije <strong>Universiteit</strong><br />
van Amsterdam, ISBN 90-807519-1-x.<br />
D. H. Geuzebroek, E. J. <strong>Klein</strong>, H. Kelderman, F. S. Tan, D. J. W. Klunder and A.<br />
Driessen, “Thermal wavelength-selective switch based on micro-ring resonators,” In<br />
(Ed.), Proceedings of the 28 st European Conference on Optical Communications<br />
(ECOC), Copenhagen, Denmark, 2002.<br />
R. G. Heideman, D. H. Geuzebroek, A. Leinse, A. Melloni, F. Morichetti, C. G. H.<br />
Roeloffzen, A. Meijerink, L. Zhuang, E. van Etten, E. J. <strong>Klein</strong> and A. Driessen, “Low<br />
loss, high contrast optical waveguides based on CMOS compatible LPCVD<br />
processing,” Invited, In (Ed.), Proceedings of the 13 th European Conference on<br />
Integrated Optics (ECIO), Kopenhagen, Denmark, 2007.<br />
M. C. Larciprete, E. J. <strong>Klein</strong>, A. Belardini, D. H. Geuzebroek, A. Driessen and F.<br />
Michelotti, “Polarization conversion in vertically coupled Si3N4/SiO2 microring<br />
resonators,” In (Ed.), F. Michelotti, A. Driessen, M. Bertolotti (Eds.), Proceedings<br />
39 th Course of the International School of Quantum Electronics “Microresonators as<br />
building blocks for VLSI photonics,” pp. 413-414, Melville, New York, USA:<br />
American Institute of Physics, 2004.<br />
R. Meijerink, D. H. Geuzebroek, E. J. <strong>Klein</strong>, H. Kelderman, R. Dekker, M. B. J.<br />
Diemeer and A. Driessen, “Optimization of driving signal fort hermal modulation of a<br />
microring resonator,” In R. M. de Ridder, G. Altena, D. H. Geuzebroek, R. Dekker<br />
(Eds.), In (Ed.) Proceedings 8th Annual Symposium IEEE/LEOS Benelux Chapter, pp<br />
85-88, 2003, Enschede: IEEE LEOS Benelux, p/a <strong>Universiteit</strong> <strong>Twente</strong>, Integrated<br />
Optical Microsystems, ISBN 90-365-1990-X.<br />
P. J. Urban, E. G. C. Pluk, E. J. <strong>Klein</strong>, A. M. J. Koonen, G. D. Khoe and H de Waardt,<br />
“Simulation Results of Dynamically Reconfigurable Broadband Photonic Access<br />
218
Networks (BB Photonics),” International Conference on Access Technologies,<br />
Cambridge, 2006.<br />
219
220
Dankwoord/Acknowledgements<br />
Zo, dit is het dan. Na vele honderden uren typen, vele tientallen flessen cola (tsja, als<br />
je geen koffie drinkt…) en ongeveer 400.000 letters getyped te hebben, zit het erop.<br />
Althans…<br />
Waarschijnlijk had ik me een heleboel typewerk kunnen besparen aangezien de kans<br />
statistisch gezien vrijwel nul is dat iemand de pagina’s hiervoor ook echt doorleest.<br />
Aangezien ik natuurlijk graag wil dat iedereen weet ik gedaan heb, druk ik hier alsnog<br />
een korte samenvatting af van al het voorgaande zodat jullie het wel moeten lezen:<br />
Microring resonatoren blah blah blah…<br />
Dat dekt de lading wel voor ongeveer 99% dacht ik zo.<br />
Natuurlijk was dit boekje nooit mogelijk geweest zonder de fijne samenwerking met<br />
een groot aantal mensen die ik bij deze wil bedanken.<br />
Allereerst wil ik mijn promotor Alfred Driessen bedanken voor zijn steun en adviezen<br />
(Een piramide heeft een punt <strong>Edwin</strong>…). Dit geldt vooral ook voor de laatste maanden<br />
waarin een externe rem af en toe echt nodig was.<br />
Furthermore I would like to thank the members of my committee: Markus Pollnau,<br />
Wim van Etten, Roel Baets, René Heideman, Huug de Waardt, Andrea Melloni and<br />
Ton Mouthaan who have taken the time to read through a considerable number of<br />
pages. In addition I would like to thank Wim van Etten for his additional comments<br />
and Andrea Melloni for traveling all the way from Milano to Enschede.<br />
En dan, tsja, het liefst zou ik jullie helemaal niet willen noemen, gewoon om jullie te<br />
jennen maar ik kon het echt niet over mijn moordkuil verkrijgen dus: Dekkie en Hop,<br />
lieve nimfjes, bedankt! Ik heb met jullie een geweldige tijd gehad, zowel vanwege de<br />
discussies op hoog niveau alsook vanwege onze bijzonder creatieve beeldvormende<br />
taal momenten (en laten we het daar maar gewoon op houden). Andere mensen waar<br />
ik ook liever niet mee geassocieerd wil worden zijn Douwe (ex-meester) Geuzebroek,<br />
Arne (kipje) Leinse en CMP-Guru en Meester der verlichting Marcel Hoekman.<br />
Natuurlijk kan in mijn dankwoord ook onmogelijk Anton Hollink onbreken voor alle<br />
support (voor wat dan ook) door de jaren heen. Onder het kopje “voor vanalles en nog<br />
wat” horen zeker ook Mart Diemeer en Rita ter Weele thuis. Tevens wil ik Lucie<br />
Hilderink, Henry Kelderman en de best geklede man in de cleanroom, Gabriel Sengo,<br />
bedanken voor de meer dan 200.000 (ja echt) ring resonatoren die ze in totaal in de<br />
afgelopen jaren voor mij gefabriceerd hebben. Ook moet ik hier Meindert Dijktra<br />
bedanken voor al zijn fabricage advies. Ik wil in dit rijtje zeker ook de ASML-boys<br />
Rudy Pellens en Paul van Dijk bedanken voor hun bijzondere inzet bij de fabricage<br />
van de Router. Dit geldt tevens voor een paar bijzonder getalenteerde wirebonders bij<br />
LioniX, Arjan Hoekman en Robert Wijn. En als we dan toch in de LioniX hoek zitten<br />
wil ik ook gelijk even Hans v/d Vlekkert en Albert Borreman bedanken.<br />
I would also like to thank Patryk Urban for performing BER measurements on the<br />
OADM.<br />
221
One of the great things of the NAIS project was that I could travel to some very nice<br />
cities in Europe. Even better, however, was the fact that I got to meet a few great<br />
people who made my already highly enjoyable journeys even better. Maria Christina,<br />
Christan and Francesco, thank you so much for that!<br />
Verder wil ik natuurlijk ook alle andere (ex)IOMS-ers bedanken voor hun hulp of<br />
gewoonweg de “good company”: René de Ridder, Henk van Wolferen, Geert Altena,<br />
Els Kok, Wouter Engbers, Paul Lambeck, Hugo Hoekstra, Dimitri Geskus and<br />
Jonathan Bradley (whatever happens in the F1…), Muralidharan Balakrishnan,<br />
Freddy Tan, Henry Uranus, Boudewijn Docter, Kerstin Wörhoff, Gamar Hussein,<br />
Cazimir Bostan, Wenbin Hu, Dion Klunder, Sami Musa, Chris Roeloffzen, Lasse<br />
Kauppinen, Chaitanya Dongre, Didit Yudistira, Tristan Doornebosch, Feridun Ay,<br />
Frank van Soest, Jing Yang, Remco Stoffer en Joris van Lith. Wat betreft de niet<br />
IOMS-ers gaat mijn dank ook zeker nog uit naar Mark Smithers, Peter Linders en<br />
Eddy Ruiter. (Mocht je jezelf hier niet tussen vinden dan kun je bij mij langskomen<br />
voor een biertje).<br />
And, specifically for you Dorleta: I still think you should do a PhD ;-)<br />
Mijn ouders, <strong>Jan</strong> en Trijnie, wil ik bedanken voor hun onvoorwaardelijke steun voor<br />
meer dingen dan ik onder woorden kan brengen en natuurlijk ook Baudyn, gewoon<br />
omdat ze mijn zusje is…<br />
Ten slotte wil ik Floor bedanken. Hoewel ik mijn thesis alleen geschreven heb, was<br />
het (helaas) toch een gezamelijk onderneming. Gelukkig kon ik bij jou altijd even<br />
ontstressen zodat ik het weer even vol kon houden. Dank je wel liefje…<br />
<strong>Edwin</strong><br />
222
223